Article

Understanding the Mellowing Effect of Bottle Aging on the Sensory Perceptions of Varietal Dry White Wines

LEAF, Linking Landscape, Environment, Agriculture and Food Research Center, Associate Laboratory TERRA, Instituto Superior de Agronomia, Universidade de Lisboa, Tapada da Ajuda, 1349-017 Lisboa, Portugal
*
Author to whom correspondence should be addressed.
Beverages 2024, 10(3), 78; https://doi.org/10.3390/beverages10030078
Submission received: 24 July 2024 / Revised: 9 August 2024 / Accepted: 20 August 2024 / Published: 26 August 2024

Abstract

:
The aging ability of dry white wines has been increasingly recognized. The present work aimed to identify which sensory features drive their quality assessment by experienced tasters. Individuals assessed several sensory attributes, using dark tasting glasses. Wines originated from the grape varieties Alvarinho, Arinto, Sauvignon Blanc and Pinot Bianco with a wide range of ages. Basic physical–chemical analysis, browning (Abs 420 nm), elemental composition and a partial volatile fraction were also determined. The overall quality scores were a function of complexity and balance and were negatively influenced by the perception of faultiness. The aging process could be associated with a continuous sensory space characterized by a declining perception of freshness and an intensification in the mellowed flavors. Despite their age, wines were characterized by an austere perception caused by their acidity, saltiness, bitterness, smoothness and dryness. Nevertheless, quality scores were similar from the youngest to the oldest tasted wines (17 years old). The exception was a Sauvignon Blanc wine from a recent vintage that was judged as faulty due to the perception of earthiness. Overall, the tasted wines displayed an unexpected aging ability as demonstrated by the difference between the predicted and real wine ages. To improve the recognition of old wines, the metaphor “mellowed by age” is proposed to describe flavors resulting from beneficial aging instead of “oxidized by age”.

1. Introduction

Aging is not a common technique regarding dry white wines. However, recent changes in the trend of wine appreciation have witnessed a renewed interest in aged dry white wines [1]. During aging, wine undertakes noticeable modifications in chemical composition and sensory characteristics [2]. Wine is expected to improve during this process but is also often connected with undesirable changes in its sensory characteristics [3]. Concerning dry white wines, it appears that a peak in quality may be reached after 2 to 7 years, depending primarily on the grape variety and on the initial chemical characteristics [3,4].
Physical–chemical changes comprise volatile and non-volatile molecules such as acids, alcohols, aldehydes, esters, terpenes, thiols, phenols, lactones and tannins [5]. The different variations in the types and concentrations of these molecules determine the quality of the aging process [6], where oxygen reactivity plays a major role [2]. In particular, acetaldehyde is regarded as the primary indicator of unwanted oxidation, although it may be characteristic of Sherry-style wines [6]. Moreover, polyphenols, iron, copper and sulfur dioxide influence the initial phases of non-enzymatic wine oxidation [7]. In white wines, aging is also characterized by increased color browning as indicated by absorbance at 420 nm [8]. Oxidative off-flavors are claimed to appear before the onset of the browning effect [9,10].
The sensory changes during aging are mostly described by a loss of fruitiness and the development of off-flavors like acacia blossom or naphthalene [3] and toasted, oak, honey or farm feed [11,12]. Excessive levels of acetaldehyde impart aromas of green apple and nuts [6]. The onset of oxidative aroma degradation may also begin with the perception of cooked vegetable nuances [9], at which point it is acceptable to lemmatize and group these sensory descriptors in a category described as evolution/old/oxidation [6]. The factors underlying these changes have been studied mainly using accelerated aging to understand the roles of oxygen, chemical composition, closure type, light exposure and temperature on the process [2,5,13]. The purpose of these works has been mostly directed at understanding spoilage by oxidation [8] and not at providing evidence of the high quality of aged wines, probably fostered by the high proportion (48%) of oxidation-related problems in several contexts [14]. Moreover, reports on the effect of commercial bottle maturation, or “élevage”, are usually limited to relatively short periods [15,16], which is understandable due to sample availability. Albeit unintentionally, the abundance of research on faulty aging might have contributed to the common belief that dry white wines do not age properly. Therefore, the study of high-quality whites with uncommon long aging periods would be interesting to contradict widespread prejudices and provide scientific support to the present rediscovery of this style [17]. Indeed, a recent report demonstrated the recognition, by experienced tasters, of the sensory space and fine wine quality of samples up to 47 years old from different varieties, regions and styles [1]. However, the study did not test wines of the same origin and diverse ages under an approach that is popularly known as “vertical tasting” [18]. Therefore, the main purpose of this work was to characterize dry white wines of diverse ages regarding their sensory features and selected physical–chemical parameters. To achieve this purpose, commercial dry white wines with a wide range of bottle aging durations were selected among regions and varieties expected to have proper “élevage” characteristics.

2. Materials and Methods

2.1. Wine Samples

Different companies generously provided commercial wines (0.75 L bottles) covering a range of available vintages (Table 1). The older vintages, no longer available on the market, were stored at each winery’s facilities. All wines were sealed with natural cork stoppers. The selection of wine varieties was based on their anticipated aging potential, considering their initial relatively low odor intensity and austere mouthfeel (Alvarinho, Arinto, Pinot Blanc). Sauvignon Blanc was included as a representative of the international commercial style, known for its exotic fruity and vegetal flavors. The regions of origin were chosen for their susceptibility to cooling influences, whether from the Atlantic (Lisboa), an altitude (Alto Adige) or a combination of both (Monção/Melgaço). Moreover, wines were vinified typically as whites, without skin contact, and with fermenting temperature control in stainless steel tanks, according to the supplier’s information.

2.2. Tasting Panel

The tasting panel was composed of 23 persons, including 10 wine critics and oenologists aged between 30 and 70 years old, 13 students, aged between 24 and 30 years old, and comprising 7 females and 16 males. The students with extensive training were selected among those registered in their second year of the Vinifera Master of Oenology and Viticulture program held by the ISA faculty. Four tasting sessions were held at the Microbiology Laboratory of ISA. The first occurred on the 20 of April 2023, dedicated to students. The other sessions (27 April, 4 and 5 May 2023) were dedicated to the professional judges. Individuals were not paid and provided written consent to participate in this study.

2.3. Wine Evaluation

Each tasting session included 3 flights of 6 samples each. The wines were kept at 12–14 °C and opened 30 min before the start of the tasting. The bottles were first checked for cork taint by 3 experienced members of the staff. The samples were coded with a 3-digit number and randomly distributed among the judges. A total of 25 mL was poured at 12–14 °C into dark glasses (Sensus, Zwiesel Kristallglas AG, Zwiesel, Germany) and covered by glass Petri dishes. Mineral water and unsalted crackers were available as palate cleansers. The tasting sheet was adapted from Esteves et al. [1], being divided into 3 parts. In the first part, judges provided personal demographic information (professional career, work duration in the wine business, type of wine education). The second part consisted of the evaluation of 7 sensory attributes (“Evolutionary state”, “Quality”, “Complexity”, “Body”, “Linger”, “Faulty” and “Balance”) (Table 2), using a 10 cm unstructured linear scale anchored at the extremes. This part also included a sample description using the Check-All-That-Apply (CATA) methodology for aroma and in-mouth flavor perceptions. Following the CATA list evaluation, tasters were asked to predict the age of the wine, still using dark glasses to maintain objectivity. In the third part of the session, tasters focused on evaluating the color of the wine and predicting its age. Eight samples (the earliest and eldest for each wine variety) were poured into ISO transparent glasses [19]. Tasters then indicated the wine color using an unstructured linear scale, guided by reference pictures of wine colors, and provided their age predictions. A detailed tasting sheet can be found in the Supplementary Materials in Figure S1.

2.4. Chemical Analysis

2.4.1. Standard Wine Analysis

Wines were analyzed at an external laboratory (WTejo Laboratory, Santarém, Portugal) by calibrated FTIR spectroscopy (BACCHUS 3 Multispec; TDI, Barcelona, Spain) for alcoholic strength, total reducing sugars, pH, volatile acidity, total acidity, malic acid and lactic acid, according to the OIV/OENO Resolution 390/2010 [20]. Free and total SO2 concentrations were determined using colorimetric titration by the Ripper method, following the OIV/OENO Resolution 377/2009 [21]. Due to the small available volume left after sensory analysis, samples were obtained by pooling wine from two bottles (100 mL) and each sample was analyzed in duplicate (n = 2). The results showed a less than 10% coefficient of variation for each parameter.

2.4.2. Polyphenolic and Color Determinations

Samples were centrifuged at 5000 rpm (10 min) and pipetted into 1 cm path quartz cuvettes. Absorbance (Abs) was determined at 280 nm (Abs 280), 320 nm (Abs 320) and 420 nm (Abs 420) by spectrophotometry (Agilent Cary 60 UV–Vis; Santa Clara, CA, USA) for each sample. The Total Polyphenol Index (TPI) was determined by Abs 280 multiplied by a factor of 20, corresponding to the sample dilution, according to Ribéreau-Gayon et al. [22] Total hydroxycinnamates (THs) were quantified as caffeic acid equivalents by the formula, TH = [(Abs 320 − 1.4)/0.9] × 10, according to Sommers & Ziemelis [23]. Browning was given by the value of the absorbance measured at 420 nm.
The colorimetric analysis to obtain the CIELab coordinates (C*, H*, L*, a*, b*) was determined by the spectrophotometer Agilent Cary 100 UV–Vis (Santa Clara, CA, USA) as described by the OIV/OENO Resolution 1/2006 [24]. The samples were analyzed in duplicate (n = 2).

2.4.3. Elemental Analysis

The elemental composition was determined using an iCAP™ 7000 Plus Series (ICP-OES) inductively coupled plasma optical emission spectrometer (Thermo Fisher Scientific, Bremen, Germany), using argon as the gas, an Echelle optical design and a Charge Injection Device (CID) solid state detector, as described by Harutyunyan et al. [25].

2.4.4. Volatile Molecule Analysis

Volatiles were extracted according to the method of Barata et al. [26]. Briefly, wine pH was adjusted to 8 with concentrated NaOH (Merck, Darmstadt, Germany) and HCl (Merck) and mixed with 4 mL of ether–hexane with magnetic stirring for 5 min. The organic phase was obtained by 3 extractions using 2 mL of ether-hexane and refrigerated until used. Gas chromatography–mass spectrometry (CG–MS) was performed by a TRACE 1300 apparatus (Thermo Fisher Scientific, Milan, Italy) combined with a ISQ mass selective detector (Thermo Fisher Scientific). The column was of a DB−1 (30 m × 0.25 mm) with 0.25 µm film thickness (Agilent, Santa Clara, CA, USA) and helium as the carrier gas (flow rate 1.0 mL/min). The injector temperature was 240 °C. Samples (0.5 μL) were injected using the splitless mode with a purge closed time of 0.5 min. The oven temperature started at 40 °C, was increased by 7 °C/min to 220 °C and was held for 10 min. The ion source temperature was 180 °C, the transfer line was at 240 °C and the mass spectra were obtained in the 50 to 500 m/z range, at an electron energy of 70 eV, with a delay of 3 min. Volatile identification was performed by their TMS derivatives by comparing their (a) mass spectra with a GC–MS spectral library (Wiley Registry©/NIST) and (b) fragmentation profiles with published data [27,28]. The peak areas were conveyed as normalized relative percentages. Therefore, the outputs were semi-quantitative or qualitative given the absence of standards for each chemical family. Each sample was injected in triplicate (n = 3).

2.5. Statistical Analysis

The synthetic scores did not follow a normal distribution and were compared by the non-parametric Kruskal–Wallis test followed by pairwise comparisons using the Tukey post hoc test. For both tests, the α significance level was set as 0.05, with significant differences given by p-values < 0.05.
Correlations among chemical and sensory parameters were calculated using the Spearman coefficient while Pearson coefficients were used to correlate chemical determinations. The sensory descriptors with more than 10% frequency of citation in at least one wine were assembled in contingency tables followed by Correspondence Analysis (CA). Two Cluster Analyses of standardized data were run using the Euclidean distance measure and the Ward.D clustering method, to obtain descriptor clusters (descriptors as rows and wines as columns) or wine clusters (wines as rows and descriptors as columns). The sensory and chemical results were analyzed by Hierarchical Cluster Analysis (HCA) and Principal Component Analysis (PCA). Multifactorial Analysis (MFA) was used to describe the relations between selected chemical and sensory variables. Score comparison was obtained using the RStudio software (version i386 4.0.2) and the various factorial analyses were run with the free statistical software Jamovi (version 2.3.28, www.jamovi.org, accessed on 1 June 2024).

3. Results

3.1. Quality Prediction as a Function of Sensory Attributes

The scores of the sensory attributes provided by the tasters are listed in Table 3. The dependent variables “Quality”, “Balance”, “Evolution” and “Faulty” showed significant differences among some of the wines, while “Body”, “Complexity” and “Linger” were similar among all samples. The variability in the scores was rather high as depicted by the box plots of “Quality” in Figure 1, created based on a previous report using professional assessors [1]. However, there was an adequate consensus among tasters as depicted in Supplementary Figure S2. Quality evaluation differed only in the Sauvignon Blanc wines, where sample SB19 was scored equal to SB16 and less than samples SB13 and SB21. Arinto did not show a difference in “Quality” among the vintages, while for Alvarinho and Pinot Blanc, there was a tendency for them to have lower scores with aging (p > 0.05 for all wines of these varieties), as visualized in Figure 1.
The measurements of “Quality” could be predicted as a function of the other sensory attributes. The goodness of the prediction was assessed by the coefficient of correlation (r2). The equations that were obtained were the following:
Quality = 0.36 × Complexity + 0.35 × Balance − 0.04 × Body + 0.08 × Linger − 0.18 × Faulty − 0.04 × Evolution, r2 = 0.592
Quality = 0.37 × Complexity + 0.34 × Balance − 0.04 × Evolution − 0.19 × Faulty, r2 = 0.588
Quality = 0.37 × Complexity + 0.35 × Balance − 0.19 × Faulty, r2 = 0.588
“Quality” could thus be fairly predicted just by “Complexity”, “Balance” and “Faulty”. The value r2 = 0.588 indicates that the independent variables in the model explained about 58.8% of the variance in the dependent variable. The other 41.2% of the variance remained unexplained by the model, which could have been due to other factors not included in the model or to random noise. These three variables have an aesthetic significance consistent with the definition of fine wines [29] and should be used more frequently to assess the “excellence” of wine quality [30].

3.2. The Effect of Age on the Sensory Attributes

The effect of wine age was first assessed by determining Spearman correlation coefficients among the median value of each synthetic attribute. The results listed in Table 4 showed that age was not well correlated with the scores given to these variables. Only a moderate positive correlation was found with “Body” (r = 0.490). This means that tasters recognized the positive attributes (“Quality”, “Balance”, “Body”, “Complexity” and “Linger”) independently from age. Table 4 also shows positive significant correlations among attributes with aesthetic significance, like “Quality” and “Balance” or “Complexity”. “Quality” was negatively correlated with “Faulty” while “Balance” was negatively correlated with “Evolution” and “Faulty”.
The former relations among the variables may be better understood using PCA. Figure 2 illustrates how the different attributes were distributed in the space. The variance was well explained (72.4%) by the first two components, with 49% attributed to component 1 and 23.4% to component 2. “Quality” and “Balance” were opposed to “Evolution” and “Faulty” while “Complexity”, “Body” and “Linger” were in the positive quadrant related to “Quality”. Interestingly, “Age”, as an illustrative variable, was closer to “Evolution” and “Faulty”, indicating a tendency of the panel to prefer younger wines. This tendency was not observed by Esteves et al. [1], which might be explained by top–down inferences characteristic of expert tasters [29]. Indeed, when judges were informed that they were assessing old whites, they penalized wines with younger sensory features [1]. On the contrary, in the present experiments, tasters were informed that they were rating wines with a wide range of ages and so provided responses according to their quality perception irrespective of wine age. Whether individual liking or preference drove this quality judgement is a question that remains to be clarified as discussed by Malfeito-Ferreira [31].
A Cluster Analysis was conducted using all synthetic parameters as factors, allowing the grouping of wines based on the overall perception of their sensory attributes (see Figure 2 for cluster definitions). Wines SB19 and SB16 were distinct from the others due to the negative perceptions related to “Faulty” and “Evolution”, resulting in lower quality ratings for SB19. However, these negative perceptions were less pronounced in SB16, which received “Quality” scores comparable to the rest of the wines (refer to Table 2). The remaining wines were clustered together regardless of their age, region or grape variety. This indicates that tasters identified their sensory properties across a diverse range of bottle aging durations and conditions. In particular, Sauvignon Blanc from 2013 showed that a variety typically reputed for its highly aromatic young character [32] may also age well, albeit being more susceptible to vintage effects than other varieties, as illustrated by SB16 and SB19. Minute concentrations of acetaldehyde probably play a role in the process by enhancing its fruity character with aging [33].

3.3. Aroma Taste and Mouthfeel Perception

The CATA methodology enabled tasters to characterize the wines according to their aroma and in-mouth flavor descriptors. The respective contingency tables are shown in the Supplementary Materials (Tables S1 and S2). The descriptors cited that more than 10% were subjected to a Correspondence Analysis (wines as rows, descriptors as columns) yielding a Pearson Chi-square value of 535 (df = 442, p = 0.002) (Figure 3). The significance of the analysis was due to the aroma variables, since the flavor ones did not provide significant sample discrimination (p > 0.05) aligned with the data reported by Esteves et al. [1]. The underscored “Quality” sample SB19 was placed close to “Earthy” and “Sourness”, indicating the likely causes of its faultiness as detected during the synthetic evaluation (see Table 2). Indeed, other faults were not consistently detected since the free option to cite off-flavors was only mentioned twice for reduction in SB19.
The Cluster Analysis combined the wines according to their sensory descriptors, where wines were computed as rows and descriptors as columns (Figure 4a). The SB19 wine was removed from this analysis since it was dominated by faultiness, blurring the observation of the effect of proper aging.
Another Cluster Analysis was carried out, using descriptors as rows and wines as columns, showing five different clusters (Figure 4b). The attribute “Vegetal” was determined by orthonasal (Vegetal A) and retronasal (Vegetal F) routes of olfaction. One cluster comprised flavors that could be understood under the concept of “Freshness” (Vegetal A, Vegetal F, Spicy, Sweetness, Floral, Fresh Fruit). Another cluster was dominated by in-mouth perceptions related to an “Austere” flavor (Minerality, Saltiness, Bitterness, Dryness, Smoothness, Mature Fruit). The cluster comprising “Balsamic”, “Oak”, “Honey” and “Dried Fruit”, “Sourness” and “Earthy”, could be described as the “Mellowed” group. Interestingly, “Sourness” and “Earthy” were clustered together within the “Mellowed” group while “Acidity” was clearly separated from all other clusters. In the free response alternative, oxidative aroma was only cited once, regarding AR06, and oxidative flavors were only used for the older wines (twice for AR06 and once for PB06), meaning that tasters did not significantly perceive these wines as oxidized.
The frequency of citations of the descriptors gathered according to Cluster Analysis enabled us to observe the evolution of the sensory cluster families, calculated for each of the wine clusters discriminated in Figure 4 (Supplementary Table S3). The evolution is depicted in Figure 5 using the frequency of citation as a percentage. Wine SB19 was not included since it was regarded as defective. Thus, the sensory space of proper aging may be described by a decrease in freshness, accompanied by an increase in the mellowed descriptors and austere character. The perception of acidity tended to decrease which may be understood as a result of the increasing mellowed perception, since chemical acidity did not change (Section 3.5.1). This flavor continuum corresponds fairly well with the results described by Esteves et al. [1], while it adds the perception of faultiness to the conceptual space. Moreover, the vegetal descriptors, either in aroma (Vegetal A) or in flavor (Vegetal F), more frequently quoted in the present work, might be explained by the influence of Sauvignon Blanc wines [34]. Interestingly, the earthiness in SB19 might have been due to higher levels of methoxypyrazines [33] but also to volatile thiols, since earthy aromas dominated dearomatized wines spiked only with these molecules [34].
Regarding tastes, acidity and sourness are considered synonyms, but “Acidity” was more frequently quoted (Supplementary Table S3) while “Sourness” appeared closely related to “Earthy”. This might be explained by the alternative meaning of sourness, as related to an unfavorable taste [35], and thus linked to the negative earthy perception.

3.4. Age Prediction

After sensory description, assessors were asked to predict the age of each wine poured in dark glasses. Therefore, age prediction was only dependent on the individual memory of the aroma and flavor perceptions and not biased by the observation of color. Figure 6 shows the age prediction as a function of the freshness and mellowed perceptions (SB19 was not used). The decay in freshness was accompanied by the rise in the citation of mellowed flavors, demonstrating that it was the balance between both perceptions that determined the evolutionary stage of the wines. The intersection between both regression lines (close to 7 years) might be understood as the predicted age where the wines change from the dominant fresh flavor to the mellowed aging character. Even if the aging process depends on wine variety, it is remarkable that Monforte et al. [36] established a priori this same value as the limit to separate young (2–7 years) from old dry whites (>8 years), using 24 commercial wines from four different Portuguese regions.
The average predicted ages are shown in Table 5, displaying a clear trend to rate the wines with ages lower than their actual ages, except for the younger wines (AL22, AL19, AR17, PB20, SB19, SB21), as primarily observed by Esteves et al. [1]. The case of SB19, where the predicted age was almost double the real age, may be explained by faultiness detected in this wine. Nevertheless, the Pearson correlation between the actual age and the predicted age was good (r = 0.727, p < 0.001, without SB19). The higher differences in predictions were observed in the older wines of each variety, showing that their sensory characteristics were not familiar to the tasters.
At the end of the tasting trials, individuals were also asked to predict the age of the youngest and oldest sample for each grape variety using transparent glasses. In parallel, a scale anchored by figures of glasses with the different colors (Supplementary Figure S1) was used to provide a color score. The average results are presented in Table 5. The predicted mean age in transparent glasses tended to be lower than the real age in five out of the eight wines, which demonstrates the bias induced by color on sensory description. Tasters would probably have described the wines as having a younger character had they been tasted in transparent glasses.
The relation between predicted wine age and color score shows that the panel correctly understood the variations in color and provided sensory descriptions consistent with the color, despite the high individual variability in the responses (Figure 7). Indeed, the correlation between real and predicted age scores was very good (r = 0.966, slope 1.15 ± 0.13, p < 0.0001). Then, the difference between both ages could be used as an empirical measure of the quality of the aging process. In relative terms, the higher the difference, the better wines had aged since they kept the sensory profile of a younger wine, as initially proposed by Esteves et al. [1].

3.5. Chemical Analysis

To assess the chemical differences according to wine age, Pearson correlation coefficients were first calculated between age and various physical–chemical compositions. When warranted, a PCA followed by hierarchical clustering was employed to identify similarities among the different wines. This method was not designed to elucidate the effect of age on chemical compositions, as factors like initial wine compositions, bottling variables (e.g., cork quality, sulfur dioxide additions) and storage conditions (e.g., temperature) were not standardized. Therefore, the results do not represent the evolution of a specific wine over time but can be viewed as an illustrative example of how each varietal wine evolved under its respective winery’s conditions. Despite these limitations, this “vertical tasting” provided samples that revealed an overall chemical behavior resulting from aging, offering valuable insights for future research.

3.5.1. Standard Analysis

The results of the standard wine analyses are shown in Supplementary Table S4. The range of values is within the expected range of values for dry white wines. Ethanol varied from 11.9 to 14.5% (v/v) while total acidity ranged from 4.5 to 6.6 g/L (as tartaric acid). Volatile acidity varied from 0.24 to 0.38 g/L, well below the legal limit (1.2 g/L as acetic acid, www.oiv.int/standards/international-code-of-oenological-practices/annexes/maximum-acceptable-limits, accessed on 6 July 2024). Total sulfur dioxide was also well below the legal limit (220 mg/L). The residual sugar found in some samples was over 4 g/L. According to European Union standards, wines with residual sugar over 4 g/L and total acidity (as tartaric acid) less than 2 g/L of the residual sugar are regarded as medium-dry [37]. These medium-dry wines might represent a technical option to counteract wine total acidity [38] and meet the consumer demand for smoother wines [39], as typically observed in German Riesling wines [16]. Interestingly, in Pinot Bianco, the lower sugar concentration in the three most recent vintages might be explained by the changes in wine appreciation, where drier and leaner styles are becoming more valorized [40].
The effect of age on the standard chemical parameters would not be expected since bottled commercial wines are supposed to be stable in this regard. Indeed, significant but low correlations were only observed for volatile acidity (r = −0.494) and lactic acid (r = 0.592) (Supplementary Table S5) without any likely influence on sensory parameters, given their relatively low concentrations.

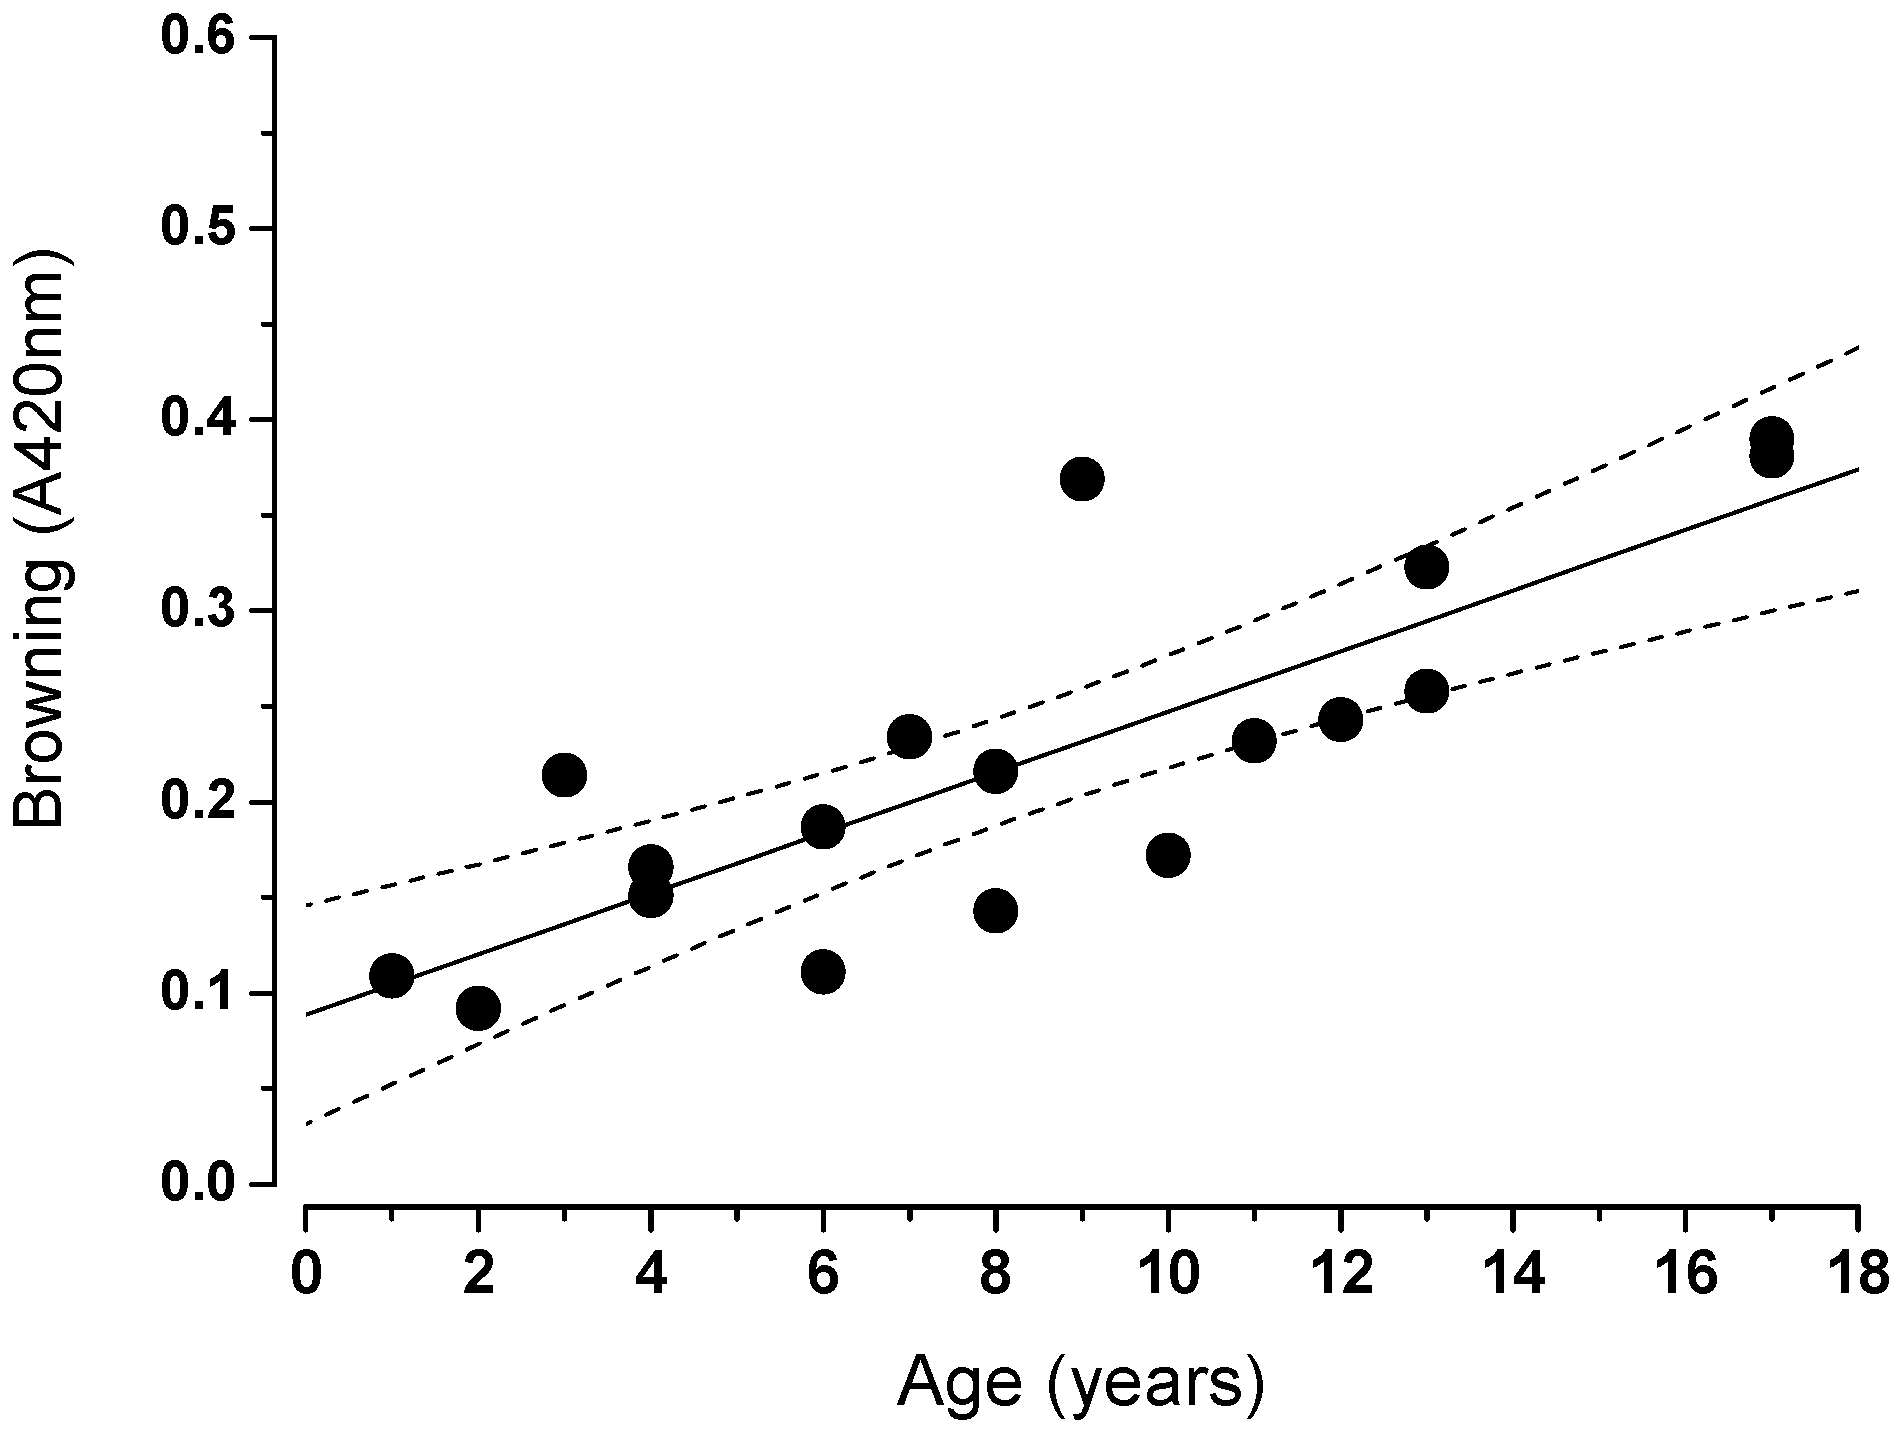
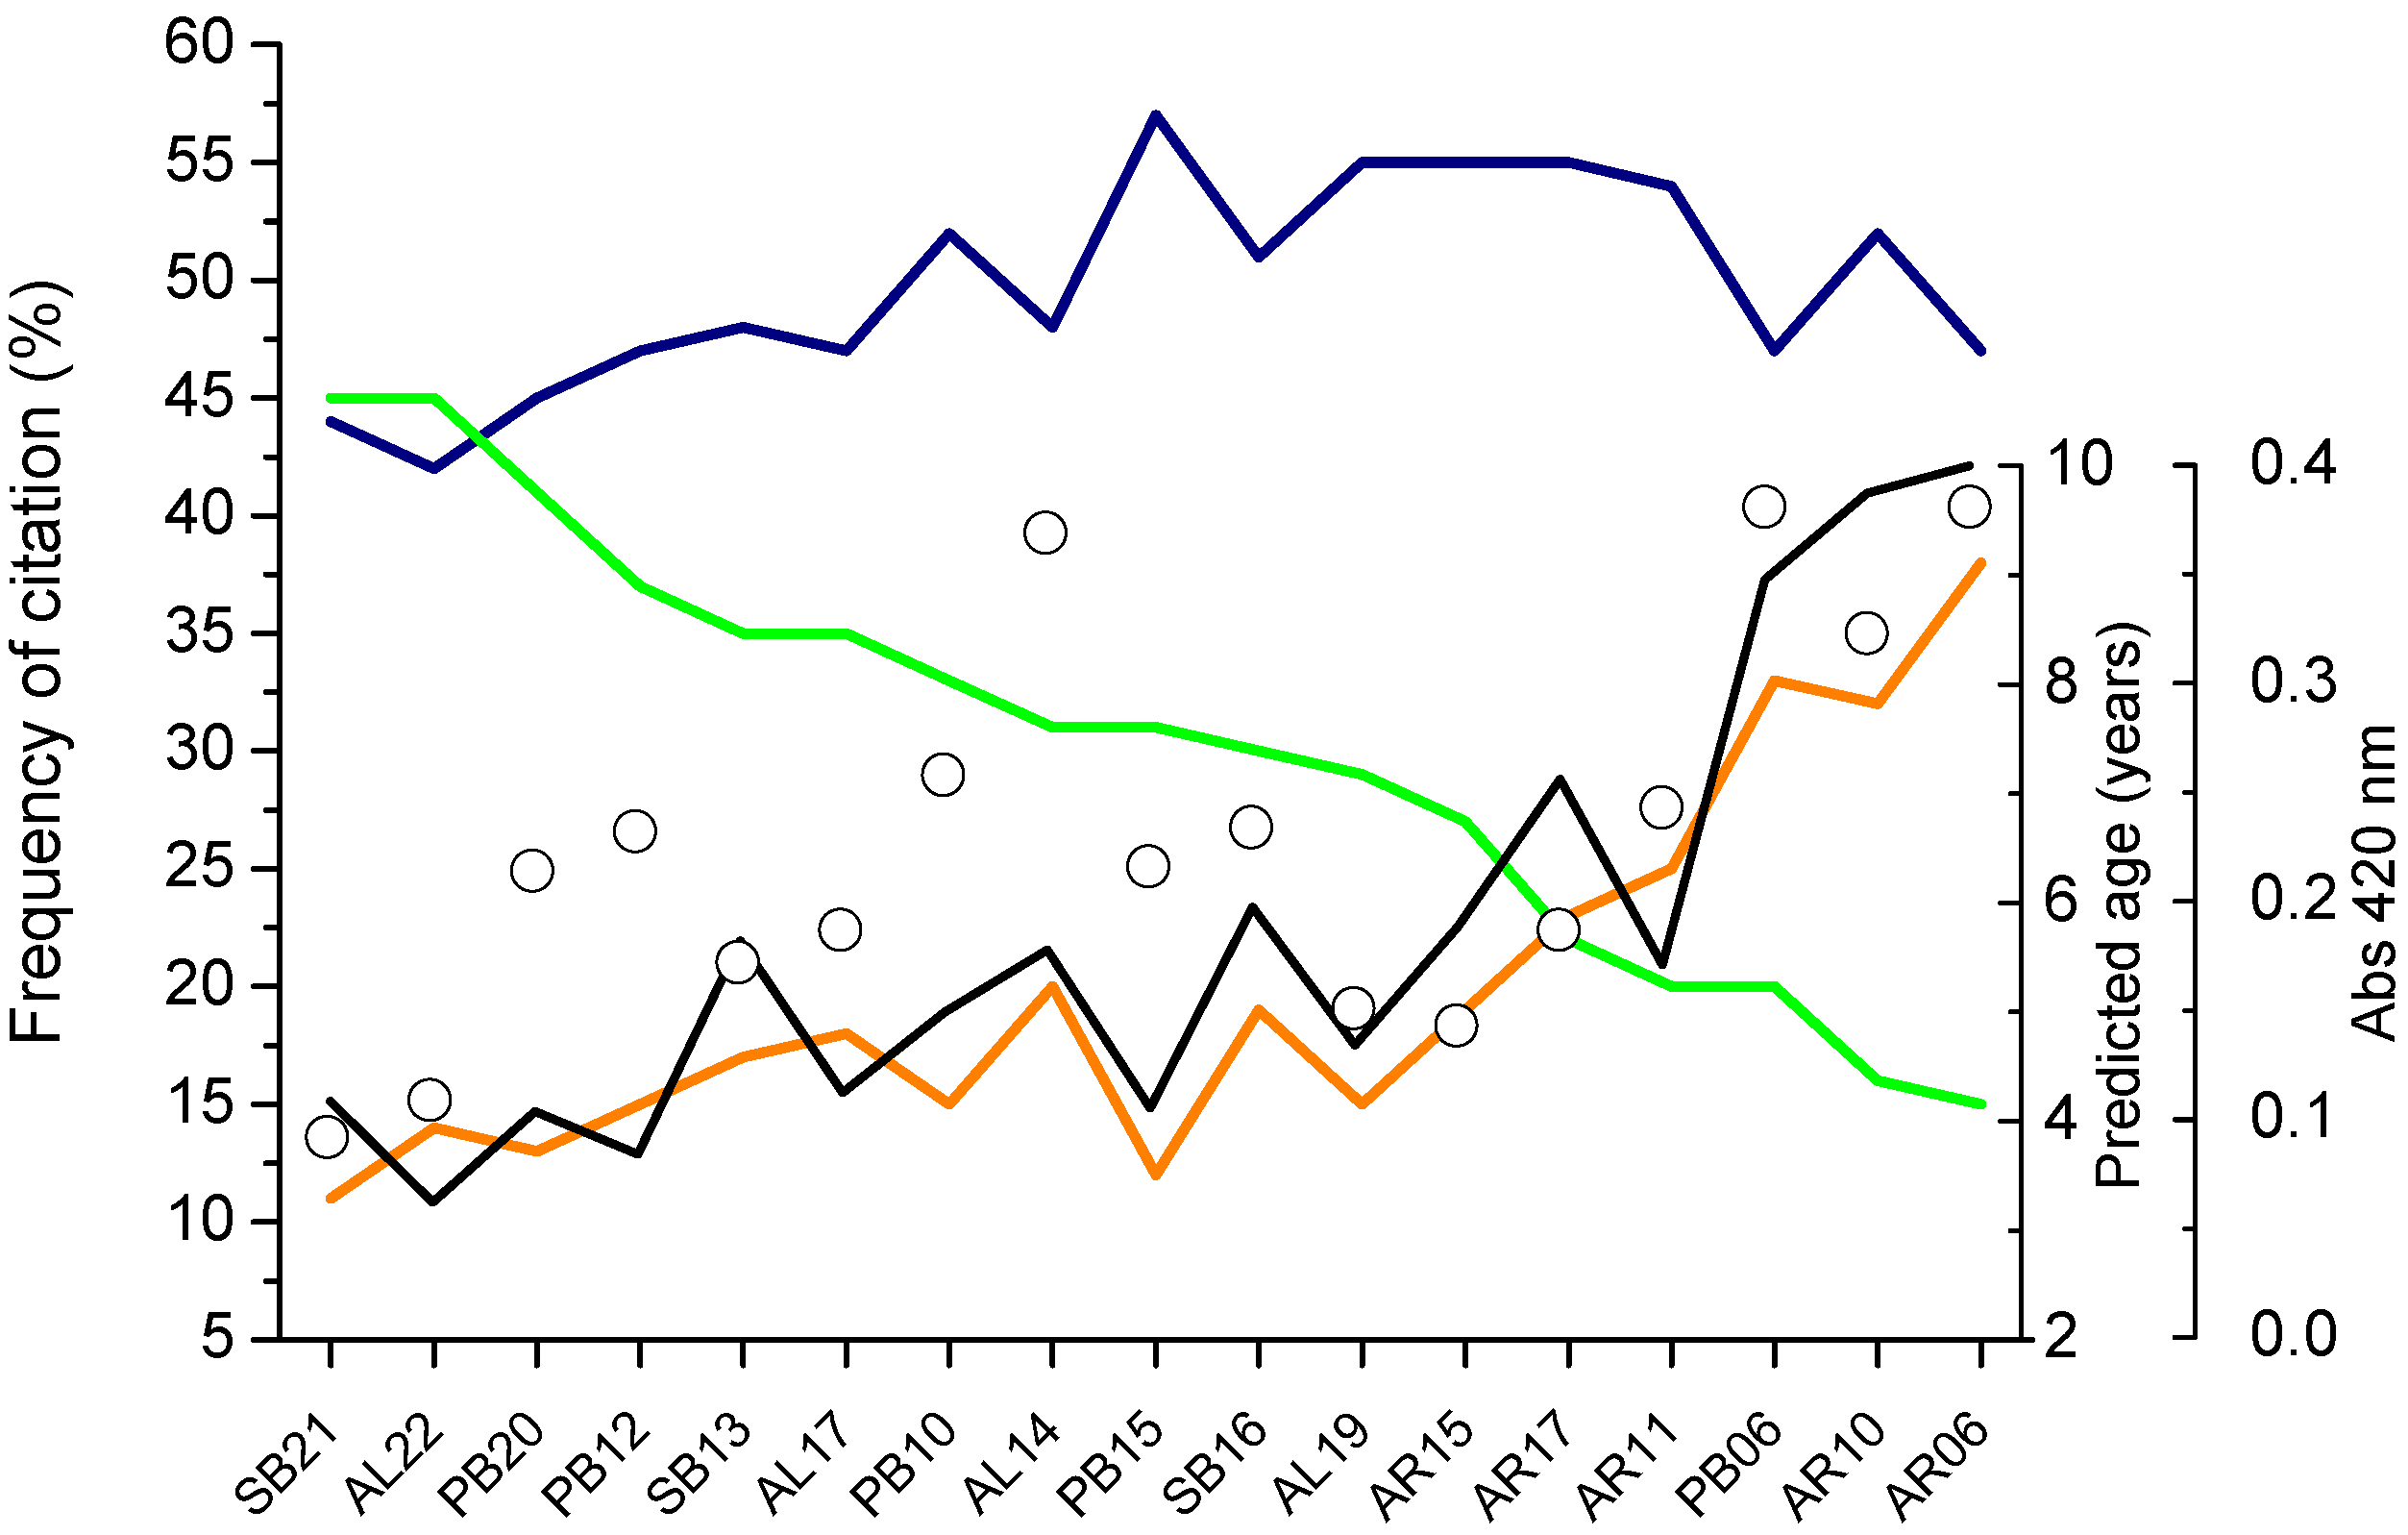
3.5.2. Polyphenolic and Color Analysis

The polyphenolic determinations are shown in Supplementary Table S6 while the Pearson correlations coefficients are shown in Supplementary Table S7. The best correlated parameter with wine age was the absorbance at 420 nm, which is an indicator of color browning [12]. The TPI, HA and the CIELab parameters displayed lower correlations, demonstrating that they did not perform as well as the Abs 420 as a measure of color evolution according to age. The positive relation between Abs 420 and b* (yellowness), or negative concerning L* (clarity), was relatively low, probably because aging was not forced by high temperature as experimented by Mafata et al. [12]. Filipe-Ribeiro et al. [41] also used the value of b* to model the oxidation induced by forced aging. The positive significant relation between Abs 420 and TPI was lower than that found by Ricci et al. [42] using accelerated aging by temperature. In addition, to estimate white wine shelf life, Ferreira et al. [43] calculated an index of resistance to oxidation that was better related to sensory degradation than Abs 420, under forced aging. Overall, these results suggest that forced aging may not be an accurate way of predicting proper wine aging under real conditions.
Figure 8 illustrates the browning effect according to age that achieved a relatively high correlation (r = 0.816, slope 0.016 ± 0.003, p < 0.0001), since it was obtained for wines with different origins, grape varieties, chemical compositions and storage conditions. Monforte et al. [36] also found a high correlation (r = 0.73, p < 0.01) between age and Abs 420, in parallel with acetaldehyde formation. Interestingly, in an early report by Simpson [4], an increase in Abs 420 of up to 0.210 in an older wine (a Riesling of 10 years from Eden Valley, South Australia) was described as an evolution in color from straw to deep yellow but not associated with browning.
In addition, the changes in flavor clusters relative to browning and predicted age are illustrated in Figure 9. The two younger wines (SB21, AL22) were fresher and, accordingly, less deeply colored. However, higher Abs 420 was observed with relatively low mellowed flavors and low predicted age (wine AL14). Therefore, sensory changes do not always anticipate the browning effect, as described by Escudero et al. [9] and Marrufo-Curtido et al. [10]. The explanation for this may be related to (a) the chemical changes that precede browning and may elicit younger perceptions due to the masking effect of certain volatiles or (b) the utilization of taste and mouthfeel perceptions, which may enhance the sensation of freshness. Overall, the tasting sequence, where in-mouth perceptions preceded aroma description, might have minimized top–down effects induced by “oxidized” aromas. Simultaneously, the use of dark glasses prevented the likely occurrence of biases induced by color [44,45].

3.5.3. Elemental Analysis by ICP-OES

The concentrations of both macro-elements (Na, K, Ca, Mg, P and S) and micro-elements (Fe, Cu, Zn, Mn, B, Pb, Cr, Ni and Cd) are shown in Supplementary Table S8. The Pearson correlation coefficients between elements and ages are shown in Table 6. Significant correlations were only observed in the Alvarinho (K, Ca, Fe and Zn) and Pinot Bianco (B) wines. Other correlations were also either positive or negative according to the grape variety. In the case of K and Zn, positive correlations were found for all varietal wines, with different magnitudes, justifying their use in the Multifactorial Analysis (Section 3.5). Cu and Mn showed negative and positive correlations, respectively, but with rather low r values (Table 6).
Agazzi et al. [46] reported that the Ca and K concentrations decreased while Na and Mg concentrations increased after 5 years of aging in Malbec wines from Argentina. The depletion of K and Ca was explained by precipitation as K bitartrate and Ca tartrate, respectively, but this effect should not have occurred in the bottles used in the present work since no visible crystals were present.
Gambetta et al. [47] associated a higher quality of Chardonnay wines with higher levels of Cu and Zn in juices. Ferreira et al. [48], using red wines subjected to accelerated aging, found positive correlations between Zn and aldehyde formation while the oxidative degradation of S-reduced molecules (methanetiol) was negatively related with Cu (r = −0.59, p < 0.05), Fe (r = −0.67, p < 0.01) and Mn (r = −0.67, p < 0.01).
Furthermore, the SB19 sample showed the highest concentration of S, which could be related to the earthy off-flavors detected by the judges, since volatile thiols might have been involved [34]. Na levels were higher in the wines closer to the ocean (Arinto and Sauvignon Blanc, Lisbon DOC), but this observation needs further investigation since soil composition and rootstock are other modulators of Na concentration [49].
Elemental analysis has typically been used to differentiate wines based on their origin rather than their vintage [50]. The HCA, using as a cut-off the value corresponding to five clusters, showed that Pinot Bianco and Sauvignon Blanc could be separated from the other wines independently from wine age (Figure 10). Two clusters included only two wines from Arinto and the other two from Alvarinho. On the contrary, another cluster comprised Arinto and Alvarinho, irrespective of their age, indicating the absence of a vintage effect, in accordance with Duley et al. [50].

3.5.4. Analysis of Volatile Molecules

The outputs of the GC–MS detection are shown in Supplementary Table S9, where a total of 88 molecules were detected. To understand the effect of age on the volatile composition, the Pearson correlation coefficients were determined. Only those molecules showing a significant correlation (p < 0.05) in at least one variety were kept (Supplementary Table S10). Most volatiles showed a different trend at least in one grape variety. Significant trends (positive or negative) for all varieties were observed only for isoamyl acetate, diethyl succinate, ethyl linoleate, stearic acid and 2-propenal, 3-(2,6,6-trimethyl-1-cyclohexen-1-yl).
The aldehyde related to propenal has been seldom mentioned in wines. Nicolli et al. [51] found that in Merlot wines, using polar and medium polar columns, it probably contributed to their herbaceous aroma. Isoamyl acetate and diethyl succinate showed negative and positive age trends, respectively, according to the seminal work of Simpson [4]. Makhotkina et al. [52] also showed similar trends with isoamyl acetate and diethyl succinate, stimulated by temperature in Sauvignon Blanc. In addition, isoamyl acetate showed negative correlations with the age of several commercial dry white wines [36]. Indeed, ethyl esters of fatty acids and acetate esters tend to hydrolyze, whereas the ethyl esters of branched acids may be formed during storage in the bottle [52] (and references cited therein). Ethyl linoleate has been found in elevated levels in rot-affected grapes [53] but its evolution over time has not been reported. Similarly, stearic acid, a constituent of Sauvignon Blanc juices [54], was not detected in the older vintages.
Other molecules proposed to be markers of dry white wine aging [36,55,56] were not determined in this work or showed different behaviors according to the variety. Vitispirane increased during refrigerated [4] or forced aging [57] but our results failed to show this behavior in Pinot Bianco. Interestingly, the expected decrease in linalool with aging [4] was also not observed in Pinot Bianco (r = 0.951, p < 0.05). These results illustrate the complexity of the age effect on volatile composition, further enhanced by the complexity of sensory perception, since flavor deterioration by some volatiles might be masked by the increase in others [55].

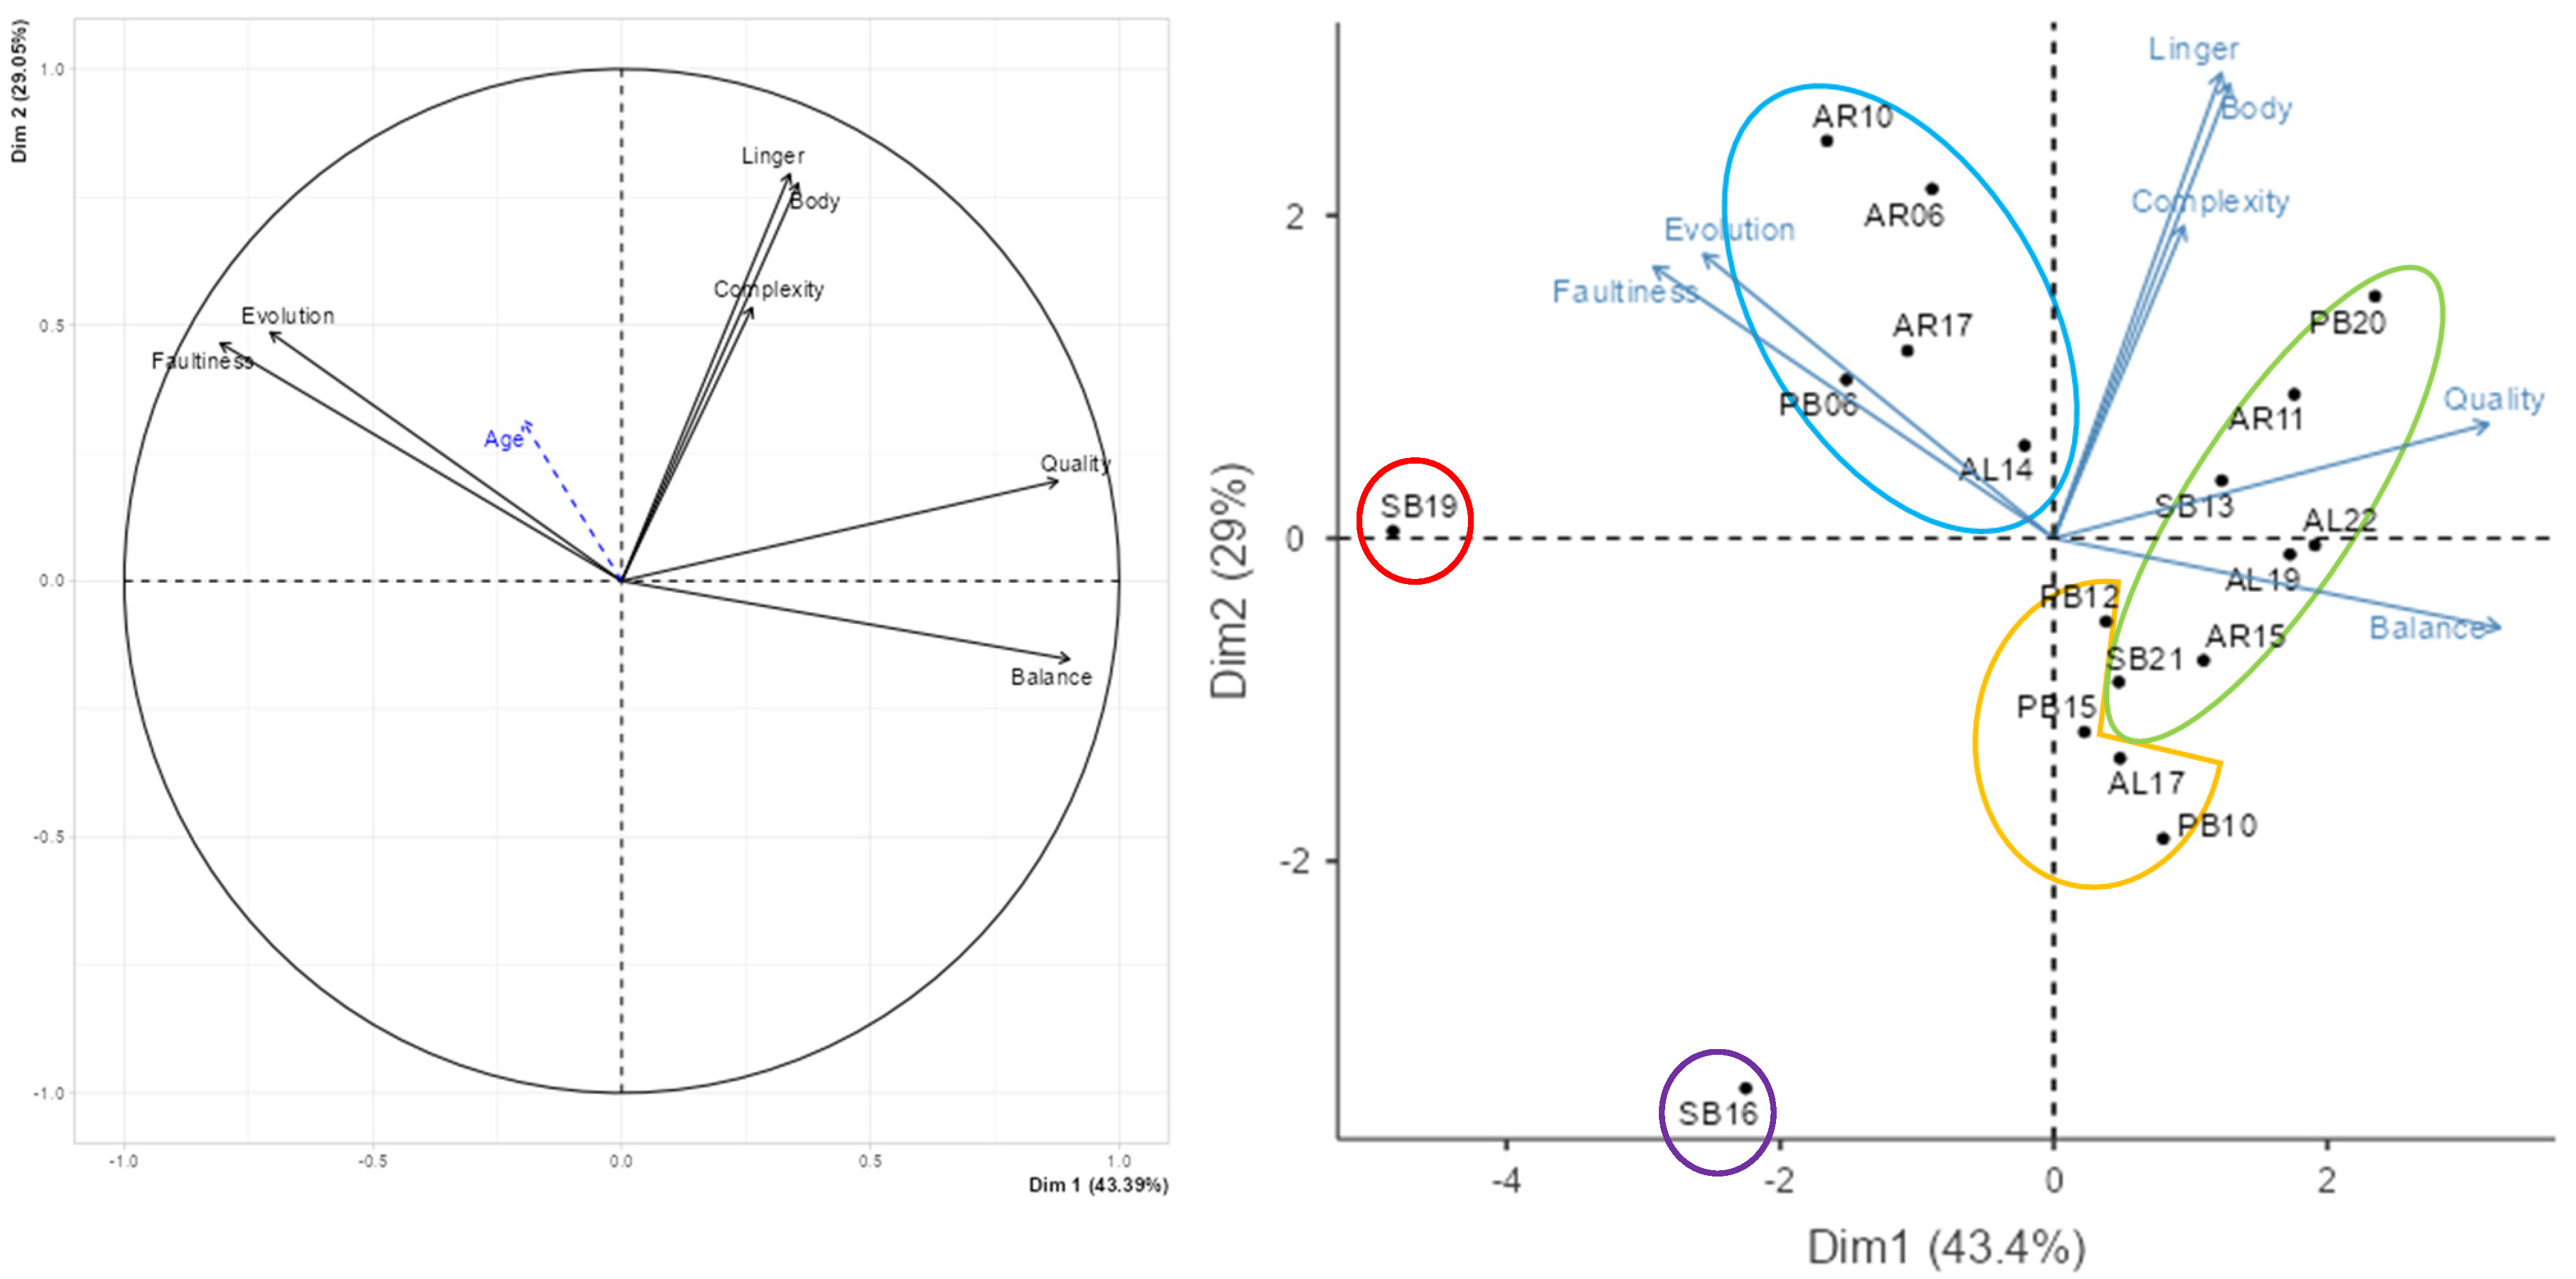
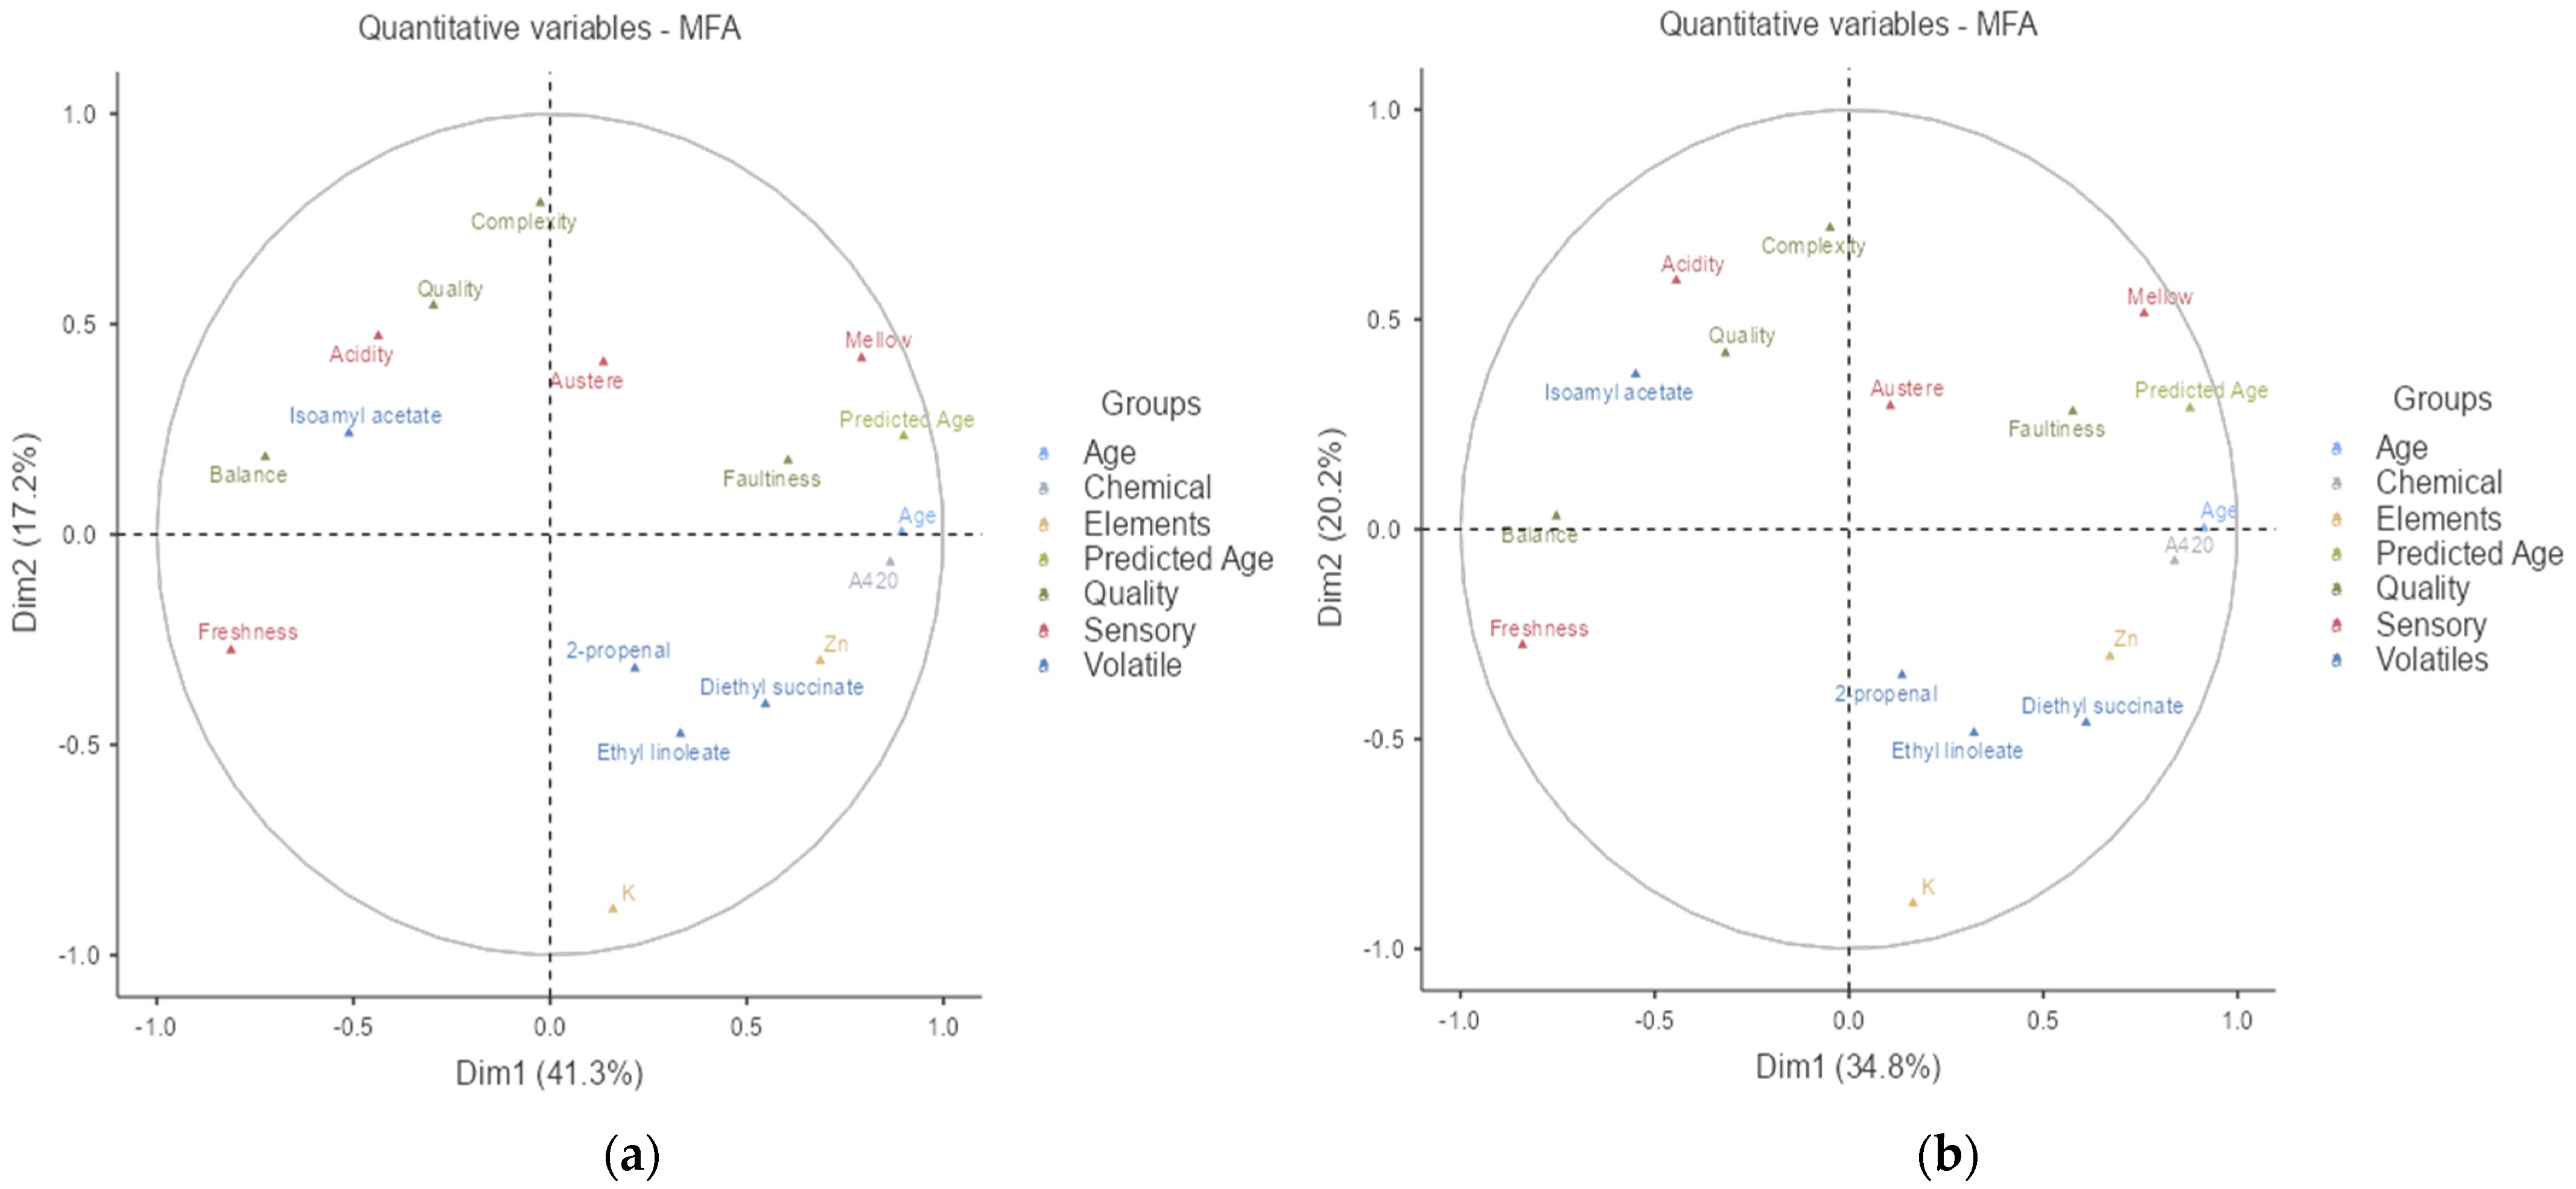
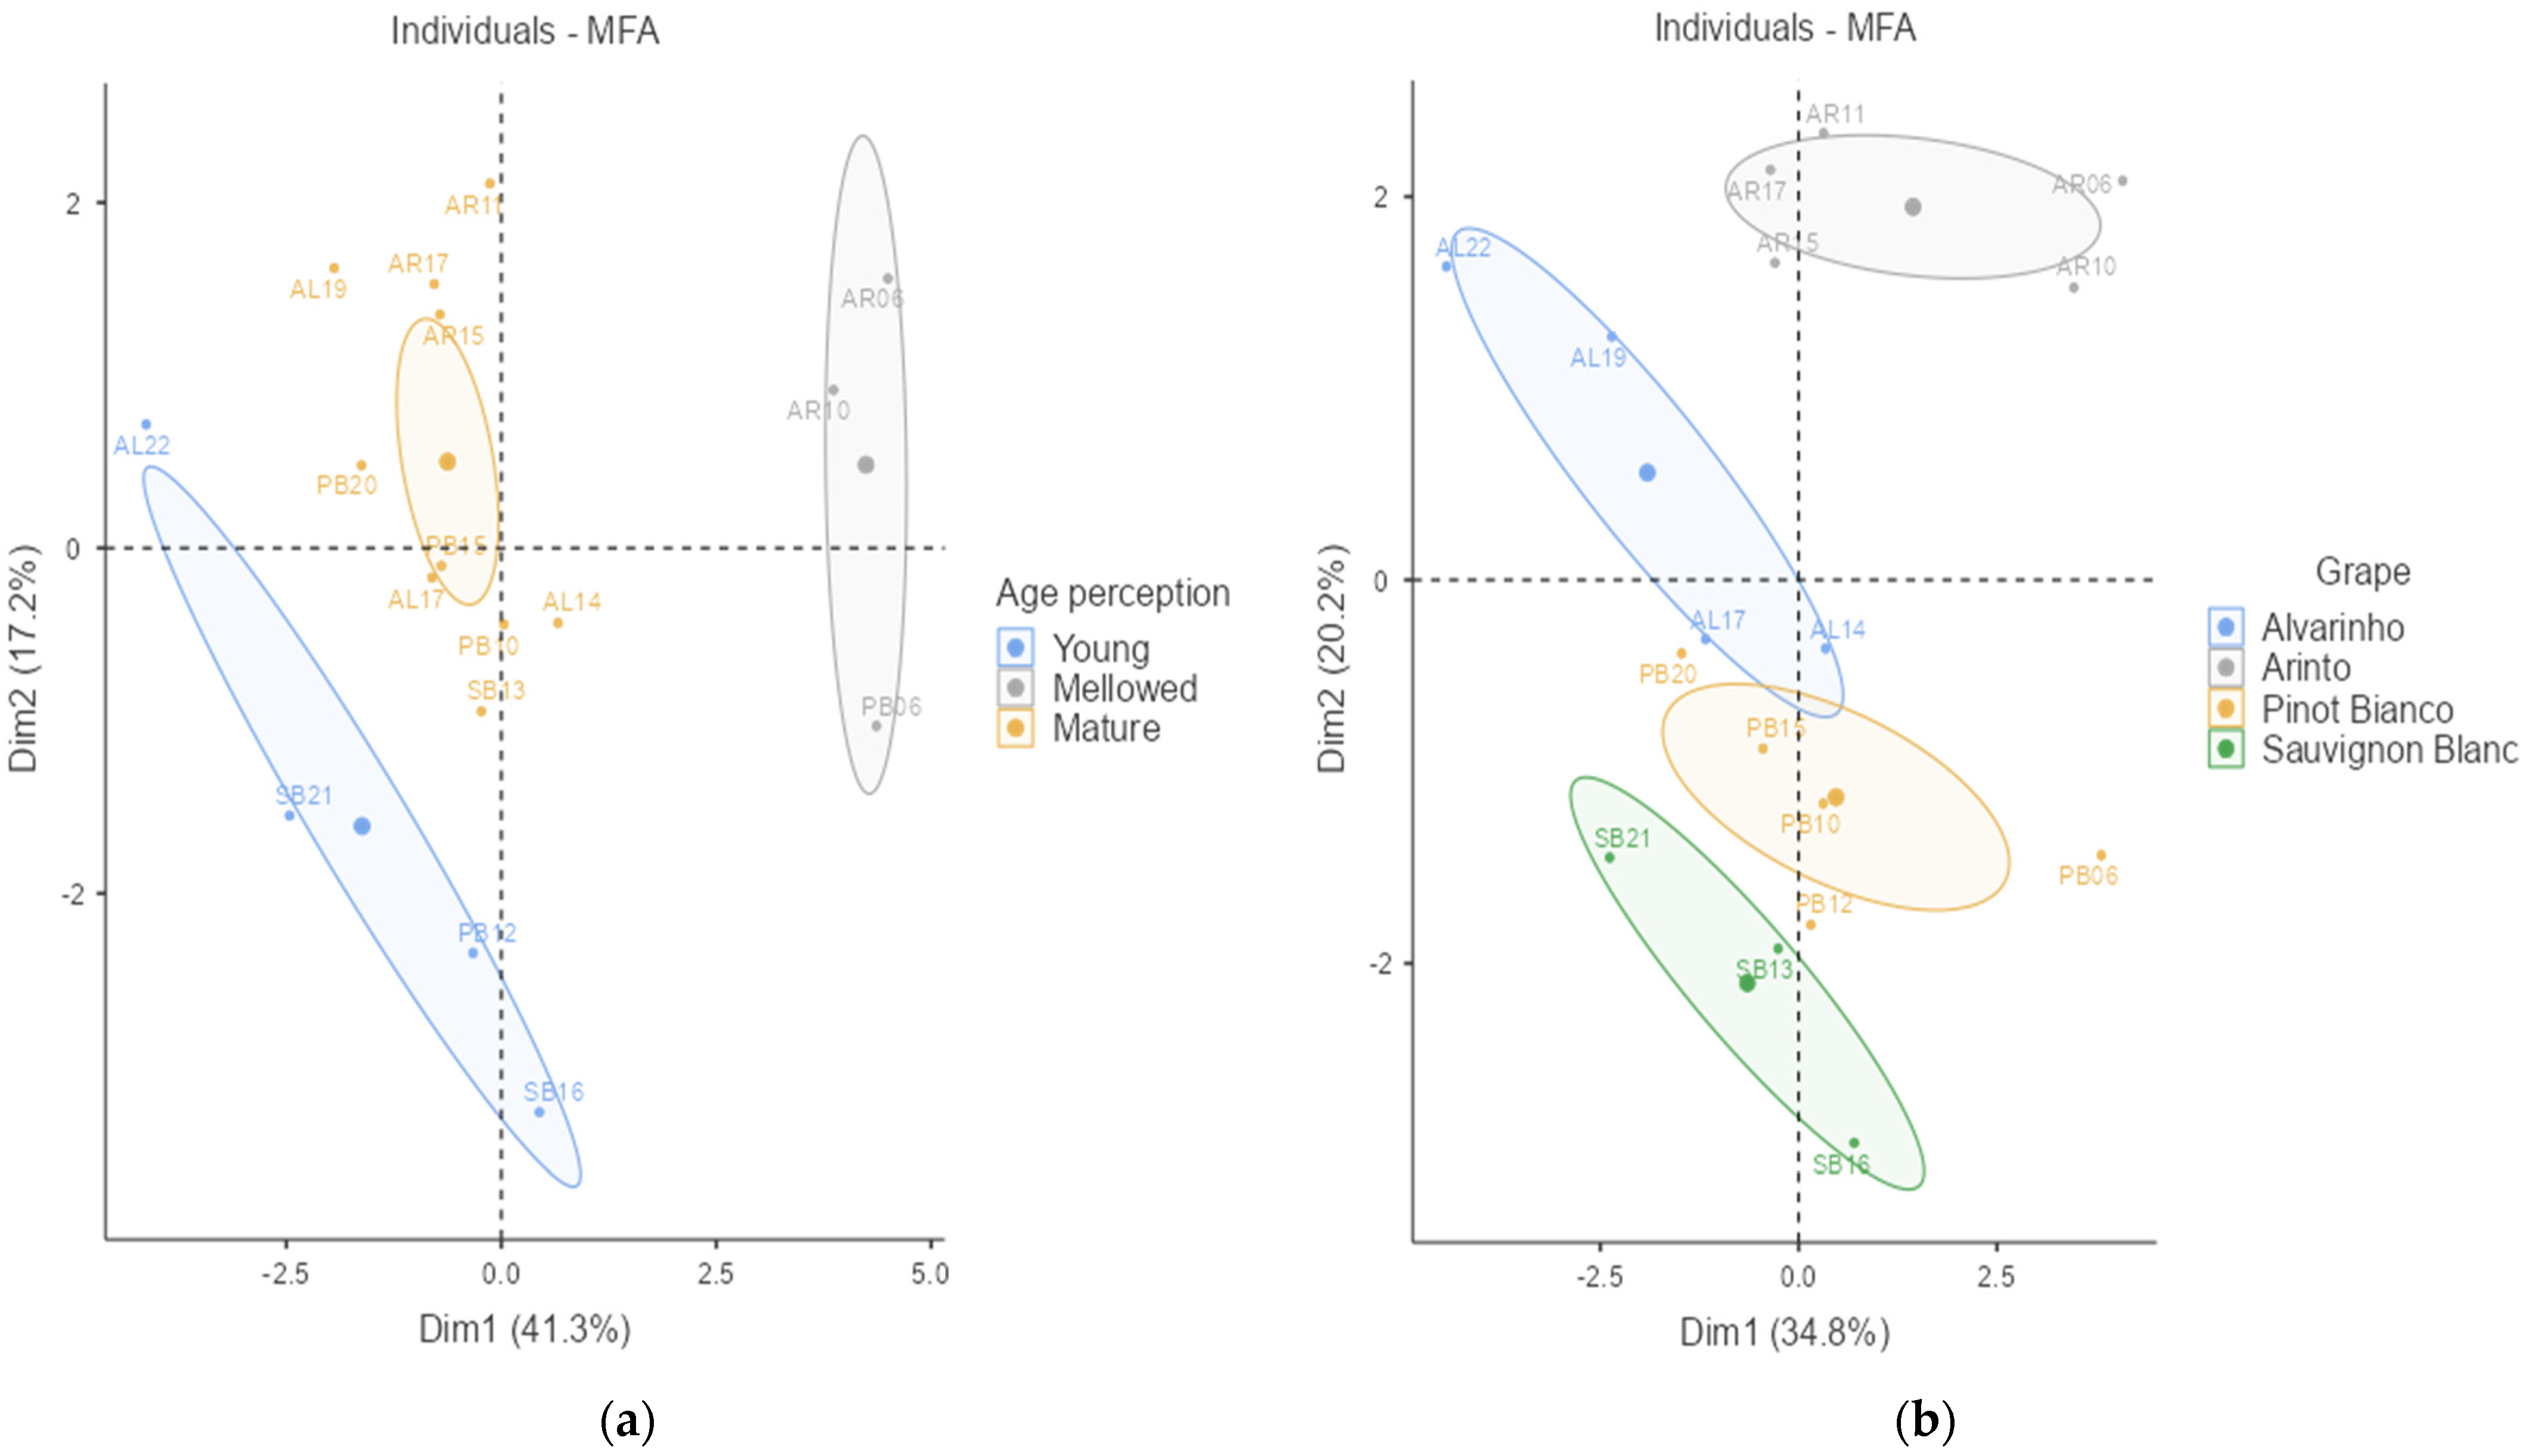
3.6. Multifactorial Analysis (MFA)

The utilization of MFA enabled us to observe what the contributions of each chemical and sensory dimension might have been to the quality evaluation of the tasted wines. MFA analyzes the outputs in several sets of variables, seeking the common structures present in all or some of these sets [58]. To reduce the noise of the outputs, several assumptions were made given their previously described relation to wine age. The sensory parameters were reduced to the four flavor families and four synthetic attributes (quality, complexity, balance, faulty). The standard chemical parameters were not used while Abs 420 was the single determination retained from the polyphenolic analysis. The elemental analysis provided the K and Zn concentrations while only four volatile molecules were retained. Stearic acid, although positively correlated for all wines, was not kept, since nine out of eighteen determinations were below the detection limit. Regarding wines, only those with equal “Quality” scores were kept, so SB19 was removed. Therefore, the results of the MFA might provide clues about the relations among the variables underlying proper aging.
The first MFA was run using age perception as an a priori set of variables. Three groups were obtained from clusters I and II (young), II and IV (mature), and V (mellowed), presented in Figure 5. The localization of the sets of variables on the biplot is presented in Supplementary Figure S3 and the contribution of each quantitative variable to the two first dimensions is shown in Supplementary Figure S4. The biplot illustrating the localization of the quantitative variables is shown in Figure 11a. This plot clearly illustrates the opposite localization of the fresher character of younger wines (left quadrants) against the mellowed character of older wines (right quadrants), under an explained variance of 58.5% for dimensions 1 and 2. Thus, the younger profiles tended to be more valorized, as described by Franco-Luesma et al. [6] based on the orthonasal aroma of white wines spiked with oxidation-related volatiles. The mellowed perception, despite being associated with faultiness, did not elicit a significant drop in the quality scores. The localization of “Austere” in the middle of the plot means that this flavor, dominated by in-mouth perceptions, did not contribute to the separation between ages and might be the cue to understanding the propensity of a wine aging without losing its quality. The chemical factors were distributed in the plot according to the previously described correlations, showing the higher associations of isoamyl acetate with freshness, and diethyl succinate, A420 and Zn, with the “Age” character.
MFA may have also provided a comparative characterization of the wines by adding the grape variety as one a priori set of variables instead of age perception. Figure 11b shows that the localization of the quantitative variables was similar in both cases, although the explained variance by both dimensions decreased slightly to 55%. The localization of the sets of variables on the biplot is presented in Supplementary Figure S5 while the contribution of each quantitative variable was mostly similar to the previous one.
The main differences between the MFAs computed with age perception or grape variety as the a priori set of variables are illustrated in Figure 12. The outputs provided wine clusters according to this set of variables. The age perception clusters gathered wines from different varieties (Figure 12a) while grape variety clusters gathered wines with different ages (Figure 12b). Alvarinho and Pinot Bianco were placed closer in the biplot while Arinto and Sauvignon Blanc were placed in opposite locations. MFA explained a slightly higher percentage of variance when wines were grouped by age perception instead of grape variety.

4. Limitations and Future Prospects

This report represents an extension of the work initiated by Esteves et al. [1] and was designed considering the limitations that were already pointed out. Nevertheless, other issues may also be questioned. The study of dry white wine aging is usually directed to oxidation problems and forced tests are used to analyze wines under standardized conditions. This option is understandable from a scientific point of view since influencing variables must be individualized. However, this requirement limits the utilization of wines from a wide range of vintages where the initial and storage conditions can hardly be standardized. Therefore, the primary limitation of this work could not be overcome by choosing equal aging conditions for all commercial wines. Nevertheless, an overall sensory evolution with age could be described by a continuous sensory space, according to previous results [1]. Other varieties and regions should be tested in future to validate the present results. In addition, the boundaries of the sensory space would be better defined if very old “flat” wines were used, mainly concerning the effect on the in-mouth austere perception that seems to be the key to understanding wine aging propensity.
This work showed that tasters did not recognize oxidation as an aging marker, although they recognized the evolution and faultiness of the wines. It may be hypothesized that the absence of oxidation from the CATA list would preclude its detection, although it could have been chosen as a free citation, as described by Franco-Luesma et al. [6]. In opposition to this, it may also be posited that, if oxidation was present on the CATA list, it would have blurred the quality evaluation. Indeed, even when properly aged samples are used (up to 37 years old), the studies usually mention an “oxidized character” as describing the age effect of dry white wines [36]. This feature may have the unintentional drawback of associating proper aging with unwanted or premature oxidation. In certain cases, the absence of fresh fruit (“not fruity”) may be understood as an indication of oxidation and consequent hedonic negative perceptions [6], but this inference is not sufficient as a quality assessment [30]. Interestingly, an early report by Simpson [4] described a “bottle age” aroma as being more intense in the older wines with minor differences in grape bouquets, oxidized aromas and quality assessments. The subsequent lines of research grounded in forced aging probably favored oxidative character as a more appropriate descriptor, despite its negative connotation. Therefore, in studies aimed at analyzing the evolution of fine dry white wines, the utilization of the metaphor “mellowed by age” appears to be more suitable than “oxidized by age”.

5. Conclusions

This work explored the sensory and chemical changes during the bottle aging of dry white wines. The results contributed to the explanations of how white wines develop, how they are perceived and how they change over time. The chemical parameter better correlated with aging was absorbance at 420 nm. The untargeted analyses of volatile compounds illustrated the complexity of their contribution to the aging sensory character of white wines.
The professional tasters tended to associate bottling duration with lower-quality scores and with an intensification of off-flavor perception. Nevertheless, tasters agreed on the proper wine development and did not penalize quality unless they perceived strong faultiness. Furthermore, the difference between perceived and real age may be understood as a measure of the aging propensity. If wines were judged younger, they aged properly for more years than anticipated.
The results presented here illustrate the evolution of the sensory space during aging, from a declining perception of freshness to an intensification in the mellowed perception, keeping constant an austere character. This continuum represents an evolving sensory space, a description that may be used in educational programs to widen the range of perceptions of fine wine quality among professionals and consumers.

Supplementary Materials

The following supporting information can be downloaded at: https://www.mdpi.com/article/10.3390/beverages10030078/s1. Figure S1. Tasting sheet (miniaturized from size A4); Table S1. Frequencies of citations of aroma descriptors of all tasted wines (descriptors used in the Correspondence Analysis are written in bold); Table S2. Frequencies of citations of flavor descriptors of all tasted wines (descriptors used in the Correspondence Analysis are written in bold); Table S3. Frequencies of citations of wines clustered according to their sensory descriptors; Table S4. Standard wine physical–chemical analysis; Table S5. Pearson coefficients of correlation among the standard physical–chemical analysis; Table S6. Polyphenolic and CIEelab determinations; Table S7. Pearson coefficients of correlation among spectrophotometric and CIElab color determinations; Table S8. Elemental compositions of the analyzed wines (mg/L); Table S9. Concentrations of volatile molecules of the analyzed wines (mg/L) (a value of 0 corresponds to non-detected molecules); Table S10. Pearson correlation coefficients between wine ages and volatile molecules analyzed by GC–MS using a polar column; Figure S2. PCA of Quality scores using tasting individuals as variables to show consensus among tasters a,b (numbers correspond to each taster). Figure S3. Projection plan of the variables in the Multifactorial Analysis, when age perception was used as one of the sets of variables. Figure S4. Contributions of quantitative variables to dimensions 1 (a) and 2 (b). The expected average contribution is indicated by a dashed red line. Figure S5. Projection plan of the set of variables in the Multifactorial Analysis, when grape was used as one of the sets of variables. References [59,60] are cited in the supplementary materials.

Author Contributions

Conceptualization, M.M.-F. and G.M.; methodology, M.M.-F., G.M. and J.F.; software, M.M.-F. and M.M.; validation, M.M.-F.; investigation, G.M.; writing—original draft preparation, G.M.; writing—review and editing, M.M.-F. and J.F.; supervision, M.M.-F. All authors have read and agreed to the published version of the manuscript.

Funding

This work was supported by national funds from the research unit UIDB/04129/2020 (LEAF—Linking, Landscape, Environment, Agriculture and Food Research Center) through the Fundação para a Ciência e a Tecnologia (Portuguese Foundation for Science and Technology—FCT).

Institutional Review Board Statement

Not applicable.

Informed Consent Statement

Not applicable.

Data Availability Statement

The data presented in this study are only available on request from the corresponding author due to the absence of a data repository for this specific dataset.

Acknowledgments

Carmen Santos, Cláudia Carvalho and Ana Palmira from the WTejo wine laboratory are deeply appreciated for performing the physical–chemical analyses. Miguel Martins and Henrique Ribeiro from the Chemistry Laboratory of ISA are gratefully acknowledged for performing the elemental analyses. The authors are thankful to the wine companies mentioned for donating the tasted wines.

Conflicts of Interest

The authors declare no conflicts of interest.

References

  1. Esteves, M.; Sequeira, M.; Malfeito-Ferreira, M. Definition of the Sensory and Aesthetic Spaces of Dry White Wines with Aging Ability by Experienced Tasters. Beverages 2024, 10, 44. [Google Scholar] [CrossRef]
  2. Echave, J.; Barral, M.; Fraga-Corral, M.; Prieto, M.A.; Simal-Gandara, J. Bottle aging and storage of wines: A review. Molecules 2021, 26, 713. [Google Scholar] [CrossRef]
  3. Linsenmeier, A.W.; Rauhut, D.; Sponholz, W.R. Aging and flavor deterioration in wine. In Managing Wine Quality, 2nd ed.; Reynolds, A.G., Ed.; Woodhead Publishing Series in Food Science, Technology and Nutrition; Woodhead Publishing: Duxford, UK, 2022; Volume 2, pp. 559–594. ISBN 9780081020654. [Google Scholar] [CrossRef]
  4. Simpson, R.F. Aroma composition of bottle aged white wine. Vitis 1979, 18, 148–154. [Google Scholar]
  5. Zhang, D.; Wei, Z.; Han, Y.; Duan, Y.; Shi, B.; Ma, W. A Review on Wine Flavour Profiles Altered by Bottle Aging. Molecules 2023, 28, 6522. [Google Scholar] [CrossRef] [PubMed]
  6. Franco-Luesma, E.; Honoré-Chedozeau, C.; Ballester, J.; Valentin, D. Oxidation in wine: Does expertise influence the perception? LWT 2019, 116, 108511. [Google Scholar] [CrossRef]
  7. Wang, G.; Kumar, Y. Mechanisms of the initial stage of non-enzymatic oxidation of wine: A mini review. J. Food Sci. 2024, 89, 2530–2545. [Google Scholar] [CrossRef]
  8. Ailer, Š.; Jakabová, S.; Benešová, L.; Ivanova-Petropulos, V. Wine Faults: State of Knowledge in Reductive Aromas, Oxidation and Atypical Aging, Prevention, and Correction Methods. Molecules 2022, 27, 3535. [Google Scholar] [CrossRef] [PubMed]
  9. Escudero, A.; Asensio, E.; Cacho, J.; Ferreira, V. Sensory and chemical changes of young white wines stored under oxygen. An assessment of the role played by aldehydes and some other important odorants. Food Chem. 2002, 77, 325–331. [Google Scholar] [CrossRef]
  10. Marrufo-Curtido, A.; de-la-Fuente-Blanco, A.; Sáenz-Navajas, M.-P.; Ferreira, V.; Bueno, M.; Escudero, A. Sensory Relevance of Strecker Aldehydes in Wines. Preliminary Studies of Its Removal with Different Type of Resins. Foods 2021, 10, 1711. [Google Scholar] [CrossRef]
  11. Ferreira, A.C.S.; Hogg, T.; Guedes de Pinho, P. Identification of key odorants related to the typical aroma of oxidation-spoiled white wines. J. Agric. Food Chem. 2003, 51, 1377–1381. [Google Scholar] [CrossRef]
  12. Mafata, M.; Brand, J.; Panzeri, V.; Kidd, M.; Buica, A. A multivariate approach to evaluating the chemical and sensorial evolution of South African Sauvignon Blanc and Chenin Blanc wines under different bottle storage conditions. Food Res. Int. 2019, 125, 108515. [Google Scholar] [CrossRef] [PubMed]
  13. Ugliano, M. Oxygen contribution to wine aroma evolution during bottle aging. J. Agric. Food Chem. 2013, 61, 6125–6136. [Google Scholar] [CrossRef]
  14. Ugliano, M.; Kwiatkowski, M.J.; Travis, B.; Francis, I.L.; Waters, E.J.; Herderich, M.J.; Pretorius, I.S. Post-bottling management of oxygen to reduce off-flavour formation and optimise wine style. Aust. N. Z. Wine Ind. J. 2009, 24, 24–28. [Google Scholar]
  15. Vázquez-Pateiro, I.; Arias-González, U.; Mirás-Avalos, J.M.; Falqué, E. Evolution of the Aroma of Treixadura Wines during Bottle Aging. Foods 2020, 9, 1419. [Google Scholar] [CrossRef] [PubMed]
  16. Dein, M.; Kerley, T.; Munafo, J.P., Jr. Characterization of odorants in a 10-Year-Old Riesling wine. J. Agric. Food Chem. 2021, 69, 11372–11381. [Google Scholar] [CrossRef]
  17. Haeger, J.W. Riesling Rediscovered: Bold, Bright, and Dry, 1st ed.; University of California Press: Oakland, CA, USA, 2016; pp. 7–67. [Google Scholar]
  18. Wilson, C. What Is a Vertical Tasting? Decanter, 28 September 2020. Available online: https://www.decanter.com/learn/advice/what-is-a-vertical-tasting-51353/ (accessed on 18 July 2024).
  19. ISO 3591:1977; Sensory Analysis. Apparatus Wine Tasting Glass. International Organization for Standardization: Geneva, Switzerland, 1977.
  20. Resolution OIV/OENO 390/2010; Guidelines on Infrared Analysers in Oenology. OIV: Dijon, France, 2010.
  21. Resolution OIV/OENO 377/2009; Sulfur Dioxide. Method OIV-MA-AS323-04B. OIV: Dijon, France, 2009.
  22. Ribéreau-Gayon, P.; Glories, Y.; Maujean, A.; Dubourdieu, D. Handbook of Enology: The Chemistry of Wine Stabilization and Treatments, 3rd ed.; John Wiley & Sons, Ltd.: Chichester, UK, 2006; Volume 2, pp. 141–203. [Google Scholar] [CrossRef]
  23. Somers, T.C.; Ziemelis, G. Spectral evaluation of total phenolic components in Vitis vinifera: Grapes and wines. J. Sci. Food Agric. 1985, 36, 1275–1284. [Google Scholar] [CrossRef]
  24. Resolution OIV/OENO 1/2006; Determination of Chromatic Characteristics according to CIELab. Method OIV-MA-AS2-11. OIV: Dijon, France, 2006.
  25. Harutyunyan, M.; Viana, R.; Granja-Soares, J.; Martins, M.; Ribeiro, H.; Malfeito-Ferreira, M. Adaptation of Ancient Techniques to Recreate ‘Wines’ and ‘Beverages’ Using Withered Grapes of Muscat of Alexandria. Fermentation 2022, 8, 85. [Google Scholar] [CrossRef]
  26. Barata, A.; Pagliara, D.; Piccininno, T.; Tarantino, F.; Ciardulli, W.; Malfeito-Ferreira, M.; Loureiro, V. The effect of sugar concentration and temperature on growth and volatile phenol production by Dekkera bruxellensis in wine. FEMS Yeast Res. 2008, 8, 1097–1102. [Google Scholar] [CrossRef]
  27. Eglinton, G.; Hunneman, D.H.; McCormick, A. Gas chromatographic—Mass spectrometric studies of long chain hydroxy acids—III. The mass spectra of the methyl esters trimethylsilyl ethers of aliphatic hydroxy acids. A facile method of double bond location. Org. Mass Spectrom. 1968, 1, 593–611. [Google Scholar]
  28. Kolattukudy, P.E.; Agrawal, V.P. Structure and composition of aliphatic constituents of potato tuber skin (suberin). Lipids 1974, 9, 682–691. [Google Scholar] [CrossRef]
  29. Malfeito-Ferreira, M. Fine wine flavour perception and appreciation: Blending neuronal processes, tasting methods and expertise. Trends Food Sci. Technol. 2021, 115, 332–346. [Google Scholar] [CrossRef]
  30. Basalekou, M.; Tataridis, P.; Georgakis, K.; Tsintonis, C. Measuring Wine Quality and Typicity. Beverages 2023, 9, 41. [Google Scholar] [CrossRef]
  31. Malfeito-Ferreira, M. Fine wine recognition and appreciation: It is time to change the paradigm of wine tasting. Food Res. Int. 2023, 174, 113668. [Google Scholar] [CrossRef] [PubMed]
  32. Tsai, P.-C.; Araujo, L.D.; Tian, B. Varietal Aromas of Sauvignon Blanc: Impact of Oxidation and Antioxidants Used in Winemaking. Fermentation 2022, 8, 686. [Google Scholar] [CrossRef]
  33. Coetzee, C.; Brand, J.; Jacobson, D.; Du Toit, W.J. Sensory effect of acetaldehyde on the perception of 3-mercaptohexan-1-ol and 3-isobutyl-2-methoxypyrazine. Aust. J. Grape Wine Res. 2016, 22, 197–204. [Google Scholar] [CrossRef]
  34. Iobbi, A.; Di, Y.; Tomasino, E. Revealing the sensory impact of different levels and combinations of esters and volatile thiols in Chardonnay wines. Heliyon 2023, 9, e12862. [Google Scholar] [CrossRef]
  35. Batali, M.; Cotter, A.; Frost, S.; Ristenpart, W.; Guinard, J.-X. Titratable Acidity, Perceived Sourness, and Liking of Acidity in Drip Brewed Coffee. ACS Food Sci. Technol. 2021, 1, 559–569. [Google Scholar] [CrossRef]
  36. Monforte, A.R.; Martins, S.; Ferreira, A.C.S. Discrimination of white wine ageing based on untarget peak picking approach with multi-class target coupled with machine learning algorithms. Food Chem. 2021, 352, 129288. [Google Scholar] [CrossRef]
  37. OIV International Standard for the Labelling of Wines. Available online: https://www.oiv.int/standards/international-standard-for-the-labelling-of-wines/part-iii-optional-information/optional-information/type-of-wine (accessed on 17 July 2024).
  38. Vitorino, G.; Mota, M.; Malfeito-Ferreira, M. Characterization of sensory perceptions elicited by white wine spiked with different aroma, taste and mouth-feel active molecules. Ciênc. Téc. Vitiviníc. 2021, 36, 139–150. [Google Scholar] [CrossRef]
  39. Malfeito-Ferreira, M.; Diako, C.; Ross, C.F. Sensory and chemical characteristics of ‘dry’ wines awarded gold medals in an international wine competition. J. Wine Res. 2019, 30, 204–219. [Google Scholar] [CrossRef]
  40. Del Rey, R.; Loose, S. State of the International Wine Market in 2022: New market trends for wines require new strategies. Wine Econ. Policy 2023, 12, 3–18. [Google Scholar] [CrossRef]
  41. Filipe-Ribeiro, L.; Rodrigues, S.; Nunes, F.M.; Cosme, F. Reducing the Negative Effect on White Wine Chromatic Characteristics Due to the Oxygen Exposure during Transportation by the Deoxygenation Process. Foods 2021, 10, 2023. [Google Scholar] [CrossRef] [PubMed]
  42. Ricci, A.; Parpinello, G.P.; Versari, A. Modelling the evolution of oxidative browning during storage of white wines: Effects of packaging and closures. Int. J. Food Sci. Technol. 2017, 52, 472–479. [Google Scholar] [CrossRef]
  43. Ferreira, A.C.S.; Oliveira, C.; Hogg, T.; de Pinho, P.G. Relationship between potentiometric measurements, sensorial analysis, and some substances responsible for aroma degradation of white wines. J. Agric. Food Chem. 2003, 51, 4668–4672. [Google Scholar] [CrossRef]
  44. Ballester, J.; Abdi, H.; Langlois, J.; Peyron, D.; Valentin, D. The Odor of Colors: Can Wine Experts and Novices Distinguish the Odors of White, Red and Rosé Wines? Chemosens. Percept. 2009, 2, 203–213. [Google Scholar] [CrossRef]
  45. Coulon-Leroy, C.; Pouzalgues, N.; Cayla, L.; Symoneaux, R.; Masson, G. Is the typicality of “Provence Rosé wines” only a matter of color? Flavor and color typicality combining professional and trained sensorial panels. OENO One 2018, 52, 317–331. [Google Scholar] [CrossRef]
  46. Agazzi, F.; Nelson, J.; Tanabe, C.; Doyle, C.; Boulton, R.; Buscema, F. Aging of Malbec wines from Mendoza and California: Evolution of phenolic and elemental composition. Food Chem. 2018, 269, 103–110. [Google Scholar] [CrossRef]
  47. Gambetta, J.M.; Cozzolino, D.; Bastian, S.; Jeffery, D. Towards the Creation of a Wine Quality Prediction Index: Correlation of Chardonnay Juice and Wine Compositions from Different Regions and Quality Levels. Food Anal. Methods 2016, 9, 2842–2855. [Google Scholar] [CrossRef]
  48. Ferreira, V.; Bueno, M.; Franco-Luesma, E. New Insights into the Chemistry Involved in Aroma Development during Wine Bottle Aging: Slow Redox Processes and Chemical Equilibrium Shifts. Adv. Wine Res. 2015, 1, 275–289. [Google Scholar] [CrossRef]
  49. Zhou-Tsang, A.; Wu, Y.; Henderson, S.W.; Walker, A.R.; Borneman, A.R.; Walker, R.R.; Gilliham, M. Grapevine salt tolerance. Aust. J. Grape Wine Res. 2021, 27, 149–168. [Google Scholar] [CrossRef]
  50. Duley, G.; Dujourdy, L.; Klein, S.; Werwein, A.; Spartz, C.; Gougeon, R.; Taylor, D. Regionality in Australian Pinot noir wines: A study on the use of NMR and ICP-MS on commercial wines. Food Chem. 2021, 340, 127906. [Google Scholar] [CrossRef] [PubMed]
  51. Nicolli, K.P.; Biasoto, A.C.; Souza-Silva, É.A.; Guerra, C.C.; Dos Santos, H.P.; Welke, J.E.; Zini, C.A. Sensory, olfactometry and comprehensive two-dimensional gas chromatography analyses as appropriate tools to characterize the effects of vine management on wine aroma. Food Chem. 2018, 243, 103–117. [Google Scholar] [CrossRef] [PubMed]
  52. Makhotkina, O.; Pineau, B.; Kilmartin, P.A. Effect of storage temperature on the chemical composition and sensory profile of Sauvignon Blanc wines. Aust. J. Grape Wine Res. 2012, 18, 91–99. [Google Scholar] [CrossRef]
  53. Steel, C.C.; Schwarz, L.J.; Qiu, Y.; Schueuermann, C.; Blackman, J.W.; Clark, A.C.; Schmidtke, L.M. Thresholds for Botrytis bunch rot contamination of Chardonnay grapes based on the measurement of the fungal sterol, ergosterol. Aust. J. Grape Wine Res. 2020, 26, 79–89. [Google Scholar] [CrossRef]
  54. Tumanov, S.; Zubenko, Y.; Greven, M.; Greenwood, D.; Shmanai, V.; Villas-Boas, S. Comprehensive lipidome profiling of Sauvignon blanc grape juice. Food Chem. 2015, 180, 249–256. [Google Scholar] [CrossRef]
  55. Culleré, L.; Cacho, J.; Ferreira, V. An Assessment of the Role Played by Some Oxidation-Related Aldehydes in Wine Aroma. J. Agric. Food Chem. 2007, 55, 876–881. [Google Scholar] [CrossRef] [PubMed]
  56. Oliveira, C.; Santos, S.; Silvestre, A.; Barros, A.; Ferreira, A.C.S.; Silva, A. Quantification of 3-deoxyglucosone (3DG) as an aging marker in natural and forced aged wines. J. Food Compos. Anal. 2016, 50, 70–76. [Google Scholar] [CrossRef]
  57. Díaz-Maroto, M.C.; López Viñas, M.; Marchante, L.; Alañón, M.E.; Díaz-Maroto, I.J.; Pérez-Coello, M.S. Evaluation of the Storage Conditions and Type of Cork Stopper on the Quality of Bottled White Wines. Molecules 2021, 26, 232. [Google Scholar] [CrossRef]
  58. Husson, F.; Lê, S.; Pagès, J. Exploratory Multivariate Analysis by Example Using R, 2nd ed.; Chapman and Hall/CRC: Boca Raton, FL, USA, 2017; pp. 131–172. [Google Scholar]
  59. Caissie, A.; Riquier, L.; De Revel, G.; Tempere, S. Representational and sensory cues as drivers of individual differences in expert quality assessment of red wines. Food Qual. Prefer. 2021, 87, 104032. [Google Scholar] [CrossRef]
  60. Mafata, M.; Brand, J.; Panzeri, V.; Buica, A. Investigating the Concept of South African Old Vine Chenin Blanc. S. Afr. J. Enol. Vitic. 2020, 41, 168–182. [Google Scholar] [CrossRef]
Figure 1. Box plots depicting “Quality” score distributions among the tasted wines (•, average; horizontal line, median; lower horizontal dash, 5% of the scores, higher horizontal dash, 95% of the scores; box, 25% and 75% of the scores; ♦, extreme scores) (different scores are indicated by different letters when p > 0.05) (refer to Table 1 for sample codes).
Beverages 10 00078 g001
Figure 2. Principal Component Analysis of active (black) and supplementary (blue) variables (left panel) and biplot with active variables and wines (right panel). Wines were grouped according to Cluster Analysis.
Beverages 10 00078 g002
Figure 3. Correspondence Analysis of aroma and flavor descriptors cited by more than 10%, at least in one wine, as active variables (in red) and those less cited as supplementary variables (in brown). Wines are indicated in blue.
Beverages 10 00078 g003
Figure 4. Cluster Analysis of wines grouped according to (a) their CATA characterization and (b) their sensory descriptors according to wines.
Beverages 10 00078 g004
Figure 5. Frequencies of citation (%) of flavor families according to the wine clusters (I, SB21; II, AL22, SB16, PB12; III, AL17, AR17, AR15, PB20, PB15, PB10, SB13; IV, AL19, AL14, AR11; V, AR10, AR06, PB06).
Beverages 10 00078 g005
Figure 6. Frequencies of citation of the flavor clusters “Freshness” (●) and “Mellowed” (○) for all white wines except SB19. Regression lines: “Freshness”, slope −3.85 ± 0.59, r = −0.860, p < 0.0001; “Mellowed”, slope 3.60 ± 0.34, r = 0.939, p < 0.0001.
Beverages 10 00078 g006
Figure 7. Relations between the average predicted ages and the average color scores of the oldest and youngest wines of each grape variety (-, linear fit; ---, 95% confidence limits; vertical and horizontal bars, standard deviations).
Beverages 10 00078 g007
Figure 8. The effect of age on wine browning measured as the absorbance at 420 nm (-, linear fit; --, 95% confidence limit).
Beverages 10 00078 g008
Figure 9. Flavor and color changes in wines tasted in dark glasses (flavor families: “Freshness”, green; “Mellowed”, orange; “Austere”/“Acidity”, blue; predicted age, black; Abs 420 nm, open circles). Wines were aligned according to decreasing values of “Freshness” perception.
Beverages 10 00078 g009
Figure 10. Hierarchical clustering dendogram of the wines according to their elemental constitutions.
Beverages 10 00078 g010
Figure 11. Biplot of the Multifactorial Analysis illustrative of quantitative variables associated with proper aging using wines grouped by age perception (a) and grape variety (b) (2-propenal stands for 2-propenal, 3-(2,6,6-trimethyl-1-cyclohexen-1-yl)).
Beverages 10 00078 g011
Figure 12. Biplot of the Multifactorial Analysis illustrative of wines grouped by age perception (a) and grape variety (b) using confidence ellipses.
Beverages 10 00078 g012
Table 1. White wines used in this study.
Origin aBrandGrape VarietyVintagesSample Codes
Vinhos Verdes DOC b, Sub-region Monção and Melgaço, PortugalSoalheiroAlvarinho2014, 2017, 2019, 2022AL14, AL17, AL19, AL22
Lisboa DOC, PortugalQuinta do RolArinto2006, 2010, 2011, 2015, 2017AR06, AR10, AR11, AR15, AR17
Alto Adige DOC, ItalyKellerei TerlanPinot Blanc2006, 2010, 2012, 2015, 2020PB06, PB10, PB12, PB15, PB20
Lisboa DOC, PortugalAdega MãeSauvignon Blanc2013, 2016, 2019, 2021SB13, SB16, SB19, SB21
a Local coordinates and altitudes: Soalheiro 42.097446, −8.309966, 400 m; Quinta do Rol 39.217346, −9.252108, 80 m; Cantine Terlan 46.530816, 11.251858, 400–900 m; Adega Mãe 39.048905, −9.295658, 100 m. Information retrieved from winery websites accessed on 6 July 2024: www.soalheiro.com/natural-factors/; www.quintadorol.com/; www.cantina-terlano.com/en/terroir/; www.adegamae.pt/terroir/?lang=en. b Protected denomination of origin.
Table 2. Definitions of sensory attributes used in this study.
AttributeDefinitionRange
Evolutionary statePerception of the age character evolutionToo young–Too old
QualityOverall perception of the level of qualityVery low–Very high
ComplexityPerception of the diversity of aromas and flavorsLow–High
BodyPerception of volume or weight in the palateLight–Full
LingerPersistence of aromas and flavors after tastingShort–Long
FaultyDetection of any sort of off-flavorsNone–A lot
BalancePerception of harmony between aromas and flavorsUnbalanced–Balanced
Table 3. Mean scores of synthetic descriptors of white wines a.
SampleQualityBalanceEvolutionFaultyBodyComplexityLinger
AL144.79 ab5.30 ab5.92 abcd3.73 abc4.634.945.71
AL175.26 ab5.87 a5.34 bcd2.41 bc4.445.095.09
AL195.82 a6.12 a5.34 bcd2.73 abc5.105.335.33
AL226.16 a5.80 a4.85 cd1.50 c5.325.465.86
AR065.27 ab4.06 ab6.93 ab3.87 abc4.836.125.57
AR104.80 ab4.50 ab7.08 ab4.76 ab4.975.455.31
AR115.74 a5.61 a5.76 abcd2.47 bc5.695.875.70
AR155.70 a5.43 a5.26 bcd2.74 abc4.965.535.55
AR174.90 ab4.73 ab6.44 abcd3.99 abc4.635.306.03
PB064.61 ab4.17 ab7.43 a3.82 abc5.324.815.55
PB105.27 ab5.67 a5.43 bcd2.13 bc4.724.384.20
PB125.55 a5.53 a4.88 cd2.13 bc5.475.205.81
PB155.28 ab5.02 ab5.19 bcd2.18 bc5.184.995.30
PB206.01 a5.26 ab4.63 d1.92 bc5.675.646.42
SB135.40 a5.72 a5.50 bcd3.55 abc5.635.506.17
SB164.26 ab4.32 ab6.34 abcd3.53 abc4.034.473.85
SB192.99 b2.82 b6.54 abc6.03 a4.004.635.14
SB215.66 a5.56 a5.33 bcd2.91 abc4.555.245.54
p-value Kruskal–Wallis0.0020.0013.56 × 10−90.0010.24250.2130.100
p-value Tukey–Kramer0.00065 ***0.00066 ***3.3 × 10⁻⁹ ***2.8 × 10⁻⁹ ***
a Different letters in the same column indicate significant differences (p < 0.05). *** p < 0.001.
Table 4. Spearman correlation coefficients (r) among the median scores of the sensory attributes and ages of the wines.
AgeQualityBalanceEvolutionFaultyBodyComplexityLinger
Age
Quality−0.100
Balance−0.3670.522 *
Evolution0.418−0.410−0.490 *
Faulty0.179−0.614 **−0.498 *0.666 **
Body0.490 *0.3160.0840.1710.123
Complexity−0.1370.623 **0.1880.049−0.1750.236
Linger−0.0700.1990.2690.1450.2330.575 *0.223
* p < 0.05, ** p < 0.01.
Table 5. Average age prediction according to the visual condition and respective color score.
SampleReal AgePredicted Age (Dark Glass)Predicted Age (Transparent Glass)Color Score (cm)
AL1495.6 ± 4.65.4 ± 3.85.2 ± 1.9
AL1764.3 ± 3.2
AL1944.7 ± 3.8
AL2213.5 ± 2.91.8 ± 1.11.3 ± 1.5
AR061710.1 ± 7.310.0 ± 4.57.6 ± 1.5
AR10139.8 ± 6.2
AR11125.4 ± 2.5
AR1585.8 ± 4.8
AR1767.2 ± 3.04.7 ± 2.54.3 ± 1.4
PB06179.0 ± 4.96.4 ± 4.95.7 ± 1.8
PB10135.0 ± 3.8
PB12113.7 ± 2.1
PB1584.1 ± 2.9
PB2034.1 ± 2.63.2 ± 3.21.8 ± 0.9
SB13105.7 ± 4.43.4 ± 1.63.3 ± 1.0
SB1676.0 ± 3.4
SB1947.8 ± 7.2
SB2124.2 ± 3.72.1 ± 1.31.8 ± 0.8
Table 6. Pearson correlation coefficients among the ages and elemental compositions of wines.
ElementAlvarinhoArintoPinot BiancoSauvignon Blanc
Na0.8100.8280.874−0.139
K0.978 *0.4980.5730.193
Ca0.988 *0.388−0.6650.182
Mg0.9140.552−0.508−0.883
P0.941−0.185−0.2750.245
S0.7590.482−0.348−0.089
Fe0.966 *0.440−0.196−0.219
Cu−0.255−0.380−0.073−0.403
Zn0.960 *0.7210.4000.712
Mn0.2300.3690.3110.161
B0.9010.8080.961 **−0.666
Pb0.2530.032−0.1450.098
Cr0.928−0.3930.214−0.753
Ni−0.4660.7540.8000.686
Cd−0.601−0.3240.092−0.740
* p < 0.05, ** p < 0.01.
Disclaimer/Publisher’s Note: The statements, opinions and data contained in all publications are solely those of the individual author(s) and contributor(s) and not of MDPI and/or the editor(s). MDPI and/or the editor(s) disclaim responsibility for any injury to people or property resulting from any ideas, methods, instructions or products referred to in the content.

