Article

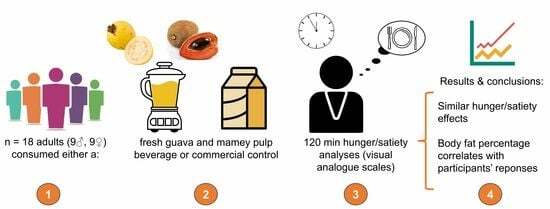
A Freshly Prepared Guava and Mamey Beverage Induces Subjective Satiety in Healthy Adults, Similar to a Commercial Control

by
Beatriz Haydee Belmonte-Herrera
1,
J. Abraham Domínguez-Avila
2,
Jesús Fernando Ayala-Zavala
1,
Abraham Wall-Medrano
3,
Marcelino Montiel-Herrera
4 and
Gustavo A. González-Aguilar
1,*
1
Centro de Investigación en Alimentación y Desarrollo A. C., Carretera Gustavo Enrique Astiazarán Rosas No. 46, Col. La Victoria, Hermosillo 83304, Mexico
2
SECIHTI, Centro de Investigación en Alimentación y Desarrollo A. C., Carretera Gustavo Enrique Astiazarán Rosas No. 46, Col. La Victoria, Hermosillo 83304, Mexico
3
Instituto de Ciencias Biomédicas, Universidad Autónoma de Ciudad Juárez, Anillo Envolvente del PRONAF y Estocolmo s/n, Ciudad Juárez 32310, Mexico
4
Departamento de Medicina y Ciencias de la Salud, Universidad de Sonora, Blvd. Luis Encinas y Rosales s/n, Col Centro, Hermosillo 83000, Mexico
*
Author to whom correspondence should be addressed.
Beverages 2025, 11(2), 35; https://doi.org/10.3390/beverages11020035
Submission received: 30 January 2025 / Revised: 21 February 2025 / Accepted: 5 March 2025 / Published: 10 March 2025
(This article belongs to the Special Issue Opportunities and Challenges for Functional and Medicinal Beverages)

Abstract

:
Freshly made, fruit-based beverages may be healthy alternatives to traditional sugar-rich soft drinks due to their reported health benefits. Fruits in general have been reported to promote satiety, but the effects of guava and mamey are yet to be thoroughly studied. The aim of the present work was to document changes in the subjective satiety exerted by a freshly prepared beverage made from guava and mamey pulps in healthy adults, and to compare them with those of a commercial beverage. Eighteen apparently healthy, normoweight, 25–30-year-old individuals (nine men, nine women) participated in this study; their subjective hunger/satiety profile was assessed using 10 cm visual analogue scales. Hunger and prospective food consumption decreased in response to consuming both beverages, while fullness and satisfaction increased. There were no significant differences in any variable analyzed, when comparing the guava and mamey beverage with the control during 120 min following their intake. Likewise, when individually analyzing the responses of men and women, the aforementioned variables remained similar. The participants’ body composition (body fat in particular) appears to be the main anthropometric variable that was significantly associated with their various hunger/satiety responses when consuming both beverages, for both men and women. Our findings therefore suggest that the subjective satiety responses of consuming a freshly prepared guava and mamey beverage are significantly associated with the consumers’ body composition, mainly body fat percentage. More research is needed to determine the precise mechanism by which guava, mamey, and/or their combination can alter satiety in healthy human subjects.

Graphical Abstract

1. Introduction

Consumer demand for healthy and ready-to-drink beverages has increased significantly in recent years [1]. Functional foods and beverages are defined as those that can have a role beyond supplying energy and nutrients or providing gastronomic pleasure and are able to exert actions that promote the consumer’s health [2]. Ongoing research efforts are aimed at identifying the specific health properties of different products, while also preserving palatability [3]. Sugar-rich beverages are highly consumed in the Western world, where 6.9% and 6.1% daily energy intakes have been estimated for men and women, respectively, and approximately 46% of added sugars [4]. Data for Latin America suggest that 90–166 kcal/day/person is consumed from these beverages, which is approximately 4.5–8.3% of the total energy consumed for a 2000 kcal diet, with Brazil consuming 90 kcal/day/person, followed by Argentina (135 kcal/day/person), Mexico (158 kcal/day/person), and Chile (166 kcal/day/person) [5]. Due to the negative effects associated with the regular consumption of these beverages, including obesity and its comorbidities, various strategies have been proposed, including increased taxation on them. In Mexico, Pedraza et al. [6] report that an 8% tax is levied on all non-essential foods with ≥275 kcal/100 g; black octagonal warnings are also printed on the labels of unhealthy products (such as those high in calories or sugar), which were introduced to warn consumers about their nutritional profile, similarly to the method employed in Chile and other Latin American countries [7]. Another strategy is to promote the consumption of healthier alternatives which, in the case of beverages, can include preparing fresh fruit-based beverages with no added sugar. Mexico is a producer of multiple fruits that can be used for this purpose, potentially helping consumers decrease their spending since, according to Batis et al. [8], the cost of unhealthy foods and beverages in Mexico has shown a higher increase in recent years, as compared to healthier alternatives.
Fresh beverages can be prepared from a variety of ingredients, including fruits, whose organoleptic characteristics and health effects on the consumer have been widely reported [9]. Guava (Psidium guajava L.) is a lesser utilized tropical fruit, whose cultivation is economically important in different regions, including Mexico and Southeast Asia [10]. Its consumption has been associated with exerting certain health benefits like controlling diabetes, dental caries, and others [11]. Such bioactivities can be attributed to its bioactive profile, which includes vitamin C, dietary fiber, flavonoids, anthocyanins, and others [12]. Mamey (Pouteria sapota) is another lesser consumed fruit that is cultivated in Mexico and Central America. The bioactive profile of mamey contains mainly carotenoids that give its pulp a distinctive red-orange coloration; sixty-two carotenoids and carotenoid esters in saponified and non-saponified mamey pulp extracts have been identified, as well as twenty-three compounds that belong to seventeen different chemical classes of carotenoids [13]. In addition, p-coumaric acid, catechin, epicatechin, gallocatechin, gallocatechin-3-gallate, catechin-3-O-gallate, and other phenolics have been identified in it [14].
Hunger can be described as the overall drive to eat food that manifests in searching/foraging behaviors, while satiety counters hunger and the aforementioned behaviors [15]. The amount and type of food consumed in each meal will influence satiety, both its time of onset and duration [16]. Fruits and vegetables have been reported to promote satiety, according to increases in subjective satiety, as measured by subjective ratings of hunger and fullness. For example, it has been shown that eating fruit before a meal can reduce overall energy intake [17]. Phenolic compounds are a class of highly bioactive compounds present in foods and vegetables, which have been recently considered for their satiety-inducing potential. For example, mango phenolics have been shown to induce satiety in healthy and diabetic Wistar rats [18,19]. Fruit-based beverages rich in phenolics may induce satiety, but the field requires further study, particularly for less consumed fruits like guava and mamey.
We previously optimized a fresh beverage from guava and mamey pulps, in order to obtain the highest possible concentration of phenolics, carotenoids, and antioxidant capacity, whose composition may exert favorable effects on satiety in healthy adults [20]. The objective of the present work was to measure the subjective satiety responses of healthy adults, after consuming a freshly prepared guava and mamey beverage, and to compare them with an industrially processed commercial beverage. We hypothesized that a freshly made guava and mamey beverage induces satiety in healthy, normoweight adult consumers, which could aid in promoting healthy dietary habits. The novelty of the present work lies in the use of understudied fruits (guava and mamey), whose nutritional potential remains to be fully explored. The present data could support further experiments to delve further into the satiety-inducing potential of these and other fruits.

2. Materials and Methods

2.1. Fruit Pulps and Reagents

Fresh commercially ripe guava fruits with homogenous color were purchased in a local market in the city of Hermosillo, Mexico; they were carefully selected to avoid apparent defects due to handling or bacterial/fungal contamination. Frozen mamey pulp (−20 °C, already peeled) from commercially ripe fruits was also purchased from a local market in the city of Hermosillo, Mexico; samples were carefully selected to avoid any damage and/or contamination. Guavas were transported to the laboratory and hand-washed under running tap water to eliminate any surface contaminants. Seeds were manually removed from the pulp and discarded; the obtained pulp was immediately frozen at −20 °C and stored until use. Pulps were kept frozen and thawed only before using them to prepare the beverage. All reagents used were purchased from Sigma-Aldrich (St. Louis, MO, USA).

2.2. DPPH Radical Scavenging Activity

A 2,2-diphenyl-1-picrylhydrazyl (DPPH) solution was prepared by dissolving the radical in pure methanol (0.025 mg/mL). Methanol was then added slowly (dropwise) and the solution mixed, until its absorbance (515 nm) was fixed to 0.70 ± 0.02. This was considered the DPPH working solution. After that, 20 μL of beverage was pipetted into a microplate well, and 280 μL of the DPPH working solution was then added. It was incubated under dark conditions for 30 min. The absorbance was read at 515 nm in a microplate reader (FLUOstar Omega v. 1.20, BMG Labtech, Offenburg, Germany). A blank was prepared by adding distilled water instead of the beverage, and serial dilutions of Trolox were used as standards (0.01–0.10 mg/mL, R2 = 0.9967); the blank and standards were read under the same conditions [21,22]. Experiments were performed in triplicate, and results are expressed as mean ± standard deviation of mg of Trolox equivalents (TEs)/100 mL.

2.3. ABTS Assay

A 2,2′-azinobis-(3-ethylbenzothiazoline-6-sulfonic acid) (ABTS) stock solution was prepared from 7 mM ABTS and 2.45 mM potassium persulfate, mixed at a volume ratio of 1:1, and then incubated under dark conditions for 16 h at room temperature. The ABTS working solution was prepared by diluting the stock solution with ethanol to an absorbance of 0.70 ± 0.02 at 734 nm. The sample (5 μL) was mixed with 245 μL of ABTS working solution and, after 5 min of incubation at room temperature, the absorbance of the reaction mixture was read at 734 nm [22,23]. The percentage of absorbance inhibition at 734 nm was calculated, using distilled water as blank and Trolox as standard (0.01–0.10 mg/mL, R2 = 0.9903). Experiments were performed in triplicate, and results are expressed as mean ± standard deviation of mg TEs/100 mL.

2.4. Ferric Reducing Antioxidant Power (FRAP) Assay

The FRAP solution consisted of a mixture of 5 mL of acetate buffer (300 mM, pH 3.6), 500 μL of 2,4,6-tri-(2-pyridyl)-S-triazine (TPTZ, 10 mM in 40 mM HCl), and 500 μL of FeCl3·6H2O (20 mM). Then, 20 μL of sample was pipetted into a microplate well, and 280 μL of the FRAP reagent was added. It was incubated for 30 min in the dark, and its increase in absorbance was read at 595 nm using a spectrophotometer (FLUOstar Omega v. 1.20, BMG Labtech, Offenburg, Germany) [22,24]. The final absorbance of each sample was compared to those obtained from a Trolox standard curve (0.01–0.10 mg/mL, R2 = 0.9887). Experiments were performed in triplicate, and results are expressed as mean ± standard deviation of mg TEs/100 mL.

2.5. Total Phenolic Content (TPC) by Fast Blue BB (FBBB)

For FBBB, the method of Medina [25] was followed. In total, 1 mL of beverage was mixed with 100 µL FBBB 0.1% solution; it was vortexed for 1 min, and 100 µL of 5% NaOH was then added. The solution was allowed to react for 90 min at room temperature under dark conditions. Then, 200 µL was pipetted into a microplate well and read at 420 nm in a microplate reader (FLUOstar Omega v. 1.20, BMG Labtech, Offenburg, Germany). Experiments were performed in triplicate, and a standard curve of gallic acid was used to determine the concentration of TPC (0.01–0.10 mg/mL, R2 = 0.9984). Data were expressed as mean ± standard deviation of mg gallic acid equivalents (GAEs)/100 mL.

2.6. Vitamin C, Carotenoids, and Total Fiber

Vitamin C was identified and quantified in an ultra-performance liquid chromatography system with a diode array detector (UPLC-DAD; Acquity, Waters Co., Milford, MA, USA), as reported by Robles-Sánchez et al. [26], with modifications. An Acquity BEH C18 column (Waters, Milford, MA, USA) (1.7 µm, 3.0 × 100 mm) at 30 °C was used. Sample injection and elution (1 µL) were performed in 6 min at a flow rate of 0.20 mL/min and read at 245 nm. A solvent system was used, where A was methanol 100% and B was 5 mM potassium phosphate (KH2PO4). The following gradient was used: 0.0–1.0 min 5% A 95% B, 1.0–2.0 min 15% A 85% B, 2.0–3.0 min 35% A 65% B, and 3.0–6.0 min 5% A and 95% B. Results are expressed as mg/100 mL, according to a calibration curve (0.1–1.0 mg/mL, R2 = 0.9964).
Carotenoids were extracted with hexane and reconstituted in ethanol as previously described [27]. A 1220 Infinity apparatus with a diode array detector was used (Agilent Technologies, Palo Alto, CA, USA), along with a C30 carotenoid column (3 μm, 150 × 3.0 mm, YMC, Wilmington, NC, USA). Methanol/tert-butyl methyl ether/water (85:12:3, v/v/v, with 1.5% ammonium acetate in water) was used as solvent A, and methanol/tert-butyl methyl ether/water (8:90:2, v/v/v, with 1% ammonium acetate in water) was used as solvent B. A calibration curve was used to quantify carotenoids (0.1–2.0 μg/mL, R2 = 0.9973 for α-carotene; and 0.1–4.0 μg/mL, R2 = 0.9981 for β-carotene).
Total fiber was quantified according to an official AOAC method [28].

2.7. Beverages

The functional guava and mamey beverage reported here was developed and optimized for increased content of bioactive compounds and antioxidant capacity, as previously reported [20]. Guava and mamey pulps (31.09 and 33.65 g, respectively) were blended for 2 min in a 600 W immersion mixer (NutriBullet, Los Angeles, CA, USA) with 100 mL of purified water. Purified water was then added to reach 350 mL of total volume. The pulps were thawed up to room temperature during preparation (24 °C). A similar but industrially processed commercially available guava- and orange-flavored beverage was purchased in a local supermarket and used as a control. The control beverage was chosen due to its similarity in taste to the one prepared and to its high in-store availability in the area where this study was conducted; thus, the participants of this study were therefore likely to have consumed it previously (or a similar one). A guava- and mamey-based commercial beverage was not locally available; thus, the guava and orange one was selected in order to minimize differences due to fruit flavors or like/dislike preferences that could have confounded the participants’ subjective ratings.

2.8. Participants

Approval for human experimentation reported in this study was first obtained from the Institutional Ethics Committee of the Research Center for Food and Development (CEI-020-3/2022, 1 March 2023). The protocol is in accordance with applicable national and international regulation, as well as with the Helsinki declaration. Eighteen apparently healthy, 25–30-year-old individuals (nine men, nine women) participated in this study. They were postgraduate students from the research center where this study was performed and recruited through institutional email, social media, and in-person invitations.
Subjective satiety can be impacted by numerous intrinsic (such as age, health status, dietary habits, and others) and extrinsic (such as time of day, environmental conditions, and others) factors, making it crucial to recruit individuals whose satiety would not be altered by variables other than those of this study and to perform it under identical conditions in a controlled environment.
Potential participants were made aware that they could not be considered for this study if they had any condition that could affect their satiety; thus, exclusion criteria were subjects who reported suffering from diabetes, were under treatment to reduce their blood glucose, diseases of the digestive system (such as celiac disease, Crohn’s disease, etc.), recent surgery, chronic diseases (such as cardiovascular, thyroid, or kidney), pregnancy, breastfeeding, being postmenopausal, being smokers, cancer, dyslipidemia, allergies to any of the components of the beverages (guava, mamey, or orange), consumed probiotics, having smoked, or being obese (according to a body mass index (BMI) ≥ 30 kg/m2). Moreover, female participants started this study during the follicular phase of their menstrual cycle (days 3 to 11), in order to control potential fluctuations in their metabolism or subjective satiety due to hormonal variation [29].
Most potential participants self-determined if they were suitable or not to participate. Those who determined that they did fulfill the criteria required to participate were individually interviewed in order to corroborate that they did in fact meet the study requirements. They were then given a detailed explanation of what was required of them to participate, regarding the time dedicated to the experiment and answering hunger/satiety-related questions. They were informed that their answers would be anonymously published in a scientific paper. No financial compensation or otherwise was offered to them for their participation; they were also informed that they could withdraw from this study at any point without repercussion due to any reason. All participants gave written consent after the experimental protocol had been explained to them, and after they agreed to the conditions required to participate.

2.9. Study Design

Participants were tested on two different occasions separated by one week. They were instructed to perform no exceedingly vigorous or non-routine physical activity the day prior, as well as to refrain from alcohol consumption. On the two test days, they arrived at the laboratory after an overnight fast at 09:00 h by car or bus, and anthropometric data were then collected. Participants’ weight, BMI, and percentage of muscle and fat were carried out on a full body composition sensing monitor and scale (OMRON HBF-514C, Yangzhou, China). After that, a 24 h dietary recall instrument was applied to assess their habitual dietary intake, and at approximately 09:40 h the first visual analogue scale (VAS) was filled in (time 0; see the following section). The guava and mamey beverage was served (350 mL), and the participants were indicated to drink it within 5 min. After 15, 30, 60, 90, and 120 min, the VAS was filled in. The protocol was the same on the second visit (one week after the first one), except for the anthropometric data that had already been collected the week prior. The control beverage was served this time, and the VAS was filled in at the same times.
During the 120 min of this study, participants could read, watch TV (light entertainment, and no stressful, food, or food-related topics were mentioned), or talk with each other, as long as the conversation was not stressful and did not involve food, appetite, or any related issues. They were comfortably seated under standard fluorescent lighting and a controlled climate (24 °C). Participants were allowed to consume water and go to the bathroom at will. At the end of the analysis, a complimentary meal was offered to the participants, which could be rejected if they so desired.

2.10. Satiety Analyses

The participants’ subjective satiety profile was assessed using a 10 cm VAS, according to four specific questions related to hunger (How hungry do you feel?), satiety (How satiated [i.e., pleasantly satisfied] are you?), fullness (How full do you feel?), and prospective food consumption (How much food do you think you could eat right now?), which were anchored by the terms “not at all” (zero) and “extremely” (ten) [30]. The aforementioned subjective profile was assessed in the same participant before drinking the beverage (time 0) and after 15, 30, 60, 90, and 120 min of consuming it. The questionnaires were made as small booklets that showed the four questions at the same time. Participants did not discuss or compare their ratings with each other and could not refer to their previous ratings when marking the VAS for each time. The area under the curve (AUC) was calculated for each of the four questions, using the trapezoidal method.

2.11. Statistical Analyses

Eighteen participants were included in this study in order to obtain a power of 0.8, while looking for a difference of 10% in the mean appetite ratings using the VAS [31]. The postprandial response curves of the appetite ratings and the rating of specific desires were compared by an analysis of variance (ANOVA) and Tukey’s test with time as a factor [32]. A Pearson correlation analysis was performed in order to determine potential correlations between variables. Results were considered significant when p < 0.05.

3. Results and Discussion

The composition of both beverages is shown in Table 1. It is apparent that the guava and mamey beverage had a higher fiber content; the fiber content of a food or beverage has been reported as an important nutrient related to satiety, since it delays gastric emptying and nutrient digestion and absorption, which contribute to satiating the consumer [33]. Regarding their micronutrients, the vitamin C content of the guava and mamey beverage is higher than that of the control, while the opposite is true for their phenolic content. Carotenes are notably higher in the guava and mamey beverage, which can likely be attributed to mamey, since it is a rich source of numerous carotenoids, including some that are relatively uncommon [34]. Antioxidant capacity is higher in the control than in the guava and mamey beverage, which may be attributed to the higher phenolic content mentioned previously. The radicals used in different antioxidant capacity methods react with compounds through different molecular mechanisms [35]; the present results suggest that they may have been more sensitive to soluble compounds, rather than lipophilic carotenoids, since the higher carotenoid content apparently contributed less to the overall antioxidant capacity of the beverages. It should also be mentioned that the guava and mamey beverage administered was previously optimized for antioxidant compounds, antioxidant capacity, and being as palatable as possible, as previously reported [20].
Regarding the satiety effects, all the recruited participants completed the experimental trial successfully; they were administered the experimental beverage, and then the control after one week. They were 26.5 ± 1.61 years old and had a BMI of 23.92 ± 1.07 kg/m2. The anthropometric data of the participants are shown in Table 2.
In the present study, the subjective satiety profile of the participants was not accompanied by significant differences in hunger, satiety, fullness, or prospective food consumption, when analyzed during 120 min following beverage consumption. Figure 1 shows the results from the VAS used to determine the satiety profile of the participants after consuming the experimental guava and mamey beverage and the control.
When asked “how hungry do you feel?” (Figure 1A), it is apparent that all the participants had an initial rating of approximately 6.5, mostly due to them being in a fasted state; after consuming both beverages, their hunger levels decreased to approximately 4.5, and remained stable up to 60 min. A slight increase was apparent after 90 and 120 min, up to approximately 5.5 by the end of the experimental period; thus, their hunger did not reach fasting levels.
When asked “how satiated do you feel?” (Figure 1B), participants started with a value of approximately 4.5 before consuming both beverages; this rating remained up to 120 min later. Interestingly, the control remained mostly stable, while the guava and mamey beverage had some downward fluctuations, mainly after 30 min and 90 min.
When asked “how full do you feel?” (Figure 1C), participants started at low values of approximately 2.0; after consuming the beverages, their ratings immediately increased up to approximately 4.0 (15 min) and remained there until 30 min. After 60, 90, and 120 min, the participants’ ratings showed a similar decreasing tendency, from approximately 4.0 at their maximum at 15 min, down to approximately 3.0 after 120 min.
When asked “how much food do you think you could eat right now?” (Figure 1D), participants had a high initial value of approximately 7.0 (time 0); after consuming the beverages, their ratings decreased to approximately 5.5 and remained stable up to 30 min. A slight but constant tendency was observed after 60, 90, and 120 min, during which the participants’ prospective food consumption increased. In contrast to the previously mentioned questions, the participants’ ratings for this one did reach similar values to the ones reported before consuming the beverages (approximately 7.0).
No statistically significant differences were determined between beverages for the aforementioned subjective variables.
The sensory attributes of a beverage can affect the feeling of fullness that it exerts on the consumer. Researchers have recently investigated the possible contribution of non-nutritive compounds in foods to perceived satiety, and there is evidence that caffeine and phenolic compounds favorably influence it [36]. For example, fiber-rich beverages were consumed by 19 volunteers; the authors report that, although not statistically significant on all measurements, the results consistently suggest the effect of fiber in beverages regarding subjective satiety. Moreover, the guar gum beverage (7.8 g of fiber) had the strongest effect on subjective satiety, as compared to the control without fiber [37]. In the present study, the guava and mamey and control beverages had a fiber content of 9.17 and 2.88 g/100 g, respectively, and the satiated sensation was maintained over time. Other authors mention that consumption of a beverage enriched with a konjac-mannan/xanthan gum mixture significantly decreased the consumers’ appetite score, as compared to two other beverages, and increased the fullness sensation, as compared to the guar gum/xanthan gum beverage [38].
The AUC of the four parameters analyzed (hunger, satiety, fullness, and prospective food consumption) is shown in Figure 2.
Since the responses of all participants were similar on all four questions, we decided to analyze them by sex, in order to determine if men and women would respond differently to consuming the beverages. The results are shown in Figure 3 and Figure 4. Nevertheless, the pattern is similar to that obtained when they were grouped together, since no significant differences were found between men and women.
Figure 3 shows the results from the VAS used to determine the satiety profile of the participants, grouped by sex, after consuming the experimental guava and mamey beverage and the control. When asked “how hungry do you feel?” (Figure 3A), it is apparent that men had an initial rating of approximately 8.0 and women of 5.8, mostly due to them being in a fasted state; after consuming the beverages (both the guava and mamey beverage and the control), their hunger levels decreased to 5.0 and 3.7 for men and women, respectively, and they remained stable up to 45 min. A slight increase was apparent after 90 and 120 min, up to 6.6 (control) and 6.0 (guava and mamey) in men and 5.3 (control) and 4.5 (guava and mamey) in women by the end of the experimental period; thus, their hunger did not reach fasting levels.
When asked “how satiated do you feel?” (Figure 3B), men started with values of 2.0 and women of 3.5 before consuming the control beverage, and with values of 1.8 and 2.7 before consuming the guava and mamey beverage; after 15 min, an increased satiety was observed in both sexes, and at 120 min the satiated levels went back almost to their initial levels.
When asked “how full do you feel?” (Figure 3C), participants started at low values from 1.3 to 2.0 for both sexes and beverages; after 15 min of consuming the beverages, their ratings immediately increased to 3.4–3.7 for women who consumed both beverages, and men who consumed the guava and mamey beverage. Men who consumed the control beverage reached a value of 4.7 (15 min) and remained stable until 90 min. At the end (120 min), their fullness values were from 3.2 to 2.8, which were higher than at the starting point.
When asked “how much food do you think you could eat right now?” (Figure 3D), participants had high initial values from 6.1 to 8.0 (time 0); after consuming the beverages, men’s ratings decreased to 5.7 (control) and 5.9 (guava and mamey), and women’s went to 4.9 (control) and 5.1 (guava and mamey). A slight but constant tendency was observed after 60, 90, and 120 min, during which the participants’ prospective food consumption increased but did not reach the initial values.
The AUC for the aforementioned questions (hunger, satiety, fullness, and prospective food consumption) grouped by sex is shown in Figure 4 where, as mentioned for Figure 3, no significant differences are shown between beverages.
Our data suggest that a freshly prepared fruit-based beverage, as well as a commercially available industrially processed one, similarly altered postprandial appetite scores or suppressed the desire to consume food in a group of apparently healthy adults.
Beverages rich in bioactive compounds like phenolic compounds and carotenoids are being developed for general consumption and are a current trend due in part to their effects that can enhance satiety [39,40]. The present study was designed in order to investigate the postprandial effects of an optimized beverage rich in phenolic compounds, carotenoids, and fiber [20], since these compounds (mainly fiber) have been associated with an increased satiety and decreased hunger. Similar results have shown changes in hunger and fullness after the consumption of phenolic-enriched beverages, and some studies have even reported suppression of eating intention when compared with either high-sucrose or zero/low-energy control beverages [41]. Regarding fiber in beverages, a beverage rich in fiber has increased viscosity and tends to result in higher satiety ratings, while the addition of fruit purée to another one has been found to increase its satiating power [42]. Results obtained by other authors show that a single dose of viscous dietary fiber increases post-meal satiety, as compared to low-fiber controls [43,44], although not all studies report an effect on subjective appetite.
In order to determine potential correlations between variables, a Pearson correlation analysis was performed between the participants’ anthropometric data and the observed subjective hunger/satiety responses; results are shown in Table 3.
When analyzing all participants together (Table 3, n = 18), it is apparent that their age positively correlates with the AUC of their satiety, meaning that older participants reported a higher satiety when consuming both beverages. Weight only correlated significantly and positively with the hunger response to the control beverage, while BMI was apparently not significant in any response, although it was negative for almost all the variables analyzed. Body composition appeared to be an important determinant for how the participants reported hunger and satiety when consuming the control beverage; specifically, body fat correlated negatively with hunger and satiety, while muscle mass correlated positively with the said variables.
When the same correlation analysis was performed for men (Table 4, n = 9), it appears that the most significant correlations disappear. For the control beverage, the men’s hunger response negatively and significantly correlated with their body fat, their satiety response positively correlated with their age, while their body fat negatively correlated with their prospective food consumption. No anthropometric variable appeared to be significant when consuming the guava and mamey beverage.
Finally, when the responses of women (n = 9) were analyzed separately (Table 5), it appears that age, weight, or BMI were not significantly correlated with any response when consuming either beverage. The main determinant for their satiety and fullness responses was apparently body fat, which negatively and significantly correlated with the said variables when consuming both beverages. Muscle mass was positively and significantly correlated with the fullness response when consuming the guava and mamey beverage.
Taken together, correlation analyses suggest that the main anthropometric variable associated with subjective responses when consuming both beverages appears to be body composition, body fat in particular. Age and weight appear to be less relevant, potentially due to all the participants being young, healthy, and normoweight. Interestingly, BMI was apparently not associated with any subjective hunger/satiety response. Age, weight, and BMI could be significant factors that regulate subjective hunger/satiety when considering younger or older populations, or under- or overweight individuals, whose responses may differ from the participants of the present work. Caution is therefore required when extrapolating these findings to other populations.
Our data suggest that the adiposity of the participants exerted an important role on their subjective hunger/satiety responses. White adipose tissue is known to be the site of leptin secretion (an important anorexigenic peptide hormone); thus, an individual with a higher body fat percentage will secrete more leptin to maintain an appropriate energy balance [45]. Since leptin itself was not quantified in the present study, it cannot be conclusively established that it was the main molecule responsible for such actions; nevertheless, it has been shown to regulate short-term satiety [46]. Further research is therefore required to validate the precise molecular mechanism by which body composition participates in the acute subjective hunger/satiety responses documented in the present work.
The current work has some strengths and limitations. Some of the most notable strengths include the careful selection of participants and their commendable adherence to the protocol, which is likely due to them being postgraduate students themselves, who value scientific rigor. The conditions under which the experiment was performed were also homogenized as much as possible, including time of day, temperature, lighting conditions, noise levels, and others, in order to avoid potential disruptions to the participants’ hunger or satiety due to external factors. Some limitations are also acknowledged, including a brief time period during which the results were analyzed, since an effect beyond 120 min is also a possibility. Responses from young, apparently health participants may also differ from those of other age groups, for example, due to variables like basal metabolic rates, dietary habits, and those with health issues. Since adipose mass tends to increase with age and diet, changes in this parameter may be a potential source of variation in older populations. Comparing the satiating effects of the beverage against a sugar-rich soft drink with no fiber or micronutrients may also provide additional information. A single dose may not be sufficient to determine significant changes; thus, repeated consumption of the beverage could reveal differences that were not apparent after ingesting it only once. Increasing the amount of beverage consumed and/or administering it as part of a standard meal could be also a good starting point for future investigations. Interindividual variability was high, which can be expected when subjective measurements are taken. In this sense, an objective hunger/satiety measurement may also contribute to finding additional information. For example, hormone quantification (e.g., insulin, glucagon-like peptide-1, or others) throughout the 120 min may give an objective measurement with potentially less variability. Postprandial glycemia could be analyzed in parallel in order to determine if glucose absorption has an effect on the participants’ subjective responses, therefore providing a more thorough understanding of the relationship between them.

4. Conclusions

A freshly prepared guava- and mamey-based beverage was administered to eighteen apparently healthy adults; their hunger/satiety profiles were compared to those of an industrially processed, commercially available beverage. Hunger and prospective food consumption decreased in response to consuming both beverages, while fullness and satisfaction increased, although no significant differences were determined. Body composition (body fat in particular) appears to be the main anthropometric variable associated with their various hunger/satiety responses when consuming both beverages. Our findings therefore suggest that a freshly prepared beverage exerted similar effects to those of a commercial one. Caution must be exerted when extrapolating these findings to individuals who do not meet the criteria for inclusion in the present study, for example, of a different age group, higher or lower BMI, or others. Further studies could advance the field by, for example, considering some of the limitations discussed in the present work, including different age groups, measuring objective markers, and a longer experimental period among others. These data further add to a growing body of evidence regarding the effect of fruit-based beverages on the consumer’s subjective satiety.

Author Contributions

Formal analysis, investigation, writing—original draft preparation, B.H.B.-H.; conceptualization, formal analysis, investigation, writing—review and editing, supervision, project administration, J.A.D.-A.; writing—review and editing, supervision, project administration, J.F.A.-Z., A.W.-M., and M.M.-H.; conceptualization, supervision, project administration, funding acquisition, G.A.G.-A. All authors have read and agreed to the published version of the manuscript.

Funding

This research received no external funding. The APC was funded in part by CIAD.

Institutional Review Board Statement

The study was conducted in accordance with the Declaration of Helsinki, and approved by the Institutional Ethics Committee of the Research Center for Food and Development (CEI-020-3/2022, 1 March 2023).

Informed Consent Statement

Informed consent was obtained from all subjects involved in the study.

Data Availability Statement

Data are contained within the article. Further inquiries can be directed to the corresponding author.

Conflicts of Interest

The authors declare no conflicts of interest.

Abbreviations

The following abbreviations are used in this manuscript:
ABTS2,2′-azinobis-(3-ethylbenzothiazoline-6-sulfonic acid)
ANOVAanalysis of variance
AUCarea under the curve
BFbody fat
BMIbody mass index
DPPH2,2-diphenyl-1-picrylhydrazyl
FBBBfast blue BB
FRAPferric reducing antioxidant power
GAEsMMgallic acid equivalentsmuscle mass
TEsTrolox equivalents
TPCtotal phenolic content
TPTZ2,4,6-tri-(2-pyridyl)-S-triazine
UPLC-DADultra-performance liquid chromatography system with a diode array detector
VASvisual analogue scale

References

  1. Ahmed, M.R. Household consumption expenditure behaviour towards outside ready-made food: Evidence from Bangladesh. Heliyon 2023, 9, e19793. [Google Scholar] [CrossRef]
  2. Gupta, A.; Sanwal, N.; Bareen, M.A.; Barua, S.; Sharma, N.; Olatunji, O.J.; Nirmal, N.P.; Sahu, J.K. Trends in functional beverages: Functional ingredients, processing technologies, stability, health benefits, and consumer perspective. Food Res. Int. 2023, 170, 113046. [Google Scholar] [CrossRef] [PubMed]
  3. Cong, L.; Bremer, P.; Mirosa, M. Functional Beverages in Selected Countries of Asia Pacific Region: A Review. Beverages 2020, 6, 21. [Google Scholar] [CrossRef]
  4. Meng, Y.T.; Li, S.Q.; Khan, J.; Dai, Z.J.; Li, C.; Hu, X.S.; Shen, Q.; Xue, Y. Sugar- and Artificially Sweetened Beverages Consumption Linked to Type 2 Diabetes, Cardiovascular Diseases, and All-Cause Mortality: A Systematic Review and Dose-Response Meta-Analysis of Prospective Cohort Studies. Nutrients 2021, 13, 2636. [Google Scholar] [CrossRef] [PubMed]
  5. Carriedo, A.; Koon, A.D.; Encarnación, L.M.; Lee, K.; Smith, R.; Walls, H. The political economy of sugar-sweetened beverage taxation in Latin America: Lessons from Mexico, Chile and Colombia. Global. Health 2021, 17, 5. [Google Scholar] [CrossRef]
  6. Pedraza, L.S.; Popkin, B.M.; Adair, L.; Robinson, W.R.; Taillie, L.S. Mexican households’ food shopping patterns in 2015: Analysis following nonessential food and sugary beverage taxes. Public Health Nutr. 2021, 24, 2225–2237. [Google Scholar] [CrossRef]
  7. Contreras-Manzano, A.; Cruz-Casarrubias, C.; Munguía, A.; Jáuregui, A.; Vargas-Meza, J.; Nieto, C.; Tolentino-Mayo, L.; Barquera, S. Evaluation of the Mexican warning label nutrient profile on food products marketed in Mexico in 2016 and 2017: A cross-sectional analysis. PLoS Med. 2022, 19, e1003968. [Google Scholar] [CrossRef]
  8. Batis, C.; Gatica-Domínguez, G.; Marrón-Ponce, J.A.; Colchero, A.; Rivera, J.A.; Barquera, S.; Stern, D. Price Trends of Healthy and Less Healthy Foods and Beverages in Mexico from 2011–2018. J. Acad. Nutr. Diet. 2022, 122, 309–319.e16. [Google Scholar] [CrossRef]
  9. Balthazar, C.F.; Santillo, A.; Guimaraes, J.T.; Capozzi, V.; Russo, P.; Caroprese, M.; Marino, R.; Esmerino, E.A.; Raices, R.S.L.; Silva, M.C.; et al. Novel milk-juice beverage with fermented sheep milk and strawberry (Fragaria × ananassa): Nutritional and functional characterization. J. Dairy Sci. 2019, 102, 10724–10736. [Google Scholar] [CrossRef]
  10. Angulo-López, J.E.; Flores-Gallegos, A.C.; Torres-León, C.; Ramírez-Guzmán, K.N.; Martínez, G.A.; Aguilar, C.N. Guava (Psidium guajava L.) Fruit and Valorization of Industrialization By-Products. Processes 2021, 9, 1075. [Google Scholar] [CrossRef]
  11. Fu, L.; Lu, W.Q.; Zhou, X.M. Phenolic Compounds and In Vitro Antibacterial and Antioxidant Activities of Three Tropic Fruits: Persimmon, Guava, and Sweetsop. Biomed. Res. Int. 2016, 2016, 4287461. [Google Scholar] [CrossRef] [PubMed]
  12. dos Santos, W.N.L.; Sauthier, M.C.D.; dos Santos, A.M.P.; Santana, D.D.; Azevedo, R.S.A.; Caldas, J.D. Simultaneous determination of 13 phenolic bioactive compounds in guava (Psidium guajava L.) by HPLC-PAD with evaluation using PCA and Neural Network Analysis (NNA). Microchem. J. 2017, 133, 583–592. [Google Scholar] [CrossRef]
  13. López-Morales, G.; López-Páez, M.F.; López, P.; Carriles, R.; Vilchis, H. Detection of moisture ratio and carotenoid compounds in mamey (Pouteria sapota) fruit during dehydration process using spectroscopic techniques. J. Food Sci. Technol. Mys. 2023, 60, 1952–1959. [Google Scholar] [CrossRef] [PubMed]
  14. Belmonte-Herrera, B.H.; Domínguez-Avila, J.A.; Wall-Medrano, A.; Ayala-Zavala, J.F.; Preciado-Saldaña, A.M.; Salazar-López, N.J.; López-Martínez, L.X.; Yahia, E.M.; Robles-Sánchez, R.M.; González-Aguilar, G.A. Lesser-Consumed Tropical Fruits and Their by-Products: Phytochemical Content and Their Antioxidant and Anti-Inflammatory Potential. Nutrients 2022, 14, 3663. [Google Scholar] [CrossRef]
  15. Smith, P.M.; Ferguson, A.V. Neurophysiology of hunger and satiety. Dev Disabil Res Rev 2008, 14, 96–104. [Google Scholar] [CrossRef]
  16. Tacad, D.K.M.; Tovar, A.P.; Richardson, C.E.; Horn, W.F.; Krishnan, G.P.; Keim, N.L.; Krishnan, S. Satiety Associated with Calorie Restriction and Time-Restricted Feeding: Peripheral Hormones. Adv. Nutr. 2022, 13, 792–820. [Google Scholar] [CrossRef]
  17. Zanchi, D.; Depoorter, A.; Egloff, L.; Haller, S.; Mählmann, L.; Lang, U.E.; Drewe, J.; Beglinger, C.; Schmidt, A.; Borgwardt, S. The impact of gut hormones on the neural circuit of appetite and satiety: A systematic review. Neurosci. Biobehav. Rev. 2017, 80, 457–475. [Google Scholar] [CrossRef]
  18. Cázares-Camacho, R.; Domínguez-Avila, J.A.; Astiazarán-García, H.; Montiel-Herrera, M.; González-Aguilar, G.A. Neuroprotective effects of mango cv. ‘Ataulfo’ peel and pulp against oxidative stress in streptozotocin-induced diabetic rats. J. Sci. Food Agr. 2021, 101, 497–504. [Google Scholar] [CrossRef]
  19. Domínguez-Avila, J.A.; Astiazaran-Garcia, H.; Wall-Medrano, A.; de la Rosa, L.A.; Alvarez-Parrilla, E.; González-Aguilar, G.A. Mango phenolics increase the serum apolipoprotein A1/B ratio in rats fed high cholesterol and sodium cholate diets. J. Sci. Food Agr. 2019, 99, 1604–1612. [Google Scholar] [CrossRef]
  20. Belmonte-Herrera, B.H.; Domínguez-Avila, J.A.; Ayala-Zavala, J.F.; Valenzuela-Melendres, M.; Tortoledo-Ortiz, O.; González-Aguilar, G.A. Optimization and In Vitro Digestion of a Guava (Psidium guajava), Mamey (Pouteria sapota) and Stevia (Stevia rebaudiana) Functional Beverage. Foods 2024, 13, 142. [Google Scholar] [CrossRef]
  21. Brand-Williams, W.; Cuvelier, M.E.; Berset, C. Use of a Free-Radical Method to Evaluate Antioxidant Activity. LWT-Food Sci. Technol. 1995, 28, 25–30. [Google Scholar] [CrossRef]
  22. Li, Z.Z.; Liu, Y.X.; Xiang, J.L.; Wang, C.Q.; Johnson, J.B.; Beta, T. Diverse polyphenol components contribute to antioxidant activity and hypoglycemic potential of mulberry varieties. LWT-Food Sci. Technol. 2023, 173, 114308. [Google Scholar] [CrossRef]
  23. Re, R.; Pellegrini, N.; Proteggente, A.; Pannala, A.; Yang, M.; Rice-Evans, C. Antioxidant activity applying an improved ABTS radical cation decolorization assay. Free Rad. Biol. Med. 1999, 26, 1231–1237. [Google Scholar] [CrossRef] [PubMed]
  24. Benzie, I.F.F.; Strain, J.J. Ferric reducing antioxidant power assay: Direct measure of total antioxidant activity of biological fluids and modified version for simultaneous measurement of total antioxidant power and ascorbic acid concentration. Method Enzymol. 1999, 299, 15–27. [Google Scholar]
  25. Medina, M.B. Simple and Rapid Method for the Analysis of Phenolic Compounds in Beverages and Grains. J. Agric. Food Chem. 2011, 59, 1565–1571. [Google Scholar] [CrossRef] [PubMed]
  26. Robles-Sánchez, R.M.; Rojas-Graü, M.A.; Odriozola-Serrano, I.; González-Aguilar, G.A.; Martín-Belloso, O. Effect of minimal processing on bioactive compounds and antioxidant activity of fresh-cut ‘Kent’ mango (Mangifera indica L.). Postharvest Biol. Technol. 2009, 51, 384–390. [Google Scholar] [CrossRef]
  27. Yeum, K.J.; Booth, S.L.; Sadowski, J.A.; Liu, C.; Tang, G.W.; Krinsky, N.I.; Russell, R.M. Human plasma carotenoid response to the ingestion of controlled diets high in fruits and vegetables. Am. J. Clin. Nutr. 1996, 64, 594–602. [Google Scholar] [CrossRef] [PubMed]
  28. Horwitz, W.; Latimer, G.W., Jr. AOAC International Official Methods of Analysis; Association of Official Analytical Chemists: Gaithersburg, MD, USA, 2005. [Google Scholar]
  29. Campolier, M.; Thondre, S.P.; Clegg, M.; Shafat, A.; Mcintosh, A.; Lightowler, H. Changes in PYY and gastric emptying across the phases of the menstrual cycle and the influence of the ovarian hormones. Appetite 2016, 107, 106–115. [Google Scholar] [CrossRef]
  30. Zanzer, Y.C.; Plaza, M.; Dougkas, A.; Turner, C.; Björck, I.; Östman, E. Polyphenol-rich spice-based beverages modulated postprandial early glycaemia, appetite and PYY after breakfast challenge in healthy subjects: A randomized, single blind, crossover study. J. Funct. Foods 2017, 35, 574–583. [Google Scholar] [CrossRef]
  31. Kristensen, M.; Savorani, F.; Christensen, S.; Engelsen, S.B.; Bügel, S.; Toubro, S.; Tetens, I.; Astrup, A. Flaxseed dietary fibers suppress postprandial lipemia and appetite sensation in young men. Nutr. Metab. Cardiovas. Dis. 2013, 23, 136–143. [Google Scholar] [CrossRef]
  32. Flint, A.; Raben, A.; Blundell, J.E.; Astrup, A. Reproducibility, power and validity of visual analogue scales in assessment of appetite sensations in single test meal studies. Int. J. Obes. 2000, 24, 38–48. [Google Scholar] [CrossRef] [PubMed]
  33. Akhlaghi, M. The role of dietary fibers in regulating appetite, an overview of mechanisms and weight consequences. Crit. Rev. Food Sci. 2024, 64, 3139–3150. [Google Scholar] [CrossRef] [PubMed]
  34. Murillo, E.; Agócs, A.; Nagy, V.; Király, S.B.; Kurtán, T.; Toribio, E.M.; Lakey-Beitia, J.; Deli, J. Isolation and identification of sapotexanthin 5,6-epoxide and 5,8-epoxide from red mamey (Pouteria sapota). Chirality 2020, 32, 579–587. [Google Scholar] [CrossRef]
  35. Müller, L.; Fröhlich, K.; Böhm, V. Comparative antioxidant activities of carotenoids measured by ferric reducing antioxidant power (FRAP), ABTS bleaching assay (αTEAC), DPPH assay and peroxyl radical scavenging assay. Food Chem. 2011, 129, 139–148. [Google Scholar] [CrossRef]
  36. Matamoros, C.; Hao, F.; Tian, Y.; Patterson, A.D.; Harvatine, K.J. Interaction of sodium acetate supplementation and dietary fiber level on feeding behavior, digestibility, milk synthesis, and plasma metabolites. J. Dairy Sci. 2022, 105, 8824–8838. [Google Scholar] [CrossRef] [PubMed]
  37. Lyly, M.; Liukkonen, K.H.; Salmenkallio-Marttila, M.; Karhunen, L.; Poutanen, K.; Lähteenmäki, L. Fibre in beverages can enhance perceived satiety. Eur. J. Nutr. 2009, 48, 251–258. [Google Scholar] [CrossRef]
  38. Paquet, É.; Bédard, A.; Lemieux, S.; Turgeon, S.L. Effects of apple juice-based beverages enriched with dietary fibres and xanthan gum on the glycemic response and appetite sensations in healthy men. Bioact. Carbohydr. Diet. Fibre 2014, 4, 39–47. [Google Scholar] [CrossRef]
  39. Bajerska, J.; Mildner-Szkudlarz, S.; Górnas, P.; Seglina, D. The effects of muffins enriched with sour cherry pomace on acceptability, glycemic response, satiety and energy intake: A randomized crossover trial. J. Sci. Food Agr. 2016, 96, 2486–2493. [Google Scholar] [CrossRef]
  40. Panda, V.; Shinde, P. Appetite suppressing effect of Spinacea oleracea in rats: Involvement of the short term satiety signal cholecystokinin. Appetite 2017, 113, 224–230. [Google Scholar] [CrossRef]
  41. Bakuradze, T.; Parra, G.A.M.; Riedel, A.; Somoza, V.; Lang, R.; Dieminger, N.; Hofmann, T.; Winkler, S.; Hassmann, U.; Marko, D.; et al. Four-week coffee consumption affects energy intake, satiety regulation, body fat, and protects DNA integrity. Food Res. Int. 2014, 63, 420–427. [Google Scholar] [CrossRef]
  42. Benelam, B. Satiation, satiety and their effects on eating behaviour. Nutr. Bull. 2009, 34, 126–173. [Google Scholar] [CrossRef]
  43. Chow, J.; Choe, Y.S.; Noss, M.J.; Robinson, K.J.; Dugle, J.E.; Acosta, S.H.; Garleb, K.A. Effect of a viscous fiber-containing nutrition bar on satiety of patients with type 2 diabetes. Diabetes Res. Clin. Pract. 2007, 76, 335–340. [Google Scholar] [CrossRef] [PubMed]
  44. Delargy, H.J.; OSullivan, K.R.; Fletcher, R.J.; Blundell, J.E. Effects of amount and type of dietary fibre (soluble and insoluble) on short-term control of appetite. Int. J. Food Sci. Nutr. 1997, 48, 67–77. [Google Scholar] [CrossRef] [PubMed]
  45. Hwang, C.S.; Loftus, T.M.; Mandrup, S.; Lane, M.D. Adipocyte differentiation and leptin expression. Annu. Rev. Cell Dev. Biol. 1997, 13, 231–259. [Google Scholar] [CrossRef]
  46. Picó, C.; Palou, M.; Pomar, C.A.; Rodríguez, A.M.; Palou, A. Leptin as a key regulator of the adipose organ. Rev. Endocr. Metab. Dis. 2022, 23, 13–30. [Google Scholar] [CrossRef]
Figure 1. Results of visual analogue scales (VASs) used to determine the satiety profile of the participants after consuming a guava and mamey beverage or a control (commercial beverage). (A) hunger, (B) satiety, (C) fullness, and (D) prospective food consumption.
Beverages 11 00035 g001
Figure 2. Results of the area under the curve (AUC) for the satiety profile of the participants after consuming a guava and mamey beverage or a control (commercial beverage). (A) hunger, (B) satiety, (C) fullness, and (D) prospective food consumption.
Beverages 11 00035 g002
Figure 3. Results of the visual analogue scales (VASs) used to determine the satiety profile of the participants grouped by sex, after consuming a guava and mamey beverage or a control (commercial beverage). (A) hunger, (C) satiety, (E) fullness, and (G) prospective food consumption for men; (B) hunger, (D) satiety, (F) fullness, and (H) prospective food consumption for women.
Beverages 11 00035 g003
Figure 4. Results of the area under the curve (AUC) for the satiety profile of the participants grouped by sex, after consuming a guava and mamey beverage or a control (commercial beverage). (A) hunger, (B) satiety, (C) fullness, and (D) prospective food consumption.
Beverages 11 00035 g004
Table 1. Characterization and antioxidant capacity of the beverages administered.
VariableControlGuava and Mamey
Total fiber (g/100 g dw)2.88 ± 0.18 b9.17 ± 0.61 a
Vitamin C (mg/100 mL)5.71 ± 0.00 b10.12 ± 0.00 a
TPC (mg GAE/100 mL)94.90 ± 1.73 a16.05 ± 0.57 b
α-carotene (mg/100 g dw)11.13 ± 0.07 b356.94 ± 25.56 a
β-carotene (mg/100 g dw)1.46 ± 0.31 b433.31 ± 8.45 a
DPPH (mg TEs/100 mL)109.70 ± 1.39 a77.77 ± 0.58 b
ABTS (mg TEs/100 mL)3.31 ± 0.02 a1.62 ± 0.01 b
FRAP (mg TEs/100 mL)157.38 ± 0.38 a54.67 ± 0.38 b
dw: dry weight. TPC: total phenolic content. GAEs: gallic acid equivalents. TEs: Trolox equivalents. Different superscript letters indicate significant differences per variable (p < 0.05).
Table 2. The anthropometric data of the participants of the present study.
VariableWomen (n = 9)Men (n = 9)
Age (y)26.11 ± 1.36 a26.88 ± 1.83 a
Weight (kg)61.92 ± 4.06 b78.62 ± 4.98 a
BMI (kg/m2)23.65 ± 1.19 a24.18 ± 0.93 a
BF (%)37.74 ± 5.18 a27.11 ± 4.90 b
MM (%)24.14 ± 5.15 b34.74 ± 3.95 a
BMI: body mass index; BF: body fat; MM: muscle mass. Data are shown as the average ± standard deviation (SD). Different superscript letters indicate significant differences per variable (p < 0.05).
Table 3. Pearson correlation analysis between all participants’ (n = 18) anthropometric data and the area under the curve (AUC) of the different variables analyzed.
Control Beverage
Age (years)Weight (kg)BMI (kg/m2)Body fat (%)Muscle mass (%)
AUC hunger0.270 (0.278)0.531 (0.023)−0.034 (0.895)−0.782 (0.000)0.743 (0.000)
AUC satiety0.477 (0.045)0.169 (0.501)−0.244 (0.329)−0.616 (0.006)0.488 (0.040)
AUC fullness−0.029 (0.911)0.006 (0.982)−0.128 (0.624)−0.237 (0.359)0.191 (0.462)
AUC PFC0.007 (0.979)0.331 (0.180)−0.029 (0.908)−0.437 (0.070)0.441 (0.067)
Guava and mamey beverage
Age (years)Weight (kg)BMI (kg/m2)Body fat (%)Muscle mass (%)
AUC hunger0.001 (0.998)0.062 (0.806)−0.131 (0.605)−0.201 (0.424)0.060 (0.813)
AUC satiety0.506 (0.032)0.105 (0.677)−0.183 (0.467)−0.450 (0.061)0.406 (0.095)
AUC fullness0.117 (0.644)0.162 (0.519)−0.149 (0.554)−0.424 (0.079)0.439 (0.068)
AUC PFC−0.033 (0.897)0.216 (0.389)0.016 (0.950)−0.095 (0.708)−0.005 (0.985)
BMI: body mass index; AUC: area under the curve; PFC: prospective food consumption. p values are shown in parentheses, and significant correlations are highlighted in bold (p < 0.05).
Table 4. Pearson correlation analysis between men’s (n = 9) anthropometric data and the area under the curve (AUC) of the different variables analyzed (p < 0.05).
Control Beverage
Age (years)Weight (kg)BMI (kg/m2)Body fat (%)Muscle mass (%)
AUC hunger0.473 (0.198)−0.117 (0.764)−0.371 (0.326)−0.754 (0.019)0.609 (0.082)
AUC satiety0.838 (0.005)−0.291 (0.448)−0.069 (0.860)−0.270 (0.482)0.274 (0.476)
AUC fullness−0.202 (0.602)−0.033 (0.933)0.475 (0.196)0.541 (0.132)−0.376 (0.319)
AUC PFC0.275 (0.474)−0.123 (0.753)−0.264 (0.492)−0.712 (0.031)0.483 (0.188)
Guava and mamey beverage
Age (years)Weight (kg)BMI (kg/m2)Body fat (%)Muscle mass (%)
AUC hunger0.306 (0.423)−0.245 (0.525)−0.066 (0.867)−0.445 (0.230)0.207 (0.592)
AUC satiety0.660 (0.053)−0.286 (0.456)−0.110 (0.777)−0.113 (0.773)−0.002 (0.995)
AUC fullness−0.132 (0.735)−0.042 (0.914)0.097 (0.803)0.514 (0.157)−0.364 (0.335)
AUC PFC0.244 (0.527)−0.102 (0.793)0.232 (0.548)−0.424 (0.255)0.220 (0.570)
BMI: body mass index; AUC: area under the curve; PFC: prospective food consumption. p values are shown in parentheses, and significant correlations are highlighted in bold (p < 0.05).
Table 5. Pearson correlation analysis between women’s (n = 9) anthropometric data and the area under the curve (AUC) of the different variables analyzed.
Control Beverage
Age (years)Weight (kg)BMI (kg/m2)Body fat (%)Muscle mass (%)
AUC hunger−0.401 (0.285)−0.083 (0.831)−0.175 (0.653)−0.421 (0.259)0.447 (0.227)
AUC satiety0.024 (0.951)−0.564 (0.113)−0.582 (0.100)−0.729 (0.026)0.348 (0.360)
AUC fullness0.053 (0.900)−0.354 (0.389)−0.466 (0.245)−0.739 (0.036)0.445 (0.270)
AUC PFC−0.391 (0.298)0.181 (0.640)−0.069 (0.859)−0.053 (0.892)0.204 (0.598)
Guava and mamey beverage
Age (years)Weight (kg)BMI (kg/m2)Body fat (%)Muscle mass (%)
AUC hunger−0.585 (0.098)−0.203 (0.600)−0.301 (0.431)0.275 (0.474)−0.434 (0.243)
AUC satiety0.290 (0.449)−0.179 (0.646)−0.359 (0.343)−0.681 (0.043)0.609 (0.082)
AUC fullness0.204 (0.599)−0.347 (0.361)−0.400 (0.286)−0.823 (0.006)0.697 (0.037)
AUC PFC−0.403 (0.282)0.064 (0.871)−0.190 (0.625)0.475 (0.196)−0.581 (0.101)
BMI: body mass index; AUC: area under the curve; PFC: prospective food consumption. p values are shown in parentheses, and significant correlations are highlighted in bold (p < 0.05).
Disclaimer/Publisher’s Note: The statements, opinions and data contained in all publications are solely those of the individual author(s) and contributor(s) and not of MDPI and/or the editor(s). MDPI and/or the editor(s) disclaim responsibility for any injury to people or property resulting from any ideas, methods, instructions or products referred to in the content.

