Abstract
This paper presents a new optimization approach for beverage formulation using the Technique for Order of Preference by Similarity to Ideal Solution (TOPSIS). The comparison and ranking of candidates would be the essential steps for the evaluation of beverage production, which in turn requires the quality control of beverage ingredients. The quality of the beverage depends on the type and amount of the ingredients used for their preparation. This emphasizes the importance of the optimization of beverage formulation, which is addressed in this paper using the TOPSIS method. The results of this investigation show that ingredients with more impact on human health (having bigger weights) could affect the rank of drinks. The second, fourth, third and first candidates ranked first, second, third and fourth before and after the changes of criterion types and weight values. Moreover, the change of the criterion type accompanied with the increase in its concentration in the beverage had a significant impact on the candidates’ ranks. The similarity coefficient of the fourth candidate for which this ingredient concentration changed showed a decrease from 0.625 to 0.500. The optimization of beverage formulation with the modified TOPSIS algorithm showed the efficiency of the automated decision-making process with the obtainment of the same ranks in comparison with those of the analyses without the consideration of the candidates’ colors as they were used in beverages and could not determine their quality. The results in this research paper could be used for the quality improvement of drinks in the beverage industry.
1. Introduction
Beverage production is an important part of the food industry, implying certain steps such as handling, storage, packaging and transport [1,2]. These steps aim to help recycling, control and reduce the rate of deterioration, provide the required protection of ingredients and make the product available for consumers, respectively [1,3].
The global beverage market includes hot drinks, milk drinks, soft drinks and alcoholic drinks [4,5]. Soft drinks often contain water, sugar, fruit juice, sweeteners, carbon dioxide, acids, flavors, colors, preservatives, emulsifiers, antioxidants and vitamins [5,6]. Hot drinks include coffee, chocolate and tea. Milk drinks have subcategories of milk or milk-included drinks. Bottled water, carbonated drinks, dilutable drinks, fruit juices, still drinks, sports drinks and other noncarbonated products with less fruit juice are categorized as soft drinks. Beer, wine, spirits, cider, sake and flavored alcoholic beverages are alcoholic drinks [5,6]. Milk and soft drinks are the most important and the most consumed among the different types of beverages.
Changes in lifestyle and diet, especially the frequent consumption of soft drinks and alcoholic drinks, can lead to obesity, metabolic syndrome, dental, pulmonary, or cardiovascular diseases [7,8,9]. An association between the consumption of soft drinks and gastroesophageal reflux has been reported. Moreover, carbonated beverages can influence stomach function. This can lead to both mechanical and chemical effects. It is worth noting that the mechanical effect depends on the pressure exerted by gas, which is used in the beverages, and by the fluid volume on the gastric wall. There are some factors that increase insulin and glucose levels in the blood, which cause obesity and diabetes. Therefore, the consumption of sugar-sweetened soft drinks can correspond to pancreatic cancer risk [7]. In fact, elevated insulin concentrations in the blood can activate insulin-like growth factor receptors, which may lead to cancer [7]. Another investigation revealed that soft drink consumption could be associated with a higher prevalence of multiple metabolic risk factors in middle-aged adults. In fact, these individuals are at a higher risk of developing metabolic syndrome [8]. An important factor that should be considered concerning metabolic diseases, such as obesity, metabolic syndrome, diabetes, hypertension, dyslipidemias, stroke, and cardiovascular disease mortality, is the body mass index (BMI), which is the ratio between body weight, expressed in kilograms, and the square of a person’s height, expressed in meters. BMI indicates health issues such as overweight or obese conditions, corresponding to BMI > 25 and BMI > 30, respectively. Changes in lifestyle and diet, especially moderation in the consumption of transformed food and sweetened beverages, can help keep a BMI below 25 and maintain good health [9].
Sweeteners used in beverage formulations can help reduce positive energy balance and blood glucose [10]. However, conflicting data gathered from the short- and long-term consumption of natural and artificial materials, for example, aspartame, sucralose, and stevia derivatives, still exist, preventing a better conclusion on their impact on human health [11]. Preclinical and clinical studies have revealed the negative effects of sweeteners on the intestinal microbiota, glucose metabolism, and appetite control [12].
Several research works have been conducted on the prediction and optimization of beverage formulation. A constrained mixture design and multiple responses have been used for the systematic study of functional beverage formulation, such as the behavior and effects of varying ratios and proportions of beverage ingredients such as fruit juice, yogurt, and functional ingredients such as plant protein, fiber, or other functional compounds [13]. In another study, an Ultra-Accelerated Shelf-Life Test method was used for predicting the shelf life of beverages. The tests were performed based on vitamin degradation accelerated with increased temperature and oxygen diffusion [14]. A research work was performed to achieve a formula design based on pre-determined parameters by choosing the criteria that were optimized. A sensory test helped determine the flavor concentration which would be added to the beverage powder. The best formula was chosen according to the highest desirability value, which was the value closest to 1.0. The optimum formula was verified with a repeated test [15]. The optimization of fermentation conditions was also previously performed by investigating endogenous walnut lipase for the manufacture of a fermented, whey-based beverage containing conjugated linoleic acid [16]. These studies have been performed for the prediction and optimization of the mentioned aspects of beverage formulations. However, none of them have provided information based on the prediction and optimization of the soft drinks’ formulation according to the consideration of their ingredient characteristics.
In this paper, the analysis and optimization of soft drinks were performed with the Technique for Order of Preference by Similarity to Ideal Solution (TOPSIS), which is a decision-making method that helps classify and optimize candidates [17,18,19,20]. This technique has been used previously for the selection of beverage cafes [21], the analysis of storeowner and supplier perspective for the prediction of sustainable packaging [22], the prediction of the best match between manufacturing technologies and food and beverage specifications [23], and the selection of optimal materials for the different components of cashew juice extractors [24]. TOPSIS has some considerable advantages in comparison with other decision-making methods. The advantages of TOPSIS are as follows: (1) All the positive and negative criteria as well as alternatives are considered in this method. So, it provides a holistic decision-making approach. (2) The implementation of TOPSIS is easy. This characteristic makes researchers prefer it to other methods for performing a decision-making process. (3) A wide range of decision-making problems across academic laboratories and industries can use this versatile approach. (4) The ranking of candidates in the output of TOPSIS is represented clearly. This enables decision-makers to make informed decisions because the best alternative based on the given criteria is chosen, and the method as an objective approach for decision-making involves a systematic and balanced analysis of alternatives, which is based on the given criteria. (5) TOPSIS has gained popularity because of its simplicity as it is considered a prevalent decision-making technique for solving multi-response optimization problems [25,26].
To the author’s knowledge, the prediction and optimization of beverage formulation with TOPSIS have not been performed yet. The current work is aimed at predicting and optimizing the ranks of soft drinks according to their ingredients. For this purpose, different ingredient concentrations of soft drinks are analyzed. The results of this investigation can help with a better formulation of soft drinks with applications in the beverage industry.
2. Materials and Methods
2.1. TOPSIS Method
The second updated version of the TOPSIS algorithm in Python available on the GitHub website (https://github.com/Glitchfix/TOPSIS-Python/blob/master/topsis.py (accessed on 10 January 2025) was used for the analysis of the candidates’ ranking and its optimization [27,28]. In this method, the criteria were the beverages’ ingredients. The profit criterion was a characteristic for which a high value translated to a better rank and a low value translated to a worse rank for the candidate. The cost criterion was a characteristic for which a low value translated to a better rank and a high value translated to a worse rank for the candidate. The candidates’ ranking was the output of this method based on the candidates’ closeness to ideal solutions [27,28].
Four candidates were analyzed with the unmodified TOPSIS algorithm. The first, second, third, and fourth candidates, C1, C2, C3, and C4, were considered in the second, third, fourth, and fifth rows in the evaluation matrix.
The entry in the analysis was the average of the triangular fuzzy data corresponding to the concentrations of the beverage ingredients, which were the analysis criteria (water, sugar, fruit juice, sweeteners, carbon dioxide, acids, flavors, colors, preservatives, emulsifiers, antioxidants, and vitamins, indicated as W, SU, FJ, SW, CD, A, F, C, P, E, AO, and V, in the tables of results, respectively) [5]. The data normalization was performed by dividing the average concentrations by 100 to give fuzzy values. As described previously, the TOPSIS method includes the steps below [10,12,27,29]:
- 1.
- Data normalization
The first step of TOPSIS includes the normalization of data, which is the entry of the evaluation matrix, according to the formulas below:
- 2.
- Multiplication of normalized data by their weight values
In the second step, the normalized data are multiplied by their weights as presented below:
- 3.
- Determination of positive and negative ideal solutions
The third step includes determination of the positive and negative ideal solutions, which are used in the following step. To carry this out, we use the formulas below:
- 4.
- Determination of distances from positive and negative ideal solutions
The distances from positive and negative ideal solutions are calculated for each candidate in the fourth step. This is performed using the formula below:
- 5.
- Determination of candidates’ similarity coefficients
The candidates’ similarity coefficients are determined in the last step according to the formula below:
In the formula above, di* and di− represent the distances from the best and worst ideals, respectively.
- 6.
- Determination of candidates’ ranks
The candidates were ranked according to the comparison of their similarity coefficients. The candidate with the biggest similarity coefficient was ranked in the first position and the following ones had smaller coefficients. The last candidate had the smallest coefficient.
2.2. Modified TOPSIS
The modified TOPSIS, having the code line below, allowed non-consideration of the color of the soft drinks for their analysis as this characteristic does not determine their quality. Four candidates were analyzed with the TOPSIS algorithm. The first, second, third, and fourth candidates, C1, C2, C3, and C4, were considered in the first, second, third, and fourth rows in the evaluation matrix. In another investigation, eight candidates, C1, C2, C3, C4, C5, C6, C7, and C8, were analyzed. The data concerning the colors of drinks were added into the last column at the right side in the evaluation matrix of the TOPSIS code.
weight_matrix[self.column_size − 1] = 0
This modification in the algorithm led to automated decision making for the candidates’ ranking [30].
3. Results and Discussion
Different series of analyses were performed with the TOPSIS algorithm on the soft drinks considering their ingredients as criteria.
3.1. Analysis of Candidates
The emphasis in the analysis was on the impact of the weights and criteria on the candidates’ ranks.
3.1.1. Analysis of Weight Values and Criterion Types for Ranks of Soft Drinks
In the first series of analysis, the weights of criteria were analyzed for soft drinks. Table 1 shows the evaluation matrix in which the average values of the triangular fuzzy data corresponding to the concentrations of the beverage ingredients are presented. The first row, including the abbreviations of the soft drink ingredients, corresponds to the criteria. The second, third, fourth, and fifth rows in the evaluation matrix and normalization matrix correspond to the first, second, third, and fourth candidate, respectively.

Table 1.
The evaluation matrix of entry data.
The weight values of water, sugar, fruit juice, sweeteners, flavors, preservatives, antioxidants, and vitamins were set to 0.1, whereas those of carbon dioxide, acids, colors and emulsifiers were set to 0.05, respectively. The higher and lower values of the weights were due to the degrees of importance considered for the ingredients. The sum of all the weight values were set to 1.0.
Water, fruit juice, carbon dioxide, flavors, antioxidants and vitamins were considered as profit criteria, whereas sugar, sweeteners, acids, colors, preservatives and emulsifiers were considered as cost criteria, respectively.
The normalized matrix is presented in Table 2.
Table 2.
The normalized matrix.
The weighted normalized matrix is presented in Table 3.
Table 3.
The weighted normalized matrix.
The worst and the best alternatives for the candidates are presented in the second and third rows of Table 4, respectively.
Table 4.
The worst and the best alternatives.
Table 5 shows the values of the distances between the target alternative and the worst condition (di−) and the distances between the target alternative and the best condition (di*).
Table 5.
The distances between the target alternative and the worst and the best conditions. di* and di− represent the distances from the best and worst ideals, respectively.
Table 6 shows the values of the similarity coefficient (CCi) and the ranks of candidates.
Table 6.
The similarity coefficient and the ranks of candidates.
As shown in Table 6, the second, fourth, third and first candidates have the first, second, third and fourth ranks, respectively.
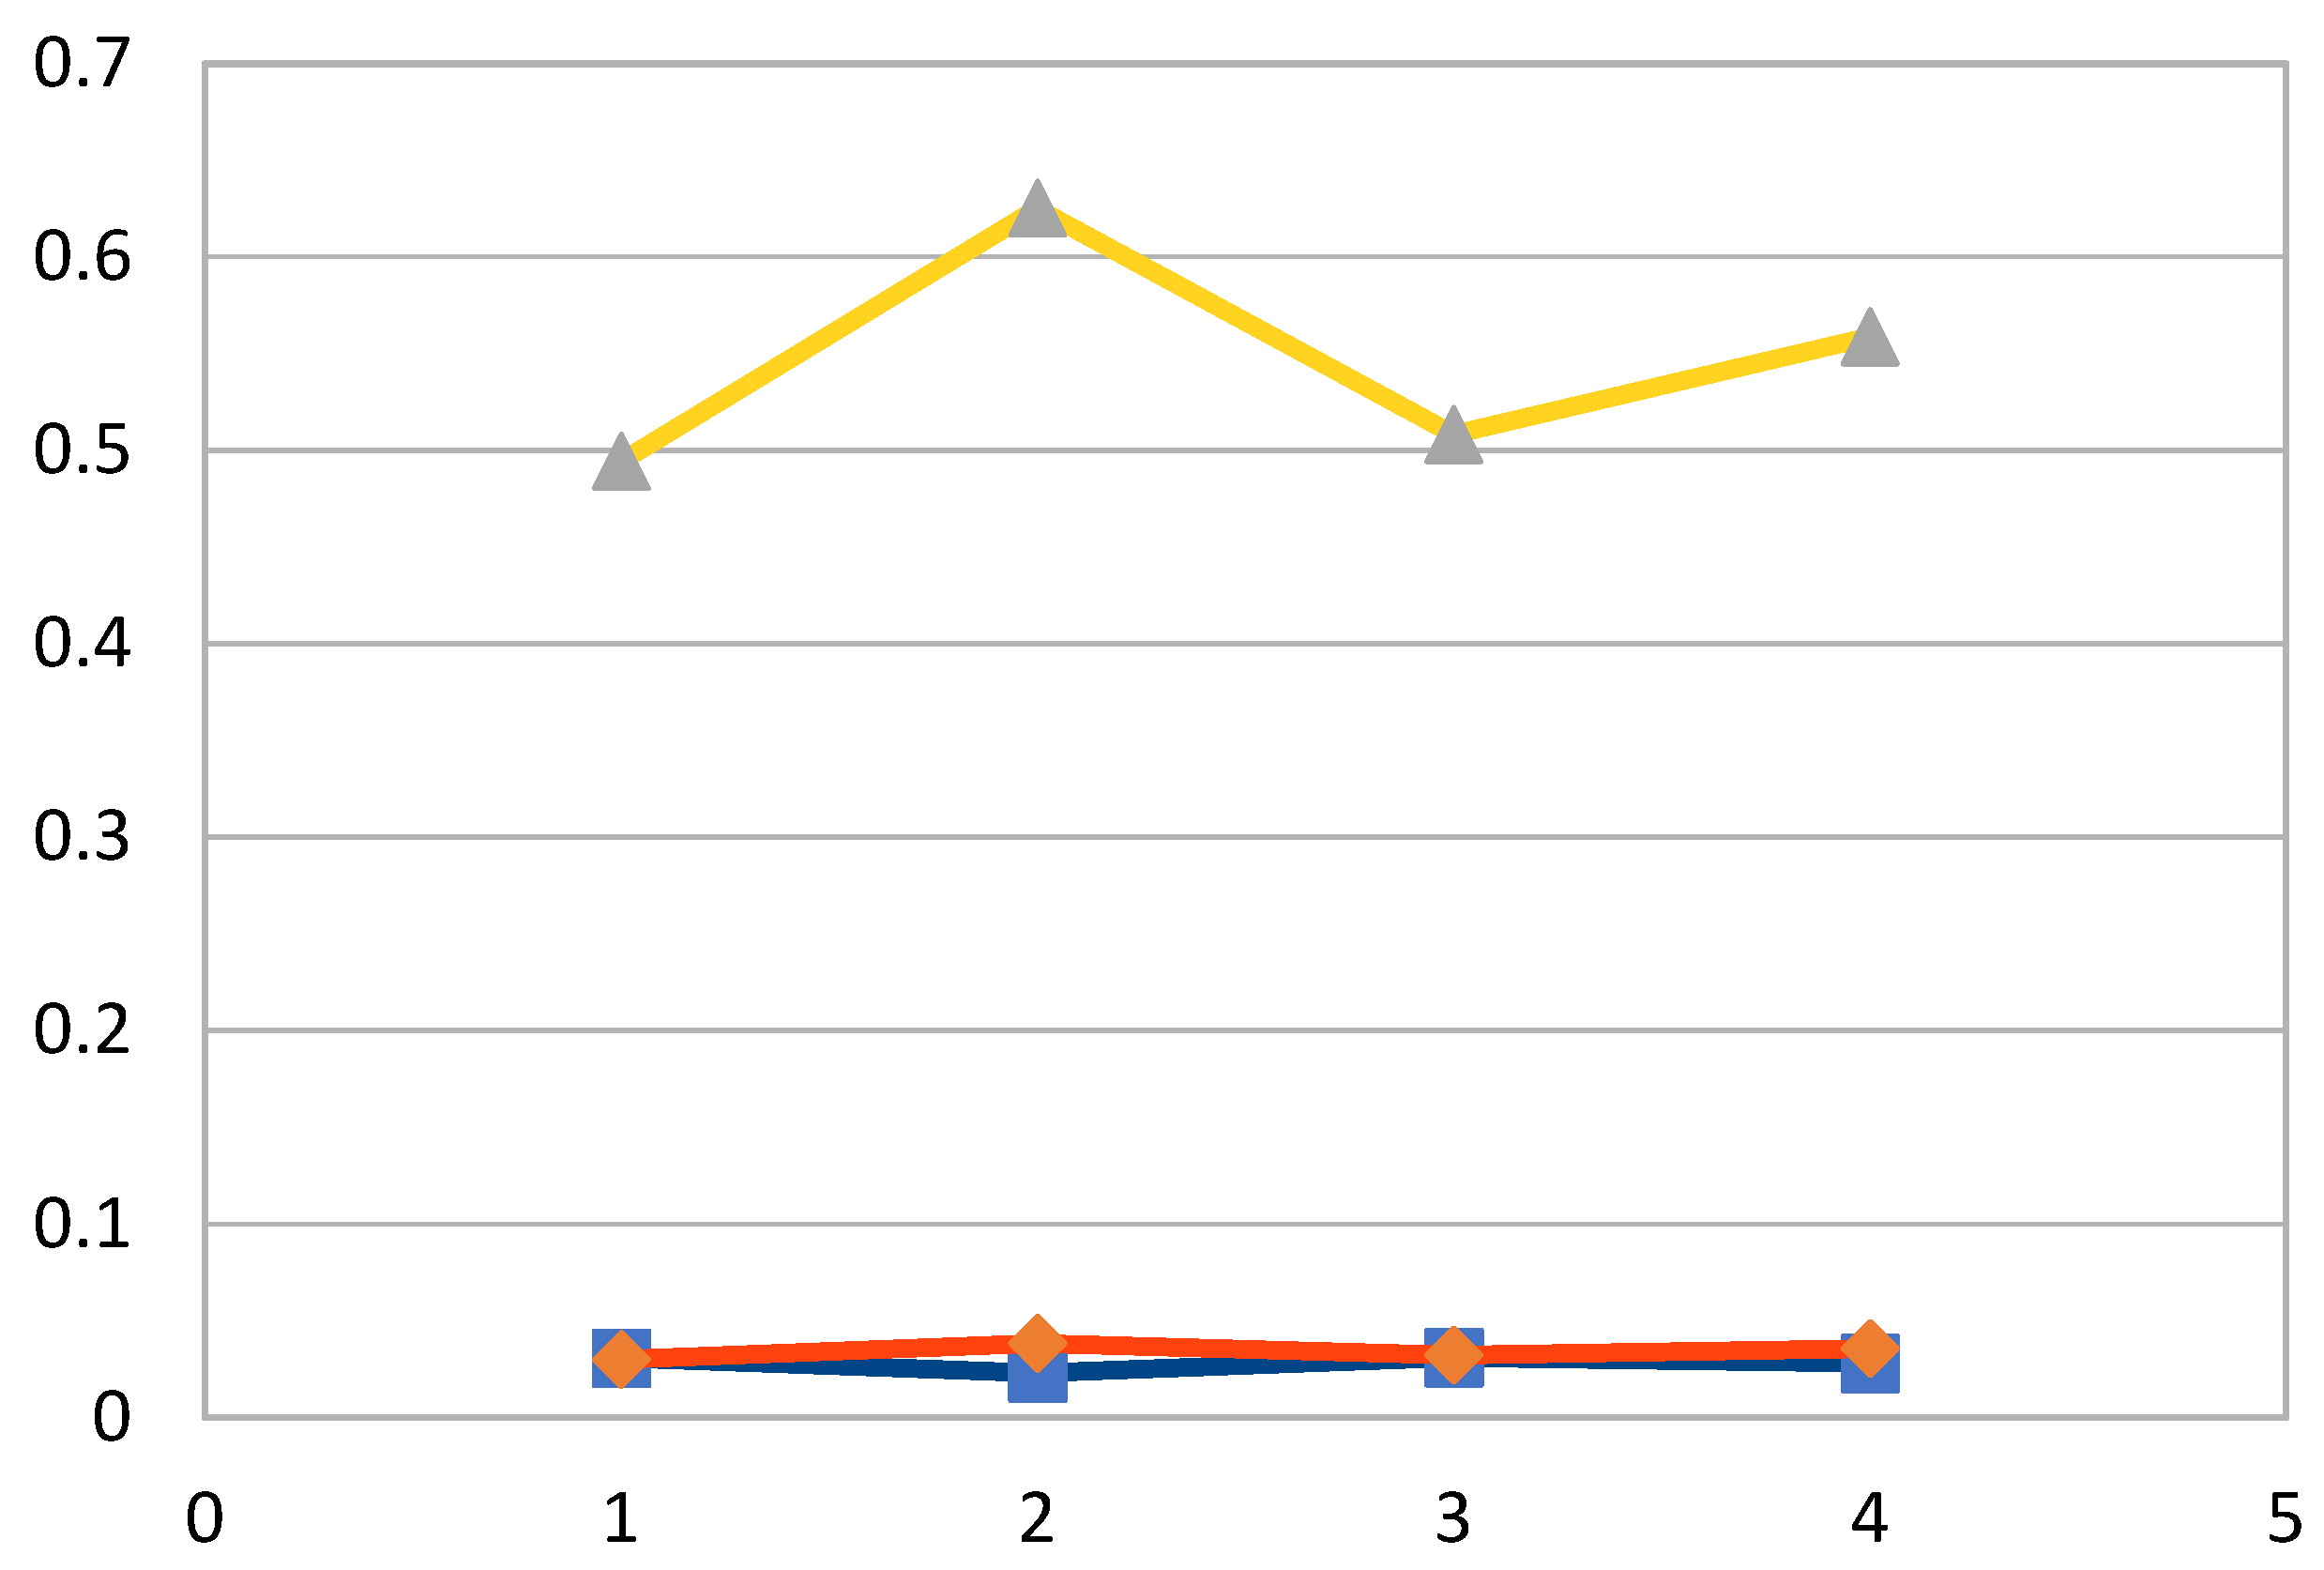
Figure 1 shows the distances between the target alternative and the worst and best conditions and the similarity coefficients of the candidates.
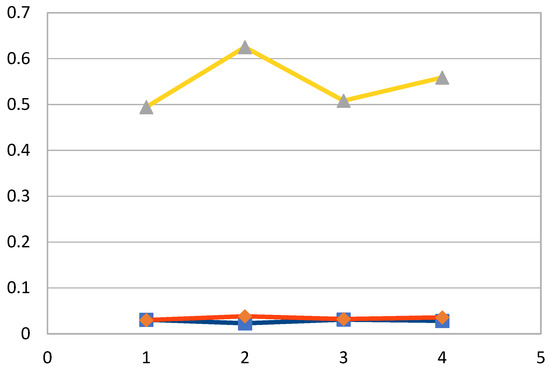
Figure 1.
The distances between the target alternative and the worst and the best conditions and the similarity coefficients of the candidates. The spots from left to right correspond to the first, second, third and fourth candidates, respectively. The blue, red and yellow lines represent the distance from the best ideal, the distance from the worst ideal and the closeness coefficients of the candidates, respectively.
In the second series of analysis, the same average values of the triangular data were considered as the entry in the evaluation matrix (Table 7).
Table 7.
The evaluation matrix of entry data.
The weight values of water, sugar, fruit juice, flavors, preservatives, emulsifiers, antioxidants and vitamins were set to 0.1, whereas those of sweeteners, carbon dioxide, acids and colors were set to 0.05, respectively. The two conditions to choose the weight values were those of the previous analysis.
Water, fruit juice, carbon dioxide, flavors, emulsifiers, antioxidants and vitamins were considered as profit criteria, whereas sugar, sweeteners, acids, colors and preservatives were considered as cost criteria, respectively.
Table 8 shows the normalized matrix.
Table 8.
The normalized matrix.
The weighted normalized matrix is presented in Table 9.
Table 9.
The weighted normalized matrix.
The worst and the best alternatives for the candidates are presented in the second and third rows of Table 10, respectively.
Table 10.
The worst and the best alternatives.
Table 11 shows the values of the distances between the target alternative and the worst condition (di−) and the distances between the target alternative and the best condition (di*).
Table 11.
The distances between the target alternative and the worst and best conditions. di* and di− represent the distances from the best and worst ideals, respectively.
Table 12 shows the values of the similarity coefficient (CCi) and the ranks of candidates.
Table 12.
The similarity coefficient and the ranks of candidates.
As shown in Table 12, the same ranks for candidates were obtained as those of the previous analysis.
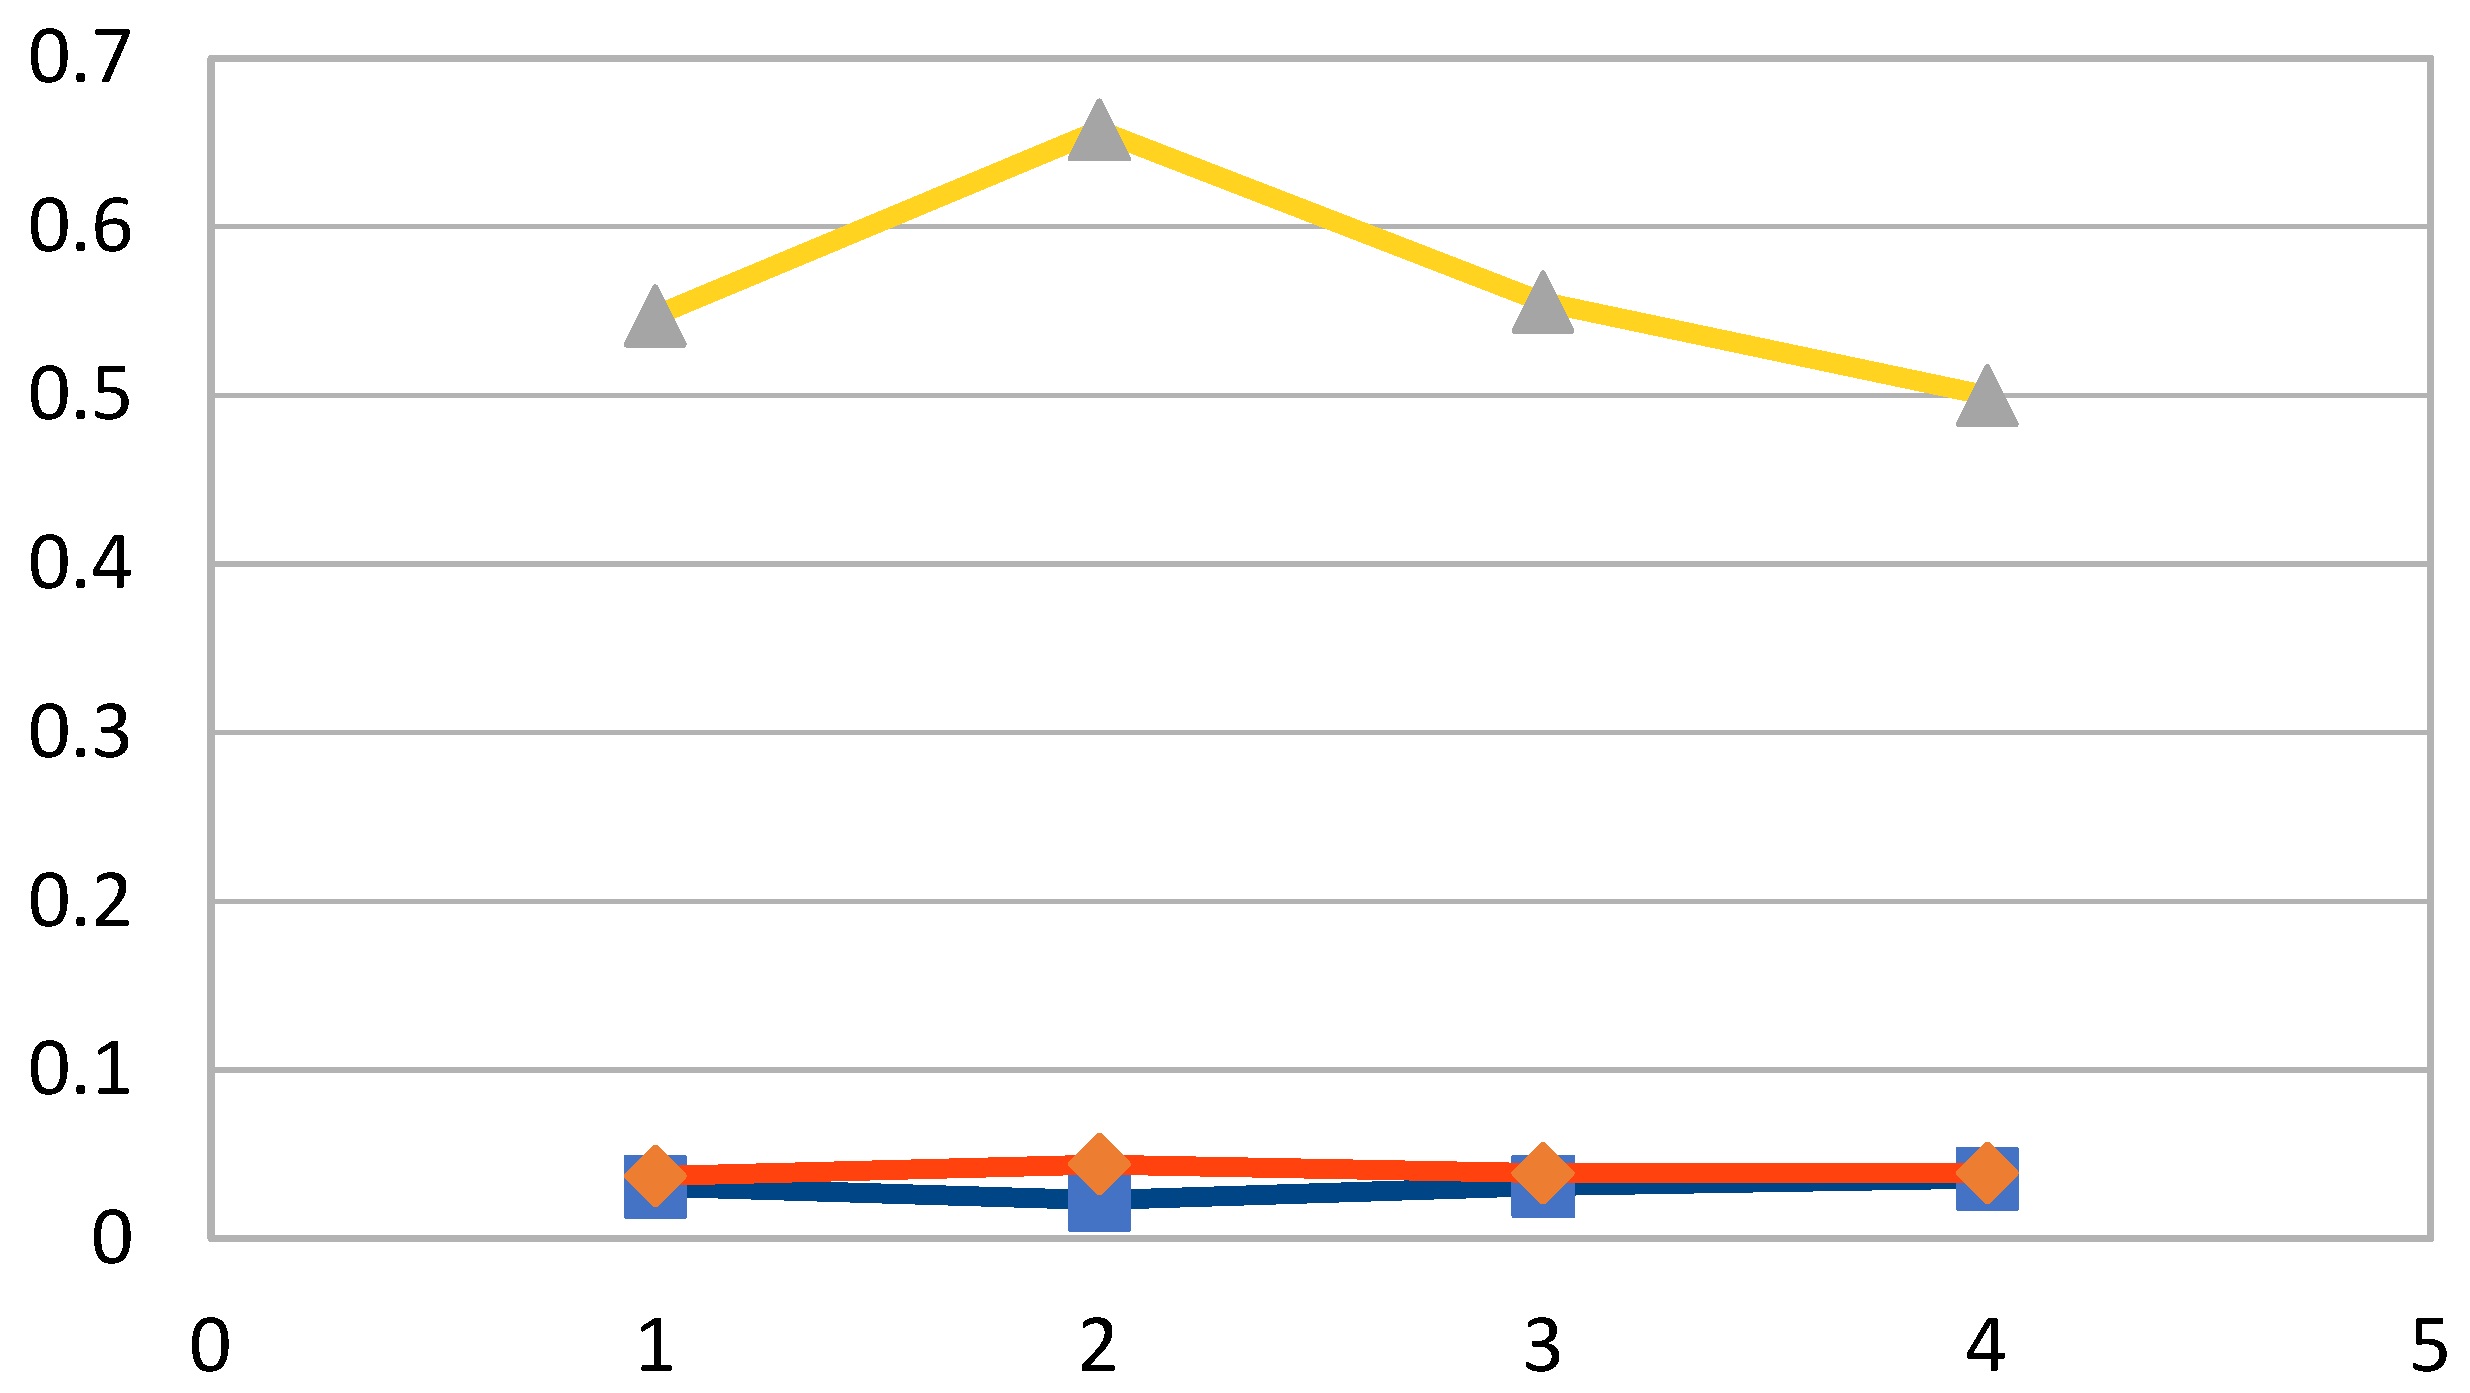
Figure 2 shows the distances between the target alternative and the worst and the best conditions and the similarity coefficients of the candidates.

Figure 2.
The distances between the target alternative and the worst and the best conditions and the similarity coefficients of the candidates. The spots from left to right correspond to the first, second, third and fourth candidates, respectively. The blue, red and yellow lines represent the distance from the best ideal, the distance from the worst ideal and the closeness coefficients of the candidates, respectively.
The comparison of the candidates’ ranks obtained in the first and second series of analyses showed that the modifications of the weights and the criteria did not have an impact on the TOPSIS output.
3.1.2. Impact of Data Modification on Ranks of Soft Drinks
In the third series of analysis, the concentration of the preservatives of the fourth candidate in the evaluation matrix was 0.0015 in place of 0.001. The concentrations of the other drink ingredients were not changed. The weight values and criterion types were the same as those of the first series of analysis.
The weight values of the soft drink ingredients and the criterion types were chosen to be the same as those of the first series of analysis.
Table 13 shows the normalized matrix for this series of analysis.
Table 13.
The normalized matrix.
The weighted normalized matrix is presented in Table 14.
Table 14.
The weighted normalized matrix.
The worst and best alternatives for the candidates are presented in the second and third rows of Table 15, respectively.
Table 15.
The worst and best alternatives.
Table 16 shows the values of the distances between the target alternative and the worst condition (di−) and the distances between the target alternative and the best condition (di*).
Table 16.
The distances between the target alternative and the worst and best conditions. di* and di− represent the distances from the best and worst ideals, respectively.
Table 17 shows the values of the similarity coefficient (CCi) and the ranks of candidates.
Table 17.
The similarity coefficient and the ranks of candidates.
As shown in Table 17, the second, third, first, and fourth candidates have the first, second, third, and fourth ranks, respectively.
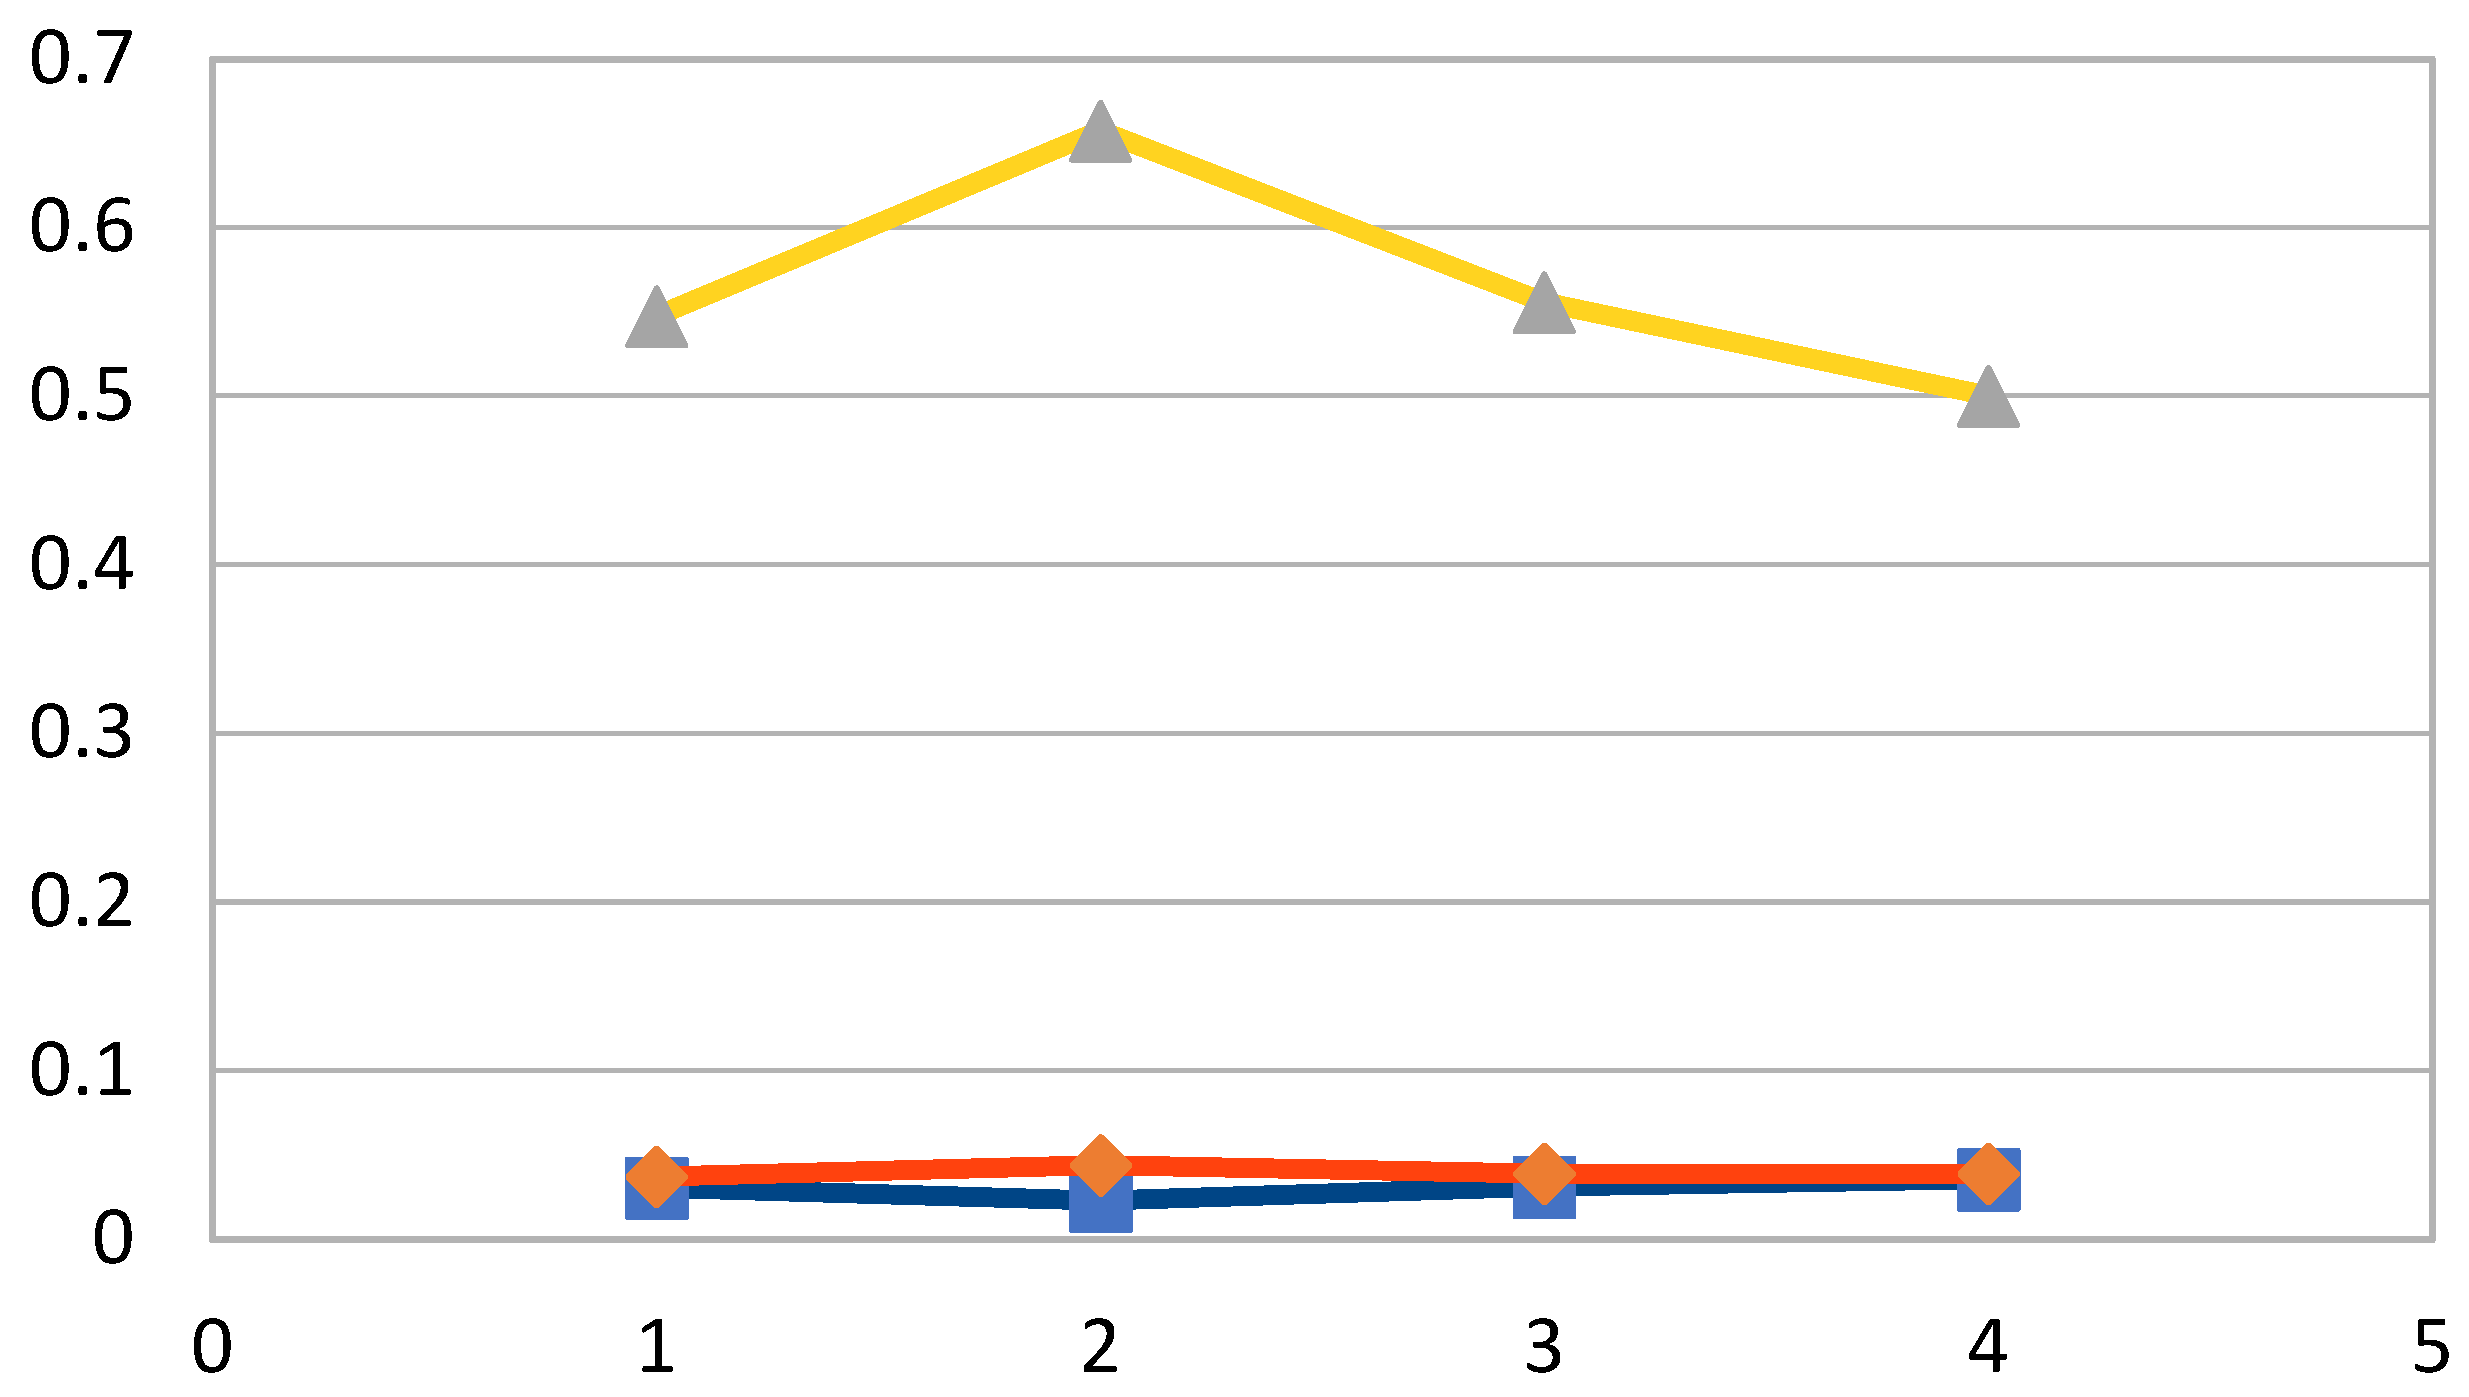
Figure 3 shows the distances between the target alternative and the worst and best conditions and the similarity coefficients of the candidates.
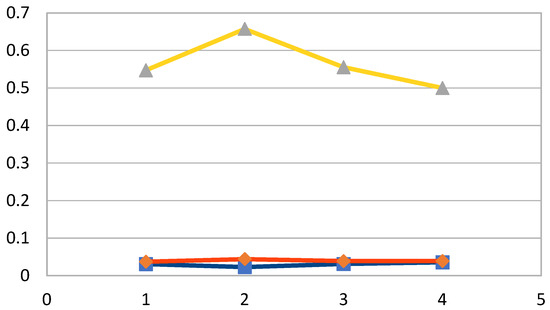
Figure 3.
The distances between the target alternative and the worst and best conditions and the similarity coefficients of the candidates. The spots from left to right correspond to the first, second, third and fourth candidates, respectively. The blue, red and yellow lines represent the distance from the best ideal, the distance from the worst ideal and the closeness coefficients of the candidates, respectively.
The comparison of the candidates’ ranks obtained in the first, second and third series of analyses showed that the modifications of the concentration of the preservatives of the fourth candidate had a significant impact on the TOPSIS output. This candidate was ranked in the second position in the first and second series of analyses, whereas it was ranked in the last position in the third series of analysis. The change of rank was due to the consideration of the preservatives as a cost criterion in the analysis. Moreover, the increase in their concentration for the fourth candidate had a negative impact on its rank.
3.2. Case Optimization
In this section, two series of case analyses for several drinks having different colors are presented.
The analysis of four drinks with different colors—orange, pink, red and violet—with an automated decision-making process is presented. The modified algorithm, as described in the Materials and Methods, was used for the optimization of beverage formulation. The drink’s color is an acceptable characteristic of the manufactured products. Therefore, it has no impact on the distinction of drinkable and undrinkable drinks. The fuzzy values of 0.3, 0.5, 0.7 and 0.9 were used for the colors of orange, pink, red and violet, respectively. The weight values and criterion types were the same as those of the third series of analysis presented in Section 3.1.2. The explained modification in the TOPSIS method allowed the non-consideration of the drinks’ colors for the candidates’ ranks.
Table 18 shows the values of the distances between the target alternative and the worst condition (di−) and the distances between the target alternative and the best condition (di*).
Table 18.
The distances between the target alternative and the worst and best conditions. di* and di− represent the distances from the best and worst ideals, respectively.
Table 19 shows the values of the similarity coefficient (CCi) and the ranks of candidates.
Table 19.
The similarity coefficient and the ranks of candidates.
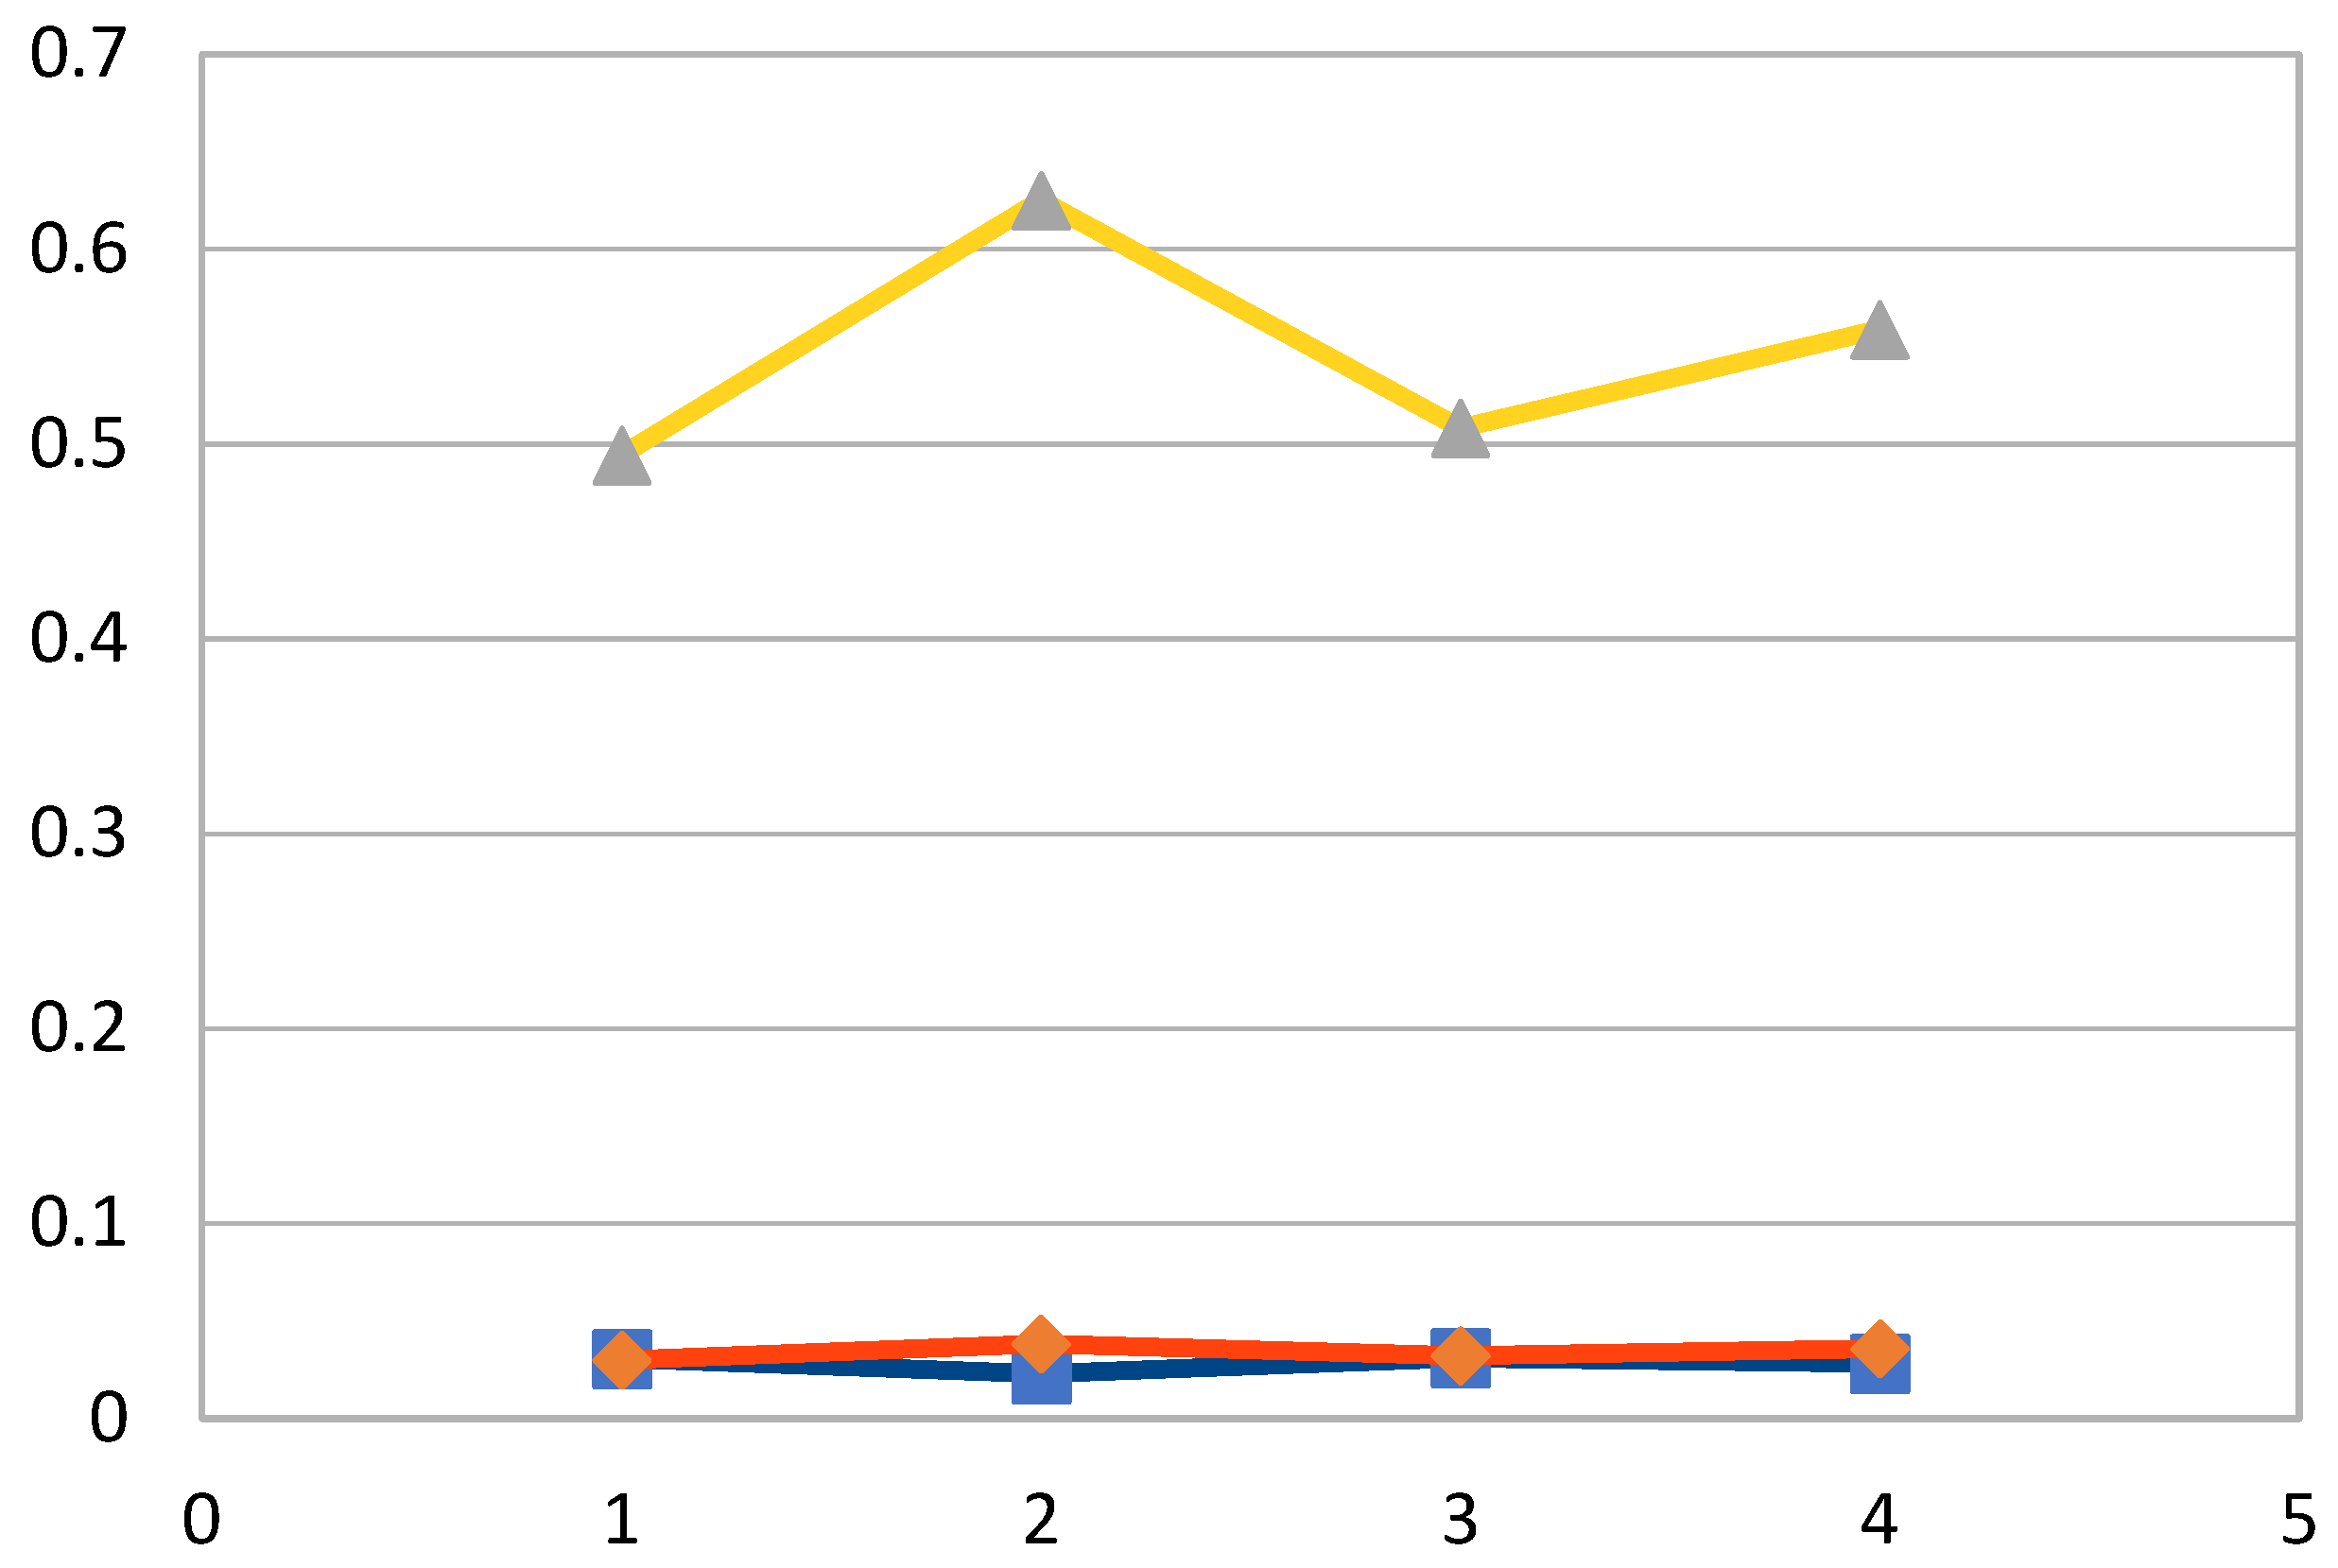
As shown in Table 19, the second, third, first, and fourth candidates have the first, second, third, and fourth ranks, respectively.
Figure 4 shows the distances between the target alternative and the worst and best conditions and the similarity coefficients of the candidates.
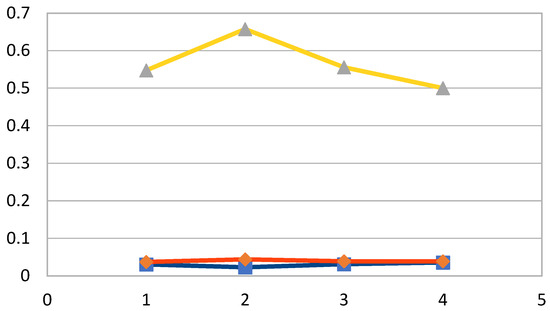
Figure 4.
The distances between the target alternative and the worst and best conditions and the similarity coefficients of the candidates. The spots from left to right correspond to the first, second, third and fourth candidates, respectively. The blue, red and yellow lines represent the distance from the best ideal, the distance from the worst ideal and the closeness coefficients of the candidates, respectively.
The comparison of the results in Table 17 and Table 19 and Figure 3 and Figure 4 reveal that the same candidates’ ranks were obtained with the modified TOPSIS method due to the non-consideration of the fuzzy values for the candidates’ colors. This showed the efficiency of the automated decision-making process with the TOPSIS modification.
In another investigation, eight candidates, C1, C2, C3, C4, C5, C6, C7, and C8, which were the drinks with different colors (light orange, dark orange, light pink, dark pink, light red, dark red, light violet, and dark violet), were chosen for analysis. The fuzzy values of 0.3, 0.5, 0.7, and 0.9 were used for the colors of orange, pink, red, and violet, respectively. The weight values and criterion types were the same as those of the three series of analyses presented in Section 3.1. The modified TOPSIS was used for the candidates’ ranking. Table 20 shows the comparative rankings.
Table 20.
The comparative rankings of eight candidates.
The modified TOPSIS made the non-consideration of the last column in the evaluation matrix, which corresponded to the candidates’ colors, and the same rankings as those without this column in the matrix were obtained. This showed the efficiency of the modification in the algorithm for the automated decision-making process.
A recent study showed the optimization of a combination of polyacrylamide flocculants for clarifying raw molasses during rum fermentation using a mixture model. Temperature, oxygenation, and nutrients had an impact on critical fermentation responses [31]. The fermentation process can be applied for the manufacture of a variety of beverages, in which the release and development of lactic acid, carbon dioxide, alcohol, and flavoring compounds are required [32]. The formulations of these beverages can be predicted and optimized with TOPSIS.
Some manufacturers have used the ingredients in foods and beverages producing hydrogen peroxide [33,34,35]. The physicochemical properties of these materials have been investigated previously [36]. It has been revealed that the production of hydrogen peroxide in tea beverages can be dominated by catechins, with multiple factors acting synergistically, which in turn can lead to aroma deterioration and affect the quality of these beverages [37]. As an oxidizer, the consumption of hydrogen peroxide can lead to the production of free radicals, damaging proteins, DNA, and cell membrane lipids. This chemical, with a concentration-dependent toxicity, can be harmful upon dermal, ophthalmic exposure, ingestion, and wound [38]. Therefore, the presence of hydrogen peroxide in beverages can be considered as a cost criterion in a further investigation with TOPSIS.
The acidity of beverages is an accurate indicator of their erosive potential, which is determined according to their ingredients. As baseline pH values only give a measure of the initial hydrogen ion concentration, they provide no indication as to the presence of undissociated acid. Therefore, the total titratable acidity is considered a more accurate measure of the total acid content of a drink for predicting its erosive potential [39]. More beverages have an acidic pH due to their ingredients [40]. It has been revealed that acidic beverages can alter the roughness and color stability of polymerized acrylic resin and artificial teeth [41], which have diverse biomedical applications [42]. Another study has shown that acidulated drinks overwhelm the neutralizing effects of alkaline-stimulated saliva, and their frequent consumption can pervade all oral organs (tongue, teeth, gums, cheeks, palate, etc.) and oral stagnation niches [43]. The erosive effects through the decreased surface hardness and weight loss of human tooth specimens have been revealed with the analysis of acidic drinks [44]. The optimization of the acidity of beverages considering the ingredients used for their formulations is an important issue for further investigations.
The results obtained in the current work could have diverse applications in sciences and engineering as well as industrial applications. It is worth noting that the optimization of beverage formulations requires a comparison of the studied soft drinks with new formulations. Further investigations are required to determine the best formulation for other types of drinks, similarly to the analyses presented in this investigation.
The optimization of the applied model in this study as well as similar models used for the analysis of fermentation output could be performed with TOPSIS. This can help optimize the fermentation conditions for the manufacture of alcoholic drinks.
4. Conclusions
This work focused on the prediction and optimization of soft drink formulation with TOPSIS. The candidates analyzed in this investigation had different ingredient concentrations. The results of the study revealed that the modifications of the weight values and criterion types did not affect the candidates’ ranks when the same concentrations were considered for their ingredients. The modification of the small weight values considered for the candidates did not have an impact on the TOPTIS output. Moreover, the change of the criterion type did not affect the candidates’ ranking when the modification accompanied the modification on the low weight values. On the other hand, when a modification was performed on the concentration of the preservatives of a candidate without the change of the weight values and criterion types, the ranks changed. So, the output of TOPSIS was different from the previous series of analyses. Therefore, the choice of appropriate ingredient concentrations of soft drinks would be crucial for further investigations of these beverages. The results obtained in this work could be used in the beverage industry for the improvement of product quality.
Funding
This research received no external funding.
Data Availability Statement
No new data was created apart from those presented in this paper.
Conflicts of Interest
The author declares no conflicts of interest.
Abbreviations
The following abbreviations are used in this manuscript:
| TOPSIS | Technique for Order of Preference by Similarity to Ideal |
| BMI | Body mass index |
| W | Water |
| SU | Sugar |
| FJ | Fruit juice |
| SW | Sweeteners |
| CD | Carbon dioxide |
| A | Acids |
| F | Flavors |
| C | Colors |
| P | Preservatives |
| E | Emulsifiers |
| AO | Antioxidants |
| V | Vitamins |
References
- Kregiel, D. Health safety of soft drinks: Contents, containers, and microorganisms. BioMed Res. Int. 2015, 2015, 128697. [Google Scholar] [CrossRef] [PubMed]
- Ramos, M.; Valdés, A.; Mellinas, A.C.; Garrigós, M.C. New trends in beverage packaging systems: A review. Beverages 2015, 1, 248–272. [Google Scholar] [CrossRef]
- Twede, D.; Harte, B. Logistical packaging for food marketing systems. In Food and Beverage Packaging Technology, 2nd ed.; Coles, R., Kiwan, M., Eds.; Wiley/Blackwell: Chichester, UK, 2011; pp. 85–105. [Google Scholar]
- Silva, M.M.N.; Albuquerque, T.L.; Pereira, K.S.; Coelho, M.A.Z. Food additives used in non-alcoholic water-based beverages—A review. J. Nutr. Health Food Eng. 2019, 9, 109–121. [Google Scholar] [CrossRef]
- Abdellatif, A.S.A. The beverages. Acta Sci. Nutr. Health 2018, 2, 19–27. [Google Scholar]
- Rampersaud, G.C.; Bailey, L.B.; Kauwell, G.P.A. National survey beverage consumption data for children and adolescents indicate the need to encourage a shift toward more nutritive beverage. J. Am. Diet. Assoc. 2003, 103, 97–100. [Google Scholar] [CrossRef]
- Cuomo, R.; Andreozzi, P.; Zito, F.P. Alcoholic beverages and carbonated soft drinks: Consumption and gastrointestinal cancer risks. Cancer Treat. Res. 2014, 159, 97–120. [Google Scholar]
- Dhingra, R.; Sullivan, L.; Jacques, P.F.; Wang, T.J.; Fox, C.S.; Meigs, J.B.; D’Agostino, R.B.; Gaziano, J.M.; Vasan, R.S. Soft drink consumption and risk of developing cardiometabolic risk factors and the metabolic syndrome in middle-aged adults in the community. Circulation 2007, 116, 480–488. [Google Scholar] [CrossRef]
- Schiano, C.; Grimaldi, V.; Scognamiglio, M.; Costa, D.; Soricelli, C.; Nicoletti, G.F.; Napoli, C. Soft drinks and sweeteners intake: Possible contribution to the development of metabolic syndrome and cardiovascular diseases. Beneficial or detrimental action of alternative sweeteners? Food Res. Inter. 2021, 142, 110220. [Google Scholar] [CrossRef]
- Pepin, A.; Stanhope, K.L.; Imbeault, P. Are fruit juices healthier than sugar-sweetened beverages? A review. Nutrients 2019, 11, 1006. [Google Scholar] [CrossRef]
- Lobach, A.R.; Roberts, A.; Rowland, I.R. Assessing the in vivo data on low/no-calorie sweeteners and the gut microbiota. Food Chem. Toxicol. 2019, 124, 385–399. [Google Scholar] [CrossRef]
- Daly, K.; Darby, A.C.; Shirazi-Beechey, S.P. Low calorie sweeteners and gut microbiota. Physiol. Behav. 2016, 164, 494–500. [Google Scholar] [CrossRef] [PubMed]
- Wanyonyi, M.; Kiluyi, J.W.; Okango, A.A. Optimization of a functional beverage formulation using a constrained mixture design with multiple responses. Asian J. Prob. Stat. 2025, 27, 1–16. [Google Scholar] [CrossRef]
- Muniandy, A.; Beniyathiar, P.; Ozadali, F.; Mishra, D.K. Development of predictive model for the novel ultra-accelerated shelf-life test (UASLT) for shelf-life of packaged beverage. LWT Food Sci. Technol. 2024, 210, 116686. [Google Scholar] [CrossRef]
- Astawan, M.; Mahdi, S.A.; Budi, A.S.; Wresdiyati, T.; Febrinda, A.E. Optimization of beverage powder formula based on the defatted tempe flour. Food Sci. Technol. 2023, 11, 33–43. [Google Scholar] [CrossRef]
- Moslemi, M.; Moayedi, A.; Khomeiri, A.; Maghsoudlou, Y. Development of a whey-based beverage with enhanced levels of conjugated linoleic acid (CLA) as facilitated by endogenous walnut lipase. Food Chem. 2023, 17, 100547. [Google Scholar] [CrossRef]
- Rahim, R.; Supiyandi, S.; Siahaan, A.P.U.; Listyorini, T.; Utomo, A.P.; Triyanto, W.A.; Irawan, Y.; Aisyah, S.; Khairani, M.; Sundari, S.; et al. TOPSIS method application for decision support system in internal control for selecting best employees. J. Phys. Conf. Ser. 2018, 1028, 012052. [Google Scholar] [CrossRef]
- Javanbakht, T. Automated decision-making for water analysis. J. Eng. Sci. 2022, 9, H19–H24. [Google Scholar] [CrossRef]
- George, J.; Singh, A.; Bhaisare, A.K. Implementation of TOPSIS technique for supplier selection. Int. Res. J. Eng. Technol. 2018, 5, 2582–2585. [Google Scholar]
- Fahmi, M.H.I.; Amin, I.H.A. Best products with TOPSIS method and sales forecasting with weighted moving average. J. App. Inform. Comput. 2020, 4, 116–123. [Google Scholar] [CrossRef]
- Nordin, W.N.H.W.; Zuhaimi, N.M.; Muhamad, R. The selection of beverage cafes using fuzzy TOPSIS. J. Math. Comput. Sci. 2021, 7, 129–140. [Google Scholar]
- Draculan, K.A.E.; Santoso, B.S.; Sinawang, B.H.; Perez, W.D.D.P.; Redi, A.A.N.P.; Ho, H.-C.; Ayu, K.G.; German, J.D. Comparative analysis on beverage store owners towards sustainable packaging using multicriteria decision techniques. IOP Conf. Ser. Earth Environ. Sci. 2023, 1324, 012079. [Google Scholar] [CrossRef]
- Bertolini, M.; Esposito, G.; Ramagnoli, G. A TOPSIS-based approach for the best match between manufacturing technologies and product specifications. Exp. Sys. App. 2020, 159, 113610. [Google Scholar] [CrossRef]
- Emovon, I.; Aibuedefe, W.O. Fuzzy TOPSIS application in materials analysis for economic production of cashew juice extractor. Fuzzy Inform. Eng. 2022, 12, 1–18. [Google Scholar] [CrossRef]
- Sriburum, A.; Wichapa, N.; Khanthirat, W. A novel TOPSIS linear programming model based on the Taguchi method for solving the multi-response optimization problems: A case study of a Fish scale scraping machine. Eng. Sci. 2024, 29, 1088. [Google Scholar] [CrossRef]
- Ginting, G.; Fadlina, F.; Aan, M.; Siahaan, A.P.U.; Rahim, R. Technical approach of TOPSIS for decision making. Int. J. Rec. Tren. Eng. Res. 2017, 3, 58–64. [Google Scholar] [CrossRef]
- Behzadian, M.; Otaghsara, K.; Yazdani, M.; Ignatius, J. A state-of the-art survey of TOPSIS applications. Exp. Sys. App. 2012, 39, 13051–13069. [Google Scholar] [CrossRef]
- Javanbakht, T.; Chakravorty, S. Optimization of Machine Learning Algorithms for Proteomic Analysis Using TOPSIS. J. Eng. Sci. 2022, 9, E7–E11. [Google Scholar] [CrossRef]
- Devnath, A.; Islam, M.S.; Islam, R.E. An integrated QFD-TOPSIS method for prioritization of major lean tools: A case study. Int. J. Res. Ind. Eng. 2020, 9, 65–76. [Google Scholar] [CrossRef]
- Javanbakht, T. Modélisation et Traitement Informatique de L’inconsistance des Croyances Épistémiques. Ph.D. Thesis, University of Quebec in Montreal, Montreal, QC, Canada, 2022. [Google Scholar]
- Mangwanda, T.W.; Johnson, J.B.; Batley, R.J.; Jackson, S.; McKeown, T.; Naiker, M. Comprehensive multi-scale optimisation of rum fermentation. Beverages 2025, 11, 17. [Google Scholar] [CrossRef]
- Newbold, D.; Koppel, K. Carbonated dairy beverages: Challenges and opportunities. Beverages 2018, 4, 660. [Google Scholar] [CrossRef]
- Sieg, H.; Schaar, C.; Fouquet, N.; Böhmert, L.; Thünemann, A.F.; Braeuning, A. Particle iron oxide food colorants (E 172) during artificial digestion and their uptake and impact on intestinal cells. Toxicol. Vitr. 2024, 96, 105772. [Google Scholar] [CrossRef] [PubMed]
- Bopitiya, D.; Christensen, D.; Martin, M.; Zhang, J.; Bennett, L.E. Production of hydrogen peroxide in formulated beverages is associated with the presence of ascorbic acid combined with selected redox-active functional ingredients. Food Chem. 2021, 338, 127947. [Google Scholar] [CrossRef]
- Rak, M.; Mendys, D.; Płatek, A.; Sitarz, O.; Stefaniuk, I.; Bartosz, G.; Sadowska-Bartosz, I. Generation of hydrogen peroxide in beer and strong alcoholic beverages. Processes 2025, 13, 277. [Google Scholar] [CrossRef]
- Javanbakht, T.; Laurent, S.; Stanicki, D.; Frenette, M. Correlation between physicochemical properties of superparamagnetic iron oxide nanoparticles and their reactivity with hydrogen peroxide. Can. J. Chem. 2022, 98, 601–608. [Google Scholar] [CrossRef]
- Wang, J.-Q.; Gao, Y.; Long, D.; Yin, J.-F.; Zeng, L.; Xu, Y.-Q.; Xu, Y.-Q. Effects of hydrogen peroxide produced by catechins on the aroma of tea beverages. Foods 2022, 11, 1273. [Google Scholar] [CrossRef]
- Nelson, A.L.; Porter, L. Hydrogen peroxide toxicity. In StatPearls; StatPearls Publishing: Treasure Island, FL, USA, 2025. [Google Scholar]
- Cairns, A.M.; Watson, M.; Creanor, S.L.; Foye, R.H. The pH and titratable acidity of a range of diluting drinks and their potential effect on dental erosion. J. Dent. 2002, 30, 313–317. [Google Scholar] [CrossRef]
- Reddy, A.; Norris, D.F.; Momeni, S.S.; Waldo, B.; Ruby, J.D. The pH of beverages in the United States. Am. Dent. Assoc. 2016, 147, 255–263. [Google Scholar] [CrossRef]
- Bitencourt, S.B.; Catanoze, I.A.; de Silva, E.V.F.; dos Santos, P.H.; dos Santos, D.M.; Turcio, K.H.L.; Guiotti, A.M. Effect of acidic beverages on surface roughness and color stability of artificial teeth and acrylic resin. J. Adv. Prosthodont. 2020, 12, 55–60. [Google Scholar] [CrossRef]
- Javanbakht, T.; Sokolowski, W. Thiol-ene/acrylate systems for biomedical shape-memory polymers. In Shape Memory Polymers for Biomedical Applications; Woodhead Publishing: Sawston, UK, 2015; pp. 157–166. [Google Scholar] [CrossRef]
- Touyz, L.Z.G.; Touyz, S.J.J.; Nassani, L.M. Acidic and alcoholic beverages and teeth, with clinical advisories. EC Dent. Sci. 2018, 17, 1759–1765. [Google Scholar]
- Kumar, N.; Amin, F.; Hashem, D.; Khan, S.; Zaidi, H.; Rahman, S.; Farhan, T.; Mahmood, S.J.; Asghar, M.A.; Zafar, M.S. Evaluating the pH of various commercially available beverages in Pakistan: Impact of highly acidic beverages on the surface hardness and weight loss of human teeth. Biomimetics 2022, 7, 102. [Google Scholar] [CrossRef]
Disclaimer/Publisher’s Note: The statements, opinions and data contained in all publications are solely those of the individual author(s) and contributor(s) and not of MDPI and/or the editor(s). MDPI and/or the editor(s) disclaim responsibility for any injury to people or property resulting from any ideas, methods, instructions or products referred to in the content. |
© 2025 by the author. Licensee MDPI, Basel, Switzerland. This article is an open access article distributed under the terms and conditions of the Creative Commons Attribution (CC BY) license (https://creativecommons.org/licenses/by/4.0/).