Article

Comprehensive Characterization (Chromatography, Spectroscopy, Isotopic, and Digital Color Image) of Tequila 100% Agave Cristalino as Evidence of the Preservation of the Characteristics of Its Aging Process

by
Walter M. Warren-Vega
1,2,
Rocío Fonseca-Aguiñaga
1,2,
Arantza Villa-González
1,
Camila S. Gómez-Navarro
1 and
Luis A. Romero-Cano
1,*
1
Grupo de Investigación en Materiales y Fenómenos de Superficie, Departamento de Biotecnológicas y Ambientales, Universidad Autónoma de Guadalajara, Av. Patria 1201, Zapopan 45129, Mexico
2
Laboratorio de Isotopía, Consejo Regulador del Tequila A.C., Av. Patria 723, Zapopan 45030, Mexico
*
Author to whom correspondence should be addressed.
Beverages 2025, 11(2), 42; https://doi.org/10.3390/beverages11020042
Submission received: 28 December 2024 / Revised: 28 January 2025 / Accepted: 24 February 2025 / Published: 20 March 2025

Abstract

:
To obtain fundamental information on the Tequila 100% agave Cristalino commercial samples were characterized in their different classes. For this purpose, 12 samples were chosen, defined as: G1 (aged; n = 3, or extra-aged; n = 3) and G2 (aged-Cristalino; n = 3 or extra-aged-Cristalino; n = 3). Analytical characterization was performed on these beverages, consisting of isotope ratio mass spectrometry, gas and liquid chromatography, UV-Vis spectroscopy, and color using digital image processing. The results corroborate that the chromatographic characterization (mg/100 mL A.A.)—higher alcohols (299.53 ± 46.56), methanol (212.02 ± 32.28), esters (26.02 ± 4.60), aldehydes (8.93 ± 4.61), and furfural (1.02 ± 0.56)—and isotopic characterization—δ13CVPDB = −13.02 ± 0.35 ‰ and δ18OVSMOW = 21.31 ± 1.33 ‰—do not present statistically significant differences (p > 0.05) between groups. From these techniques, it was possible to reinforce that isotopic ratios can provide information about that the ethanol of these alcoholic beverages come from Agave tequilana Weber blue variety and it is not affected in the filtration process. Based on the UV-Vis analysis, I280 and I365 were obtained, which were related to the presence of polyphenols and flavonoids—expressed as mg quercetin equivalents/L—only found in group 1. Due to the presence of flavonoids in aged beverages, the oxidation process results in the formation of an amber color, which can be measured by an RGB color model; therefore, the analysis shows that there is a statistically significant difference (p < 0.05) between groups. It can be concluded that Tequila 100% agave Cristalino is a Tequila 100% agave aged or extra-aged without color in which its chromatographic and isotopic profile is not affected.

1. Introduction

Innovation in the tequila industry has led to the development of new products that meet the needs of consumers [1]. In recent years, the commercialization of Tequila 100% agave such as aged Cristalino, extra-aged Cristalino, and ultra-aged Cristalino has gained significant attention. These products comply with the specifications required by the Official Mexican Standard NOM-006-SCFI-2012 as aged beverages, being aged class (AC), extra-aged class (EC), and ultra-aged class (UC), undergoing an additional process to remove the color while retaining organic compounds acquired during the maturation stage. This additional stage focuses on selectively removing the characteristic amber color, characteristic of beverages aged in wooden casks (oak or Encino oak), while preserving the compounds that contribute to the flavor and aroma profile. The processes used to achieve this color removal may include adsorption with activated carbon, filtration with cellulose fibers, distillation, or a combination of the above processes. Each company has its own processes and operating conditions, and the adjustment of the operating conditions provides the final product with unique sensory characteristics.
Cristalino beverages have gained great acceptance among consumers due to their organoleptic properties. These beverages are marketed as aged Tequila 100% agave Aged Cristalino, Tequila 100% agave Extra-aged Cristalino, or Tequila 100% agave Ultra-aged Cristalino, reflecting their origins as aged Tequilas with a selective color removal process. However, there is limited scientific evidence critically analyzing this claim. This study aims to address this gap by providing a comprehensive physicochemical characterization of Tequila 100% agave Cristalino. The objective is to establish fundamental evidence supporting the classification of Tequila 100% agave Cristalino as an aged product with a selective decolorization process.
The characterization of Tequila Cristalino must be based on analytical techniques capable to identify and differentiate its unique attributes. In this sense, chromatographic, spectroscopic, electronic, and isotopic techniques have proven indispensable for ensuring quality and complement authenticity. Table 1, Table 2, Table 3, Table 4 and Supplementary Figure S1 summarize the state of the art in this area, highlighting key milestones in recent years. It is highlighted that these methodologies are particularly valuable for distinguishing product classes and detecting adulteration.
Chromatography, including gas and liquid methods, allows the precise identification and quantification of key volatile and phenolic compounds, such as furfural, methanol, aldehydes, esters, and higher alcohols, which are essential for evaluating physicochemical parameters, as stipulated in the Official Mexican Standard NOM-006-SCFI-2012 [2,5,6,8,9,10]. UV-Vis spectroscopy [30,31,33,34] and artificial vision techniques [51,54] have emerged as effective tools for analyzing components such as furanic compounds, while isotopic techniques, like isotope ratio mass spectrometry (IRMS), provide detailed information on carbon-13 and oxygen-18 ratios. These isotopic markers are associated with the origin of agave and maturation processes, offering robust auxiliary criteria to differentiate tequila from non-authentic samples or other agave-based beverages [16,18,19,20]. Together, these analytical approaches form a robust framework for quality assurance and matter authenticity.
Given the growing popularity of Tequila Cristalino beverages and their increasing market demand, there is an urgent need to provide a comprehensive characterization of its unique attributes. Additionally, it is essential to address concerns regarding potential alterations in isotopic values or chromatographic profiles due to the filtration process. This study seeks to provide the scientific community with a detailed analysis of Tequila Cristalino through its chromatographic, isotopic, and color profiles, underscoring the rigorous science behind the innovation in the tequila industry.

2. Materials and Methods

2.1. Samples

The twelve samples analyzed correspond to five different companies whose facilities are located within the Tequila Appellation of Origin of territory (DOT, by its Spanish acronym); these companies come from the Altos and Valles regions of Jalisco state. In the case of Tequila 100% agave aged class, the samples were subject to an aging process of at least two months in direct contact with the wood of oak or Encino oak. For Tequila 100% agave extra-aged class, the samples were subjected to an aging process of at least one year with oak or Encino oak containers. All batches were inspected in terms of conformity assessment to comply with the requirements established in the Official Mexican Standard NOM-006-SCFI-2012. The samples were divided into two groups: G1 (aged; n = 3 or extra-aged; n = 3) and G2 (aged-Cristalino; n = 3 or extra-aged-Cristalino; n = 3).
All samples were delivered to the Isotope Laboratory of the Consejo Regulador del Tequila (CRT, by its Spanish acronym) for research purposes under a confidentiality agreement. Due to the nature of this agreement, specific details about the samples, such as brands and manufacturers, cannot be disclosed publicly. However, the regulatory organism assures the authenticity of the samples and all information relevant to the interpretation and reproducibility of the results has been included in this manuscript.

2.2. Physicochemical Characterization

2.2.1. Gas and Liquid Chromatography

Based on the methodology described in the Mexican Standard NMX-V-005-NORMEX-2018 and in previous research [52], the congeners which correspond to methanol, aldehydes, esters, and higher alcohols were analyzed. The equipment employed consisted of a gas chromatograph Agilent 7890B (Agilent Technologies, Santa Clara, CA, USA) coupled to an FID (flame ionization detector) with an automatic sampler with capillary injection. An Agilent J&W DB-WAX UI column with a total length of 60 m by 0.25 mm of inner diameter and 0.25 μm of film thickness was used. In the case of the furnace, different temperature ramps were programmed (34 °C in 4 min), followed by an increase of 10 °C min−1 until it reached 160 °C. After that, a ramp of 15 °C min−1 was used until 200 °C was reached and held constant for 3 min. A sample volume was injected (1.0 µL) in a split mode with a split ratio of 30:1, using nitrogen as a gas carrier with a volumetric flow of 1.13 mL min−1. For the case of the detector and injector, a temperature of 220 °C was reached. The analysis was performed in duplicate.
In the case of liquid chromatography, the methodology employed was based on the Mexican Standard NMX-V-004-NORMEX-2018. To determine furfural, an HPLC Infinity 1260 (Agilent Technologies, Santa Clara, CA, USA) was employed with an Agilent Zorbax XBD-C18 of 250 mm by 4.6 mm and 5 μm. The conditions for the mobile phase were a mixture of water and methanol (50:50) with a flux of 0.5 mL min−1. The volume of injection was 5 µL and the lamp was at a wavelength of 280 nm.

2.2.2. Isotope Ratio Mass Spectrometry (IRMS)

Isotopic ratios of carbon 13 (δ13C) and oxygen 18 (δ18O) were analyzed in the beverages based on the methodology established by Fonseca-Aguiñaga et al. [24]. In summary, samples underwent a distillation process, controlled by an automatic control distillation system in which the ethanol–water azeotrope at 78 °C was collected. As quality controls, ethanol composition needed to be equal to or greater than 92% (w/w), with a yield of at least 96% to avoid isotope fractionation. Then, the obtained alcohol was analyzed with GC/C/IRMS to determine the isotopic ratios of carbon (δ13C) and GC/HTC/IRMS for the isotopic ratios of oxygen (δ18O). The equipment used consisted of a gas chromatograph Trace 1310 (Thermo Scientific, Bremen, Germany) and an isotope ratio mass spectrometer Delta V Plus (Thermo Scientific, Bremen, Germany). The analysis was performed in triplicate.

2.2.3. Image Analysis by Artificial Vision

The implementation of color models such as RGB and HSV were used to decompose digital images taken to the samples [55]. Due to the importance of assuring the quality of the results, the evaluation of the facilities and environmental conditions is described as follows, in which digital images were taken from a direct white LED light source (45 W) in a continuous mode and at a power of 35%. All photos were taken with 30 cm between the object and the camera, under the following conditions: a lens objective of 18–25 mm, an aperture of the lens at an ISO 500 in range of 4 to 5 mm, and manual operation. The images were saved in a jpeg format, with an average per image of 3 MB (14.2 megapixel resolution, 4592 × 3056 pixels). Image processing consisted of selecting and clipping a region of interest (defined as at least 60% of the total area of the beverage resulting in a new image with a dimension of 843 × 880 pixels). Using its CCD (Charge-Coupled Device) detector, it was possible to capture digital images and convert them into a voltage sequence to be translated into an analytical signal. Based on the principle of the RGB model to decompose the digital images in three colors (red, green, and blue), distribution histograms were obtained for each channel using MATLAB R2023a software [56]. The results obtained were corroborated using BGR-Chem Lab® (version 2.5, 2024) software. After that, the values of RGB were transformed to HSV (Hue, Saturation, and Value), which resembles color in human perception.

2.2.4. UV-Vis Spectroscopy

A UV-1800 spectrophotometer (SHIMADZU, Kyoto, Japan) was used to obtain the UV-Vis spectra of the beverages. The spectra obtained were from the band of 200 to 600 nm at an interval of 0.5 nm in an absorbance mode. A reference solution of 40% v/v ethanol:water was used.
Additionally, a calibration curve of quercetin in acidic ethanolic solutions (pH 4) was performed in a range of 1 to 20 mg/L to determine the total flavonoid content as mg of Quercetin Equivalent/L (mg Q.E./L) present in the beverages (Supplementary Figure S2).

2.3. Statistical Analysis

Using the experimental data obtained from the analytical characterization of the beverages, STATISTICA 10.0 software (StatSoft, Palo Alto, CA, USA) was used for the descriptive statistics and for one-way analysis of variance (ANOVA) to determine the existence of statistically significant differences between the means of the groups (Tequila 100% agave aged or extra-aged class, and Tequila 100% agave aged Cristalino or extra-aged Cristalino) using a significance level of 95%.

3. Results and Discussion

3.1. Comparison of the Chromatographic and Isotopic Profiles of the Beverage

The physicochemical analysis of the tequila samples is displayed in Figure 1a and Supplementary Table S1. Across all samples, the concentration of congeners complied with the requirements required in the Official Mexican Standard NOM-006-SCFI-2012, remaining within the permissible limits to ensure consumer safety. In terms of higher alcohols (299.53 ± 46.56 mg/100 mL A.A.), esters (26.02 ± 4.60 mg/100 mL A.A.), aldehydes (8.93 ± 4.61 mg/100 mL A.A.), and furfural (1.02 ± 0.56 mg/100 mL A.A.), an increase in concentration is observed, attributed to the aging process when compared to Tequila 100% agave silver class tequila [57,58]. This can be corroborated with the chemical transformations that occur during aging, such as the oxidation of ethanol to acetaldehyde in oak barrels, which subsequently leads to the oxidation of polyphenols like flavanols and anthocyanins, impacting sensory properties such as aroma and color. Then, acetic acid is formed as acetaldehyde undergoes further oxidation, as well as the reaction of acetic acid with ethanol produces ethyl acetate, which influences the aroma of the beverage [22,23]. The rise in furfural concentration in aged samples is associated with its extraction from the wooden barrels, aligning with earlier findings by Ortega-Heras et al. (2007) [59]. It is important to mention that methanol levels (212.02 ± 32.28 mg/100 mL A.A.) cannot be linked to the aging process, as methanol’s presence in the final product has been extensively studied due to a demethoxylation reaction occurring during hydrolysis process of agave pectins [24,59].
On the other hand, the distribution of the isotopic ratios of δ13CVPDB and δ18OVSMOW are presented in Figure 1b. This characterization has been used as an additional parameter to ensure the authenticity of the sugar source used as raw material, as well as the aging time of the Tequila 100% agave [25]. The results showed that δ13CVPDB was found at an average of −13.02 ± 0.35‰ for all the beverages analyzed, with no significant difference between them, demonstrating that for all the samples analyzed, Agave tequilana Weber blue variety was used as a source of sugar for obtaining the ethanol [53]. On the other hand, the results for δ18OVSMOW showed average values of 21.31 ± 1.33‰ associated with the maturation process [23].
Finally, when comparing groups (Tequila 100% agave aged or extra-aged versus their respective Tequila 100% agave Cristalino) there were no statistically significant differences (p > 0.05) (Figure 1a–g, Supplementary Tables S2–S9), so it is possible to conclude that, after the removal process, the beverage mostly retains the chromatographic and isotopic characterization of an aged beverage, demonstrating that the process is selective, so Tequila 100% agave Cristalino corresponds to an Tequila 100% agave aged or extra-aged without color.

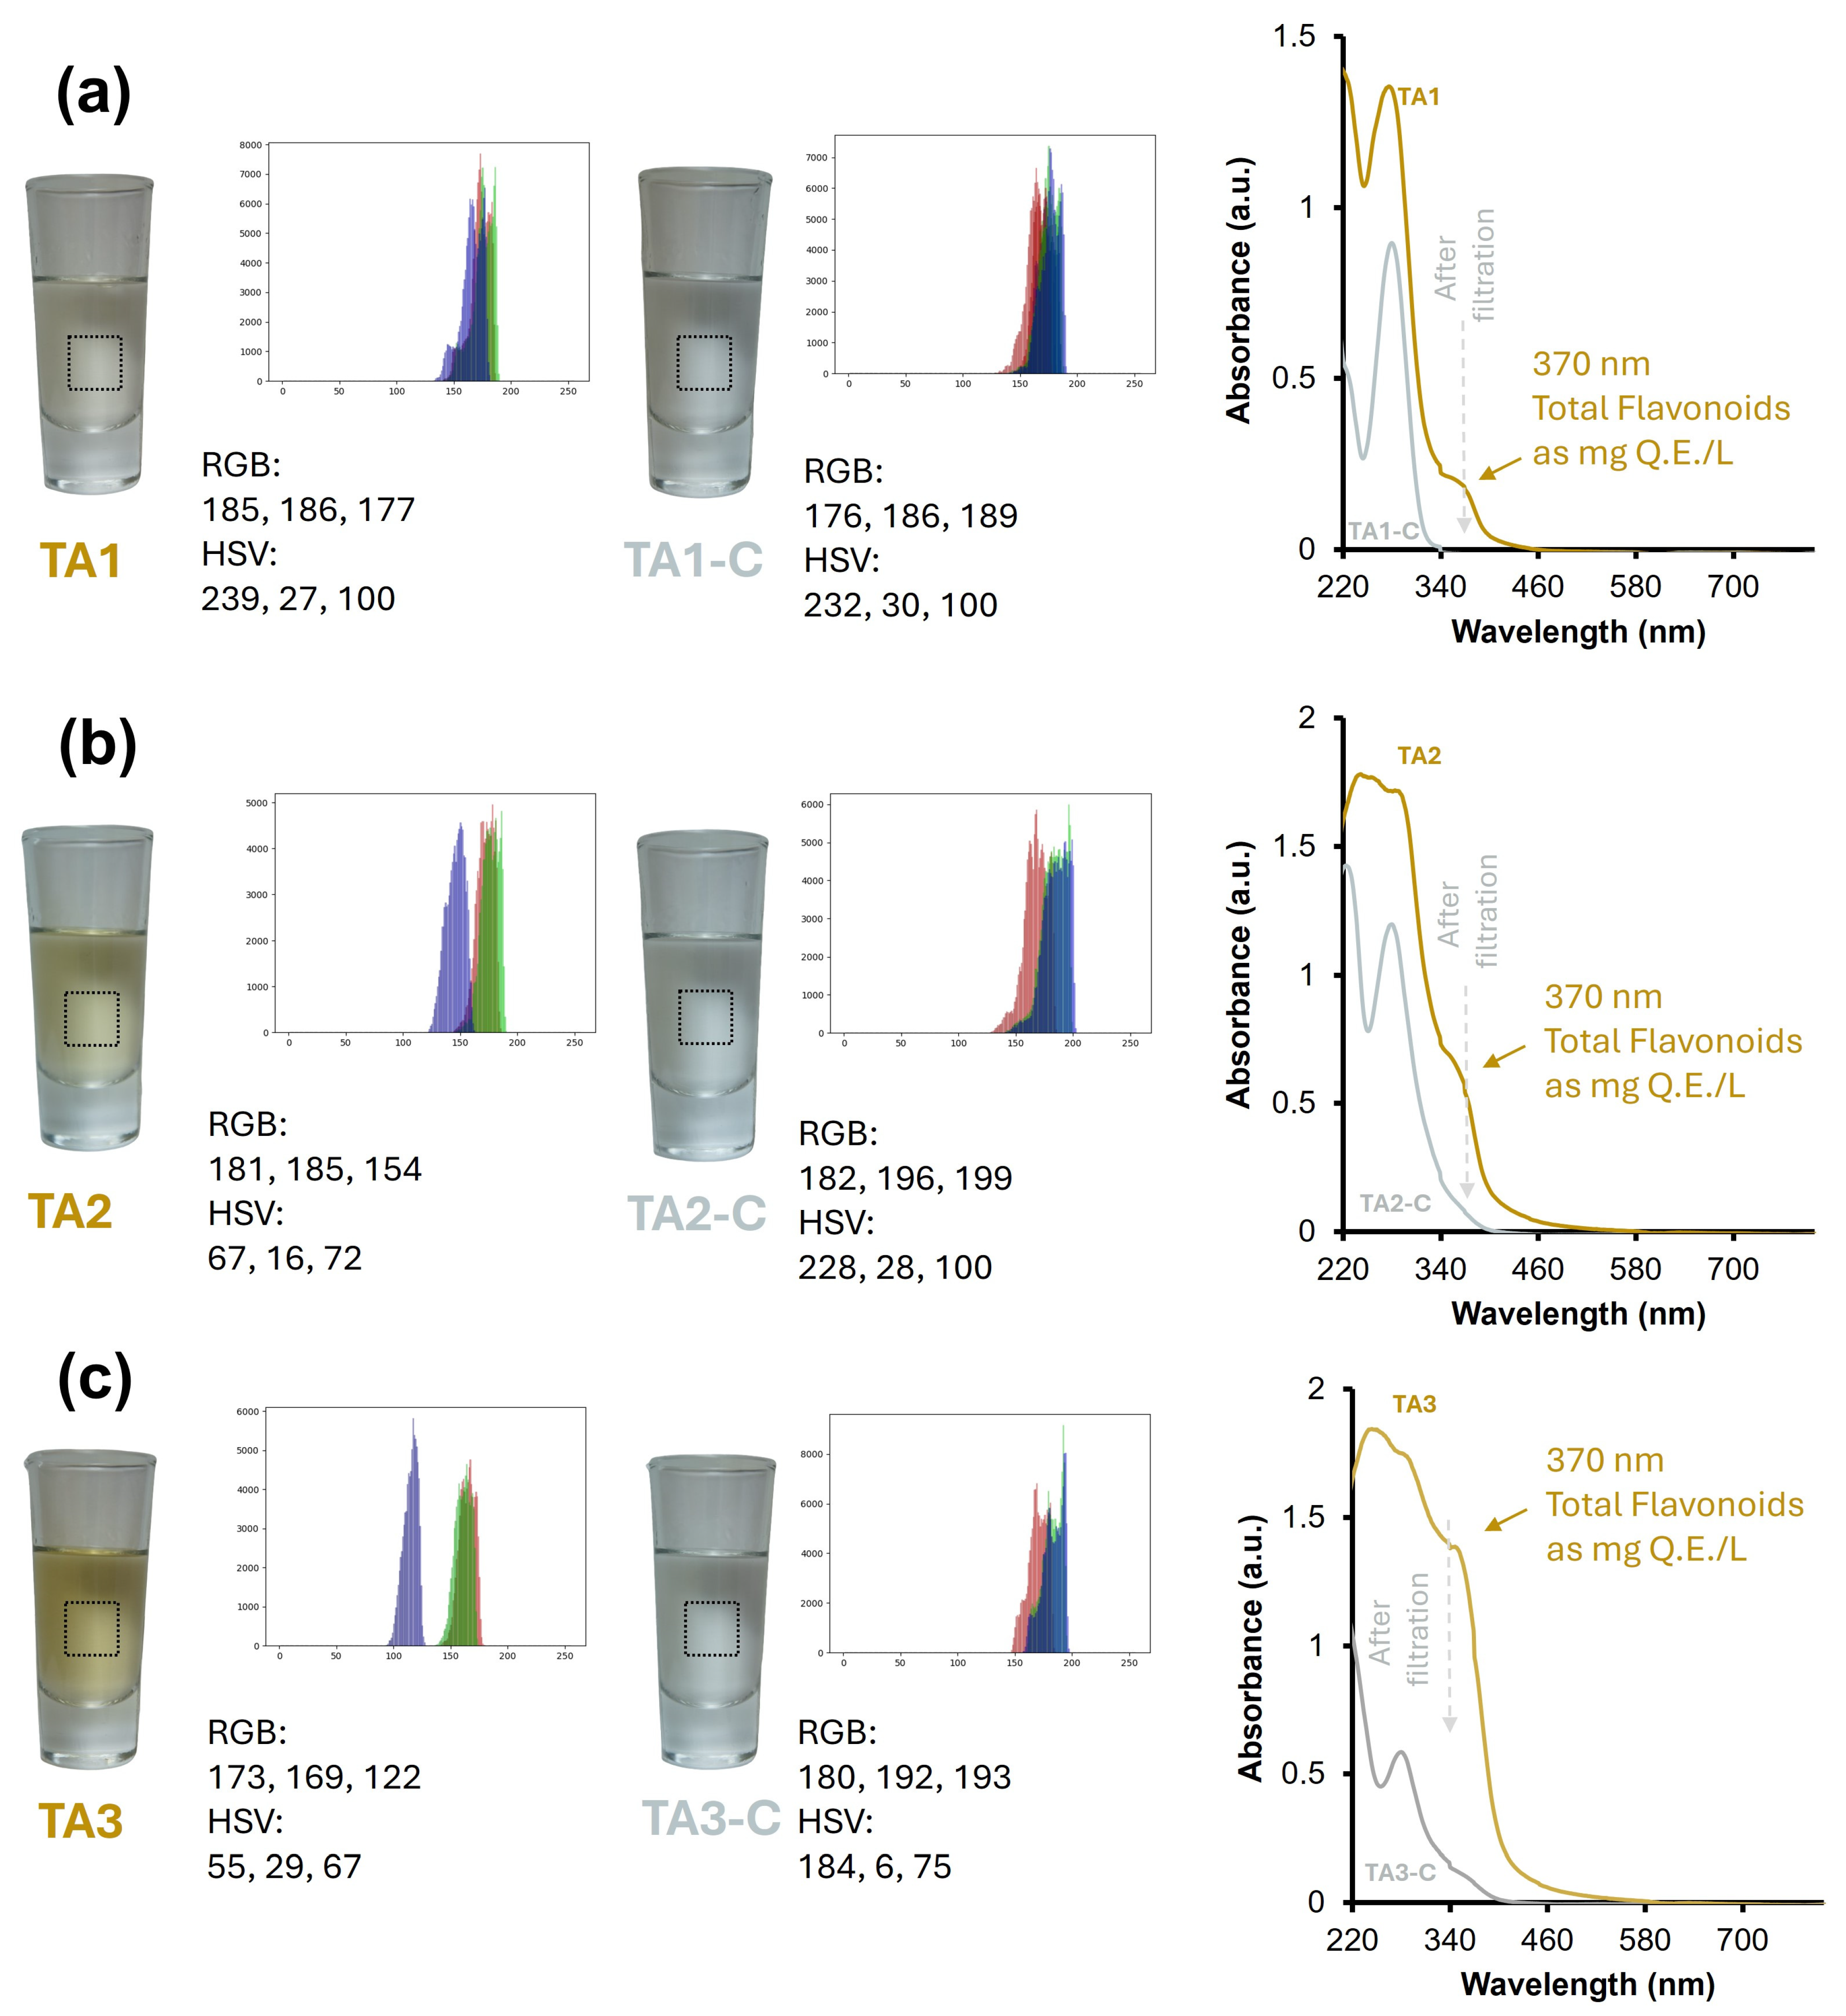
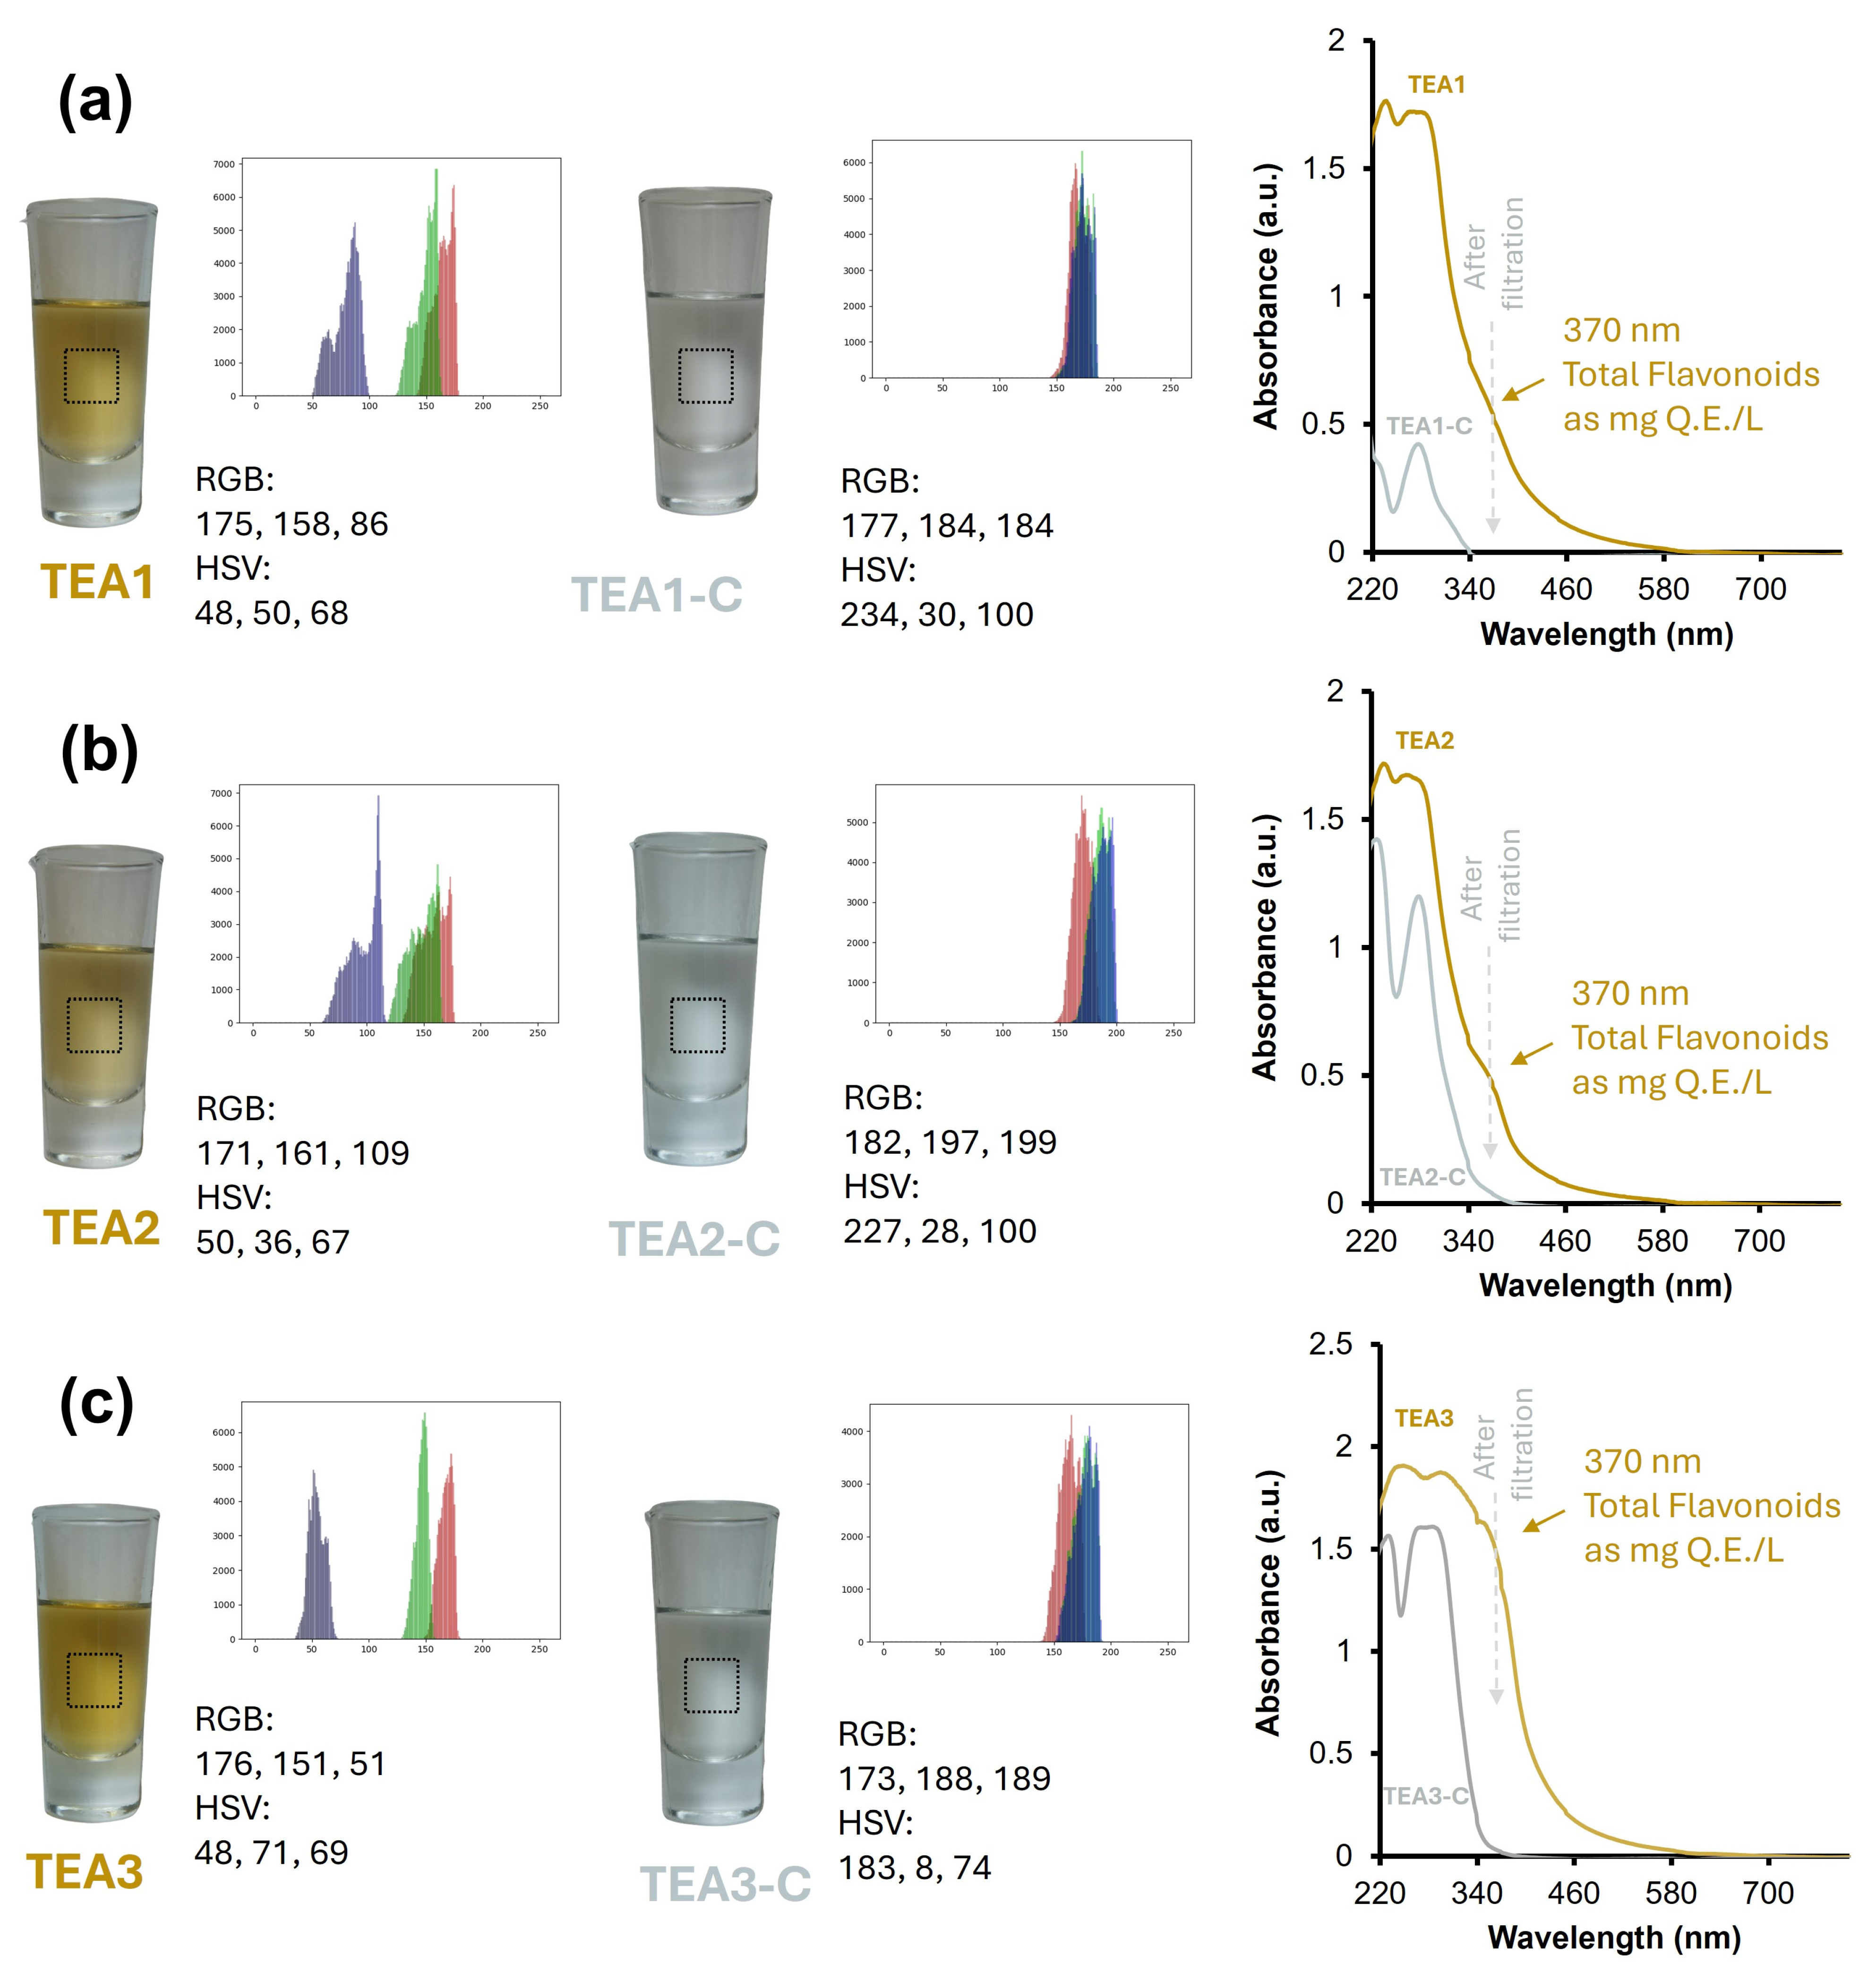
3.2. Color Perception Comparison: Tequila 100% Agave Aged vs. Tequila 100% Agave Cristalino Using Artificial Vision and UV-Vis Spectroscopy

Figure 2 and Figure 3 show a quantitative analysis of color perception using artificial vision and spectrophotometric analysis. Figure 2 shows that Aged Tequilas (TA) have average RGB values of 179.67, 180.00, and 151.00 (see Supplementary Table S1), corresponding to a soft tone like light beige. In the RGB color model, green and red dominate over blue, indicating a tendency towards earthy and natural tones; similar results have been previously reported by [51,60]. When analyzing the beverages with the HSV (Hue, Saturation, Value) color model, an average hue of 120.33° was observed, showing that the color transitions between yellow and green. With 24% saturation, on average, it is noted that the beverage has a softer and more washed-out appearance. Finally, the 79.66% brightness, on average, shows that the beverage is relatively clear but not bright. Considering the above, it is confirmed that beverages present shades attributable to aged beverages since they tend to develop dull golden or amber colors as the maturation process continues. Compared to their crystalline counterparts, the mean values of its RGB composition were 179.22, 187.33, and 179.67 (see Supplementary Table S1). It can be appreciated that the blue component is higher, thus showing a beverage with a colder and more aquatic color compared to its aged or extra-aged counterpart. When comparing the results using the HSV model, it is highlighted that the beverage has a brighter and more transparent color. These results show that after the removal process there are statistical differences (p < 0.05, Supplementary Table S10) (Figure 1h) in terms of color perception between the Tequila 100% agave aged and their respective crystalline pairs.
Similar results are observed when analyzing the Tequila 100% agave extra-aged against their respective Tequila 100% agave Cristalinos (Figure 3), with the expected difference that the Tequila 100% agave extra aged have a more intense golden color compared to the Tequila 100% agave aged class, attributable to the longer maturation time. The digital image analysis shows the removal of color, highlighting that the Tequila 100% agave Cristalinos have subtle and fresh tones, making them a new experience for those consumers looking for a different interpretation of a traditional aged beverage.
Additionally, a computer vision-based approach was used to characterize aged and extra-aged tequilas and their respective crystalline beverages through the analysis of their chromatic characterization. For this analysis, an algorithm was implemented in MATLAB R2023a that processes the RGB (red, green, and blue) color component values of the samples to identify the presence and intensity of the yellow color, characteristic of aged and extra-aged tequilas due to the barrel maturation process. The algorithm normalizes the RGB values to the range [0, 1] and applies specific thresholds to distinguish between saturated yellow, soft yellow, and light-yellow tones. The yellow intensity in each sample was calculate as follows: Y = (R + G)/B, where R is the normalized value of the red component of the sample (in the range of 0 to 1), G is the normalized value of the green component of the sample (in the range of 0 to 1), and B is the normalized value of the blue component of the sample (in the range of 0 to 1). The resulting Y value is interpreted as an indicator of the yellow intensity, with values close to 1 indicating a saturated (more intense) yellow and lower values indicating a softer hue or absence of yellow.
The algorithm classifies the samples according to their yellow intensity, and a percentage of yellow is assigned to each sample based on its chromatic profile. Tequila 100% agave extra aged and aged samples, which have a more intense yellow hue, show yellow values between 80% and 100%. Samples with no significant presence of yellow (such as Tequila Cristalino) have a percentage close to 0%.
Through this artificial vision-based technique, an objective and precise evaluation of Tequila 100% agave color is achieved, being a complement to other quality parameters that are commonly used. Sensorial analysis based on this algorithm permits a reproducible numerical value to be provided based on the chromatic profile of the samples.
Finally, the results obtained by UV-Vis spectroscopy confirm the conclusions presented in the previous section; the Tequila 100% agave Cristalinos were obtained from a selective process. In all UV-Vis spectra presented in Figure 2 and Figure 3, an absorption band at 365 nm (≈370 nm), perceptible for Tequilas that have undergone a barrel maturation process, and an absorption band at 280 nm (perceptible in all samples) are observed. These absorption bands have been discussed in various research works and attributed to the total flavonoid (I365) and total polyphenol (I280) index, respectively [61,62,63]. Considering the above, the quercetin calibration curve was used to quantify the total flavonoids present in the beverages as mg E.Q./L (Supplementary Figure S1). In all cases, for the Tequila 100% agave Cristalino samples, it is observed that the I280 band remains while the I365 disappears, obtaining UV-Vis spectra similar to [1]. In recent years, the commercialization of aged Tequila 100% agave has increased, so it is proposed that the adsorption mechanism involved is mainly based on π–π interactions of the aromatic rings of flavonoids with the aromatic rings of pseudo-graphitic plates of the material. However, there may also be an interaction between the adsorbent’s oxygenated or nitrogenated groups and the flavonoids’ functional groups, leading to the formation of hydrogen bonds, which would increase the selectivity towards these compounds [39,64].

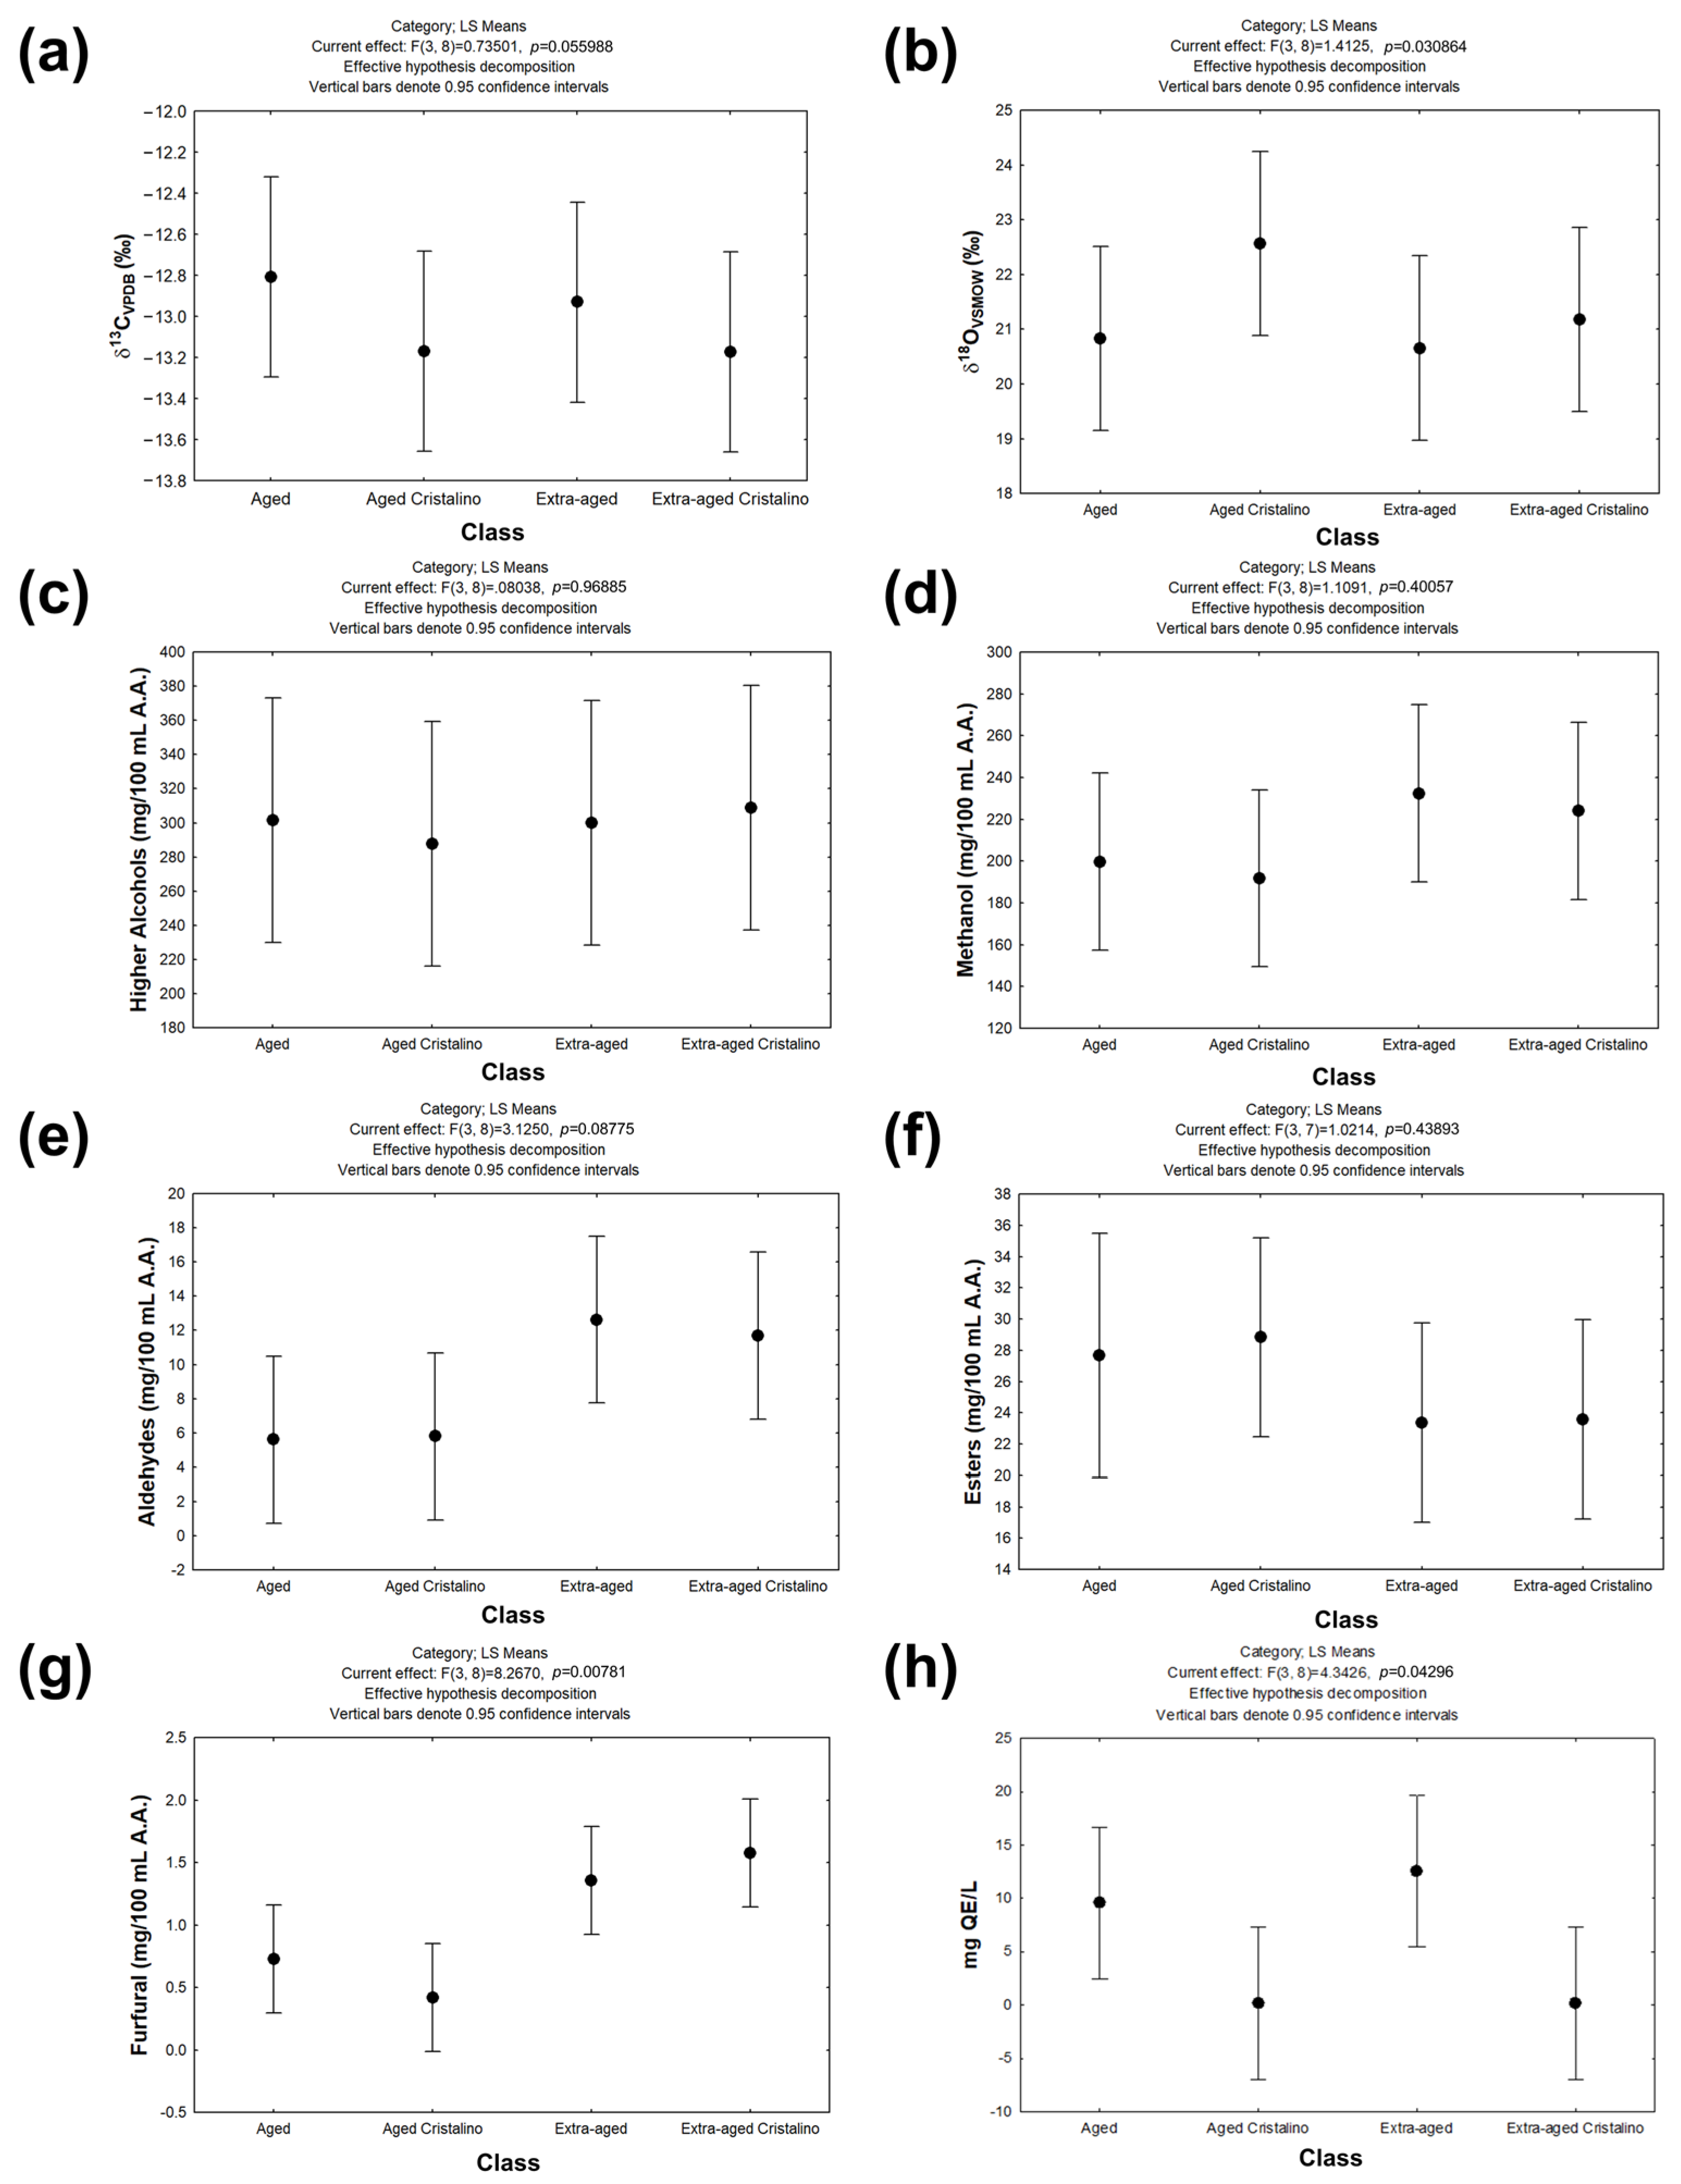
3.3. Integrated Comparison of Chromatographic, Spectroscopic, and Isotopic Characteristics of Aged and Extra-Aged Tequilas 100% Agave and Their Corresponding Cristalino Versions

The integral comparison between Aged and Extra-aged Tequilas 100% Agave, along with their Cristalino counterparts (Figure 4) provides valuable insights into the effects of the aging and filtration processes on the preservation of physicochemical characteristics of these beverages. For this purpose, all the information were integrated into a single radial plot in which the values of the chromatographic characterization of the beverages were normalized, taking as maximum value those established by the Official Mexican Standard NOM-006-SCFI-2012.
The isotopic characterization of the samples did not show significant differences between the Aged and Cristalino. Both groups exhibited δ13CVPDB values consistent with Tequila 100% agave with its sugar source from Agave tequilana Weber blue variety. This is due to the contribution of characteristic compounds from the agave, such as terpenes and acids, which evoke freshness and plant-like qualities [3]. On the other hand, the δ18OVSMOW values are typical of Tequila 100% agave that have undergone barrel aging, during which oxidation reactions lead to the formation of phenolic compounds that contribute to woody notes in the aged classes [65]. These compounds enhance the complexity and depth of flavor, traits typically associated with a maturated class.
These characteristics are also reflected in the chromatographic characterization of beverages, as the analysis of volatile compounds, including higher alcohols, methanol, aldehydes, esters, and furfural, revealed slight variations. The Tequila 100% agave aged Cristalino exhibited lower concentrations of higher alcohols and aldehydes compared to its aged class. These compounds are responsible for the robust and complex flavors of Tequila that were maturated in a wood barrel, suggesting that filtration may reduce the perception of certain intense flavors [9]. However, the levels of esters remained similar, allowing the Cristalino to retain part of their original physicochemical profile, though in a more moderate and balanced manner [66]. It is highlighted that the comparison of Tequila 100% agave aged Cristalino and Extra aged Cristalino isindicates the higher presence of furfural in the Tequila that underwent at least 2 to 12 months of aging, contributing to an enrichment of the beverage’s organoleptic profile. This imparts aromas of toasted wood [67], which remain in its Cristalino.
Finally, the differences in the RGB and UV-Vis spectroscopy characterization of the samples indicate that color is a key organoleptic trait. The Tequila 100% agave (aged and extra aged classes) exhibit a greater yellow intensity, which is associated with compounds produced during barrel aging, such as polyphenols and flavonoids, contributing to a more mature and complex beverage [10]. In contrast, the lighter color of the Cristalino beverages reinforces their fresher, lighter character, aligned with a more subtle and refreshing sensory profile.
Therefore, it can be concluded that the filtration process removes compounds responsible for complexity and color, producing a smoother, lighter, and cleaner beverage, while barrel aging preserves and enhances the complex notes and color that define Aged and Extra-aged Tequilas.

4. Conclusions

The Tequila 100% Agave Cristalino corresponds to the Tequila 100% agave aged and extra aged, from which it derives without color. Its chromatographic and isotopic characterization does not present statistically significant differences (p > 0.05); however, in terms of its color perception and flavonoid quantification, it presents statistically significant differences (p < 0.05) since it has lost its golden hue, highlighting that the beverage has a brighter and more transparent color. Regarding its characterization by UV-Vis spectroscopy, it is shown that the crystalline beverage has lost the absorption band attributable to total flavonoids (I365) but retains the band attributable to total polyphenols (I280), demonstrating that the color removal process is selective and attributable to an adsorption mechanism, mainly due to interactions between the rings of the total polyphenols and the pseudo-graphitic planes of the adsorbent material.
Additionally, the insights gained from this study demonstrate how products such as Tequila 100% agave Cristalino can have the requirements that consumers want but still maintain the high-quality controls that are distinctive of these beverages.

Supplementary Materials

The following are available online: https://www.mdpi.com/article/10.3390/beverages11020042/s1, Table S1. Characterization (Chromatography, spectroscopy, isotopic, and digital color image) of Tequila 100% Agave Aged, Extra-aged, Aged-Cristalino, and Extra aged-Cristalino. Table S2. One-way analysis of variance for δ13CVPDB in different Tequila beverages. SS: sum-of-squares, DF: degrees of freedom, MS: mean squares, F: F-value = MSintercept/MSerror, P: p-value. Table S3. One-way analysis of variance for δ13OVSMOW in different Tequila beverages. SS: sum-of-squares, DF: degrees of freedom, MS: mean squares, F: F-value = MSintercept/MSerror, P: p-value. Table S4. One-way analysis of variance for higher alcohols in different Tequila beverages. SS: sum-of-squares, DF: degrees of freedom, MS: mean squares, F: F-value = MSintercept/MSerror, P: p-value. Table S5. One-way analysis of variance for methanol in different Tequila beverages. SS: sum-of-squares, DF: degrees of freedom, MS: mean squares, F: F-value = MSintercept/MSerror, P: p-value. Table S6. One-way analysis of variance for aldehydes in different Tequila beverages. SS: sum-of-squares, DF: degrees of freedom, MS: mean squares, F: F-value = MSintercept/MSerror, P: p-value. Table S7. One-way analysis of variance for esters in different Tequila beverages. SS: sum-of-squares, DF: degrees of freedom, MS: mean squares, F: F-value = MSintercept/MSerror, P: p-value. Table S8. One-way analysis of variance for furfural in different Tequila beverages. SS: sum-of-squares, DF: degrees of freedom, MS: mean squares, F: F-value = MSintercept/MSerror, P: p-value. Table S9. One-way analysis of variance for mg Q.E./L in different Tequila beverages. SS: sum-of-squares, DF: degrees of freedom, MS: mean squares, F: F-value = MSintercept/MSerror, P: p-value. Table S10. One-way analysis of variance for IRGB in different Tequila beverages. SS: sum-of-squares, DF: degrees of freedom, MS: mean squares, F: F-value = MSintercept/MSerror, P: p-value. Figure S1. Timeline of evolution of study of authenticity and quality of Tequila (in its different categories, T: Tequila; T100%, Tequila 100% agave, and classes, SC. silver class, AC: aged class, EC: extra-aged class, UC: ultra-aged class) through various analytical techniques. Figure S2. Calibration curve of quercetin in acidic ethanolic solutions (pH 4). Figure S3. Comparison of the color perception characterization of Tequila 100% agave aged and extra-aged class against their respective Tequila 100% agave Cristalino. * Note: Results of color perception (IRGB*), 〈IRGB〉 = log〈RGB, average〉blank/〈IRGB, average〉std/unknown) are presented in Supplementary Material.

Author Contributions

Conceptualization, W.M.W.-V. and L.A.R.-C.; methodology, W.M.W.-V., A.V.-G., R.F.-A. and L.A.R.-C.; software, R.F.-A. and C.S.G.-N.; validation, W.M.W.-V. and C.S.G.-N.; formal analysis, all authors; investigation, W.M.W.-V., A.V.-G. and C.S.G.-N.; resources, R.F.-A. and L.A.R.-C.; data curation, A.V.-G. and L.A.R.-C.; writing—original draft preparation, all authors; writing—review and editing, all authors; visualization, W.M.W.-V. and L.A.R.-C.; supervision, R.F.-A. and L.A.R.-C.; project administration, R.F.-A. and L.A.R.-C.; funding acquisition, L.A.R.-C. All authors have read and agreed to the published version of the manuscript.

Funding

The APC was funded by the Dirección de Investigación-Universidad Autónoma de Guadalajara (UAG).

Data Availability Statement

The data that support the findings of this study are available from the corresponding author upon reasonable request.

Acknowledgments

L.A.R.-C. appreciates the financial support received through the “Fondo Semilla” of the Comité de Investigación—Decanato de Diseño, Ciencia y Tecnología (UAG). The authors thank the Isotopy Subcommittee and Inspection Unit of the Tequila Regulatory Council (CRT) for the support received for taking and collecting samples and their constructive comments during the meetings.

Conflicts of Interest

The authors declare no conflicts of interest.

References

  1. Terán-Bustamante, A.; Martínez-Velasco, A.; Castillo-Girón, V.M.; Ayala-Ramírez, S. Innovation and Technological Management Model in the Tequila Sector in Mexico. Sustainability 2022, 14, 7450. [Google Scholar] [CrossRef]
  2. Benn, S.M.; Peppard, T.L. Characterization of Tequila Flavor by Instrumental and Sensory Analysis. J. Agric. Food Chem. 1996, 44, 557–566. [Google Scholar] [CrossRef]
  3. López, M.G. Tequila Aroma. In Flavor Chemistry of Ethnic Foods; Springer: Boston, MA, USA, 1999; pp. 211–217. [Google Scholar]
  4. Vallejo-Cordoba, B.; González-Córdova, A.F.; del Carmen Estrada-Montoya, M. Tequila Volatile Characterization and Ethyl Ester Determination by Solid Phase Microextraction Gas Chromatography/Mass Spectrometry Analysis. J. Agric. Food Chem. 2004, 52, 5567–5571. [Google Scholar] [CrossRef] [PubMed]
  5. Lachenmeier, D.W.; Sohnius, E.-M.; Attig, R.; López, M.G. Quantification of Selected Volatile Constituents and Anions in Mexican Agave Spirits (Tequila, Mezcal, Sotol, Bacanora). J. Agric. Food Chem. 2006, 54, 3911–3915. [Google Scholar] [CrossRef]
  6. Muñoz-Muñoz, A.C.; Grenier, A.C.; Gutiérrez-Pulido, H.; Cervantes-Martínez, J. Development and Validation of a High Performance Liquid Chromatography-Diode Array Detection Method for the Determination of Aging Markers in Tequila. J. Chromatogr. A 2008, 1213, 218–223. [Google Scholar] [CrossRef]
  7. De León Rodríguez, A.; Escalante Minakata, M.D.P.; Jiménez García, M.I.; Ordoñez Acevedo, L.G.; Flores Flores, J.L.; Barba de la Rosa, A.P. Characterization of Volatile Compounds from Ethnic Agave Alcoholic Beverages by Gas Chromatographymass Spectrometry. Food Technol. Biotechnol. 2008, 46, 448–455. [Google Scholar]
  8. Cardeal, Z.L.; Marriott, P.J. Comprehensive Two-Dimensional Gas Chromatography–Mass Spectrometry Analysis and Comparison of Volatile Organic Compounds in Brazilian Cachaça and Selected Spirits. Food Chem. 2009, 112, 747–755. [Google Scholar] [CrossRef]
  9. Ceballos-Magaña, S.G.; de Pablos, F.; Jurado, J.M.; Martín, M.J.; Alcázar, Á.; Muñiz-Valencia, R.; Gonzalo-Lumbreras, R.; Izquierdo-Hornillos, R. Characterisation of Tequila According to Their Major Volatile Composition Using Multilayer Perceptron Neural Networks. Food Chem. 2013, 136, 1309–1315. [Google Scholar] [CrossRef]
  10. Magana, A.A.; Wrobel, K.; Elguera, J.C.T.; Escobosa, A.R.C.; Wrobel, K. Determination of Small Phenolic Compounds in Tequila by Liquid Chromatography with Ion Trap Mass Spectrometry Detection. Food Anal. Methods 2015, 8, 864–872. [Google Scholar] [CrossRef]
  11. Sun, J.; Yin, Z.; Zhao, D.; Sun, B.; Zheng, F. Qualitative and Quantitative Research of Propyl Lactate in Brewed Alcoholic Beverages. Int. J. Food Prop. 2018, 21, 1351–1361. [Google Scholar] [CrossRef]
  12. Mejia Diaz, L.F.; Wrobel, K.; Corrales Escobosa, A.R.; Aguilera Ojeda, D.A.; Wrobel, K. Identification of Potential Indicators of Time-Dependent Tequila Maturation and Their Determination by Selected Ion Monitoring Gas Chromatography–Mass Spectrometry, Using Salting-out Liquid–Liquid Extraction. Eur. Food Res. Technol. 2019, 245, 1421–1430. [Google Scholar] [CrossRef]
  13. Charapitsa, S.; Sytova, S.; Kavalenka, A.; Sobolenko, L.; Kostyuk, N.; Egorov, V.; Leschev, S.; Vetokhin, S.; Zayats, N. The Study of the Matrix Effect on the Method of Direct Determination of Volatile Compounds in a Wide Range of Alcoholic Beverages. Food Control 2021, 120, 107528. [Google Scholar] [CrossRef]
  14. Charapitsa, S.; Sytova, S.; Kavalenka, A.; Sabalenka, L.; Zayats, M.; Egorov, V.; Leschev, S.; Melsitova, I.; Vetokhin, S.; Zayats, N. Intelligent Use of Ethanol for the Direct Quantitative Determination of Methanol in Alcoholic Beverages. J. Food Compos. Anal. 2022, 114, 104772. [Google Scholar] [CrossRef]
  15. Mejia Diaz, L.F.; Wrobel, K.; Corrales Escobosa, A.R.; Yanez Barrientos, E.; Serrano Torres, O.; Wrobel, K. Characterization of Tequila by High Performance Liquid Chromatography—High Resolution Mass Spectrometry (HPLC-HRMS) and Partial Least Squares Regression (PLS). Anal. Lett. 2023, 56, 1701–1712. [Google Scholar] [CrossRef]
  16. Aguilar-Cisneros, B.O.; López, M.G.; Richling, E.; Heckel, F.; Schreier, P. Tequila Authenticity Assessment by Headspace SPME-HRGC-IRMS Analysis of 13C/12C and 18O/16O Ratios of Ethanol. J. Agric. Food Chem. 2002, 50, 7520–7523. [Google Scholar] [CrossRef]
  17. Bauer-Christoph, C.; Christoph, N.; Aguilar-Cisneros, B.O.; Lopez, M.G.; Richling, E.; Rossmann, A.; Schreier, P. Authentication of Tequila by Gas Chromatography and Stable Isotope Ratio Analyses. Eur. Food Res. Technol. 2003, 217, 438–443. [Google Scholar] [CrossRef]
  18. Thomas, F.; Randet, C.; Gilbert, A.; Silvestre, V.; Jamin, E.; Akoka, S.; Remaud, G.; Segebarth, N.; Guillou, C. Improved Characterization of the Botanical Origin of Sugar by Carbon-13 SNIF-NMR Applied to Ethanol. J. Agric. Food Chem. 2010, 58, 11580–11585. [Google Scholar] [CrossRef]
  19. Kächele, M.; Monakhova, Y.B.; Kuballa, T.; Lachenmeier, D.W. NMR Investigation of Acrolein Stability in Hydroalcoholic Solution as a Foundation for the Valid HS-SPME/GC–MS Quantification of the Unsaturated Aldehyde in Beverages. Anal. Chim. Acta 2014, 820, 112–118. [Google Scholar] [CrossRef]
  20. Fonseca-Aguiñaga, R.; Gómez-Ruiz, H.; Miguel-Cruz, F.; Romero-Cano, L.A. Analytical Characterization of Tequila (Silver Class) Using Stable Isotope Analyses of C, O and Atomic Absorption as Additional Criteria to Determine Authenticity of Beverage. Food Control 2020, 112, 107161. [Google Scholar] [CrossRef]
  21. Portaluri, V.; Thomas, F.; Jamin, E.; Akoka, S.; Remaud, G.S. Authentication of Agave Products through Isotopic Intramolecular 13C Content of Ethanol: Optimization and Validation of 13C Quantitative NMR Methodology. ACS Food Sci. Technol. 2021, 1, 1316–1322. [Google Scholar] [CrossRef]
  22. Warren-Vega, W.M.; Fonseca-Aguiñaga, R.; González-Gutiérrez, L.V.; Carrasco-Marín, F.; Zárate-Guzmán, A.I.; Romero-Cano, L.A. Chemical Characterization of Tequila Maturation Process and Their Connection with the Physicochemical Properties of the Cask. J. Food Compos. Anal. 2021, 98, 103804. [Google Scholar] [CrossRef]
  23. Fonseca-Aguiñaga, R.; Warren-Vega, W.M.; Miguel-Cruz, F.; Romero-Cano, L.A. Isotopic Characterization of 100% Agave Tequila (Silver, Aged and Extra-Aged Class) for Its Use as an Additional Parameter in the Determination of the Authenticity of the Beverage Maturation Time. Molecules 2021, 26, 1719. [Google Scholar] [CrossRef] [PubMed]
  24. Acosta-Salazar, E.; Fonseca-Aguinaga, R.; Warren-Vega, W.M.; Ana, I.Z. Effect of Age of Agave Tequilana Weber Blue Variety on Quality and Authenticity Parameters for the Tequila 100% Agave Silver Class: Evaluation at the Industrial Scale Level. Food 2021, 10, 3103. [Google Scholar] [CrossRef] [PubMed]
  25. Fonseca-Aguiñaga, R.; Warren-Vega, W.M.; Muñoz-Sánchez, M.; Romero-Cano, L.A. Isotopic Differences between Tequila and Tequila 100% Agave Silver Class: Effect of Sugar Enrichment on the Δ13CVPDB on the Beverage Congeners. J. Food Compos. Anal. 2024, 129, 106134. [Google Scholar] [CrossRef]
  26. Lachenmeier, D.W.; Richling, E.; López, M.G.; Frank, W.; Schreier, P. Multivariate Analysis of FTIR and Ion Chromatographic Data for the Quality Control of Tequila. J. Agric. Food Chem. 2005, 53, 2151–2157. [Google Scholar] [CrossRef]
  27. Frausto-Reyes, C.; Medina-Gutiérrez, C.; Sato-Berrú, R.; Sahagún, L.R. Qualitative Study of Ethanol Content in Tequilas by Raman Spectroscopy and Principal Component Analysis. Spectrochim. Acta A Mol. Biomol. Spectrosc. 2005, 61, 2657–2662. [Google Scholar] [CrossRef]
  28. Flores, C.R.; Figueroa, J.A.L.; Wrobel, K.; Wrobel, K. ICP-MS Multi-Element Profiles and HPLC Determination of Furanic Compounds in Commercial Tequila. Eur. Food Res. Technol. 2009, 228, 951–958. [Google Scholar] [CrossRef]
  29. Ceballos-Magaña, S.G.; Jurado, J.M.; Martín, M.J.; Pablos, F. Quantitation of Twelve Metals in Tequila and Mezcal Spirits as Authenticity Parameters. J. Agric. Food Chem. 2009, 57, 1372–1376. [Google Scholar] [CrossRef]
  30. Muñoz-Muñoz, A.C.; Pichardo-Molina, J.L.; Ramos-Ortíz, G.; Barbosa-García, O.; Maldonado, J.L.; Meneses-Nava, M.A.; Ornelas-Soto, N.E.; Escobedo, A.; López-de-Alba, P.L. Identification and Quantification of Furanic Compounds in Tequila and Mezcal Using Spectroscopy and Chemometric Methods. J. Braz. Chem. Soc. 2010, 21, 1077–1087. [Google Scholar] [CrossRef]
  31. Contreras, U.; Barbosa-García, O.; Pichardo-Molina, J.L.; Ramos-Ortíz, G.; Maldonado, J.L.; Meneses-Nava, M.A.; Ornelas-Soto, N.E.; López-de-Alba, P.L. Screening Method for Identification of Adulterate and Fake Tequilas by Using UV–VIS Spectroscopy and Chemometrics. Food Res. Int. 2010, 43, 2356–2362. [Google Scholar] [CrossRef]
  32. De la Rosa Vázquez, J.M.; Fabila-Bustos, D.A.; Quintanar-Hernández, L.F.d.J.; Valor, A.; Stolik, S. Detection of Counterfeit Tequila by Fluorescence Spectroscopy. J. Spectrosc. 2015, 2015, 403160. [Google Scholar] [CrossRef]
  33. Pérez-Caballero, G.; Andrade, J.M.; Olmos, P.; Molina, Y.; Jiménez, I.; Durán, J.J.; Fernandez-Lozano, C.; Miguel-Cruz, F. Authentication of Tequilas Using Pattern Recognition and Supervised Classification. TrAC Trends Anal. Chem. 2017, 94, 117–129. [Google Scholar] [CrossRef]
  34. Andrade, J.M.; Ballabio, D.; Gómez-Carracedo, M.P.; Pérez-Caballero, G. Nonlinear Classification of Commercial Mexican Tequilas. J. Chemom. 2017, 31, e2939. [Google Scholar] [CrossRef]
  35. Garcia, M.M.; Wrobel, K.; Barrientos, E.Y.; Escobosa, A.R.C.; Serrano, O.; Donis, I.E.; Wrobel, K. Determination of Copper and Lead in Tequila by Conventional Matrix-assisted Laser Desorption/Ionization Time-of-flight Mass Spectrometry and Partial Least Squares Regression. Rapid Commun. Mass Spectrom. 2018, 32, 2174–2184. [Google Scholar] [CrossRef]
  36. Espinosa-Vega, L.I.; Belio-Manzano, A.; Mercado-Ornelas, C.A.; Cortes-Mestizo, I.E.; Mendez-Garcia, V.H. Aging Spectral Markers of Tequila Observed by Raman Spectroscopy. Eur. Food Res. Technol. 2019, 245, 1031–1036. [Google Scholar] [CrossRef]
  37. Zhang, J.; Ma, Y.; Shao, F.; Lu, Y.; Zhu, L.; Xu, X. Geographical Origin Identification of Tequila Based on Multielement and Stable Isotopes. J. Food Qual. 2021, 2021, 6615264. [Google Scholar] [CrossRef]
  38. Pérez-Beltrán, C.H.; Pérez–Caballero, G.; Andrade, J.M.; Cuadros-Rodríguez, L.; Jiménez-Carvelo, A.M. Non-Targeted Spatially Offset Raman Spectroscopy-Based Vanguard Analytical Method to Authenticate Spirits: White Tequilas as a Case Study. Microchem. J. 2022, 183, 108126. [Google Scholar] [CrossRef]
  39. Ríos-Hernández, P.A.; Gómez-Navarro, C.S.; Warren-Vega, W.M.; Gutiérrez, L.V.G.; Zárate-Guzmán, A.I.; Romero-Cano, L.A. Comprehension of the Adsorption Mechanism in the Selective Color Removal of Extra-Aged Tequila to Produce Cristalino Tequila Using Tailored Carbon Materials. Food Chem. Adv. 2023, 2, 100174. [Google Scholar] [CrossRef]
  40. Carreon-Alvarez, A.; Casillas, N.; Ibanez, J.G.; Hernandez, F.; Prado-Ramírez, R.; Barcena-Soto, M.; Go’mez-Salazar, S. Determination of Cu in Tequila by Anodic Stripping Voltammetry. Anal. Lett. 2008, 41, 469–477. [Google Scholar] [CrossRef]
  41. Luna-Moreno, D.; Monzón-Hernández, D.; Noé-Arias, E.; Regalado, L.E. Determination of Quality and Adulteration of Tequila through the Use of Surface Plasmon Resonance. Appl. Opt. 2012, 51, 5161. [Google Scholar] [CrossRef]
  42. Ruiz-Pérez, A.; Pérez-Castañeda, J.I.; Castañeda-Guzmán, R.; Pérez-Ruiz, S.J. Determination of Tequila Quality by Photoacoustic Analysis. Int. J. Thermophys. 2013, 34, 1695–1702. [Google Scholar] [CrossRef]
  43. Oliveira, P.R.; Lamy-Mendes, A.C.; Rezende, E.I.P.; Mangrich, A.S.; Marcolino, L.H., Jr.; Bergamini, M.F. Electrochemical Determination of Copper Ions in Spirit Drinks Using Carbon Paste Electrode Modified with Biochar. Food Chem. 2015, 171, 426–431. [Google Scholar] [CrossRef] [PubMed]
  44. Carreon-Alvarez, A.; Suárez-Gómez, A.; Zurita, F.; Gómez-Salazar, S.; Soltero, J.F.A.; Barcena-Soto, M.; Casillas, N.; Porfirio-Gutierrez; Moreno-Medrano, E.D. Assessment of Physicochemical Properties of Tequila Brands: Authentication and Quality. J. Chem. 2016, 2016, 6254942. [Google Scholar] [CrossRef]
  45. Kataria, T.K.; Sosa-Morales, M.E.; Olvera-Cervantes, J.L.; Corona-Chavez, A. Dielectric Properties of Tequila in the Microwave Frequency Range (0.5–20 GHz) Using Coaxial Probe. Int. J. Food Prop. 2017, 20, S377–S384. [Google Scholar] [CrossRef]
  46. Acuña-Avila, P.; Calavia, R.; Vigueras-Santiago, E.; Llobet, E. Identification of Tequila with an Array of ZnO Thin Films: A Simple and Cost-Effective Method. Sensors 2017, 17, 2943. [Google Scholar] [CrossRef]
  47. Jiménez-Pérez, R.; Sevilla, J.M.; Pineda, T.; Blázquez, M.; Gonzalez-Rodriguez, J. Electrocatalytic Performance Enhanced of the Electrooxidation of Gamma-Hydroxybutyric Acid (GHB) and Ethanol on Platinum Nanoparticles Surface. A Contribution to the Analytical Determination of GHB in the Presence of Ethanol. Sens. Actuators B Chem. 2018, 256, 553–563. [Google Scholar] [CrossRef]
  48. Necochea-Chamorro, J.I.; Carrillo-Torres, R.C.; Sánchez-Zeferino, R.; Álvarez-Ramos, M.E. Fiber Optic Sensor Using ZnO for Detection of Adulterated Tequila with Methanol. Opt. Fiber Technol. 2019, 52, 101982. [Google Scholar] [CrossRef]
  49. Maldonado-Arriola, J.A.; Sánchez-Zeferino, R.; Álvarez-Ramos, M.E. Photoluminescent Properties of ZnO Nanorods Films Used to Detect Methanol Contamination in Tequila. Sens. Actuators A Phys. 2020, 312, 112142. [Google Scholar] [CrossRef]
  50. Franco, M.D.O.K.; Castro, G.A.D.; Vilanculo, C.; Fernandes, S.A.; Suarez, W.T. A Color Reaction for the Determination of Cu2+ in Distilled Beverages Employing Digital Imaging. Anal. Chim. Acta 2021, 1177, 338844. [Google Scholar] [CrossRef]
  51. Gómez, A.; Bueno, D.; Gutiérrez, J.M. Electronic Eye Based on RGB Analysis for the Identification of Tequilas. Biosensors 2021, 11, 68. [Google Scholar] [CrossRef]
  52. Warren-Vega, W.M.; Fonseca-Aguiñaga, R.; González-Gutiérrez, L.V.; Romero-Cano, L.A. Use of Electrochemical Color Index as Emerging Analytical Method for Evaluating the Quality of Tequila 100% Agave. Food Biosci. 2023, 56, 103300. [Google Scholar] [CrossRef]
  53. Montes-Peña, K.D.; Fonseca-Aguiñaga, R.; Warren-Vega, W.M.; Romero-Cano, L.A. Decoding of the Isotopic Fingerprint of Tequila 100% Agave Silver Class and Image Analysis to Evaluate Differences between Spirits. Food Chem. 2024, 460, 140735. [Google Scholar] [CrossRef] [PubMed]
  54. Gómez, A.; Bueno, D.; Gutiérrez, J.M. Electronic Eye for Identification of Tequila Samples. In Proceedings of the 1st International Electronic Conference on Biosensors, Basel, Switzerland, 2 November 2020; p. 44. [Google Scholar]
  55. Heil, J.; Marschner, B.; Stumpe, B. Digital Photography as a Tool for Microscale Mapping of Soil Organic Carbon and Iron Oxides. Catena 2020, 193, 104610. [Google Scholar] [CrossRef]
  56. Granados-Vega, B.V.; Maldonado-Flores, C.; Gómez-Navarro, C.S.; Warren-Vega, W.M.; Campos-Rodríguez, A.; Romero-Cano, L.A. Development of a Low-Cost Artificial Vision System as an Alternative for the Automatic Classification of Persian Lemon: Prototype Test Simulation. Foods 2023, 12, 3829. [Google Scholar] [CrossRef]
  57. Bortoletto, A.M.; Alcarde, A.R. Congeners in Sugar Cane Spirits Aged in Casks of Different Woods. Food Chem. 2013, 139, 695–701. [Google Scholar] [CrossRef]
  58. López-Ramírez, J.E.; Martín-del-Campo, S.T.; Escalona-Buendía, H.; García-Fajardo, J.A.; Estarrón-Espinosa, M. Physicochemical Quality of Tequila during Barrel Maturation. A Preliminary Study. CyTA J. Food 2013, 11, 223–233. [Google Scholar] [CrossRef]
  59. Ortega-Heras, M.; González-Sanjosé, M.L.; González-Huerta, C. Consideration of the Influence of Aging Process, Type of Wine and Oenological Classic Parameters on the Levels of Wood Volatile Compounds Present in Red Wines. Food Chem. 2007, 103, 1434–1448. [Google Scholar] [CrossRef]
  60. Warren-Vega, W.M.; Contreras-Atrisco, Z.A.; Ramírez-Quezada, M.F.; Romero-Cano, L.A. A Novel Approach of Artificial Intelligence for the Study of the Relation of Physicochemical Profile and Color Acquired by Tequila 100% Agave in Its Maturation Process. J. Food Compos. Anal. 2023, 123, 105533. [Google Scholar] [CrossRef]
  61. Glories, Y. La Couleur Des Vins Rouges. 2a. Partie Mesure, Origine et Interpretarion. J. Int. Sci. Vigne Vin. 1984, 18, 253–271. [Google Scholar] [CrossRef]
  62. Zamora, F. Elaboración y Crianza Del Vino Tinto: Aspectos Científicos y Prácticos, 1st ed.; Mundiprensa: Madrid, Spain, 2003. [Google Scholar]
  63. Andrés-Lacueva, C.; Lamuela-Raventós, R.M.; Buxaderas, S.; De La Torre-Boronat, M.D.C. Influence of Variety and Aging on Foaming Properties of Cava (Sparkling Wine). 2. J. Agric. Food Chem. 1997, 45, 2520–2525. [Google Scholar] [CrossRef]
  64. Nieto-Delgado, C.; Terrones, M.; Rangel-Mendez, J.R. Development of Highly Microporous Activated Carbon from the Alcoholic Beverage Industry Organic By-Products. Biomass Bioenergy 2011, 35, 103–112. [Google Scholar] [CrossRef]
  65. Aguilar-Méndez, O.; López-Álvarez, J.A.; Díaz-Pérez, A.L.; Altamirano, J.; Reyes De la Cruz, H.; Rutiaga-Quiñones, J.G.; Campos-García, J. Volatile Compound Profile Conferred to Tequila Beverage by Maturation in Recycled and Regenerated White Oak Barrels from Quercus Alba. Eur. Food Res. Technol. 2017, 243, 2073–2082. [Google Scholar] [CrossRef]
  66. Ramsay, C.M.; Berry, D.R. Effect of Temperature and PH on the Formation of Higher Alcohols, Fatty Acids and Esters in the Malt Whisky Fermentation. Food Microbiol. 1984, 1, 117–121. [Google Scholar] [CrossRef]
  67. Huang, X.; Cadwallader, K.R. Chapter: A Critical Review of the Flavor Chemistry of Tequila. In Chemistry of Alcoholic Beverages; American Chemical Society: Washington, DC, USA, 2023; pp. 1–36. [Google Scholar]
Figure 1. Comparison of the isotopic (a,b), chromatographic (cg), and spectroscopic (h) characterization of Tequila 100% agave aged and extra-aged class against their respective Tequila 100% agave Cristalino. Notes: mg QE/L: mg Quercetin Equivalents/L.
Beverages 11 00042 g001
Figure 2. Comparison of color perception in Tequila 100% Agave Aged Class (−TA) and their respective Tequila 100% agave Aged Cristalino (−TA-C) through digital analysis (RGB and HSV color models) and UV-Vis spectroscopy. Note: Histograms for color analysis have been determined from the area delimited by a dashed line within the digital image. Figures (a), (b) and (c) correspond to samples from companies 1, 2 and 3 respectively.
Beverages 11 00042 g002
Figure 3. Comparison of color perception in Tequila 100% Agave Extra-Aged Class (−TEA) and the respective Tequila 100% Agave Extra-Aged Cristalino (−TEA-C) through digital analysis (RGB and HSV color models) and UV-Visible spectroscopy. Note: Histograms for color analysis have been determined from the area delimited by a dashed line within the digital image. Figures (a), (b) and (c) correspond to samples from companies 1, 2 and 3 respectively.
Beverages 11 00042 g003
Figure 4. Integrated comparison of chromatographic, spectroscopic, and isotopic characteristics of Tequila 100% Agave (a) Aged and (c) Extra-Aged and their corresponding (b) Aged-Cristalino and (d) Extra-Aged-Cristalino. Data presented in the Figure represent the average values for each analyzed group: ■ Aged, □ Aged-Cristalino, ● Extra-aged, and ○ Extra-aged-Cristalino.
Beverages 11 00042 g004
Table 1. Timeline of use of gas and liquid chromatography techniques for quality of tequila and Tequila 100% agave in its different classes.
YearAnalytical TechniqueMatrixReference
1996GC-SCD, GC-FID, GC-MST100% silver class (SC)[2]
1999GC-MST100% (SC, AC, EC)[3]
2004SPME, GC-MST100% (SC, AC, EC)[4]
2006GC, ICT, T100% (SC)[5]
2008HPLC-DADT, T100%, (SC, AC, EC)[6]
2008HS-SPME-GC-MST (SC)[7]
2009GCxGC/TOFMST (SC)[8]
2013HS-SPME-GC-MS, HPLC-DADT100% (SC, AC, EC)[9]
2015HPLC-ESI-ITMST100% (SC, AC, EC) [10]
2018SPME, LLE, GC-MST (SC)[11]
2019GC-MS-SIMT (SC, AC, EC, UC)[12]
2021GC-FIDT[13]
2022GC-FIDT[14]
2022HPLC-HRMST (SC, AC, EC, UC)[15]
Abbreviations: Gas chromatography coupled with a sulfur chemiluminescent detector (GC-SCD), flame ionization detector (GC-FID), mass spectrometry (GC–MS), bidimensional gas chromatography coupled in mass spectrometry with a time-of-flight detector (GCxGC/TOFMS), gas chromatography and headspace solid phase microextraction–gas chromatography mass spectrometry (HS-SPME-GC–MS), gas chromatography coupled in mass spectrometry with selective ion monitoring (GC-MS-SIM), high-performance liquid chromatography coupled with a diode array detector (HPLC-DAD), electrospray ionization–ion trap mass spectrometry (HPLC-ESI-ITMS), headspace solid-phase microextraction gas chromatography mass spectrometry (HS-SPME-GC-MS), liquid–liquid extraction (LLE), high-performance liquid chromatography coupled with high-resolution mass spectrometry (HPLC-HRMS).
Table 2. Timeline of use of gas chromatography coupled with nuclear magnetic resonance and isotopic ratio mass spectrometry techniques for the quality of tequila and tequila 100% agave in its different classes.
YearAnalytical TechniqueMatrixReference
2002SPME-HRGC-IRMST, T100% (SC)[16]
2003GC-IRMST, T100% (SC)[17]
2010SNIF-NMRT100% (SC)[18]
2014HS-SPME/GC-MST, T100% (SC)[19]
2020GC-IRMST, T100% (SC)[20]
2021SNIF-NMRT (SC)[21]
2021GC-IRMST100% (SC, AC, EC)[22]
2021GC-IRMST100% (SC, AC, EC)[23]
2021GC-IRMST100% (SC)[24]
2024GC-IRMST, T100% (SC)[25]
Abbreviations: Headspace solid-phase microextraction (SPME), high-resolution gas chromatography (HRGC), isotope ratio mass spectrometry (IRMS), gas chromatography (GC), site-specific natural isotope fractionation by nuclear magnetic resonance (SNIF-NMR), headspace solid-phase microextraction coupled with gas chromatography–mass spectrometry (HS-P-SPME/GC-MS).
Table 3. Timeline of use of spectroscopic techniques for quality of tequila and Tequila 100% agave in its different classes.
YearAnalytical TechniqueMatrixReference
2005FTIRT100%, T (SC)[26]
2005RamanT (SC, AC)[27]
2009ICP-MST, T100% (SC, AC, EC)[28]
2009ICP-OEST100% (SC, AC, EC)[29]
2010UV-VisT, T100% (SC)[30]
2010UV-VisT, T100% (SC, AC)[31]
2015XRFT, T100% (SC, AC, EC)[32]
2017UV-VisT (SC, AC, EC, UC)[33]
2017UV-VisT (SC, AC, EC, UC)[34]
2018MALDI-TOFMS & ICP-MST (SC, AC, EC, UC)[35]
2019RamanT100% (SC, AC, EC)[36]
2021ICP-MS & IRMST (SC)[37]
2022SORST, T100% (SC)[38]
2023UV-VisT100% (EC, SC)[39]
Abbreviations: Fourier transform infrared spectroscopy (FTIR), inductively coupled plasma mass spectrometry (ICP-MS), inductively coupled plasma optical emission spectroscopy (ICP-OES), X-ray fluorescence (XRF), ultraviolet–visible spectroscopy (UV-Vis), matrix-assisted laser desorption ionization time-of-flight mass spectrometry (MALDI-TOFMS), spatially offset Raman spectroscopy (SORS).
Table 4. Timeline of use of electronics techniques for quality of tequila and tequila 100% agave t in its different classes.
YearAnalytical TechniqueMatrixReference
2008Anodic stripping voltammetryT (100%)[40]
2012Surface plasmon resonanceT (SC, AC, EC)[41]
2013Pulsed laser photoacousticT, T100% (SC, AC)[42]
2015Differential pulse adsorptive stripping voltammetryT (SC)[43]
2016Physicochemical propertiesT (SC, AC, EC)[44]
2017Open-ended coaxial probeT100% (SC)[45]
2017ZnO thin films sensorT (AC)[46]
2018Cyclic voltammetryT (SC)[47]
2019Fiber optic sensorT (SC)[48]
2020ZnO Nanorods filmsT (AC)[49]
2021Digital image analysisT (SC)[50]
2021Electronic eyeT100% (SC, AC, EC)[51]
2023Differential pulse voltammetryT100% (SC, AC, EC, UC)[52]
2024Image analysisT100% (SC)[53]
Disclaimer/Publisher’s Note: The statements, opinions and data contained in all publications are solely those of the individual author(s) and contributor(s) and not of MDPI and/or the editor(s). MDPI and/or the editor(s) disclaim responsibility for any injury to people or property resulting from any ideas, methods, instructions or products referred to in the content.

