1. Introduction
Electrochemical methods to characterize the phenolic content of wines have been applied widely over the past 15 years, mainly based upon cyclic voltammetric analyses at carbon-based electrodes [
1,
2,
3,
4,
5,
6,
7]. Many polyphenols contain
ortho-diphenol (catechol) or triphenol (galloyl) groups, which are important in beverage oxidation processes, given that they are they are recognized as the main initial substrate of wine oxidation [
7], and they are oxidized at a relatively low electrode potential. Dilution of wines is generally required to improve peak resolution and to obtain a linear relationship between dilution factor and peak current. The removal of free sulfites, through addition of acetaldehyde, has been used to obtain a more reliable measure of the phenolic compounds present [
7]. Under these conditions, the anodic current response can be related to levels of monomeric phenolics determined by HPLC, at least with white wines, where the phenolic composition is dominated by hydroxycinnamic acids and small flavonoids [
1,
7]. The advantages of the use of differential pulse voltammetry have also been reported, including improved peak resolution and a good correlation with spectrophotometric measures of red wine phenolics [
8,
9,
10].
A further approach that has applied to the voltammetric analysis of wines has been to use a modified electrode. Poly-3,4-ethylenedioxythiophene (PEDOT) has been of particular interest [
11,
12,
13], with improved sensitivity and antifouling properties. Separate current signals due to ascorbic acid and wine polyphenols have been obtained, which can merge at glassy carbon electrodes due to inhibitory effects of adsorbed polyphenols on ascorbic acid oxidation [
14,
15]. In further work with PEDOT electrodes, an improved response for tea catechins was obtained compared to glassy carbon electrodes [
16], and the most responsive PEDOT films were those prepared originally in a propylene carbonate electrolyte [
17].
At the same time, adsorption effects can be of increasing importance when high surface area modified electrodes are employed. In this report, the application of PEDOT electrodes to the characterization of polyphenols in white wines is presented, including the influence of holding-time in the sample solution prior to taking the voltammetric scan. High surface area PEDOT microelectrodes are also examined, with unique features being obtained.
2. Materials and Methods
2.1. Materials
Caffeic acid, (+)-catechin hydrate, 3,4-ethylenedioxythiophene (EDOT), propylene carbonate, and lithium perchlorate were purchased from Sigma-Aldrich. A 2008 Chardonnay white wine was selected for testing, a wine made within the University of Auckland Wine Science program under the Ingenio label, using grapes sourced from Waiheke Island in the Auckland region. The wine had been bottled under screwcap closure and was opened immediately prior to analysis in mid-2014.
2.2. Preparation of PEDOT Sensor
Electropolymerization of the PEDOT electrodes was undertaken on a 3 mm diameter glassy carbon electrode (BAS MF-2012; 0.0707 cm
2) in a solution of 0.1 M 3,4-ethylenedioxythiophene in propylene carbonate with 0.1 M LiClO
4, after the removal of oxygen by purging with nitrogen [
13,
16]. The glassy carbon electrodes were first polished using 0.05 µm alumina powder (BAS CF-1050) on a cloth pad. Four preparative potential sweeps were run between −300 and 1200 mV (Ag/AgCl, BAS MF-2052, +207 mV versus SHE) at 100 mV s
−1 with a platinum wire as counter electrode in a Bioanalytical Systems Electrochemical Analyzer (BAS100A). The PEDOT electrodes were then cycled 10 times at 100 mV s
−1 from −200 and 800 mV (Ag/AgCl), in a model wine solution, consisting of 0.033 M
l-tartaric acid in a 12% (
v/
v) ethanol-water mixture with the pH adjusted to 3.6 ± 0.2 with 1 M NaOH.
A further PEDOT preparation was undertaken on a 10 µm gold microelectrode (BAS MF-2006; 7.85 × 10
−7 cm
2). Between two and eight preparative sweeps were undertaken to 1200 mV (Ag/AgCl), with a sharp rise in current beyond 1100 mV on the first scan, and from 900 to 1000 mV on subsequent scans. SEM images of the PEDOT microelectrodes were taken after zero, two, and eight preparative cycles, using a Philips XL30S FEG Scanning Electron Microscope, equipped with a SiLi EDS detector [
17].
2.3. Cyclic Voltammetry Measurements
The PEDOT electrodes were then transferred to the solution containing diluted wine or phenolic standard, which had been previously deaerated by purging with nitrogen, and the first voltammetric scan was recorded either immediately, or after a certain holding period. Cyclic voltammetry was performed between −200 mV and a final potential as high as 1200 mV, at a scan rate of 100 mV s−1. Where repeat runs were undertaken (n = 3) and values such as the peak currents obtained, the averages with standard deviations are presented. A voltammogram was also taken in the model wine solution on its own for background subtraction purposes. For comparison purposes, additional scans for the diluted white wine were undertaken with a clean glassy carbon electrode in the absence of a PEDOT film. In each case, both the raw current values and the current density with respect to the geometric surface area of the underlying inert electrode are presented.
Solutions of the pure phenolic compounds, caffeic acid and catechin were also prepared in the model wine solution at a range of concentrations from 0.01 to 0.2 mM, and tested at the PEDOT electrodes. For each concentration value, a freshly prepared PEDOT film was used.
3. Results and Discussion
3.1. Cyclic Voltammetry of White Wines
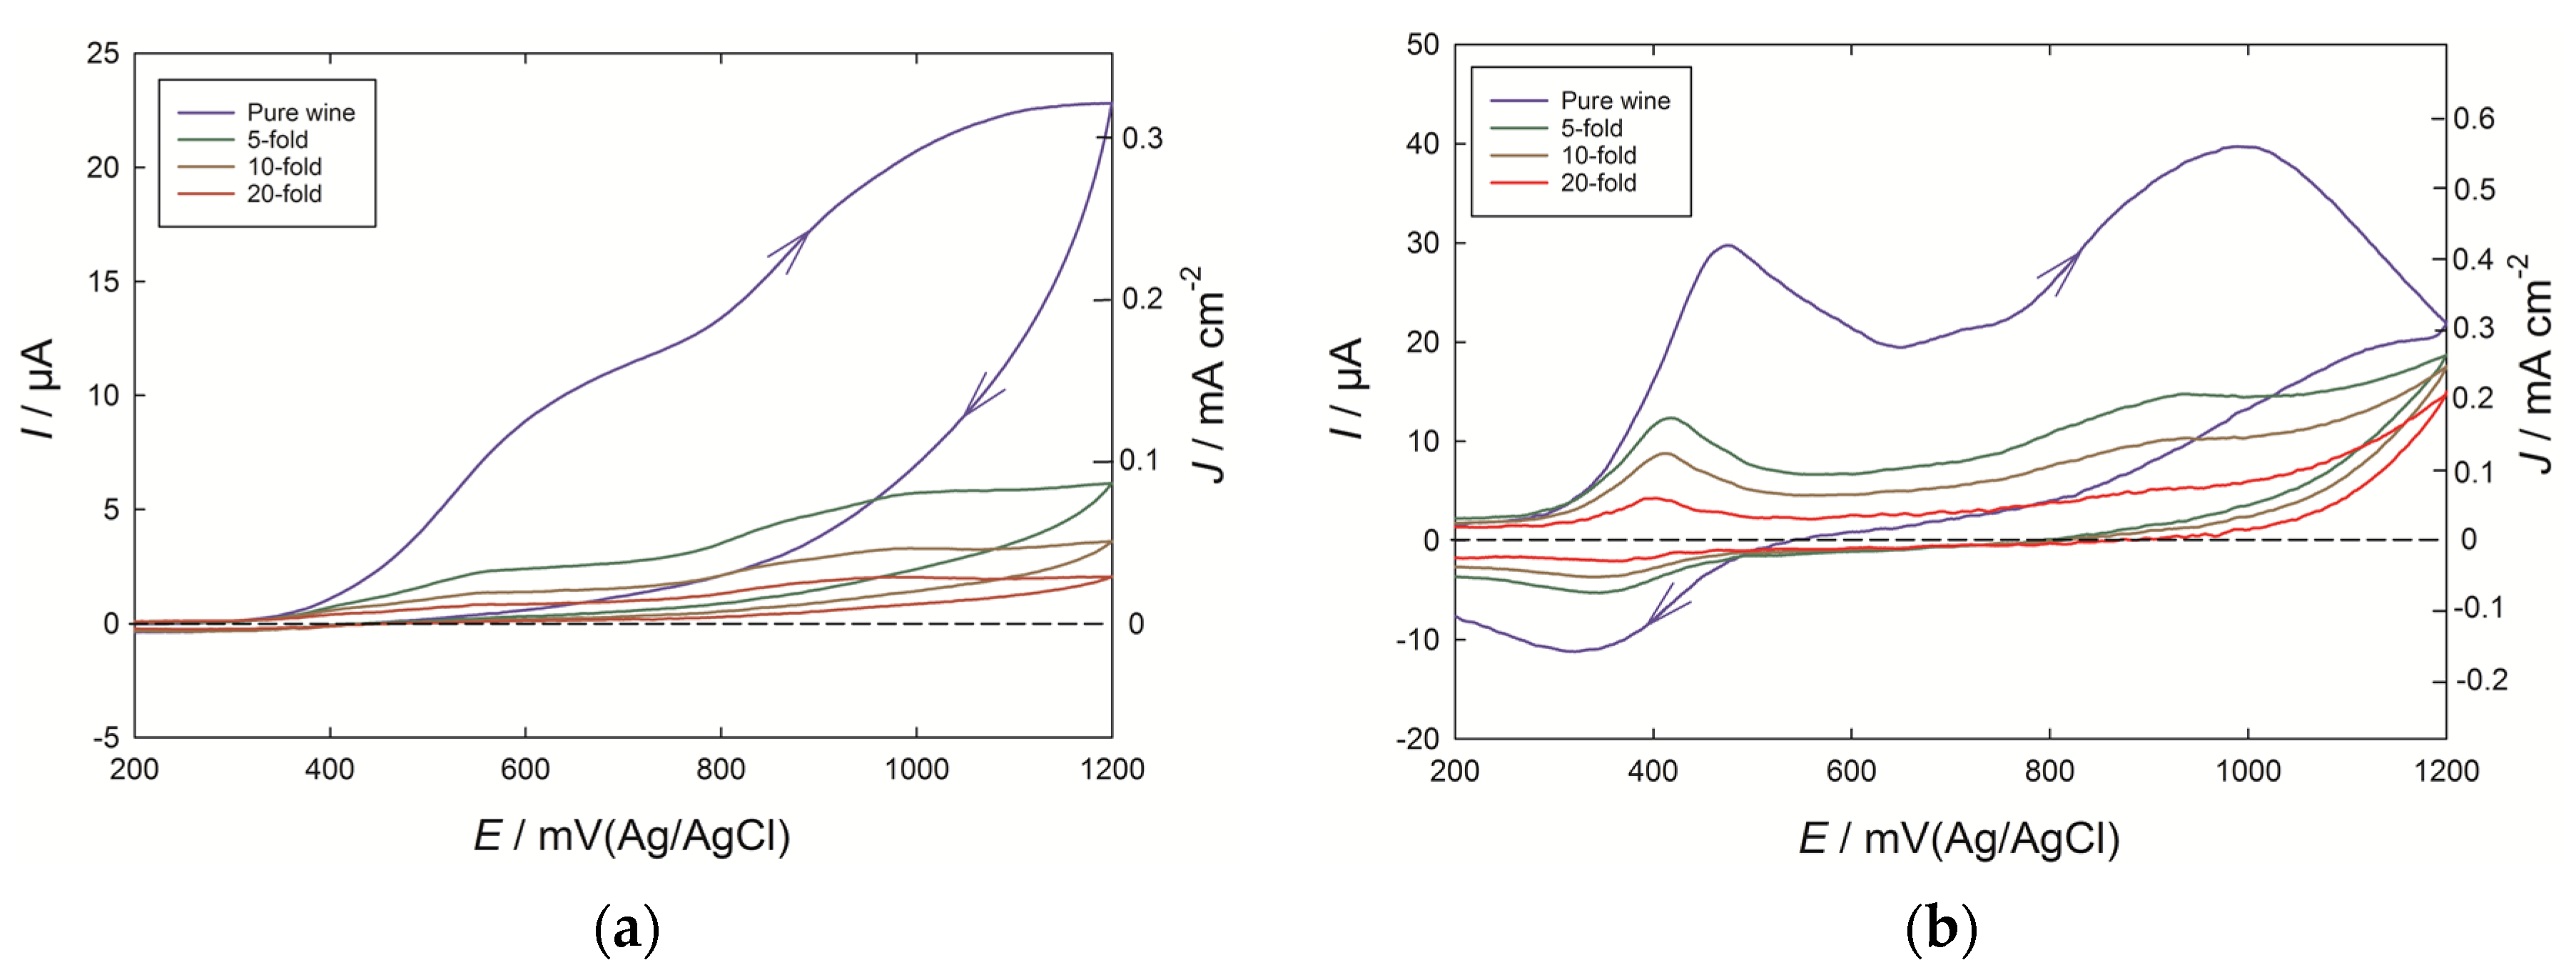
Voltammograms were recorded both at PEDOT and glassy carbon electrodes for the Chardonnay wine, and for successive dilutions in the model wine solution (
Figure 1). The scans were taken to 1200 mV (Ag/AgCl) to cover the full range of oxidizable phenolics expected to be present in the wine, and in both cases the background response due to the PEDOT or glassy carbon electrode in the model wine solution has been subtracted away. The rising current for potentials greater than 350 mV is mainly due to the presence of catechol-containing phenolics such as caffeic acid derivatives and catechin, with a further contribution from free SO
2 also possible [
7]. However, with an undiluted wine at a glassy carbon electrode, the current lacks definition into well-resolved peaks, and after a scan to 1200 mV, the presence of oxidized phenolic products on the electrode also limits the appearance of a quinone reduction peak expected on the reverse scan [
1]. By contrast, at the PEDOT electrode, a clear peak was observed at 460 mV in the pure wine, and at close to 410 mV for the 10-fold diluted wine, while after cycling to 1200 mV, a reduction peak at 320 to 350 mV was also seen. A further large current peak at 900–1000 mV can be associated with more isolated phenolic groups, such as coutaric acid, while a smaller peak or shoulder feature can be noted at around 700 mV. Furthermore, the intensity of the current was around five times greater at the PEDOT electrode compared to the bare glassy carbon electrode.
3.2. Cyclic Voltammetry of Phenolic Standards
Further voltammograms at PEDOT electrodes were run on the representative catechol-containing hydroxycinnamic acid, caffeic acid (
Figure 2a), and the flavonoid, catechin (
Figure 2b). The standards were tested from 0.01 to 0.20 mM, and a well-defined set of redox peaks were obtained in each case in the 300 to 500 mV potential range, due to the oxidation of the catechol group to a quinone-form, and its reduction on the reverse scan. The mid-point potentials were, on average, 422 ± 2 mV for caffeic acid and 386 ± 1 mV for catechin, close to those reported previously for these phenolic compounds in a pH 3.6 model wine solution [
1]. In each case, the peak separation decreased as the concentration of the phenolics was lowered from 0.20 mM to 0.01 mM, moving from 120 to 52 mV for the caffeic acid voltammograms, and from 88 to 37 mV for catechin, while the mid-point potentials were quite steady. The height of the current peak for 0.050 mM caffeic acid or catechin, at 10.2 and 9.2 µA, respectively, was comparable to the value of 8.8 µA recorded for the 10-fold diluted Chardonnay wine, which by this measure would contain just over 0.5 mM of such phenolics in the undiluted wine (c. 100 mg/L caffeic acid equivalents). This value is typical of those obtained previously for voltammetric quantification of the phenolics in white wines that can be oxidized at a potential less than 500 mV [
18].
At the same time, the oxidation of caffeic acid was largely completed by 600 mV, at which point the current returned to the background response due to the PEDOT conducting polymer itself (
Figure 2a), and without the ongoing current expected for a process under diffusion-control typical of caffeic acid at a glassy carbon electrode [
14]. Instead, the oxidation and subsequent reduction peaks point to the electrochemistry of an absorbed species. At the same time, the peak separation between anodic and cathodic peaks was non-zero, as would be expected for a fully-Nernstian response, pointing to some kinetic limitations and partial irreversibility in the electrochemistry. In the case of catechin, the additional current from 600 mV, peaking at around 720 mV, is expected due to the oxidation of the extra meta-diphenol groups on the flavonoid A-ring. The anodic current seen in the 600 to 800 mV range at the PEDOT electrode in the Chardonnay wine (
Figure 1b) could also derive from this source. For catechin concentrations less than 0.10 mM, the current by 900 mV was in fact lower than the background current due to PEDOT run in the absence of catechin (
Figure 2b), giving rise to negative currents at potentials between 800 and 900 mV, where the effects of adsorbed catechin oxidation products may be affecting PEDOT electrochemistry.
3.3. Adsorption Effects at PEDOT Electrodes
To investigate the aspects of phenolic adsorption on PEDOT and glassy carbon electrodes, the dependence of the first anodic peak current upon scan rate was examined for the situation in which the voltammetry was run immediately after inserting the electrode into the test solution. For 0.02 mM caffeic acid at the glassy carbon electrode, a log/log plot indicated that the behavior was close to that expected for a process under diffusion control, with a slope of 0.593 close the value of 0.5, obtained when the peak current is proportional to the square root of the sweep rate (
Figure 3). In the case of the PEDOT electrode, a slope of 0.829 for 0.02 mM caffeic acid and 0.857 for the 10-fold diluted Chardonnay wine was closer to the value of 1.0 expected for a surface confined process with peak current directly proportional to scan rate. Such behavior is typical of an absorbed layer of redox active species, while some smaller diffusional component may serve to bring the value down from 1.0.
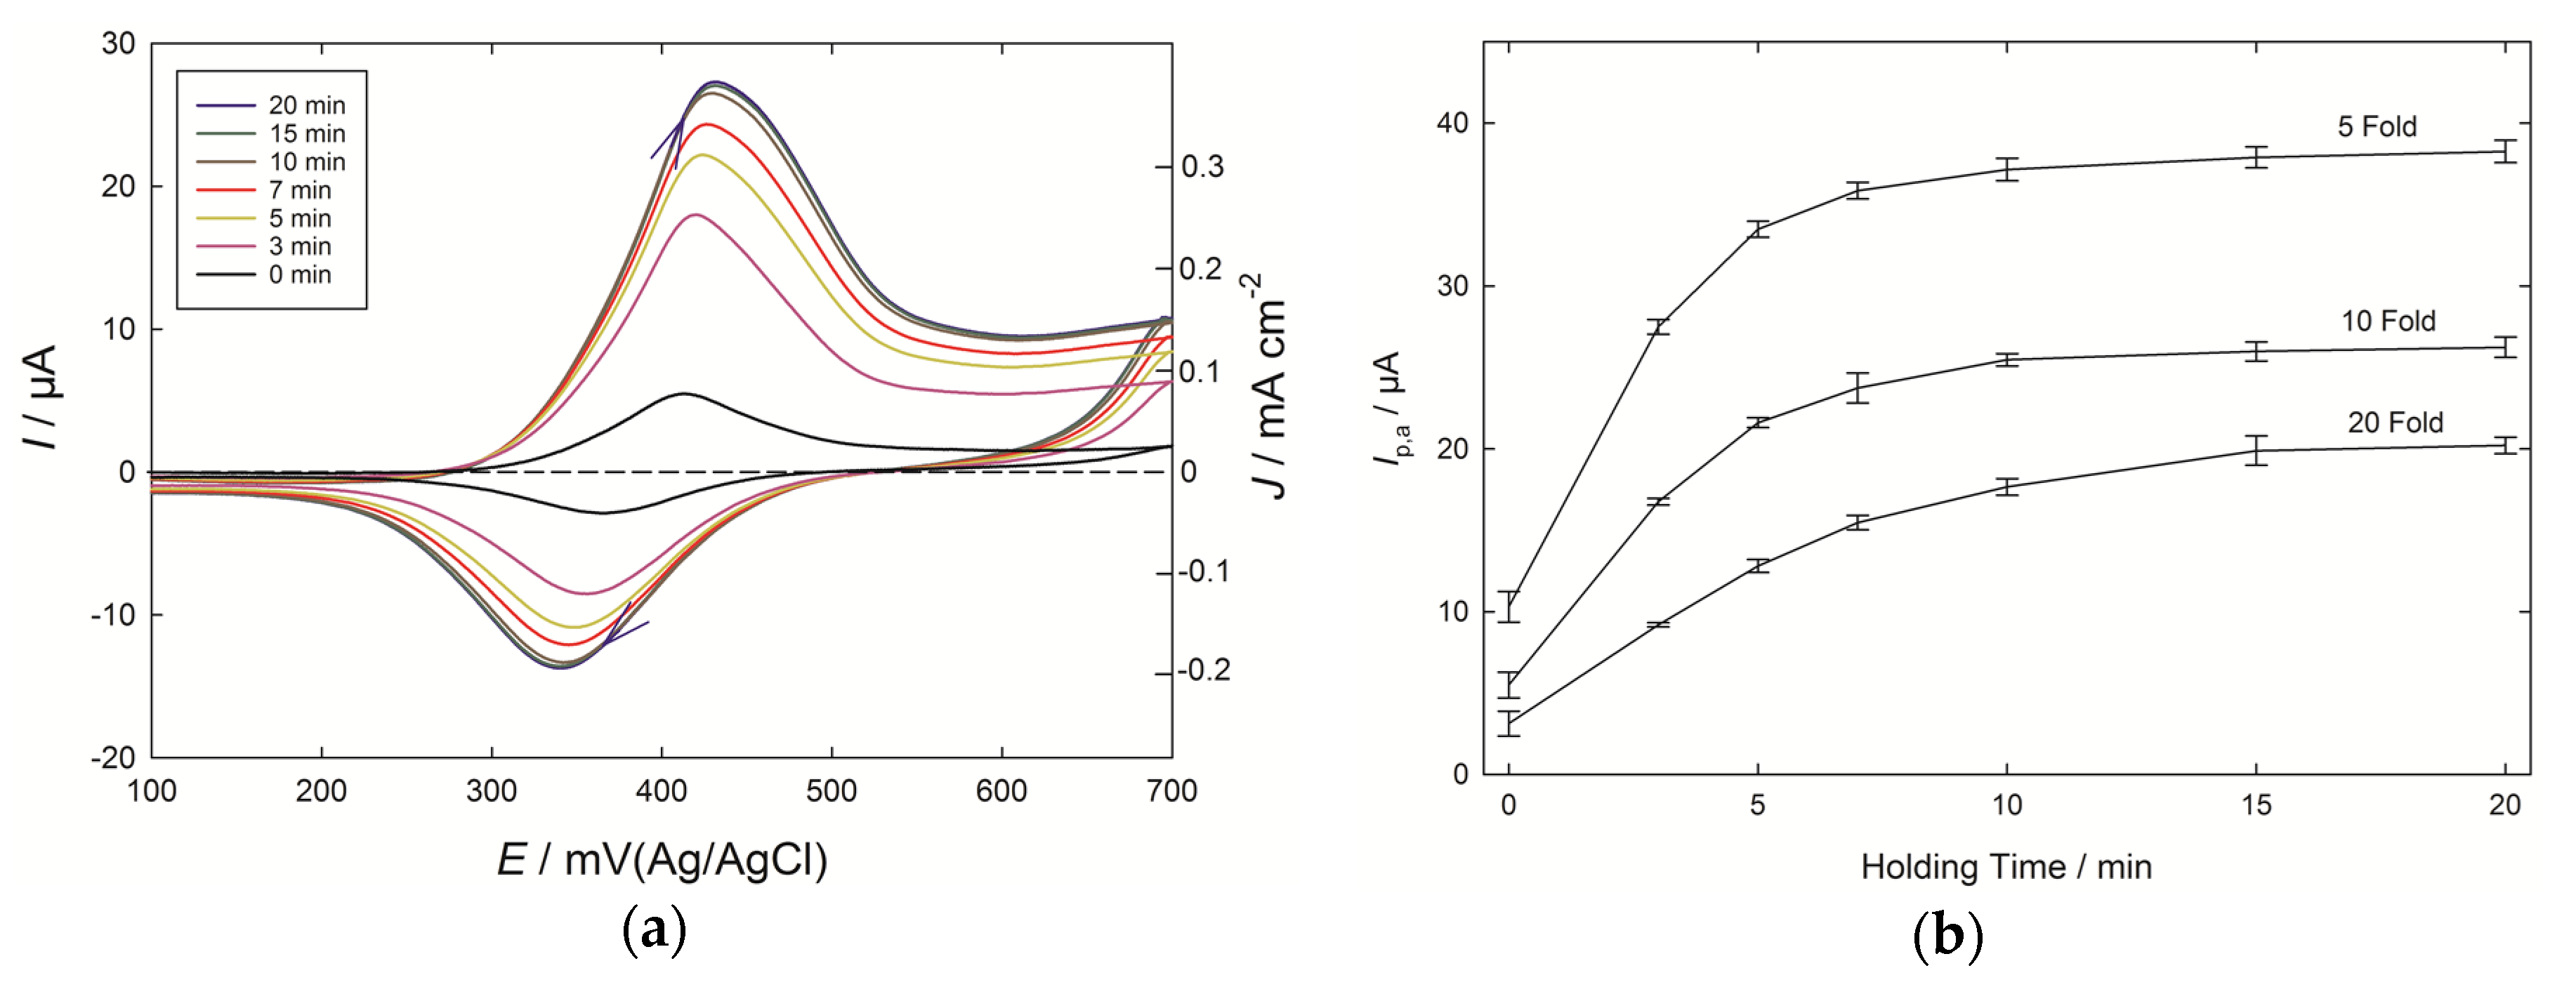
The role of adsorption at PEDOT electrodes was further tested by introducing a holding time from 3 to 20 min for the electrode immersed in the 10-fold diluted Chardonnay wine (
Figure 4a). A considerable increase in current was seen as the holding time progressed, with a value close to the maximum being reached after 10 min of holding. The current dependence upon holding time for three wine-dilution levels is shown in
Figure 4b, and the effects of caffeic acid pre-concentration can be seen in each case, which resemble the isotherms observed with the adsorption of species at surfaces. There are benefits to enhancing the signal by introducing a holding time, but in the present case this came at the expense of a loss of the linear relationship between wine dilution, and hence concentration of phenolic compounds, and peak current. For a scan run immediately after inserting the PEDOT electrodes into the diluted wines, the peak current nearly doubled, moving from 20-fold to 10-fold diluted wines (×1.8), and increased by a similar amount with the 5-fold diluted wines (×1.9). By contrast, with a 20 min holding time, the response to the 20-fold diluted wine was over 50% of that of the 5-fold diluted wine.
The analysis of phenolics on PEDOT electrodes after an accumulation time has also been described for the case of epicatechin, as found in products such as biscuits containing cocoa [
19]. After a period of accumulation, the oxidation of the phenol then occurs as an example of adsorptive stripping voltammetry, with complete oxidation of the adsorbed phenolic compound, and with a current much higher than that obtained at glassy carbon electrodes. In that study, the current peak for epicatechin reached a maximum after 25 min of accumulation time, and showed a linear response for epicatechin concentrations up to 1.5 ppm (2.0 µA for c. 0.005 mM) using differential pulse voltammetry, with linearity lost beyond 2.5 ppm [
19]. A similar accumulation period was found to provide maximum oxidation current in the present study for white wine phenols.
3.4. Cyclic Voltammetry of Caffeic Acid at PEDOT Microelectrodes
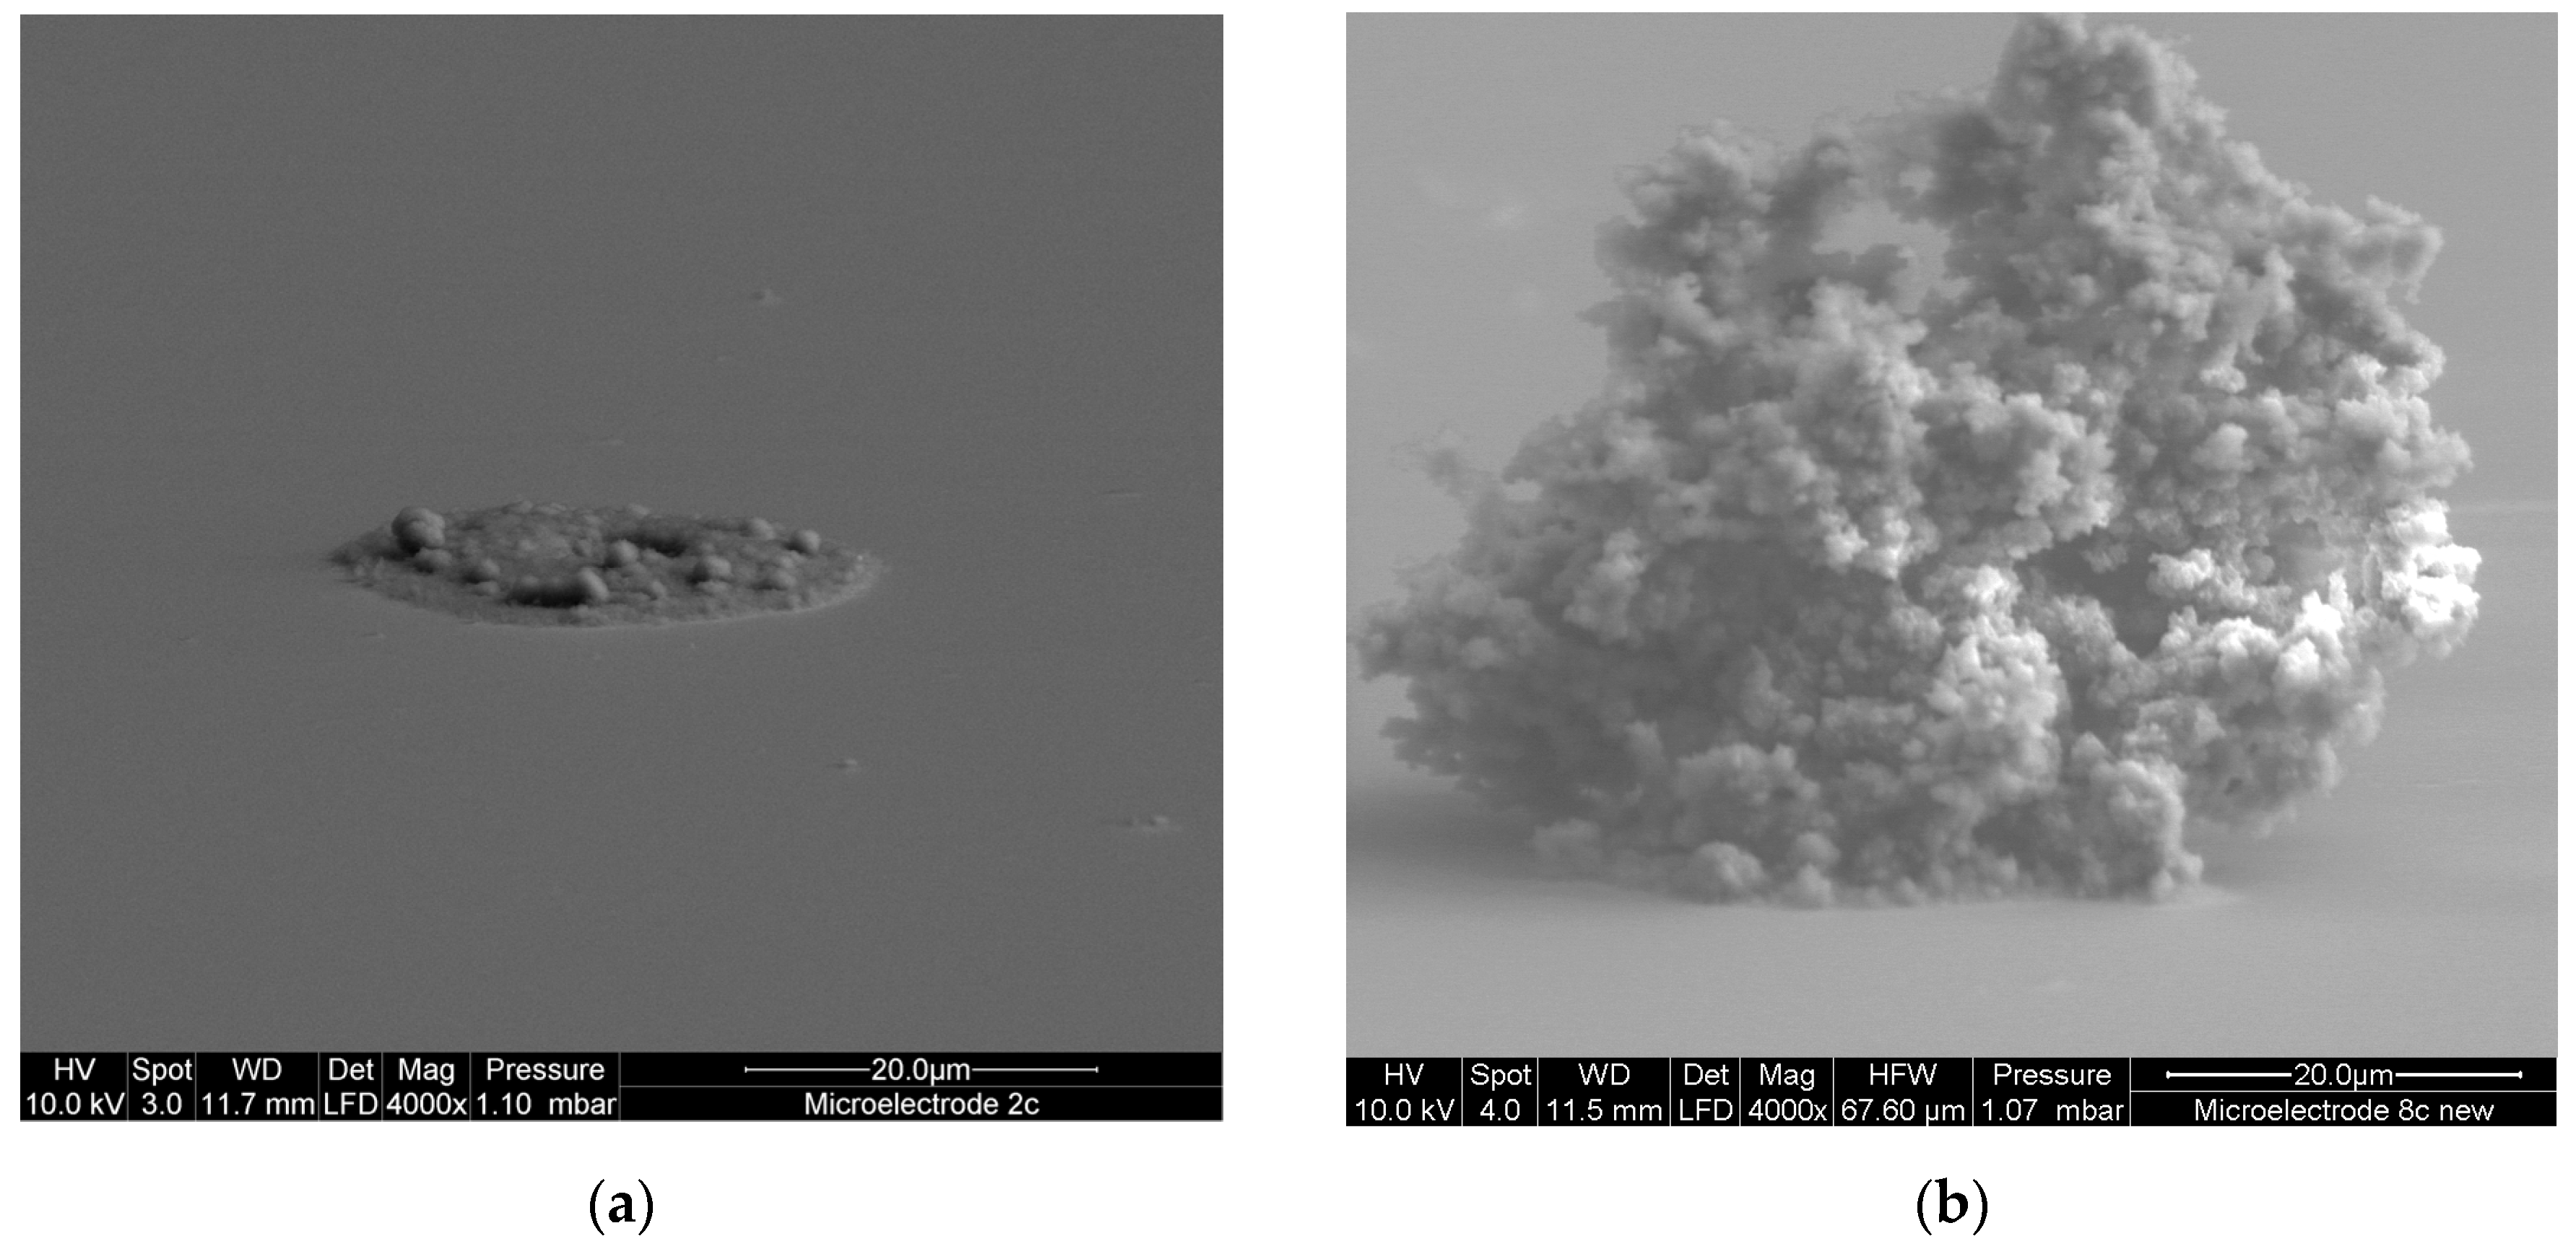
PEDOT electrodes were also prepared on a 10 µm diameter gold microelectrode, and used to test solutions of caffeic acid. After two preparative cycles to 1200 mV (Ag/AgCl) for 0.1 M EDOT in propylene carbonate, some PEDOT growth nodules were evident in SEM images (
Figure 5a). The PEDOT conducting polymer had also spread to a width of around 25 µm, somewhat larger than the underlying gold microelectrode, which had been previously found to be very close to the expected 10 µm in SEM images of the bare microelectrode. During the electropolymerization, the current for EDOT oxidation rose sharply for potentials greater than 1100 mV on the first preparative scan, but by the third cycle the rise in current started from 900 mV, pointing to an electrocatalytic effect of the newly formed PEDOT surface. The extremely high rate of growth was most evident in the following cycles, and for continued cycling even to 16 prepared scans, a steady increase in current due to internal PEDOT redox processes was observed. A SEM image of a PEDOT electrode formed by eight preparative scans to 1200 mV is shown in
Figure 5b, and the extreme nature of the fractal-type growth under these conditions is evident. At this point, the PEDOT material extended some 50 µm out from the electrode surface, anchored by an area about 25 µm wide.
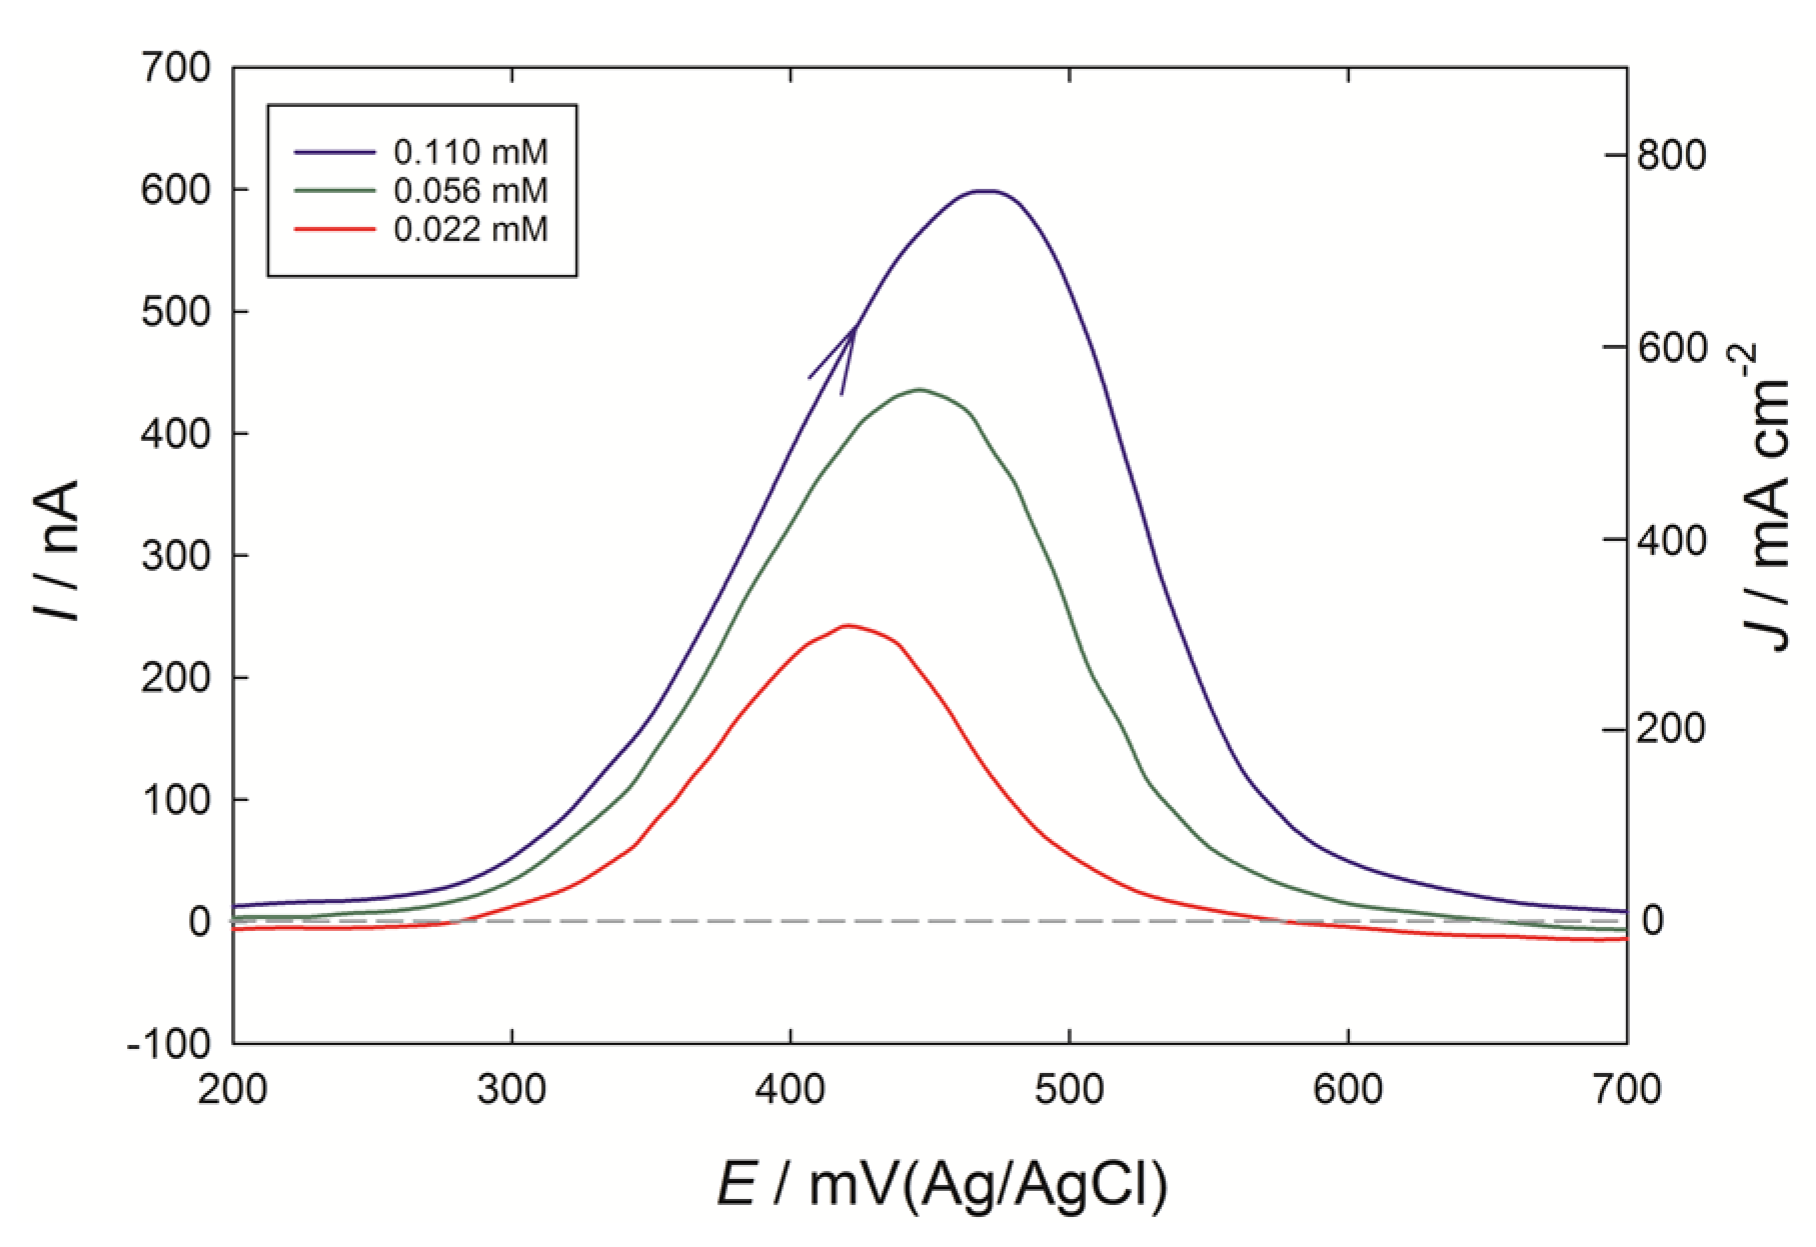
When solutions of caffeic acid were tested at the PEDOT microelectrodes (
Figure 6), a similar-shaped anodic peak was obtained at 400 to 500 mV, as seen at the 3 mm diameter PEDOT macroelectrode (
Figure 2a). Should the response have been under diffusion control at the microelectrode, a plateau current at potentials greater than 400 mV would be expected. However, the current density was now greatly enhanced, and provides a further example of adsorptive stripping voltammetry. For the case of the macroelectrode with 0.02 mM caffeic acid, the peak current of 4 µA at the 0.071 cm
2 electrode was thus 0.057 mA cm
−2. By contrast, a current of 230 nA for 0.022 mM caffeic acid (4 ppm), at the 7.9 × 10
−7 cm
2 electrode was 290 mA cm
−2, over 1000 times larger than the macroelectrode case. These ‘apparent’ current densities are reported in terms of the geometric surface are of the underlying glassy carbon or gold electrodes, but it is clear that the effective electrode area of PEDOT exposed to the solution in the microelectrode case is much larger, given the spherical shapes of the PEDOT deposits seen in SEM images. With the 3 mm diameter electrode, if further preparative scans with the PEDOT monomer were applied out to eight scans in total, the current response for caffeic acid did not increase significantly beyond that obtained with a four scan preparation, which was considered an optimum for the macroelectrode.
Despite the very large current densities involved at the PEDOT microelectrode, the current value had decreased back close to the background PEDOT response as the potential reached 600 mV, showing that high conductivity of the PEDOT conducting polymer had allowed the caffeic acid adsorbed throughout the PEDOT structure to be oxidized over the 3 s time period of the voltammetric scan, passing from 300 to 600 mV. Comparisons can be drawn with the high surface area response obtained with platinized platinum, compared to bright polished platinum, where roughness factors of the orders of several hundreds have been obtained [
20].
4. Conclusions
PEDOT electrodes show considerable promise for applications in electroanalytical chemistry, based upon their responsiveness to oxidizable substrates, such as wine polyphenols, and the separation of signals obtained when other reducing agents, such as ascorbic acid, are present. Considerable pre-concentration of phenolic species occurs at PEDOT electrodes, which can be followed by a stripping voltammogram for the quantification of phenolics present in beverages such as wines and teas. The very high surface area afforded by certain PEDOT preparations at microelectrodes raises the possibility of developing highly sensitive microelectrode systems. Further research is needed to optimize experimental conditions, including holding time, along with further correlations with phenolic composition by independent measures such as HPLC.


