Abstract
Forest ecosystems are important for biodiversity conservation, climate regulation and climate change mitigation, soil and water protection, and the recreation and provision of raw materials. This paper presents a dataset on forest type and tree species composition for 934 georeferenced plots located in Italy. The forest type is classified in the field consistently with the Italian National Forest Inventory (NFI) based on the dominant tree species or species group. Tree species composition is provided by the percent crown cover of the main five species in the plot. Additional data on conifer and broadleaves pure/mixed condition, total tree and shrub cover, forest structure, sylvicultural system, development stage, and local land position are provided. The surveyed plots are distributed in the central–eastern Alps, in the central Apennines, and in the southern Apennines; they represent a wide range of species composition, ecological conditions, and silvicultural practices. Data were collected as part of a project aimed at developing a classification algorithm based on hyperspectral data. The dataset was made publicly available as it refers to forest types and species widespread in many countries of Central and Southern Europe and is potentially useful to other researchers for the study of forest biodiversity or for remote sensing applications.
Dataset: https://doi.org/10.17632/dkxsms3dff.2.
Dataset License: CC BY 4.0
1. Summary
Forest ecosystems provide many important services such as biodiversity conservation, climate regulation and mitigation of climate change, soil and water protection, valuable landscapes for recreation and tourism, and, not any less important, the production of raw materials (timber, fuelwood, fibers, and other materials). Information on the species composition of forests is essential for studies, inventories, and forest management, and it is indispensable for many environmental, monitoring, or protection tasks [1]. National forest inventories (NFIs) are the primary source of forest information [2] and field surveys are an important component of forest inventories. Nevertheless, collecting information in the forest costs money, time, and effort [3]. Some strategies may be considered to reduce such costs like harmonizing and integrating forest monitoring programs, e.g., [4,5], quantifying the costs for measuring plots to further improve the overall efficiency of a forest survey campaign [6], adopting a stratified sampling to achieve the desired precision at a lower cost, and improving the information that may be gathered by remote sensing data.
Besides the wide variety of remotely sensed data acquired by different paid aerial platforms, in recent years, several Earth observation satellite missions (among them, ESA Copernicus Sentinel, NASA Landsat, and MODIS) have provided publicly available data used for the monitoring and mapping of forest vegetation (e.g., [7,8,9,10] for forest classification and mapping; and [11,12] for forest disturbance monitoring). Such missions provide global coverage with medium to high spatial resolution and short revisit periods. Their products are often used for automatic classification or forecast models based on machine learning techniques [13,14]. The high number of input variables that usually characterize these models requires a large amount of training data, which are time- and cost-consuming to be collected [15].
During the year 2022, a project was started to investigate the possibility of using hyperspectral satellite images provided by the recently launched mission PRISMA [16] to classify the forest cover by forest type and species composition to support the Italian NFI. The NFI adopted a double sampling for stratification with inventory strata determined by the forest type and the administrative region of the sampling units [17]. For the aim of the project, ground truth data on the forest type and tree species composition of forest plots were collected through field surveys and photointerpretation in one study area in the Alps and two study areas in the Apennines. The first results based on the produced dataset are described in [18,19].
The dataset resulting from the field surveys was made publicly available as it is particularly valuable in terms of plots number, observed variables, and accuracy of the plot positioning on the ground. The data collected refers to forest types and species shared with other countries of Central and Southern Europe and around the Mediterranean Sea. They are potentially useful to other researchers for analyzing the spectral response of vegetation and developing classification models by remote sensing data. For example, ref [7] showed that most species classification models were developed using pixel-based plot data from pure forests and pointed out the lack of georeferenced pixels in mixed stands, especially those with the proportion of species recorded; Ref [20] stressed the contrast between the potential of remotely sensed data demonstrated in local, simplified, case studies and the real-world complexity, emphasizing the importance of publishing benchmarking, open datasets covering wide geographic regions and forest conditions, particularly those useful for reference purposes such as the field plot data. Information on forest types and tree species distribution is also essential for the assessment of forest biodiversity indicators such as those derived at a pan-European level [21]. The dataset could also be useful for more detailed surveys on forest characteristics and forest disturbances, which do not necessarily require the use of remote sensing data.
2. Data Description
The presented data are provided in .xslx format on the cloud-based communal repository Mendeley Data (URL: https://data.mendeley.com/datasets/dkxsms3dff/2, accessed on 20 January 2025). They were collected in three study areas, one in the central–eastern Alps, one in the central Apennines, and one in the southern Apennines (Figure 1). Number, extent, and location of the study areas were determined to appropriately represent the main forest types and tree species that constitute the Italian forests. The list of the forest types in the dataset, their corresponding CORINE Biotopes and EUNIS codes, and the three most widespread species recorded in the plots are given in Table 1. Our dataset includes eleven forest types, which as a whole cover 6,975,265 hectares, equal to 77.9% of the Italian forest area [22].
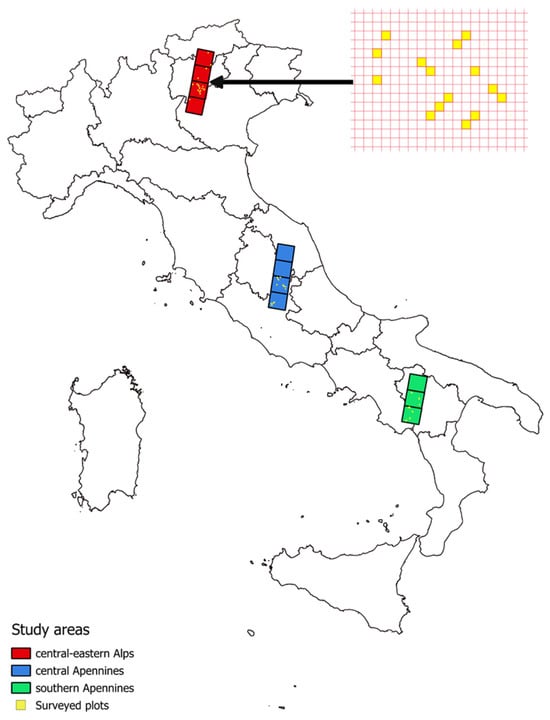
Figure 1.
Geographic location of three study areas.

Table 1.
Forest types in dataset, corresponding NFI codes, CORINE Biotopes, and EUNIS codes, and three most widespread species recorded in plots in decreasing order of crown coverage.
The data are organized in four files (plot_data.xlsx, plot_metadata.xlsx, species_data.xlsx, and species_metadata.xlsx). The two datasets, plot_data and species_data, are linked together by the plot identifier.
2.1. Plot Data and Metadata
The dataset “plot_data” includes 934 circular plots (15 m radius) distributed by forest type and study area, as shown in Table 2. The plots are georeferenced, and their centers correspond to the centroids of the PRISMA pixels; their north and east planimetric coordinates are provided in the UTM-WGS84 Projected Coordinate System. The number of plots by forest type ranges between 50 and 149; four forest types were sampled in two study areas, whereas seven were sampled only in one of the three study areas. The reported plot data are the forest type and the study area to which the plot is assigned, the percent crown cover (total, tree and shrub cover) by class, the pure/mixed condition, the sylvicultural system, the development stage, the local land position, and the number of crown layers. The sample captured the diversity in the stand variables well, as shown by the wide range of the values recorded. This is particularly relevant for the forest types marked by broadleaved species, which can be cultivated accordingly with a greater variety of silvicultural systems, compared to the coniferous ones.
Table 2.
Number of plots surveyed in three study areas by forest type and range of values for qualitative stand variables observed 1. (CE_AL = central-eastern Alps; C-AP = central Apennines; S_AP = southern Apennines; For_sys = sylvicultural system; Dev_stg = development stage; N_layers = number of layers; Land_p = local land position.).
The file “plot_metadata” reports information about labels and definitions of the plot variables, data type, measurement unit, value ranges, and additional information to better understand the data organization and structure.
2.2. Species Data
The dataset “species_data” contains the list of the five main tree species found in each plot and their crowns’ projections by classes, specifically for the dominant and the understory layers. The species list used for the survey is reported in the file “species_metadata”. It includes the 45 most common species, and 5 additional items, for the genera Betula, Cupressus, and Eucalyptus, and for “Other conifer” and “Other broadleaf”. The file “species_metadata” also reports the codes of the crown cover classes and their ranges, and additional information on the species dataset.
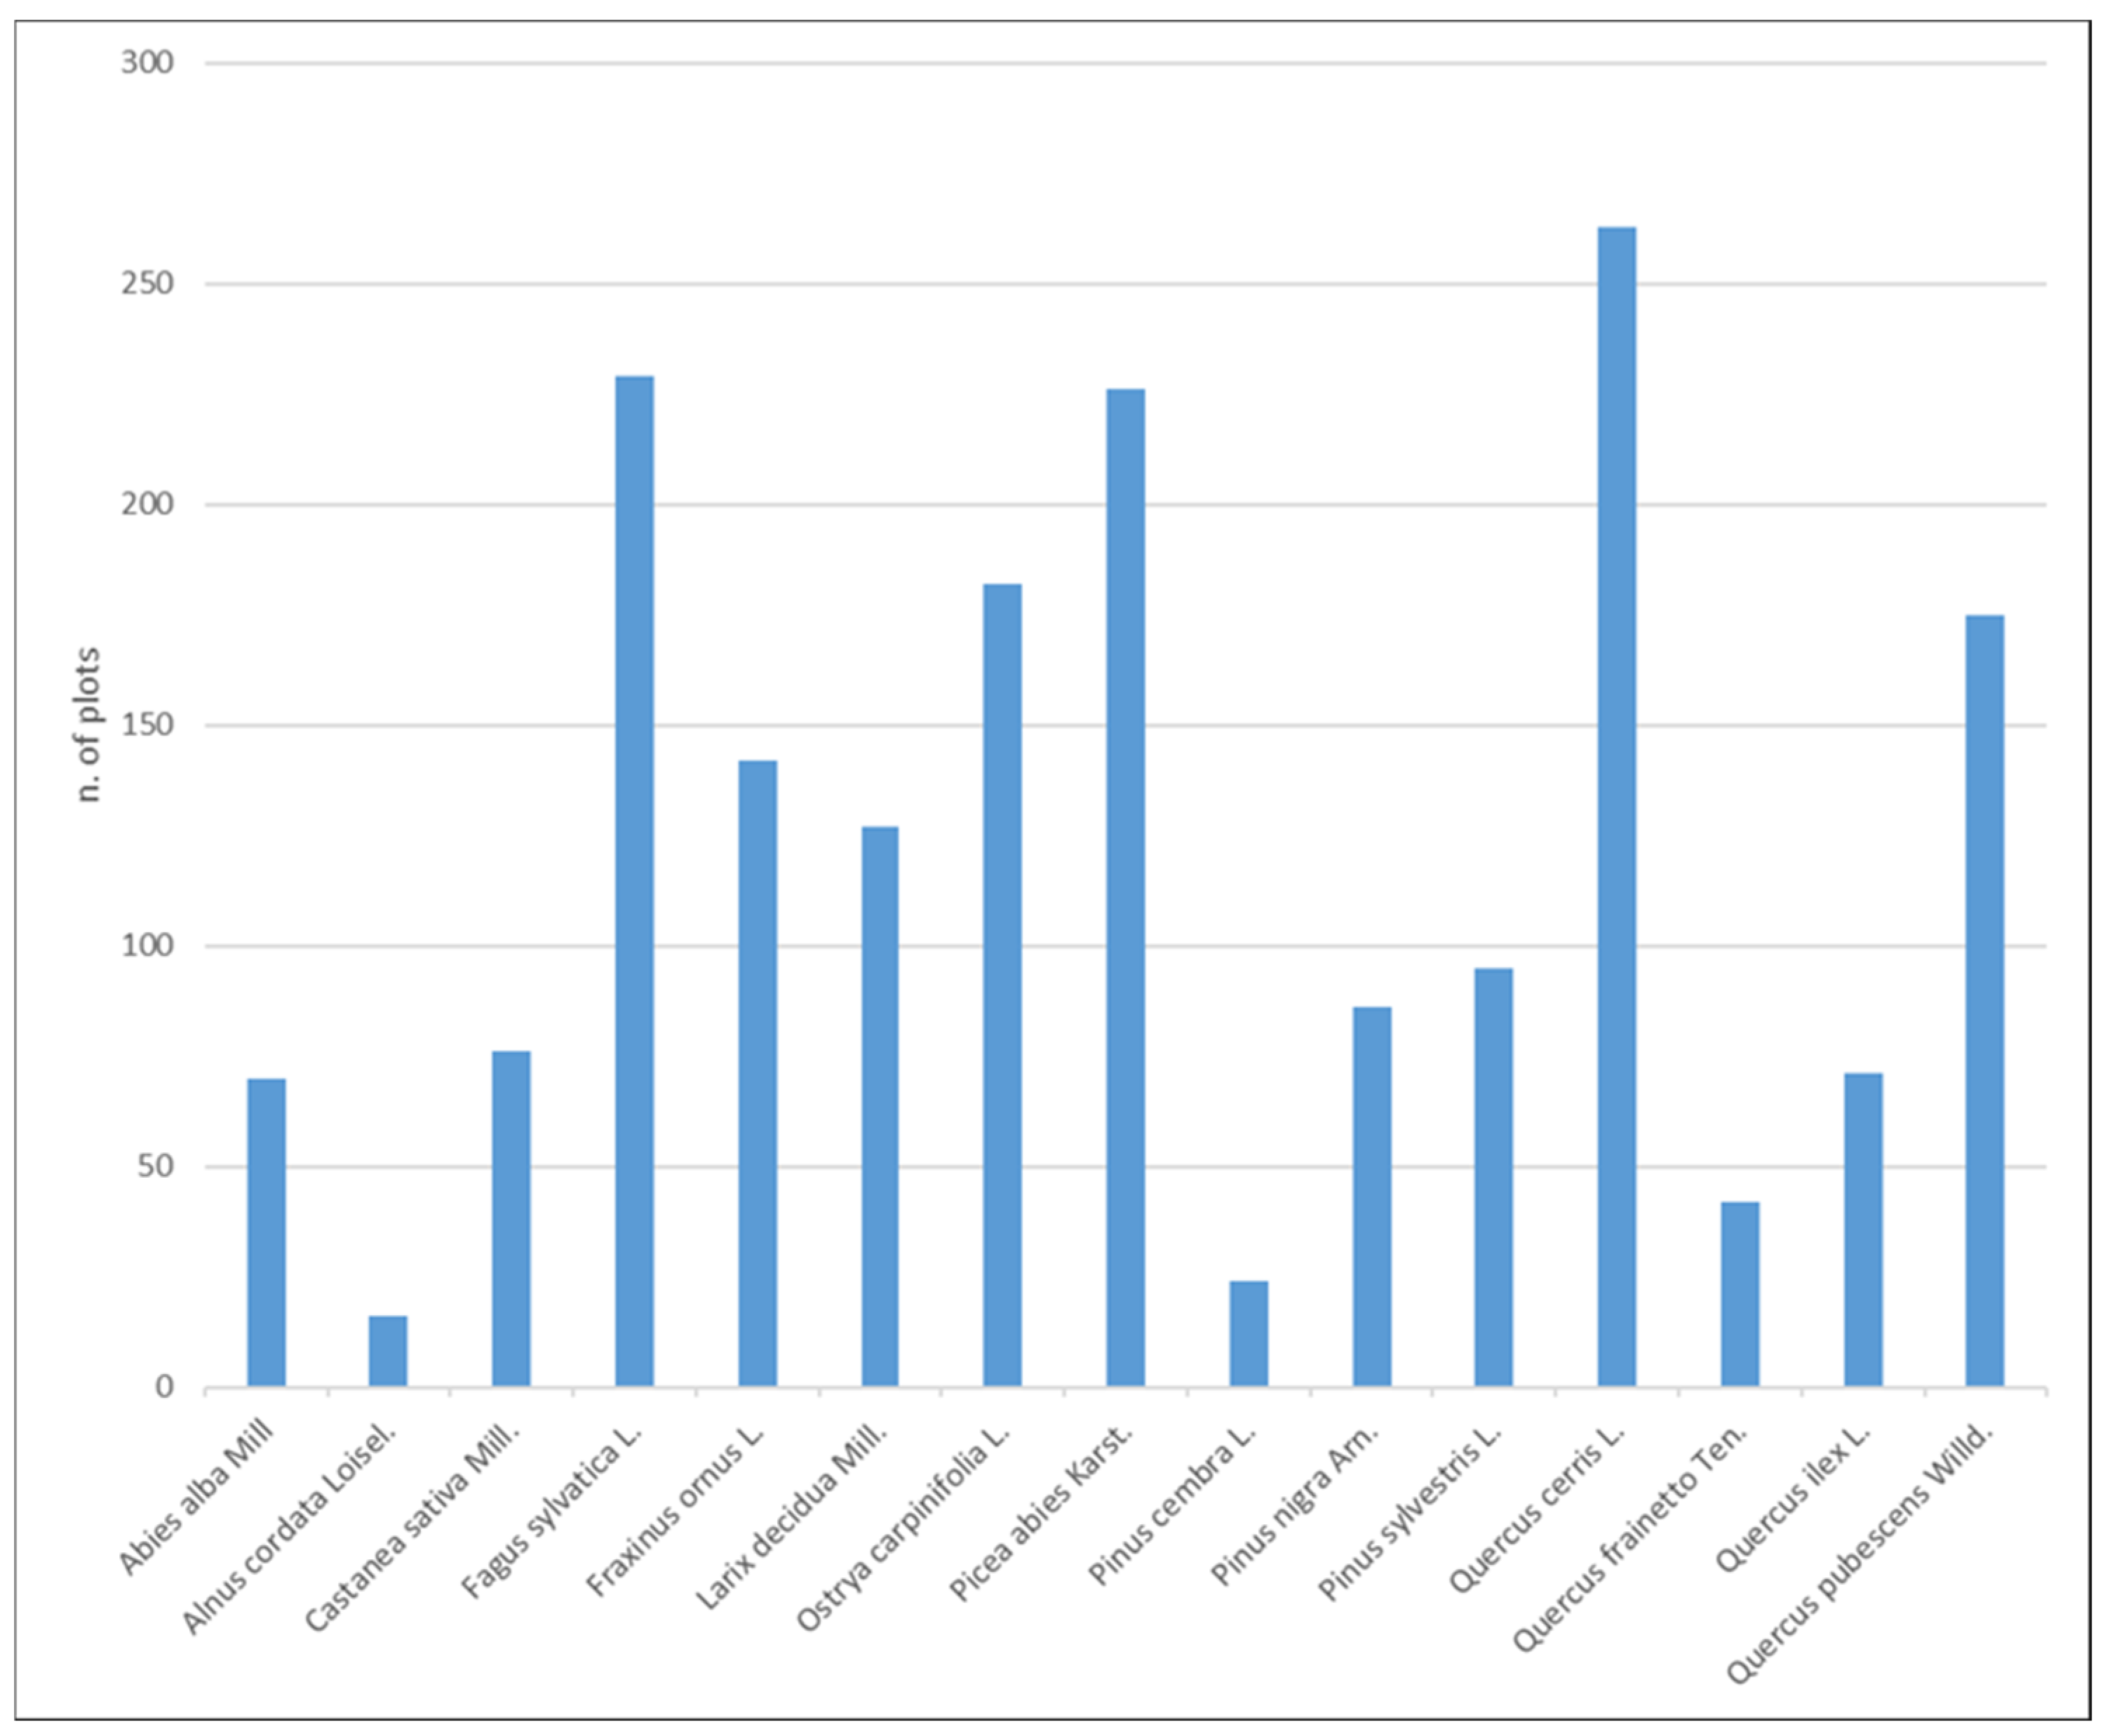
Table 3 reports the number of plots by number of tree species found in the plot and the crown cover ranges of the most widespread tree species in the plots. The number of species is given regardless of the position of their crown, i.e., the dominated trees are also considered, although they do not contribute to the plot crown cover. Recording five tree species in a plot is not frequent as it happened in only 3.3% of cases and in six forest categories out of eleven. Figure 2 shows the number of plots in which the individual species were recorded, with the most widespread species in terms of crown cover class in the plot.
Table 3.
Number of plots by number of tree species found in plot and ranges of crown cover of most widespread tree species in plot (first = first most widespread species; second = second most widespread species; etc.).
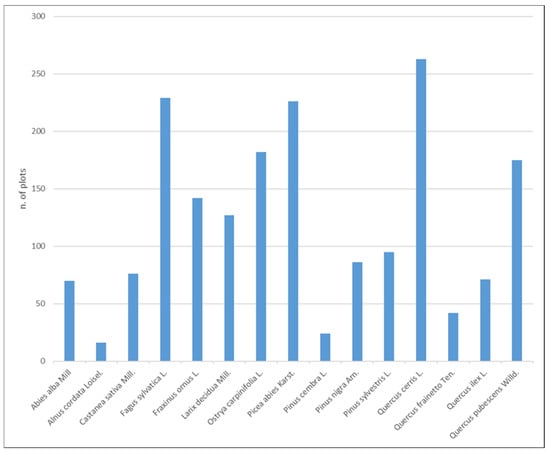
Figure 2.
Number of plots recorded in dataset for most widespread species.
3. Methods
Data on forest type, crown cover, stand features, and species composition were collected in a 15 m radius circular plot, an expansion of the 13 m radius circular plot used as a reference unit for the field measurements of the NFIs [17]. Once a georeferenced grid of PRISMA pixels (30 × 30 m size) was established for each study area, candidate pixels for the ground survey were selected through recent orthophotos and the analysis of forest planning documents. Hence, pixel centers were reached on the ground by a GNSS-assisted procedure borrowed from the NFI survey protocol [23], having metric to sub-metric precision (Trimble Geo7 L1 receiver, average of 50 single positions, EGNOS-WAAS correction). The plots are located according to clusters, each representing one forest type. To avoid a too high spatial autocorrelation, no adjacent plots were surveyed.
Data collection involved a first office work phase and a second one in the field. Firstly, the surveys were planned on QGIS® environment [24] by importing the raster Regional Technical Map of the study areas, the Google hybrid map layer, and the vector layers of the plot centers. After the QGIS project was created, along with the data input form, the QGIS project was packaged by QFieldSync plugin. The newly created folder was copied to the mobile device (tablet) where the project was run by the QField application [25] for field work. Field surveys were carried out from April to October 2023 and in March 2024.
Once the plots selected from those available were reached, field surveyors carried out the data collection. The recorded variables are the following:
- Forest type—It was classified on the basis of the dominant species or group of species in terms of crown cover and the classification system adopted by the Italian NFI, which includes 17 forest types, 7 of which are predominantly coniferous, 7 were predominantly deciduous broadleaf, and the remaining 3 were predominantly evergreen broadleaf [6,11]; in the presence of many species, forest type classification was achieved through several regularly spaced recordings of the tree species of the upper layer along two transects arranged orthogonally on the plot.
- Crown cover—It was estimated as the proportion of the plot area covered by the crowns’ projections on the ground; it was recorded by percentage classes, specifically for total cover, tree cover, and shrub cover; total cover is the percent of the plot ground covered by the projection of the trees and shrubs crowns as viewed from above (the overlapping crowns are counted once); tree cover is the percent canopy cover due to the projection of the tree crowns and shrub cover due to the projection of shrubs crowns not overlapped by tree crowns; the distinction between trees and shrubs is species-dependent, as reported in the Italian NFI; tree regeneration was considered as shrubs when the diameter at breast height (DBH) was less than 4.5 cm; only shrubs and trees at least 50 cm tall were assessed, consistently with the NFI protocol [11].
- Tree species coverage/composition—Crowns’ projections of the five main tree species found in the plot were estimated by 10% wide classes, specifically for the dominant and the understory layer. We limited the tree species to forty-eight because we worked on restricted areas, and additional tree species were recorded as “other conifer” or “other broadleaf”.
- Pure/mixed condition—A stand is classified as pure conifers if the crown cover of the coniferous species reaches at least 75%, pure broadleaved if the crown cover of the broadleaves reaches at least 75%, and mixed if neither conifers nor broadleaves reach that value.
- Crown layers—One layer or two layer conditions were recorded.
- Silvicultural system and development stage—The silvicultural system was classified based on nine classes by combining information on the trees’ origins (from seed or suckers, or a mixture of the two) and adopted silvicultural practices; the stage of development was recorded by fourteen classes based on visual assessment as well as the age class for even-aged stands.
- Local land position—The local land position in relation to the morphology of the area was assessed based on five classes.
Author Contributions
Conceptualization and methodology: P.G., L.D.C., A.F. and M.R.; data collection: L.D.C., A.F., F.M. and M.R.; data analysis and validation: L.D.C. and M.R.; writing—original draft preparation: P.G., L.D.C. and M.R.; writing—review and editing: P.G., L.D.C., A.F., F.M. and M.R. All authors have read and agreed to the published version of the manuscript.
Funding
This research was funded by ASI—Agenzia Spaziale Italiana—under the call PRISMA SCIENZA ASI DC-UOT-2019-061, financing agreement ASI N. 2022-1-U.0 “AFORISMA: Machine learning for forest cover analysis with hyperspectral data from the PRISMA mission to support the National Forest Inventory”.
Institutional Review Board Statement
Not applicable.
Informed Consent Statement
Not applicable.
Data Availability Statement
The dataset is available in the Mendeley Data repository (https://data.mendeley.com/datasets/dkxsms3dff/2, accessed on 20 January 2025); https://doi.org/10.17632/dkxsms3dff.2.
Acknowledgments
The authors thank Sandro Zanotelli for his contribution to data collection. The authors are also grateful to the two anonymous reviewers for their valuable suggestions, which contributed to the improvement of this paper.
Conflicts of Interest
The authors declare no conflicts of interest. The funders had no role in the design of the study; in the collection, analyses, or interpretation of the data; in the writing of the manuscript; or in the decision to publish the results.
References
- Waser, L.T.; Ginzler, C.; Kuechler, M.; Baltsavias, E.; Hurni, L. Semi-automatic classification of tree species in different forest ecosystems by spectral and geometric variables derived from Airborne Digital Sensor (ADS40) and RC30 data. Remote Sens. Environ. 2010, 115, 76–85. [Google Scholar] [CrossRef]
- Tomppo, E.; Gschwantner, T.; Lawrence, M.; McRoberts, R.E. (Eds.) National Forest Inventories—Pathways for Common Reporting; Springer Science + Business Media BV: Dordrecht, The Netherlands, 2010; p. 612. [Google Scholar]
- Loetsch, F.; Haller, K.E. Forest Inventory, 2nd ed.; BLV Verlagsgesellschaft: Munchen, Germany, 1973; Volume 1, p. 436. [Google Scholar]
- Gasparini, P.; Di Cosmo, L.; Cenni, E.; Pompei, E.; Ferretti, M. Towards the harmonization between National Forest Inventory and Forest Condition Monitoring. Consistency of plot allocation and effect of tree selection methods on sample statistics in Italy. Environ. Monit. Assess. 2013, 185, 6155–6171. [Google Scholar] [CrossRef] [PubMed]
- Tomppo, E.; Kuusinen, N.; Mäkisara, K.; Katila, M.; McRoberts, R.E. Effects of field plot configurations on the uncertainties of ALS-assisted forest resource estimates. Scand. J. For. Res. 2017, 32, 488–500. [Google Scholar] [CrossRef]
- Di Cosmo, L. Assessing the measuring time of forests plots. Ann. For. Res. 2024, 66, 121–138. [Google Scholar] [CrossRef]
- Bolyn, C.; Lejeune, P.; Michez, A.; Latte, N. Mapping tree species proportions from satellite imagery using spectral–spatial deep learning. Remote Sens. Environ. 2023, 280, 113205. [Google Scholar] [CrossRef]
- Cui, L.; Chen, S.; Mu, Y.; Xu, X.; Zhang, B.; Zhao, X. Tree Species Classification over Cloudy Mountainous Regions by Spatiotemporal Fusion and Ensemble Classifier. Forests 2023, 14, 107. [Google Scholar] [CrossRef]
- Guindon, L.; Manka, F.; Correia, D.L.P.; Villemaire, P.; Smiley, B.; Bernier, P.; Gauthier, S.; Beaudoin, A.; Boucher, J.; Boulanger, Y. A new approach for spatializing the Canadian National Forest Inventory (SCANFI) using Landsat dense time series. Can. J. For. Res. 2024, 54, 793–815. [Google Scholar] [CrossRef]
- Waser, L.; Rüetschi, M.; Psomas, A.; Small DRehush, N. Mapping dominant leaf type based on combined Sentinel-1/-2 data—Challenges for mountainous countries. ISPRS J. Photogramm. Remote Sens. 2021, 180, 209–226. [Google Scholar] [CrossRef]
- König, S.; Thonfeld, F.; Förster, M.; Dubovyk, O.; Heurich, M. Assessing Combinations of Landsat, Sentinel-2 and Sentinel-1 Time series for Detecting Bark Beetle Infestations. GISci. Remote Sens. 2023, 60, 2226515. [Google Scholar] [CrossRef]
- Reinosch, E.; Backa, J.; Adler, P.; Deutscher, J.; Eisnecker, P.; Hoffmann, K.; Langner, N.; Puhm, M.; Rüetschi, M.; Straub, C.; et al. Detailed validation of large-scale Sentinel-2-based forest disturbance maps across Germany. Forestry 2024, cpae038. [Google Scholar] [CrossRef]
- Fassnacht, F.E.; Latifi, H.; Stereńczak, K.; Modzelewska, A.; Lefsky, M.; Waser, L.T.; Straub, C.; Ghosh, A. Review of studies on tree species classification from remotely sensed data. Remote Sens. Environ. 2016, 186, 64–87. [Google Scholar] [CrossRef]
- Zhong, L.; Dai, Z.; Fang, P.; Cao, Y.; Wang, L. A Review: Tree Species Classification Based on Remote Sensing Data and Classic Deep Learning-Based Methods. Forests 2024, 15, 852. [Google Scholar] [CrossRef]
- Tomppo, E.; Ronoud, G.; Antropov, O.; Hytönen, H.; Praks, J. Detection of Forest Windstorm Damages with Multitemporal SAR Data—A Case Study: Finland. Remote Sens. 2021, 13, 383. [Google Scholar] [CrossRef]
- PRISMA—eoPortal. Available online: https://www.eoportal.org/satellite-missions/prisma-hyperspectral#eop-quick-facts-section (accessed on 20 January 2025).
- Gasparini, P.; Floris, A. Definitions and Sampling Design. In Italian National Forest Inventory—Methods and Results of the Third Survey; Gasparini, P., Di Cosmo, L., Floris, A., De Laurentis, D., Eds.; Springer Tracts in Civil Engineering; Springer: Cham, Switzerland, 2022; pp. 17–48. [Google Scholar] [CrossRef]
- Ferrari, M.; Bruzzone, L.; Gasparini, P.; Di Cosmo, L.; Floris, A.; Murgia, F.; Rizzo, M. Forest Cover Mapping by a Three-branch Convolutional Neural Network and PRISMA Images. In Proceedings of the Poster Session, 3rd Workshop on International Cooperation in Spaceborne Imaging Spectroscopy—Hyperspectral 2024, ESA-ESTEC, Noordwijk, The Netherland, 13–15 November 2024. [Google Scholar]
- Gasparini, P.; Di Cosmo, L.; Floris, A.; Murgia, F.; Rizzo, M.; Bruzzone, L.; Ferrari, M. Classificazione di coperture forestali con dati iperspettrali della missione PRISMA e tecniche di apprendimento automatico per l’impiego negli inventari forestali. In Proceedings of the Atti Conferenza Nazionale di Geomatica e Informazione Geografica ASITA 2024, Padova, Italy, 9–12 December 2024; Available online: https://asitait.serversicuro.it/atti/ASITA2024/Pdf/29.pdf (accessed on 20 January 2025).
- Fassnacht, F.E.; White, J.C.; Wulder, M.A.; Næsset, E. Remote sensing in forestry: Current challenges, considerations and directions. Forestry 2024, 97, 11–37. [Google Scholar] [CrossRef]
- Lier, M.; Schuck, A.; Brusselen, J.V.; Schuck, A.; Derks, J.; Parviainen, J.; Lier, M.; Bastrup-Birk, A.; Gasparini, P.; Bozzano, M.; et al. Criterion 4: Maintenance, Conservation and Appropriate Enhancement of Biological Diversity in Forest Ecosystems. In FOREST EUROPE, 2020: State of Europe’s Forests 2020. Available online: https://foresteurope.org/wp-content/uploads/2016/08/SoEF_2020.pdf (accessed on 20 January 2025).
- Gasparini, P.; Di Cosmo, L.; Floris, A. Area and Characteristics of Italian Forests. In Italian National Forest Inventory—Methods and Results of the Third Survey; Gasparini, P., Di Cosmo, L., Floris, A., De Laurentis, D., Eds.; Springer Tracts in Civil Engineering; Springer: Cham, Switzerland, 2022; pp. 151–325. [Google Scholar] [CrossRef]
- Floris, A.; Di Cosmo, L.; Rizzo, M.; Patrone, A. Field Assessment—Survey Protocols and Data Collection. In Italian National Forest Inventory—Methods and Results of the Third Survey; Gasparini, P., Di Cosmo, L., Floris, A., De Laurentis, D., Eds.; Springer Tracts in Civil Engineering; Springer: Cham, Switzerland, 2022; pp. 67–101. [Google Scholar] [CrossRef]
- QGIS Development Team. (Version 3.28, 2022) QGIS Geographic Information System, Open-Source Geospatial Foundation Project. Available online: https://qgis.org/ (accessed on 20 January 2025).
- QField—Efficient Field Work Built for QGIS. 2024. Available online: https://qfield.org/ (accessed on 20 January 2025).

Disclaimer/Publisher’s Note: The statements, opinions and data contained in all publications are solely those of the individual author(s) and contributor(s) and not of MDPI and/or the editor(s). MDPI and/or the editor(s) disclaim responsibility for any injury to people or property resulting from any ideas, methods, instructions or products referred to in the content. |
© 2025 by the authors. Licensee MDPI, Basel, Switzerland. This article is an open access article distributed under the terms and conditions of the Creative Commons Attribution (CC BY) license (https://creativecommons.org/licenses/by/4.0/).