A High-Resolution Map of Singapore’s Terrestrial Ecosystems


Abstract
Abstract
Dataset
Dataset License
1. Summary
2. Data Description
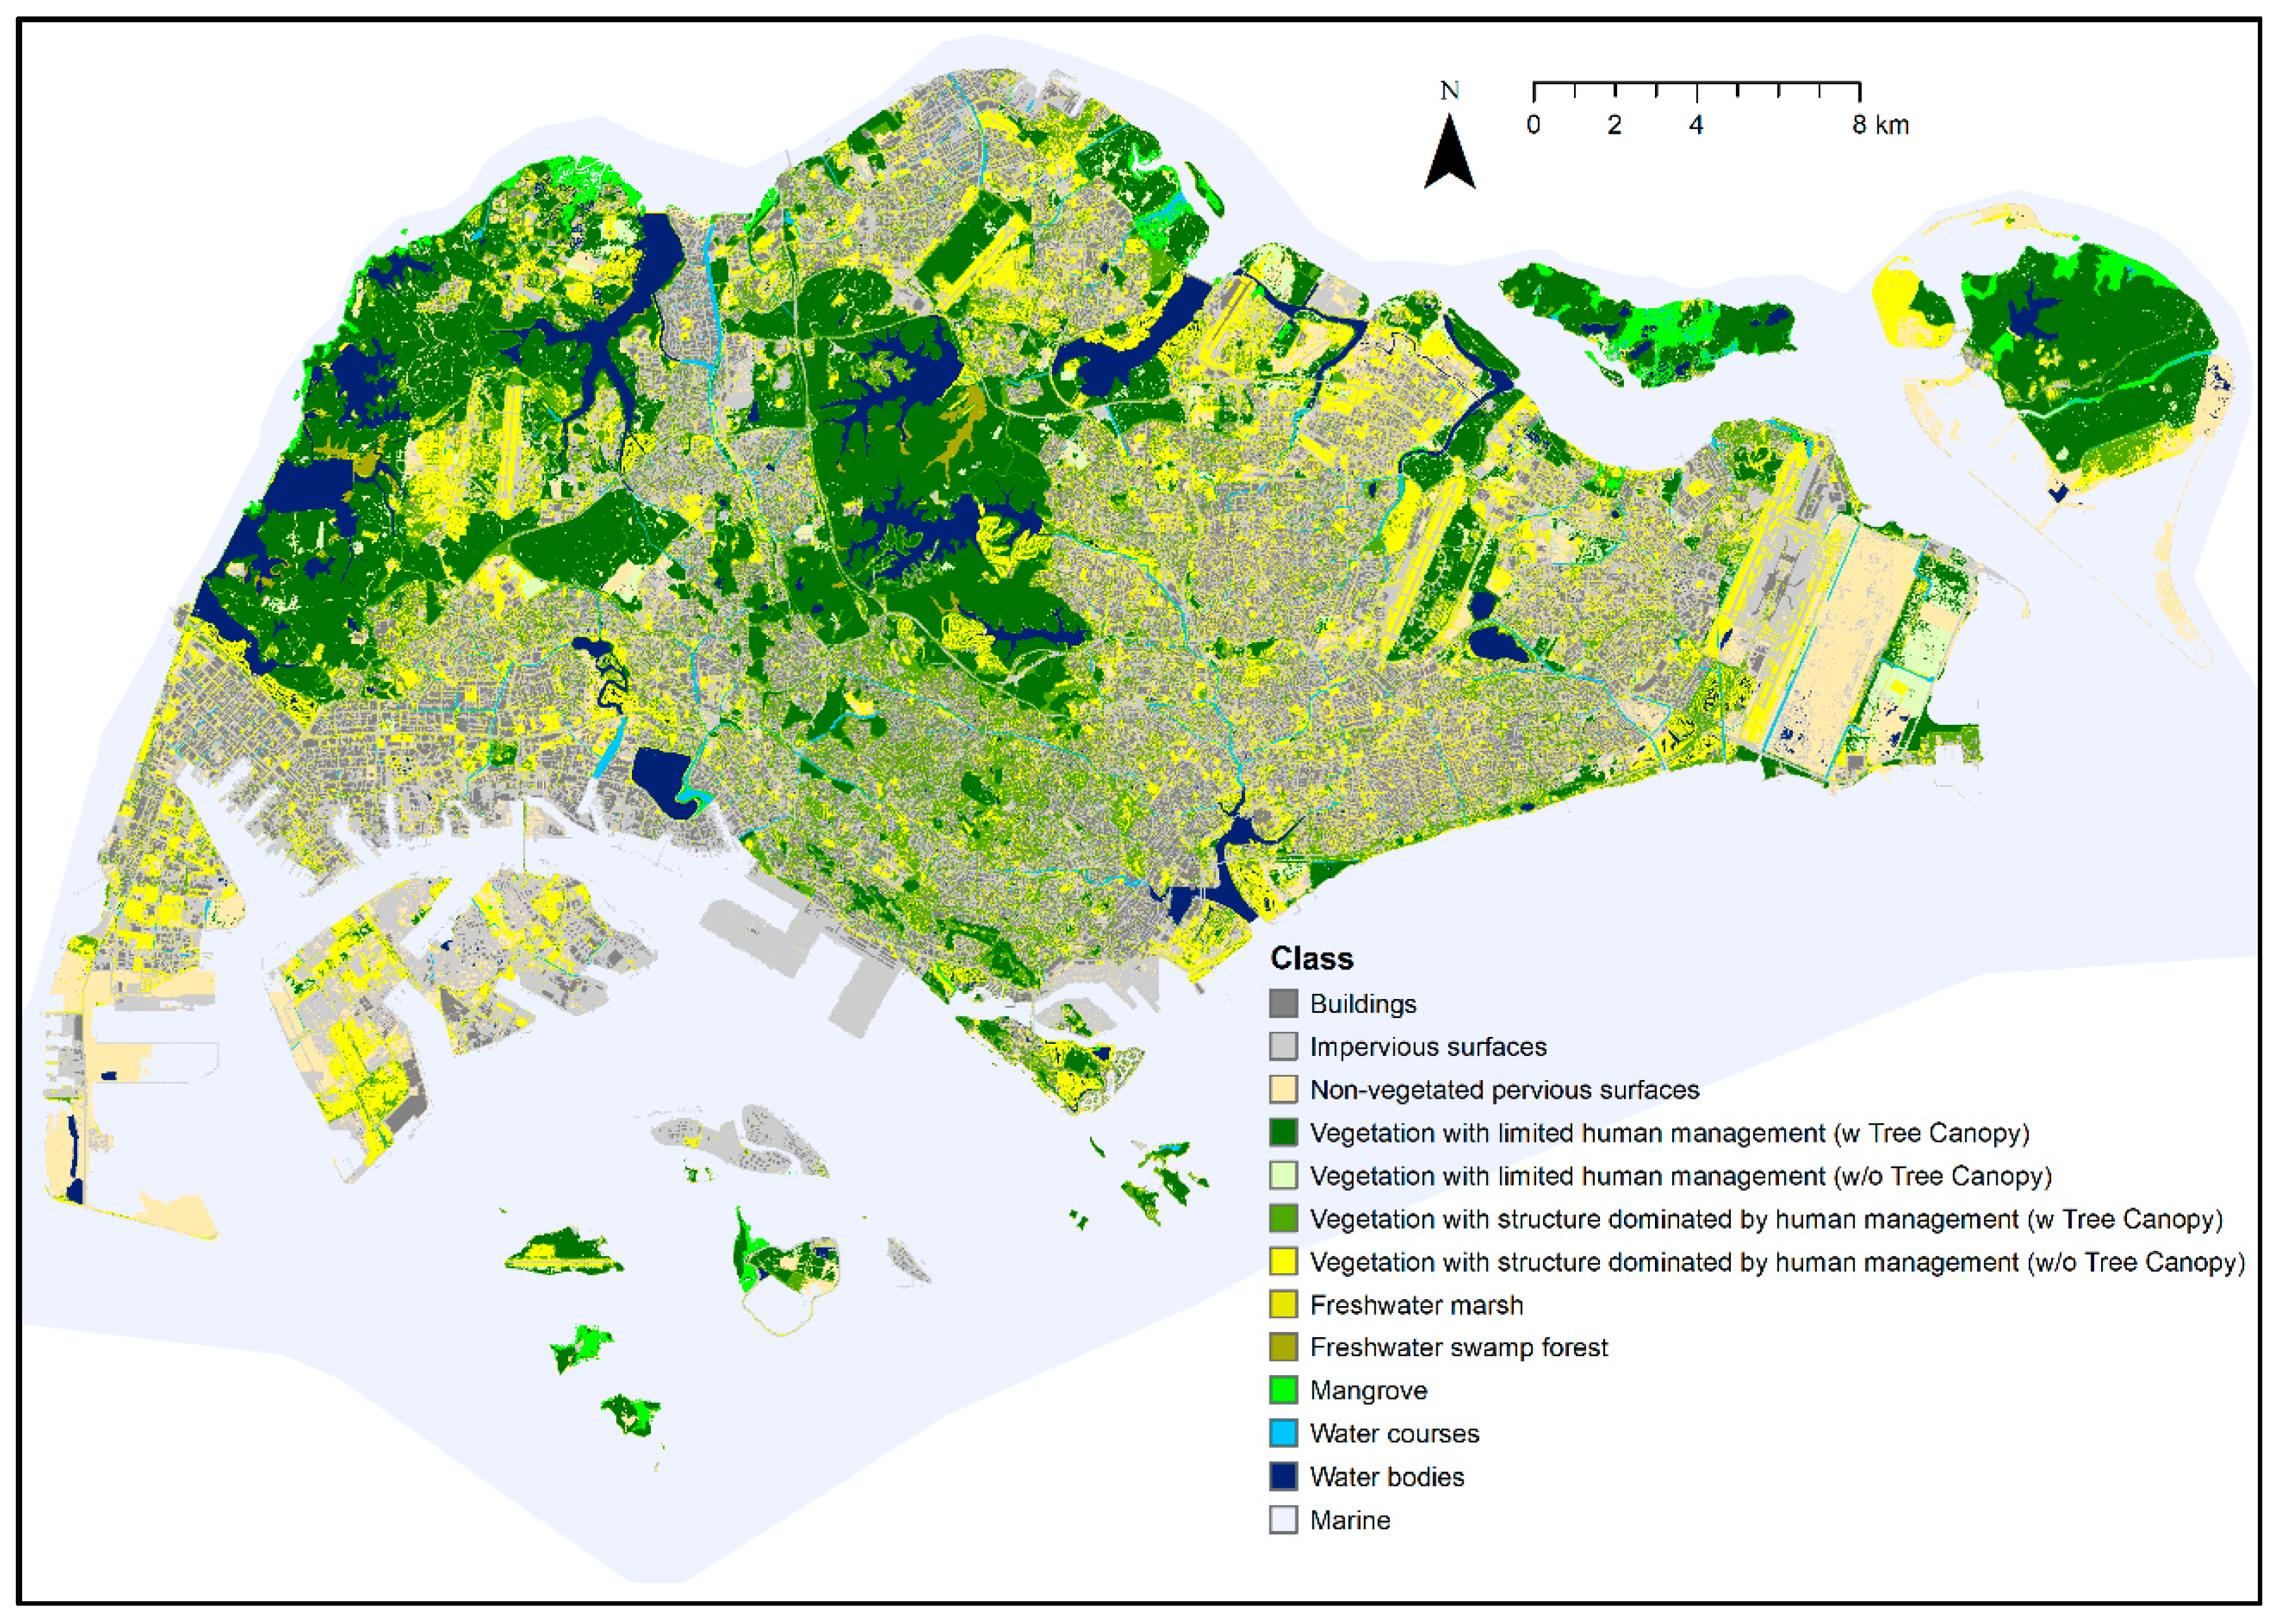
2.1. Data
2.2. Accuracy Assessment
2.3. Data in Perspective
3. Methods
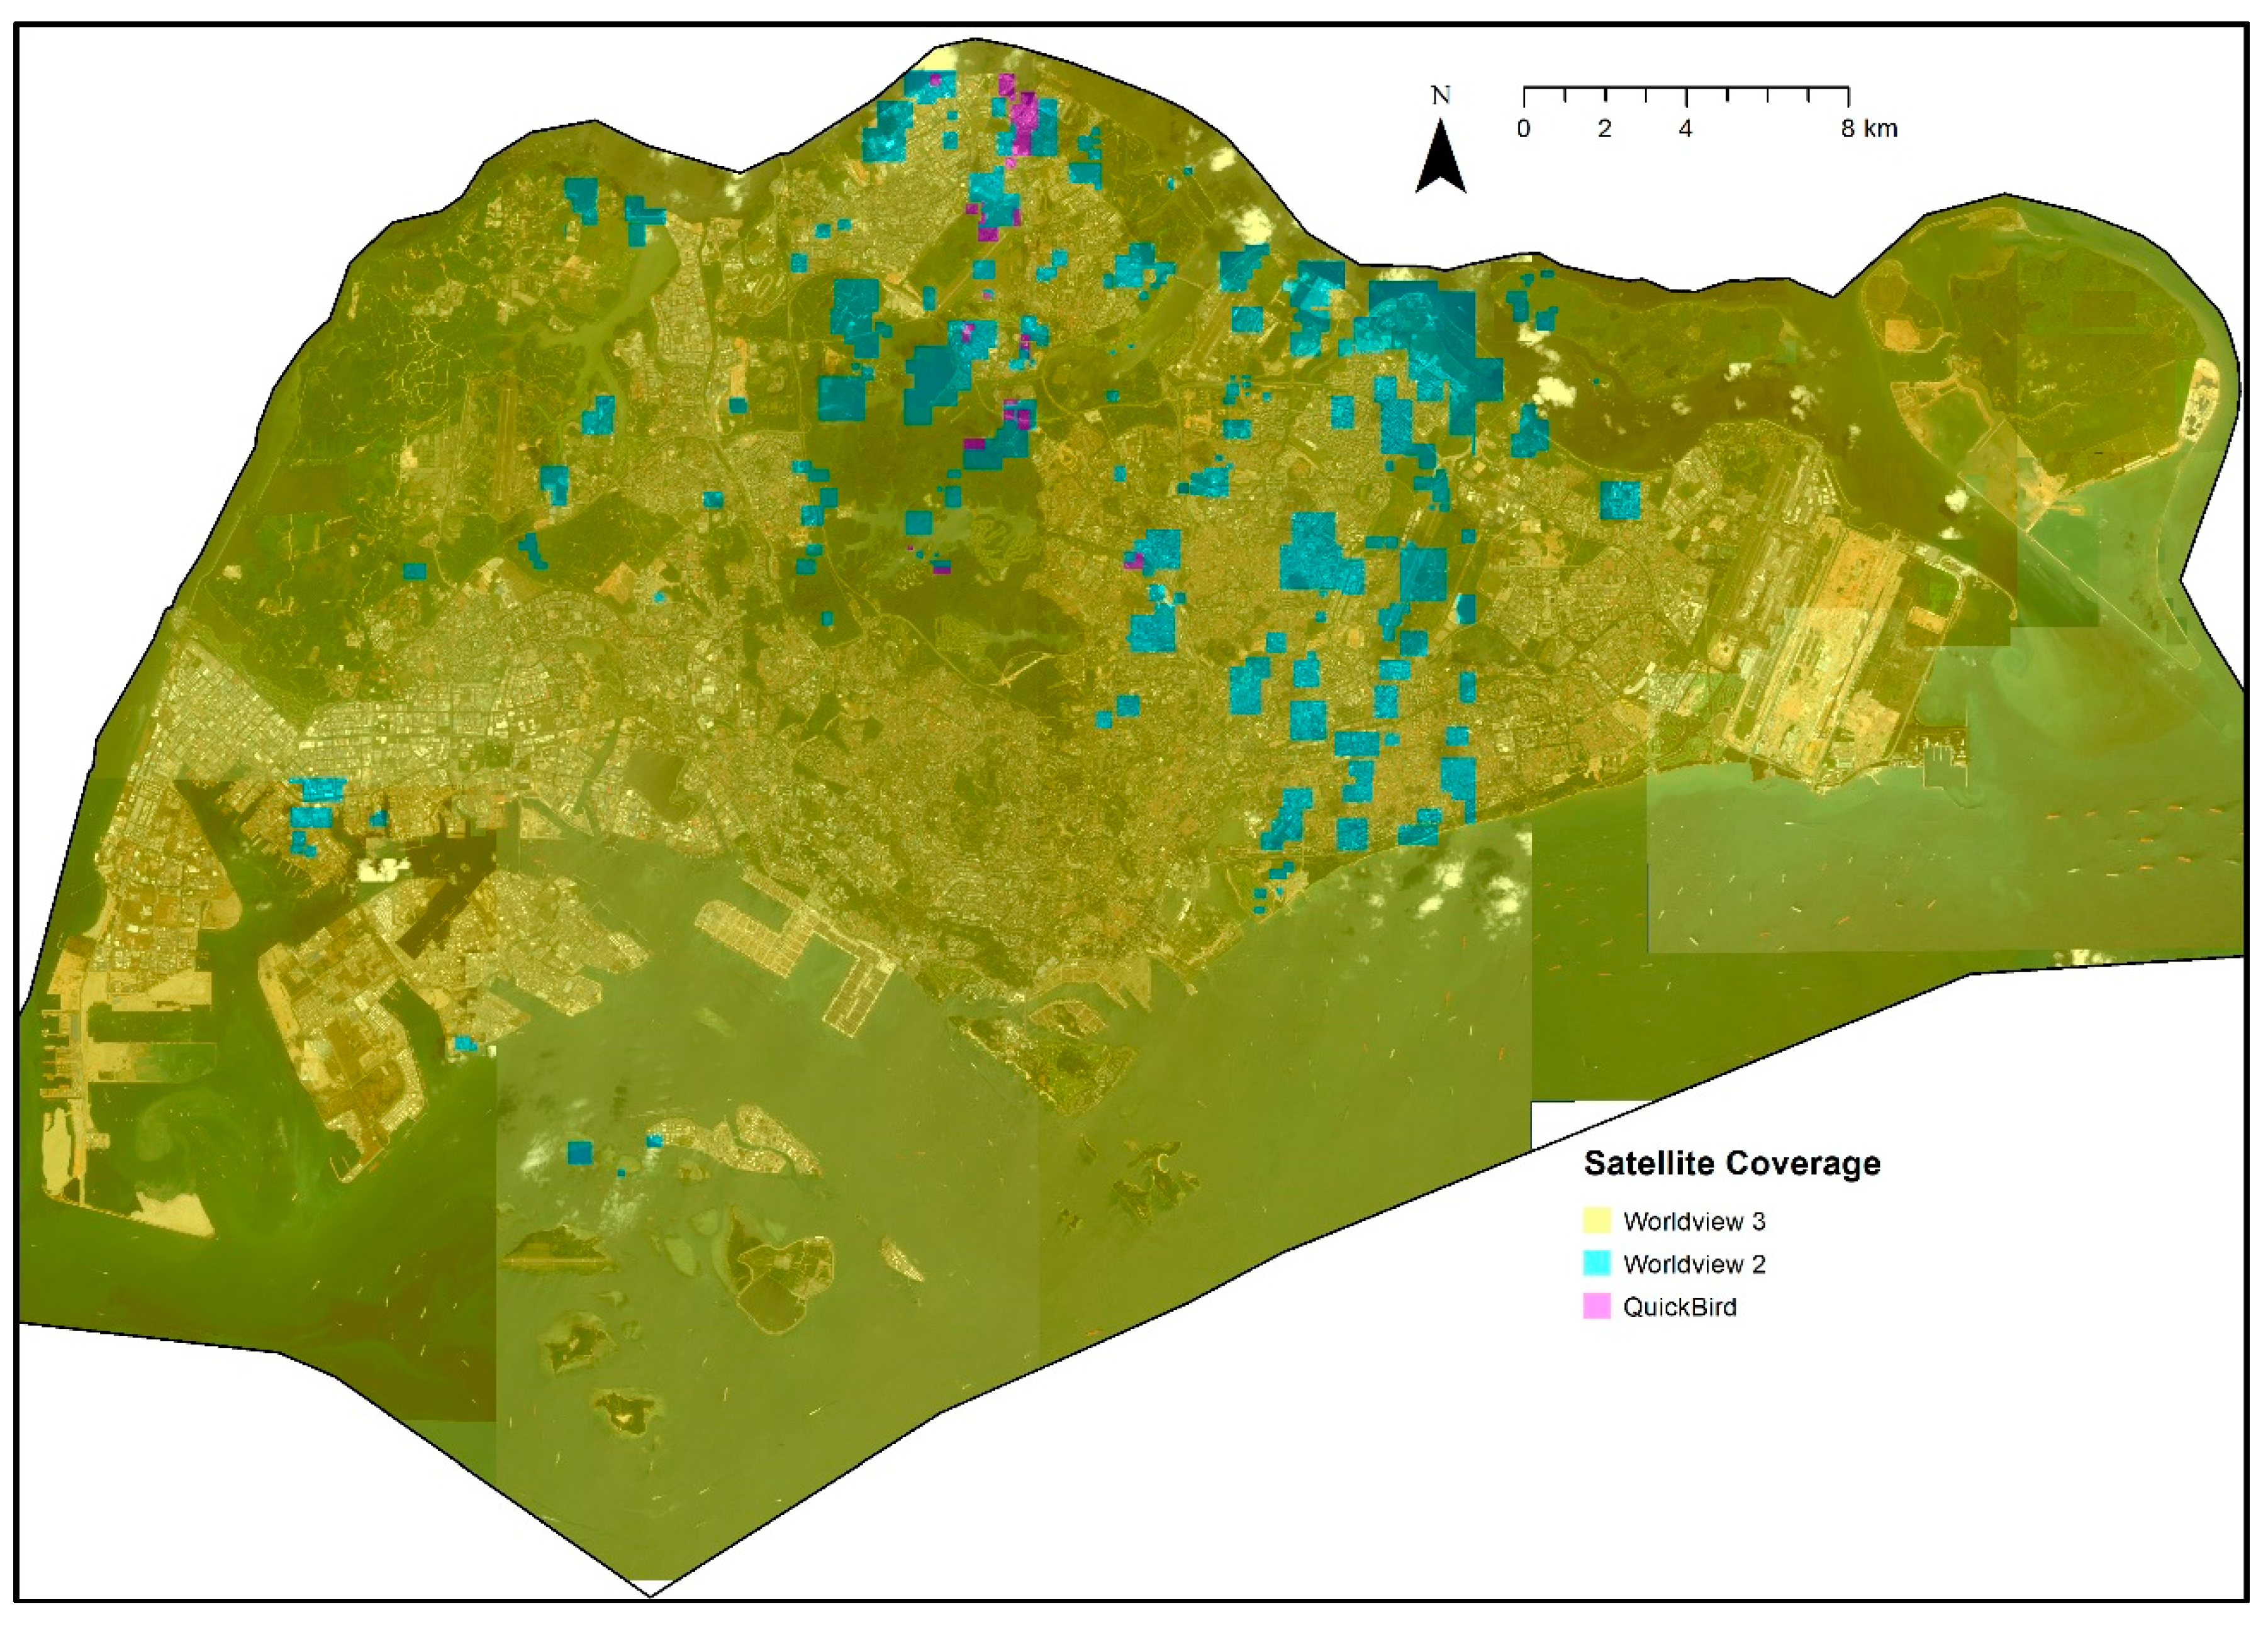
3.1. Data Acquisition
3.2. Image Pre-Processing
3.3. Image Classification
4. User Notes
Author Contributions
Funding
Acknowledgments
Conflicts of Interest
References
- Seto, K.C.; Fragkias, M.; Güneralp, B.; Reilly, M.K. A Meta-Analysis of Global Urban Land Expansion. PLoS ONE 2011, 6, e23777. [Google Scholar] [CrossRef]
- Grimm, N.B.; Faeth, S.H.; Golubiewski, N.E.; Redman, C.L.; Wu, J.; Bai, X.; Briggs, J.M. Global Change and the Ecology of Cities. Science 2008, 319, 756–760. [Google Scholar] [CrossRef]
- Song, X.P.; Tan, P.Y.; Edwards, P.; Richards, D. The economic benefits and costs of trees in urban forest stewardship: A systematic review. Urban For. Urban Green. 2018, 29, 162–170. [Google Scholar] [CrossRef]
- Hoellein, T.; Rojas, M.; Pink, A.; Gasior, J.; Kelly, J. Anthropogenic Litter in Urban Freshwater Ecosystems: Distribution and Microbial Interactions. PLoS ONE 2014, 9, e98485. [Google Scholar] [CrossRef]
- Freeman, C. Geographic information systems and the conservation of urban biodiversity. Urban Policy Res. 1999, 17, 51–60. [Google Scholar] [CrossRef]
- Bolund, P.; Hunhammar, S. Ecosystem services in urban areas. Ecol. Econ. 1999, 29, 293–301. [Google Scholar] [CrossRef]
- Jenerette, G.D.; Harlan, S.L.; Stefanov, W.L.; Martin, C.A. Ecosystem services and urban heat riskscape moderation: Water, green spaces, and social inequality in Phoenix, USA. Ecol. Appl. 2011, 21, 2637–2651. [Google Scholar] [CrossRef]
- Keesstra, S.; Nunes, J.; Novara, A.; Finger, D.; Avelar, D.; Kalantari, Z.; Cerdà, A. The superior effect of nature based solutions in land management for enhancing ecosystem services. Sci. Total Environ. 2018, 610–611, 997–1009. [Google Scholar] [CrossRef]
- Thiagarajah, J.; Wong, S.K.M.; Richards, D.R.; Friess, D.A. Historical and contemporary cultural ecosystem service values in the rapidly urbanizing city state of Singapore. Ambio 2015, 44, 666–677. [Google Scholar] [CrossRef]
- Li, D.; Ke, Y.; Gong, H.; Li, X. Object-Based Urban Tree Species Classification Using Bi-Temporal WorldView-2 and WorldView-3 Images. Remote Sens. 2015, 7, 16917–16937. [Google Scholar] [CrossRef]
- Busetto, L.; Meroni, M.; Colombo, R. Combining medium and coarse spatial resolution satellite data to improve the estimation of sub-pixel NDVI time series. Remote Sens. Environ. 2008, 112, 118–131. [Google Scholar] [CrossRef]
- Yee, A.T.K.; Corlett, R.T.; Liew, S.C.; Tan, H.T.W. The vegetation of Singapore―An updated map. Gard. Bull. Singap. 2011, 63, 205–212. [Google Scholar]
- Fuller, R.M.; Groom, G.B.; Jones, A.R. The land-cover map of great Britain: An automated classification of landsat thematic mapper data. Photogramm. Eng. Remote. Sens. 1994, 60, 553–562. [Google Scholar]
- Liu, X.; He, J.; Yao, Y.; Zhang, J.; Liang, H.; Wang, H.; Hong, Y. Classifying urban land use by integrating remote sensing and social media data. Int. J. Geogr. Inf. Sci. 2017, 31, 1675–1696. [Google Scholar] [CrossRef]
- Randall, M.; Fensholt, R.; Zhang, Y.; Bergen Jensen, M. Geographic Object Based Image Analysis of WorldView-3 Imagery for Urban Hydrologic Modelling at the Catchment Scale. Water 2019, 11, 1133. [Google Scholar] [CrossRef]
- Yee, A.T.K.; Chong, K.Y.; Neo, L.; Tan, H.T.W. Updating the classification system for the secondary forests of Singapore. Raffles Bull. Zool. 2016, 32, 11–21. [Google Scholar]
- Lovelock, C.E.; Cahoon, D.R.; Friess, D.A.; Guntenspergen, G.R.; Krauss, K.W.; Reef, R.; Rogers, K.; Saunders, M.L.; Sidik, F.; Swales, A.; et al. The vulnerability of Indo-Pacific mangrove forests to sea-level rise. Nature 2015, 526, 559–563. [Google Scholar] [CrossRef]
- Singapore Land Authority (SLA). Total Land Area of Singapore. Available online: https://data.gov.sg/dataset/total-land-area-of-singapore (accessed on 24 April 2019).
- Asner, G.P. Cloud cover in Landsat observations of the Brazilian Amazon. Int. J. Remote Sens. 2001, 22, 3855–3862. [Google Scholar] [CrossRef]
- Tan, P.Y.; Wang, J.; Sia, A. Perspectives on five decades of the urban greening of Singapore. Cities 2013, 32, 24–32. [Google Scholar] [CrossRef]
- Environmental Systems Research Institute (ESRI). ArcGIS Release 10.5; Environmental Systems Research Institute (ESRI): Redlands, CA, USA, 2016. [Google Scholar]
- Environmental Systems Research Institute (ESRI). Apparent Reflectance Function. Available online: http://desktop.arcgis.com/en/arcmap/10.5/manage-data/raster-and-images/apparent-reflectance-function.htm (accessed on 2 May 2019).
- Liu, D.; Xia, F. Assessing object-based classification: Advantages and limitations. Remote Sens. Lett. 2010, 1, 187–194. [Google Scholar] [CrossRef]
- Environmental Systems Research Institute (ESRI). Segment Mean Shift Function. Available online: http://desktop.arcgis.com/en/arcmap/10.5/manage-data/raster-and-images/segment-mean-shift-function.htm (accessed on 24 April 2019).
- Butler, K. Pass the Classification but Hold the Salt and Pepper. Available online: https://www.esri.com/arcgis-blog/products/product/national-government/pass-the-classification-but-hold-the-salt-and-pepper/ (accessed on 17 July 2019).
- DigitalGlobe. WorldView-3 Data Sheet. Available online: http://satimagingcorp.s3.amazonaws.com/site/pdf/WorldView3-DS-WV3-Web.pdf (accessed on 17 July 2019).
- Satellite Imaging Corporation. QuickBird Imagery Products FAQ. Available online: http://satimagingcorp.s3.amazonaws.com/site/pdf/quickbird_imagery_products.pdf (accessed on 17 July 2019).
- R Core Team. R: A Language and Environment for Statistical Computing; R Foundation for Statistical Computing: Vienna, Austria, 2014. [Google Scholar]
- Liaw, A.; Wiener, M. Classification and regression by randomForest. R News 2002, 2, 18–22. [Google Scholar]
- OpenStreetMap. OpenStreetMap of Singapore. Available online: https://www.openstreetmap.org/search?query=singapore#map=12/ 1.2905/103.8520 (accessed on 5 April 2018).
- Public Utilities Board (PUB). Drainage Network. Available online: https://www.pub.gov.sg/drainage/network (accessed on 24 April 2019).
- Environmental Systems Research Institute (ESRI). About Using the Raster Painting Tools. Available online: http://desktop.arcgis.com/en/arcmap/10.5/extensions/arcscan/using-the-raster-painting-tools-about-using-the-ra.htm (accessed on 24 April 2019).
- Congalton, R.G. A review of assessing the accuracy of classifications of remotely sensed data. Remote Sens. Environ. 1991, 37, 35–46. [Google Scholar] [CrossRef]
- Congalton, R.G.; Green, K. Sample Design Considerations. In Assessing the Accuracy of Remotely Sensed Data: Principles and Practices, 2nd ed.; CRC Press: New York, NY, USA, 2009; pp. 63–103. [Google Scholar]
- Myint, S.W.; Gober, P.; Brazel, A.; Grossman-Clarke, S.; Weng, Q. Per-pixel vs. object-based classification of urban land cover extraction using high spatial resolution imagery. Remote Sens. Environ. 2011, 115, 1145–1161. [Google Scholar] [CrossRef]
- Ma, L.; Li, M.; Ma, X.; Cheng, L.; Du, P.; Liu, Y. A review of supervised object-based land-cover image classification. ISPRS J. Photogramm. Remote Sens. 2017, 130, 277–293. [Google Scholar] [CrossRef]
- Zhang, W.; Li, W.; Zhang, C.; Hanink, D.M.; Li, X.; Wang, W. Parcel-based urban land use classification in megacity using airborne LiDAR, high resolution orthoimagery, and Google Street View. Comput. Environ. Urban Syst. 2017, 64, 215–228. [Google Scholar] [CrossRef]


| Map Class | Code | Area (km2) | Percentage of Land Area (%) |
|---|---|---|---|
| Buildings | 1 | 91.1 | 12.3 |
| Artificial impervious surfaces | 2 | 193.0 | 26.0 |
| Non-vegetated pervious surfaces | 3 | 53.0 | 7.1 |
| Vegetation with limited human management (with Tree Canopy) | 4 | 139.0 | 18.7 |
| Vegetation with limited human management (without Tree Canopy) | 5 | 14.1 | 1.9 |
| Vegetation with structure dominated by human management (with Tree Canopy) | 6 | 82.8 | 11.1 |
| Vegetation with structure dominated by human management (without Tree Canopy) | 7 | 112.5 | 15.1 |
| Freshwater swamp forest | 8 | 2.2 | 0.3 |
| Freshwater marsh | 9 | 0.4 | 0.1 |
| Mangrove forest | 10 | 8.1 | 1.1 |
| Water courses | 11 | 8.2 | 1.1 |
| Water bodies | 12 | 38.4 | 5.2 |
| Marine | 13 | 647.4 | - |
| 1 | 2 | 3 | 4 | 5 | 6 | 7 | 8 | 9 | 10 | 11 | 12 | Total | UA | CE | |
|---|---|---|---|---|---|---|---|---|---|---|---|---|---|---|---|
| 1 | 71 | 4 | 2 | 77 | 92% | 8% | |||||||||
| 2 | 8 | 68 | 16 | 3 | 1 | 8 | 104 | 65% | 35% | ||||||
| 3 | 7 | 53 | 4 | 1 | 65 | 82% | 18% | ||||||||
| 4 | 3 | 78 | 3 | 5 | 1 | 1 | 1 | 92 | 85% | 15% | |||||
| 5 | 1 | 18 | 19 | 95% | 5% | ||||||||||
| 6 | 1 | 3 | 6 | 65 | 1 | 1 | 77 | 84% | 16% | ||||||
| 7 | 1 | 2 | 46 | 8 | 80 | 137 | 58% | 42% | |||||||
| 8 | 1 | 36 | 6 | 43 | 84% | 16% | |||||||||
| 9 | 7 | 7 | 100% | 0% | |||||||||||
| 10 | 63 | 2 | 65 | 97% | 3% | ||||||||||
| 11 | 3 | 26 | 9 | 77 | 2 | 117 | 66% | 34% | |||||||
| 12 | 1 | 76 | 77 | 99% | 1% | ||||||||||
| Total | 80 | 80 | 80 | 80 | 80 | 80 | 80 | 40 | 40 | 80 | 80 | 80 | 880 | ||
| PA | 89% | 85% | 66% | 98% | 23% | 81% | 100% | 90% | 18% | 79% | 96% | 95% | Overall | 79% | |
| OE | 11% | 15% | 34% | 3% | 78% | 19% | 0% | 10% | 83% | 21% | 4% | 5% | Kappa | 77% |
| Sensor | Image ID | Date | Time (GMT+8) | Wavelength (nm) | Coverage (%) |
|---|---|---|---|---|---|
| WorldView-3 | 308 | 18 Feb 18 | 1138 h | 400–1040 | 0.17 |
| WorldView-3 | 302 | 10 Feb 18 | 1158 h | 400–1040 | 31.07 |
| WorldView-3 | 305 | 10 Feb 18 | 1157 h | 400–1040 | 19.99 |
| WorldView-3 | 307 | 10 Feb 18 | 1158 h | 400–1040 | 7.38 |
| WorldView-3 | 306 | 15 Nov 17 | 1106 h | 400–1040 | 9.56 |
| WorldView-3 | 301 | 5 May 17 | 1152 h | 400–1040 | 11.97 |
| WorldView-3 | 304 | 12 Nov 16 | 1145 h | 400–1040 | 1.88 |
| WorldView-3 | 303 | 29 Jun 16 | 1141 h | 400–1040 | 1.18 |
| WorldView-2 | 208 | 19 Apr 15 | 1136 h | 400–1040 | 1.00 |
| WorldView-2 | 203 | 23 Mar 15 | 1134 h | 400–1040 | 0.01 |
| WorldView-2 | 207 | 23 Mar 15 | 1133 h | 400–1040 | 0.67 |
| WorldView-2 | 206 | 17 Jan 15 | 1133 h | 400–1040 | 1.97 |
| WorldView-2 | 201 | 14 Jun 12 | 1143 h | 400–1040 | 0.27 |
| WorldView-2 | 202 | 18 Jul 11 | 1149 h | 400–1040 | 0.26 |
| WorldView-2 | 204 | 8 Apr 11 | 1143 h | 400–1040 | 0.11 |
| WorldView-2 | 205 | 19 Nov 10 | 1138 h | 400–1040 | 0.11 |
| QuickBird | 901 | 16 Oct 03 | 1115 h | 450–900 | 0.17 |
© 2019 by the authors. Licensee MDPI, Basel, Switzerland. This article is an open access article distributed under the terms and conditions of the Creative Commons Attribution (CC BY) license (http://creativecommons.org/licenses/by/4.0/).
Share and Cite
Gaw, L.Y.-F.; Yee, A.T.K.; Richards, D.R. A High-Resolution Map of Singapore’s Terrestrial Ecosystems. Data 2019, 4, 116. https://doi.org/10.3390/data4030116
Gaw LY-F, Yee ATK, Richards DR. A High-Resolution Map of Singapore’s Terrestrial Ecosystems. Data. 2019; 4(3):116. https://doi.org/10.3390/data4030116
Chicago/Turabian StyleGaw, Leon Yan-Feng, Alex Thiam Koon Yee, and Daniel Rex Richards. 2019. "A High-Resolution Map of Singapore’s Terrestrial Ecosystems" Data 4, no. 3: 116. https://doi.org/10.3390/data4030116
APA StyleGaw, L. Y.-F., Yee, A. T. K., & Richards, D. R. (2019). A High-Resolution Map of Singapore’s Terrestrial Ecosystems. Data, 4(3), 116. https://doi.org/10.3390/data4030116