Assessing Sustainability of the Capital and Emerging Secondary Cities of Cambodia Based on the 2018 Commune Database


Abstract
:1. Introduction
2. Literature Review
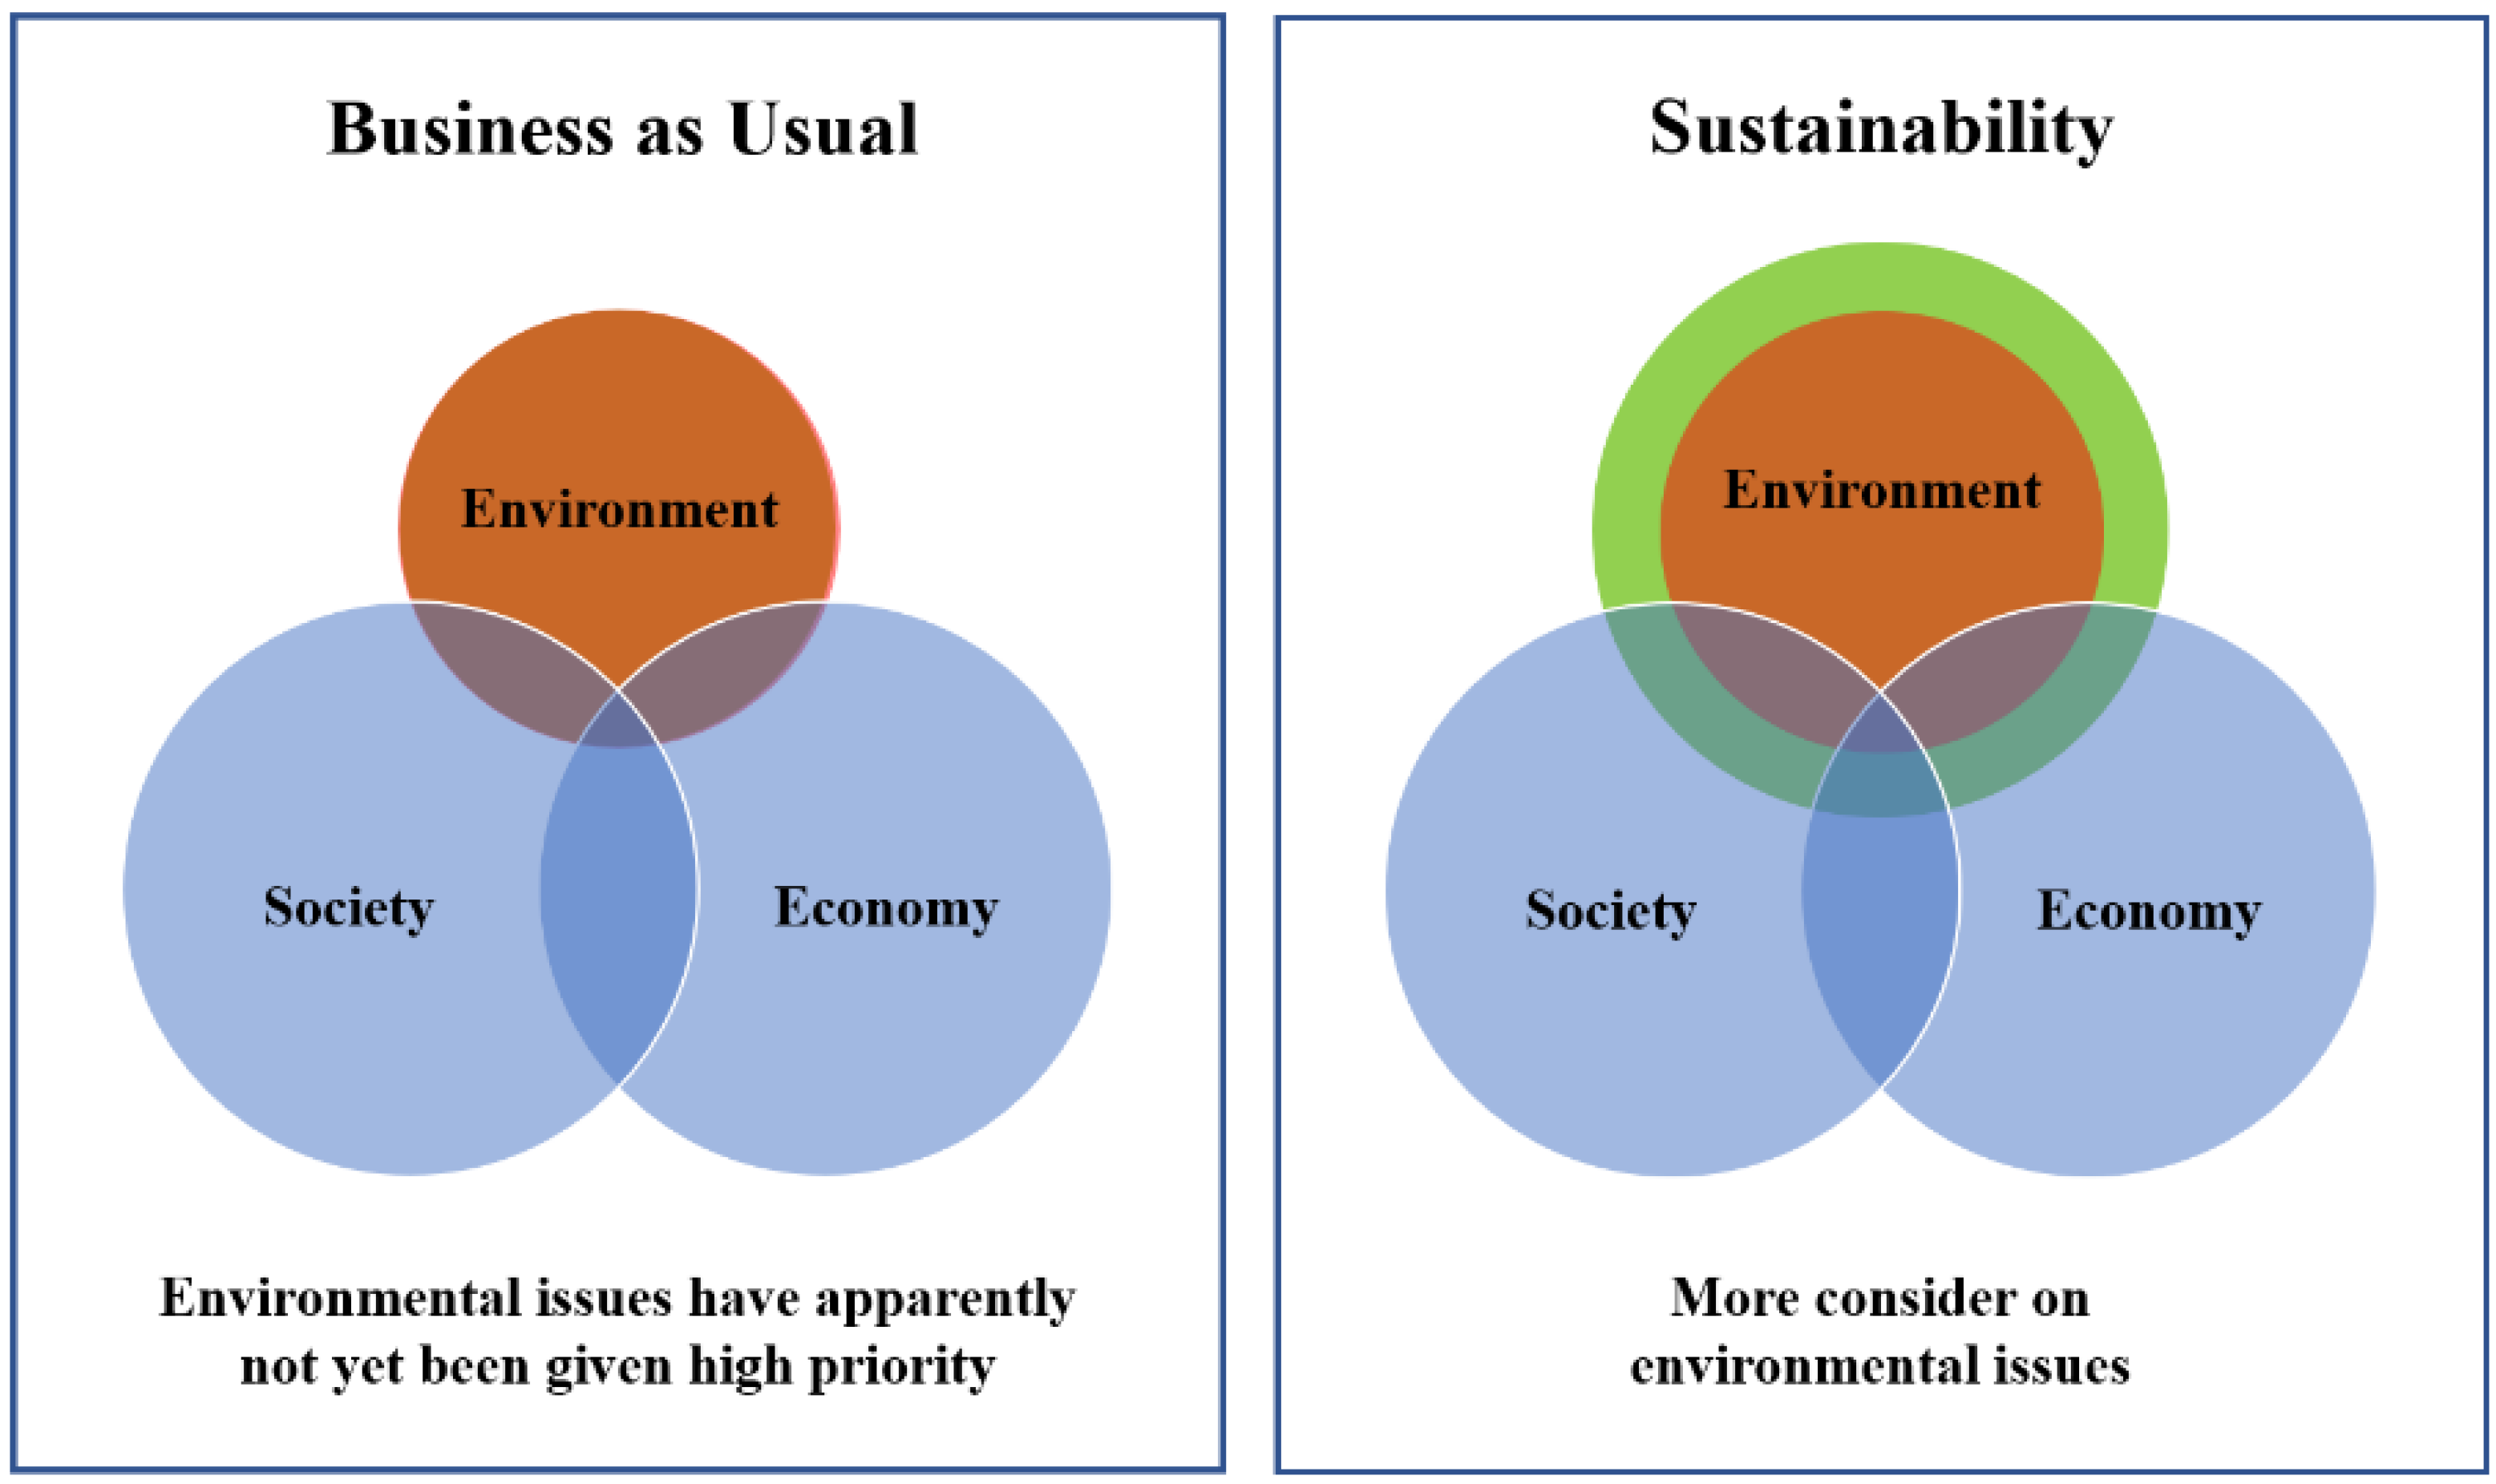
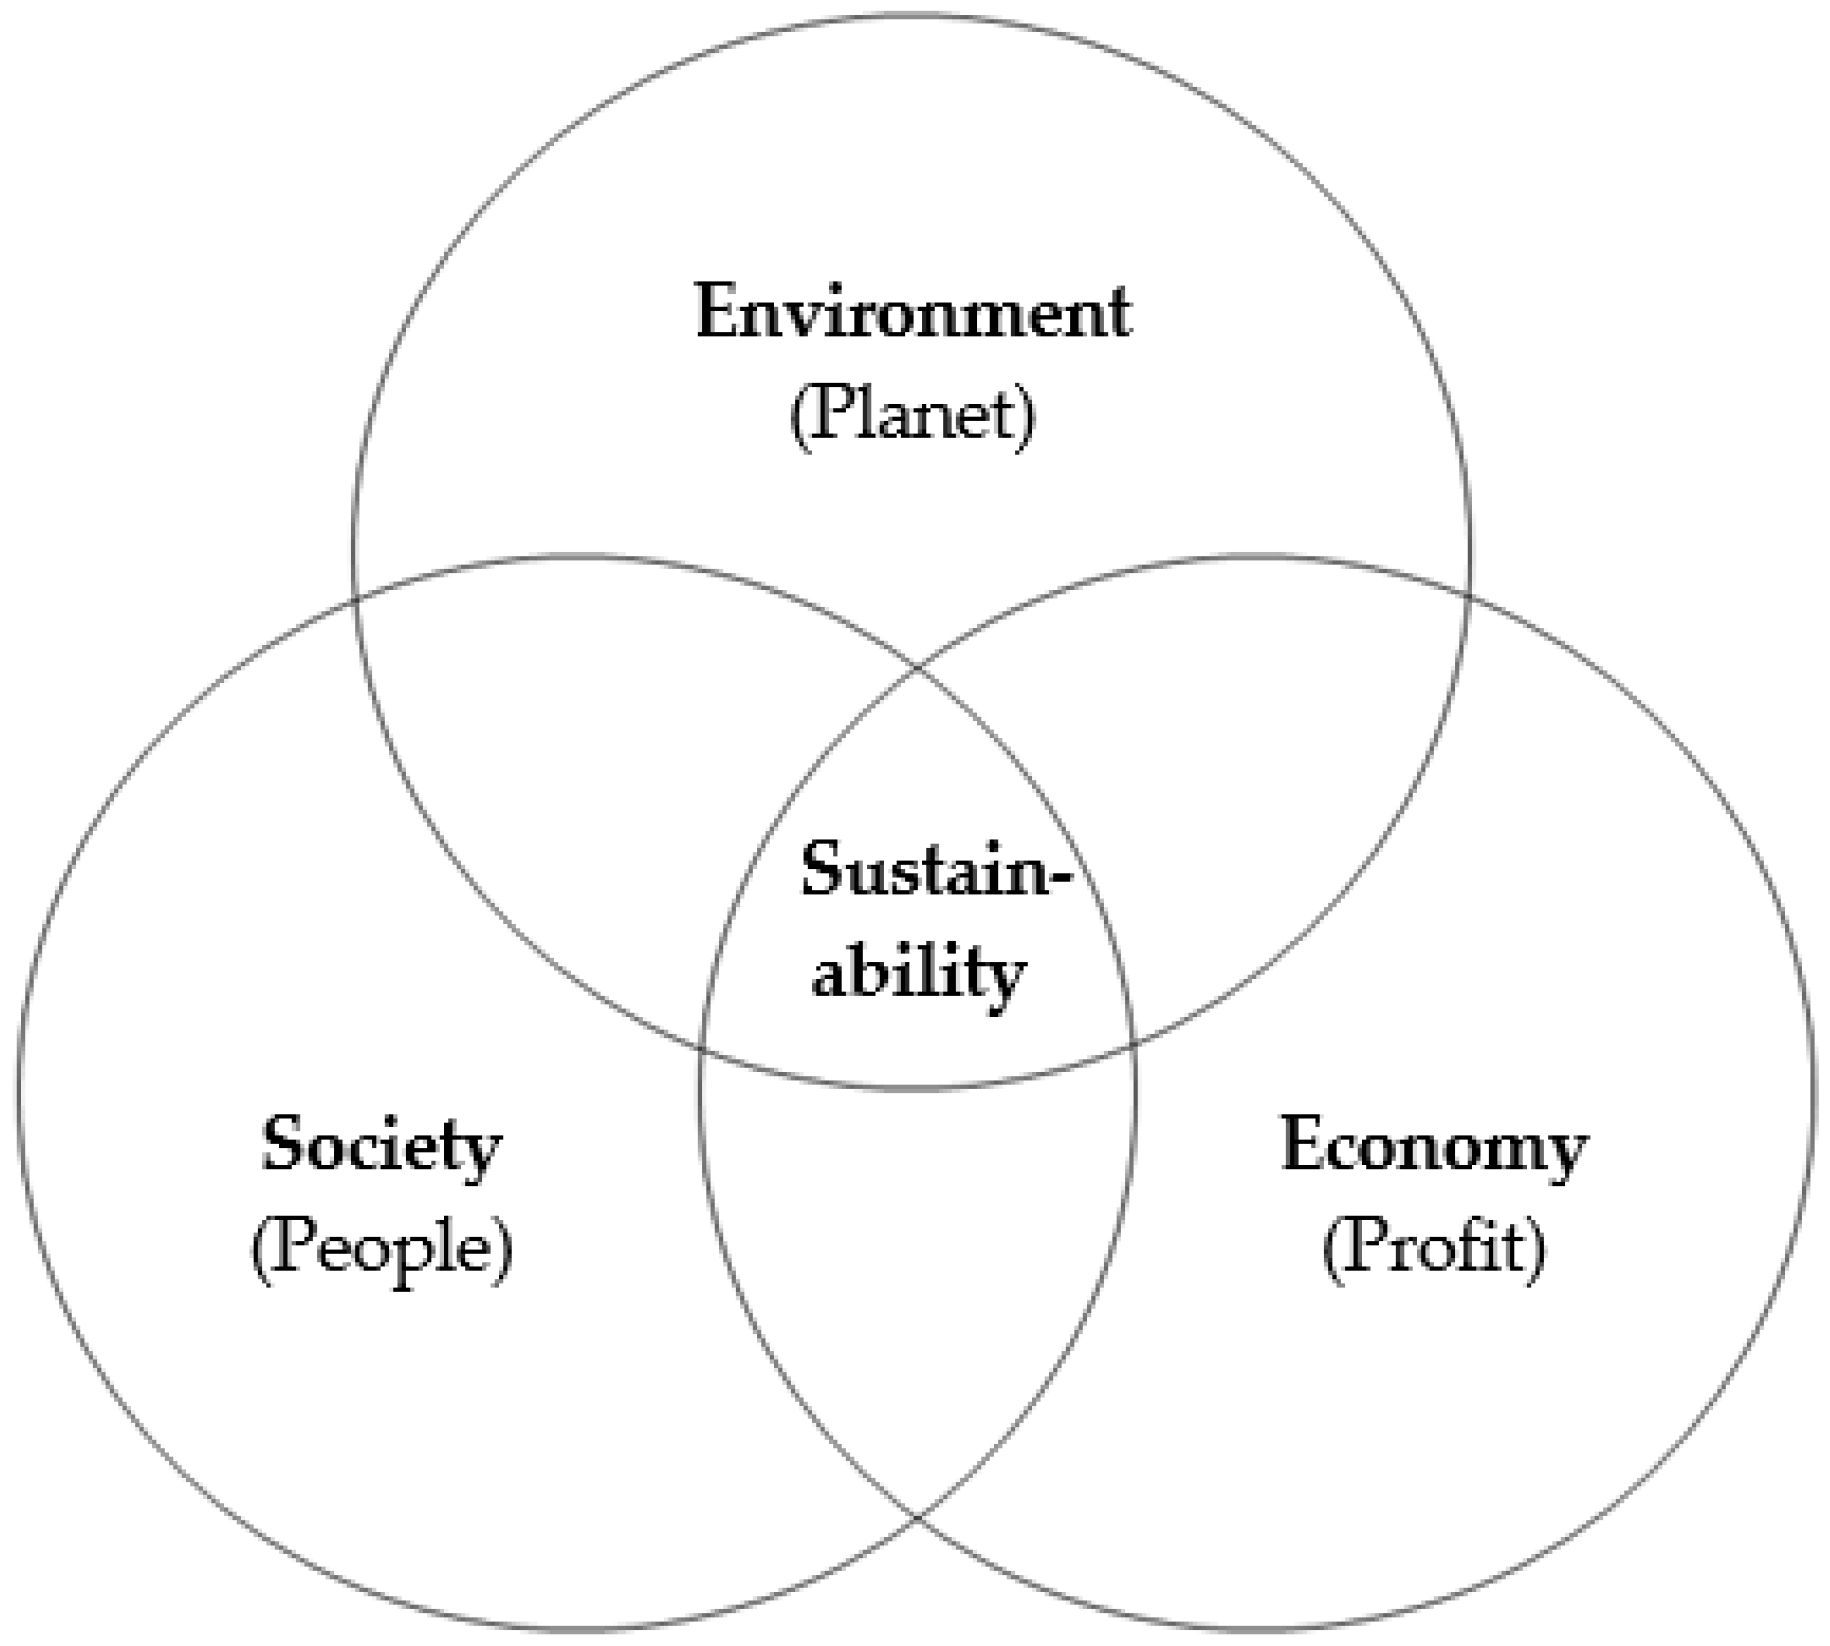
2.1. Background of Sustainability
2.2. Sustainability in Developing Countries
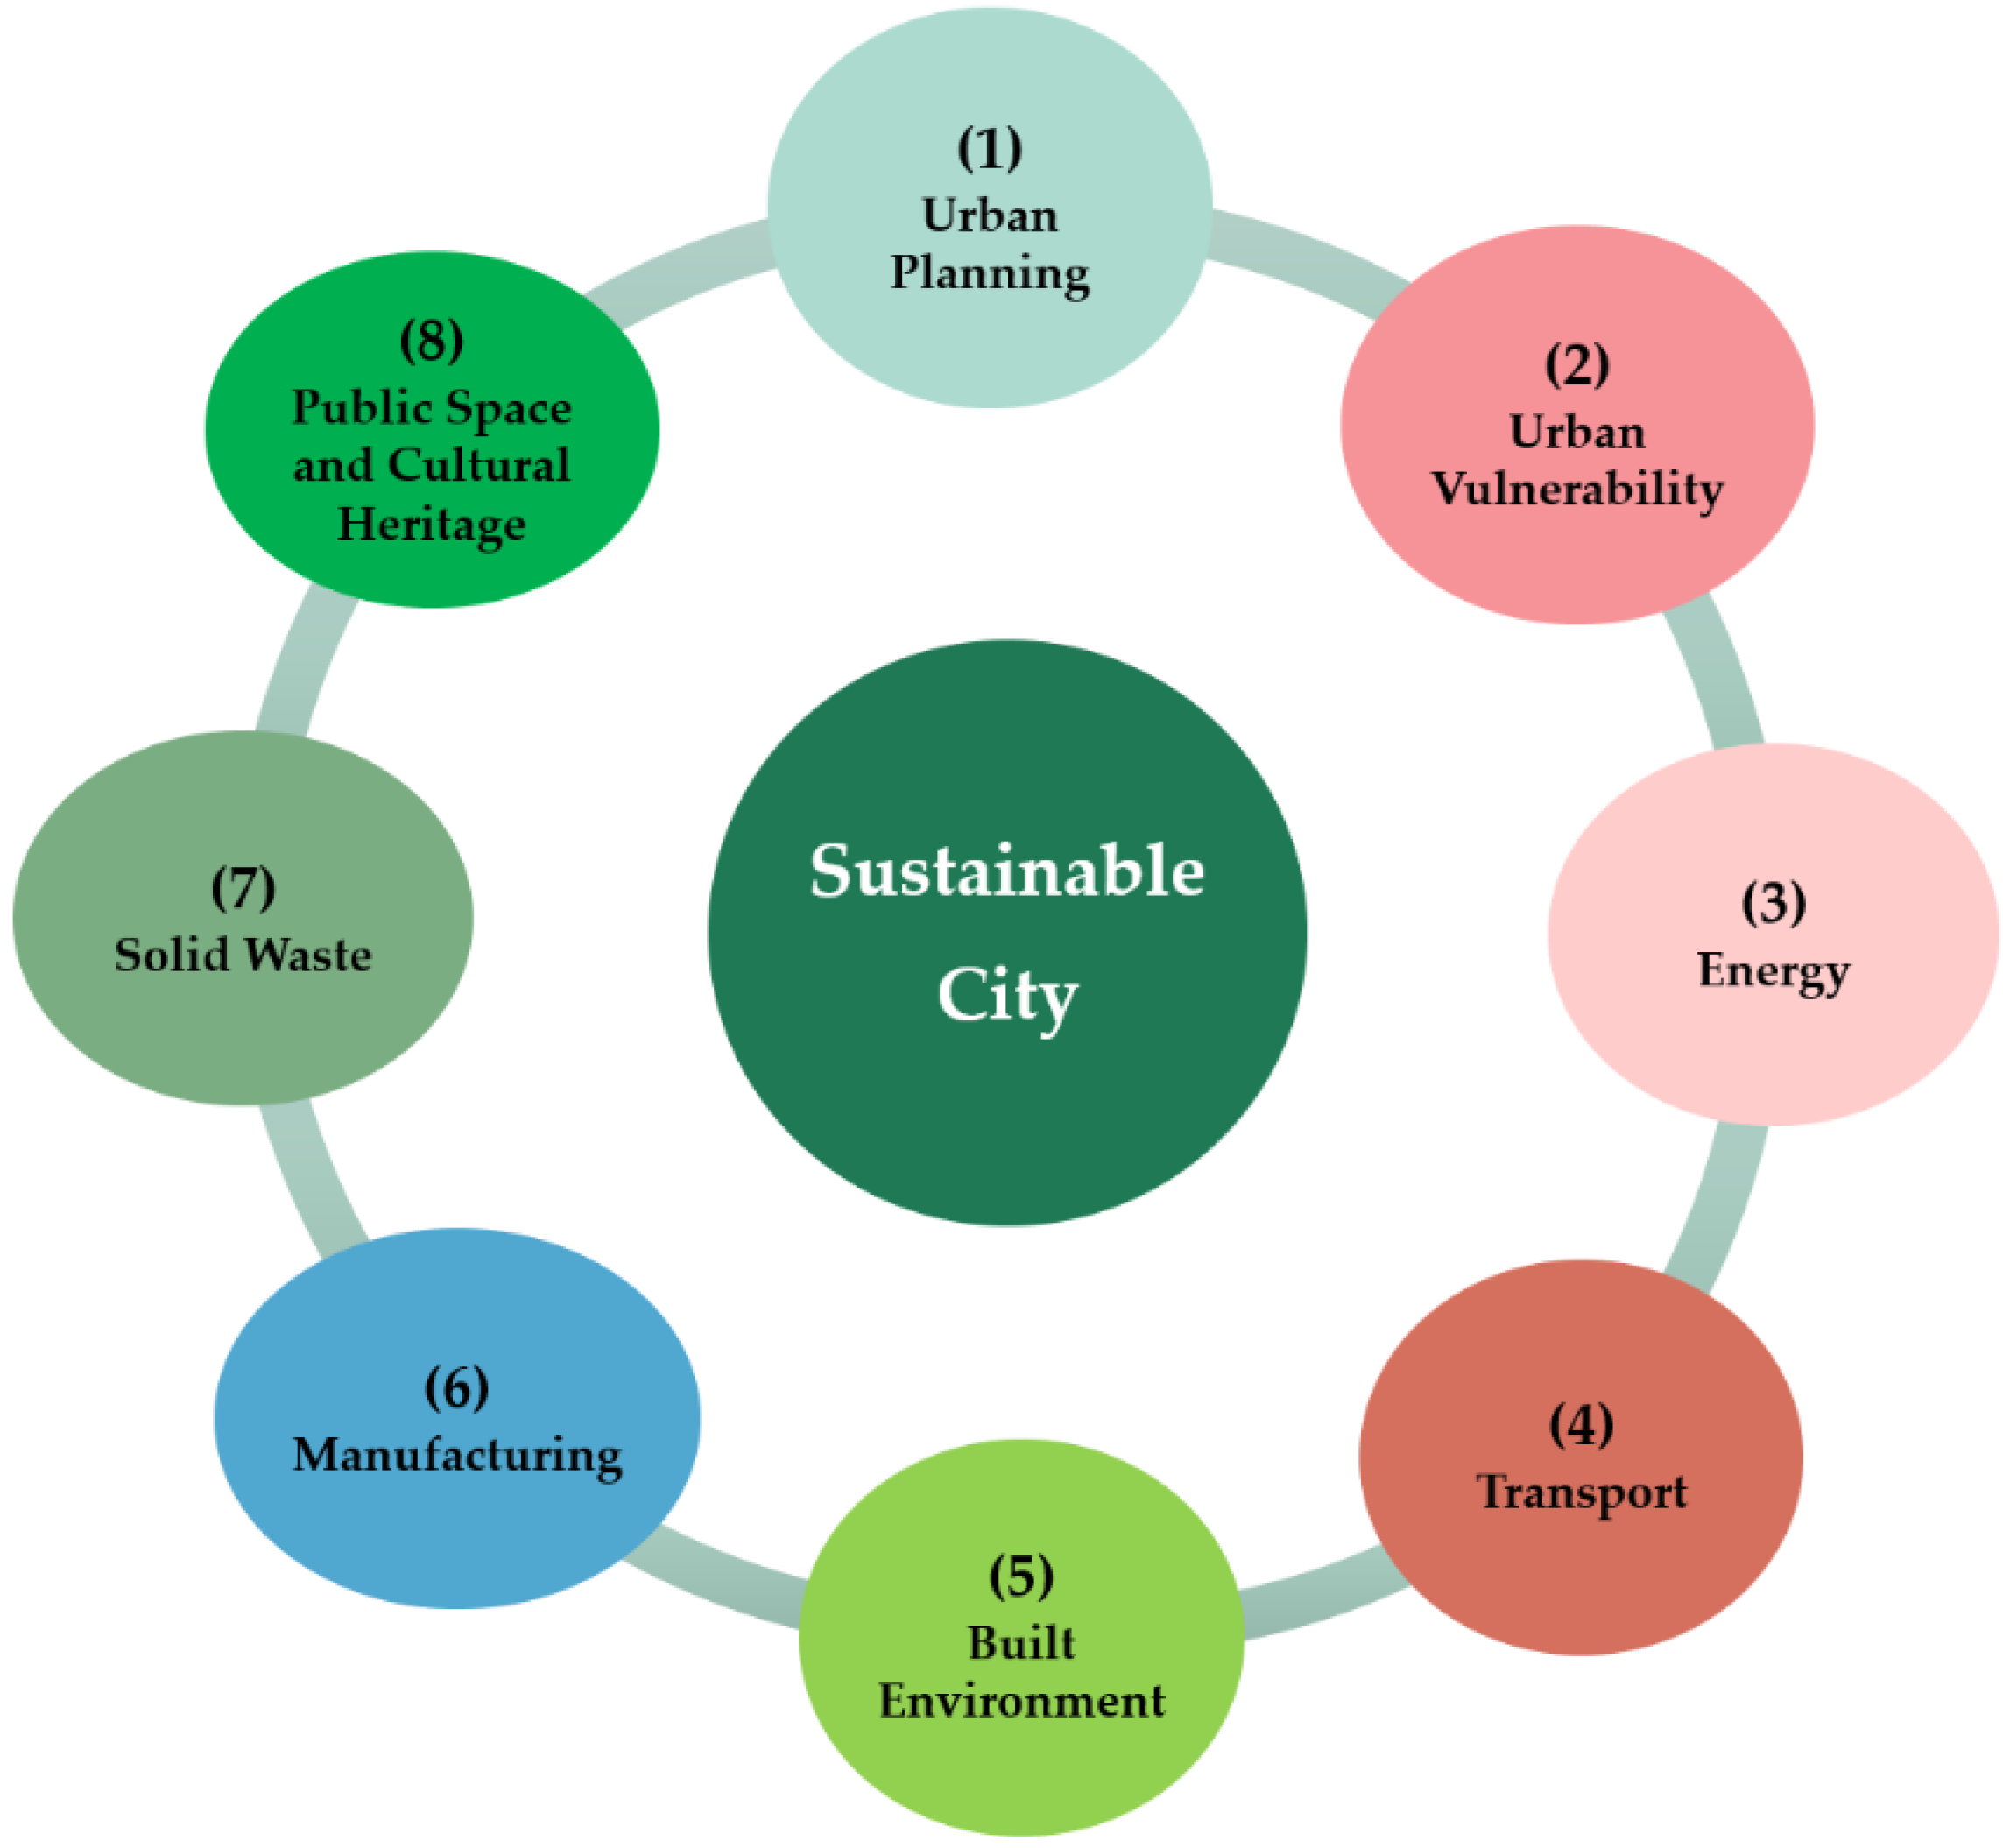
2.3. Sustainable City Definitions
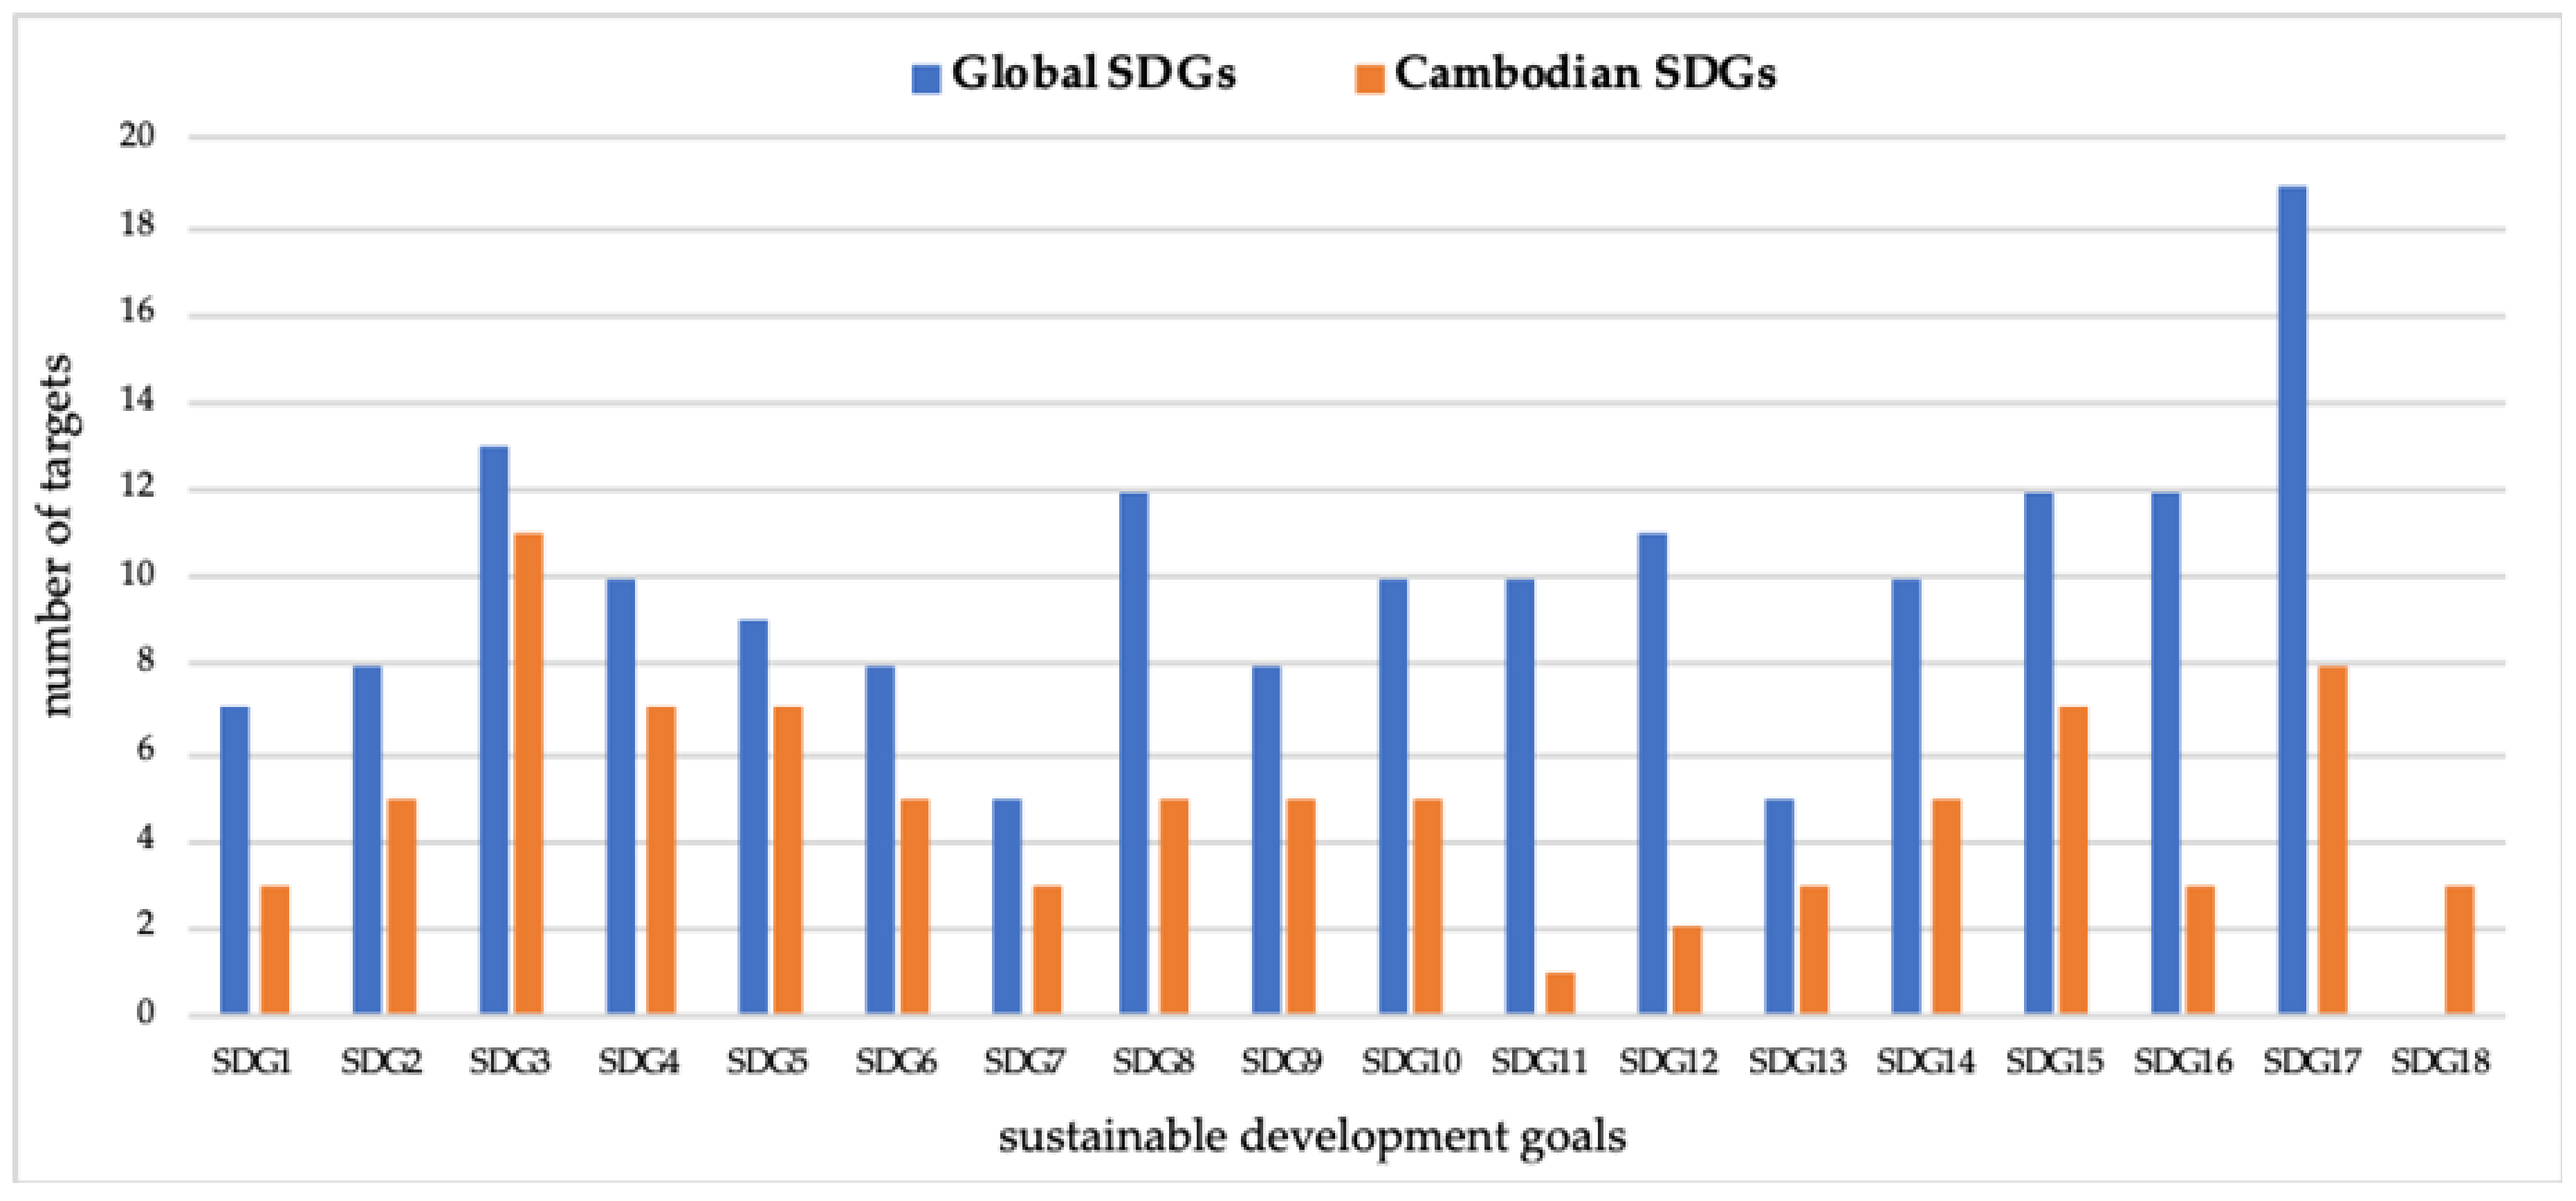
2.4. Global Sustainable City Goal, Targets and Indicators
2.5. Cambodian Sustainable City Goal, Target, and Indicators
2.6. Cambodian Clean and Green City Indicators
2.7. Sustainability Assessment of Cities
3. Materials and Methods
3.1. Urban Sustainability Index
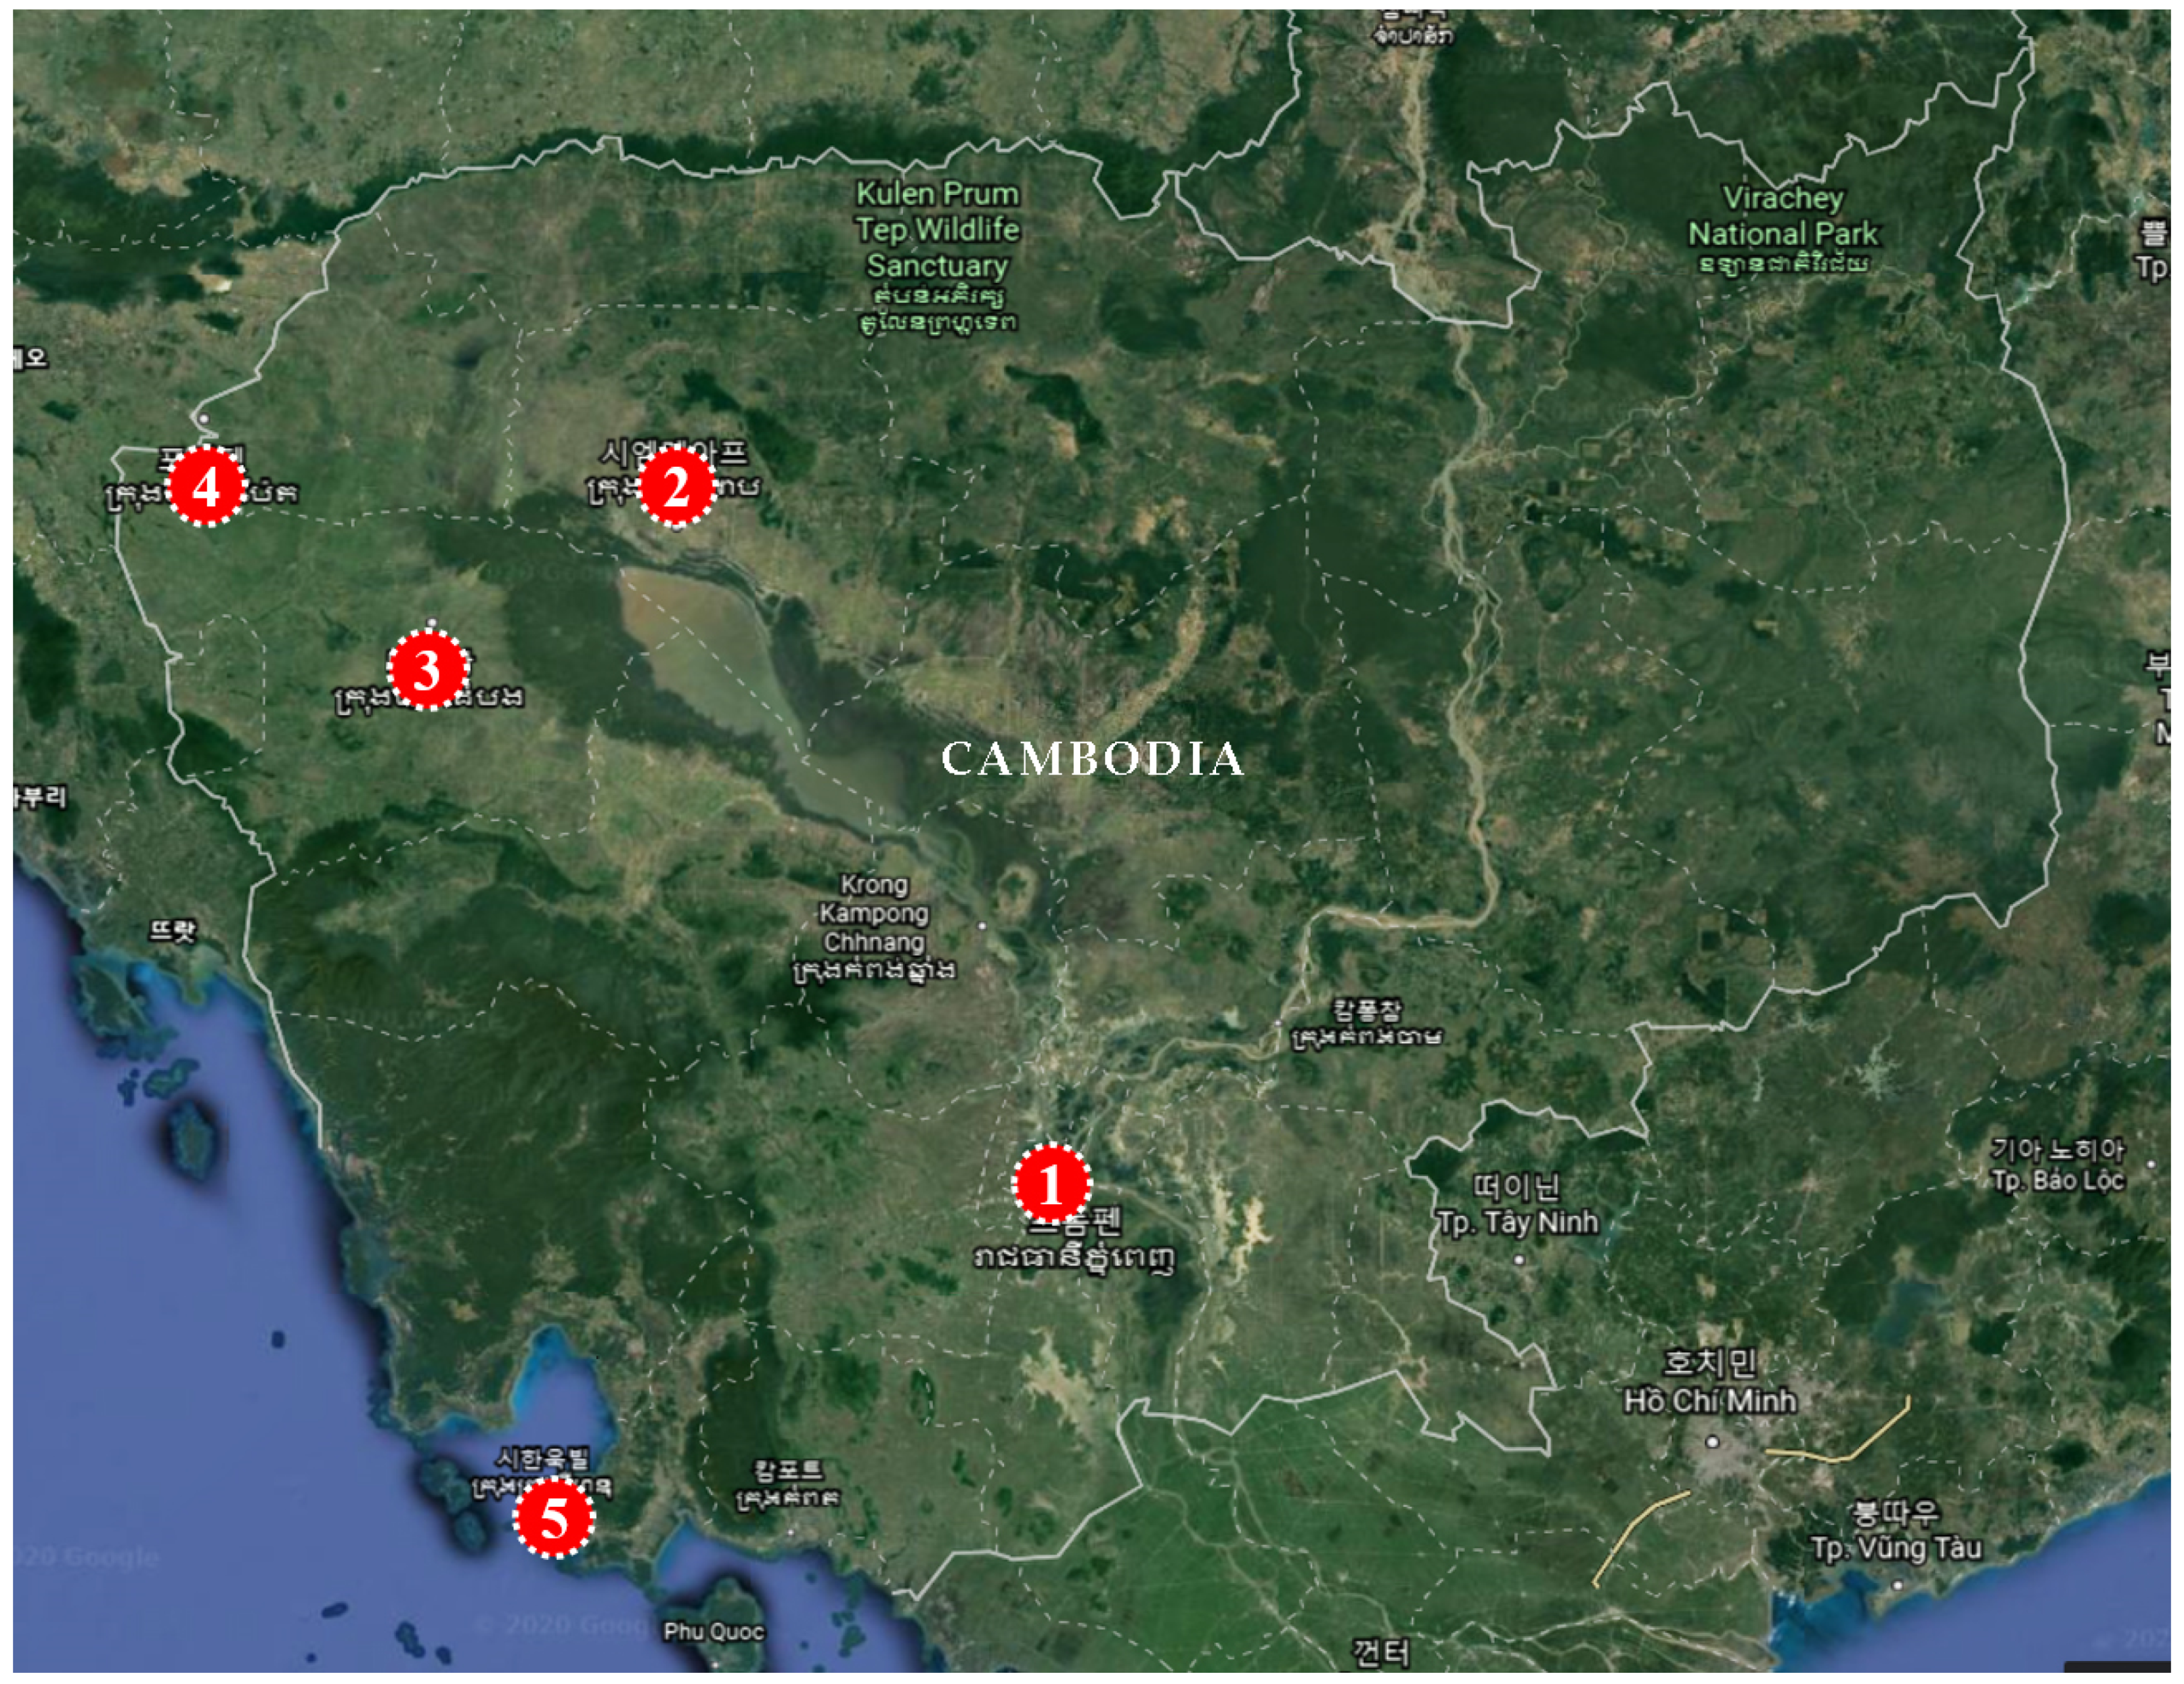
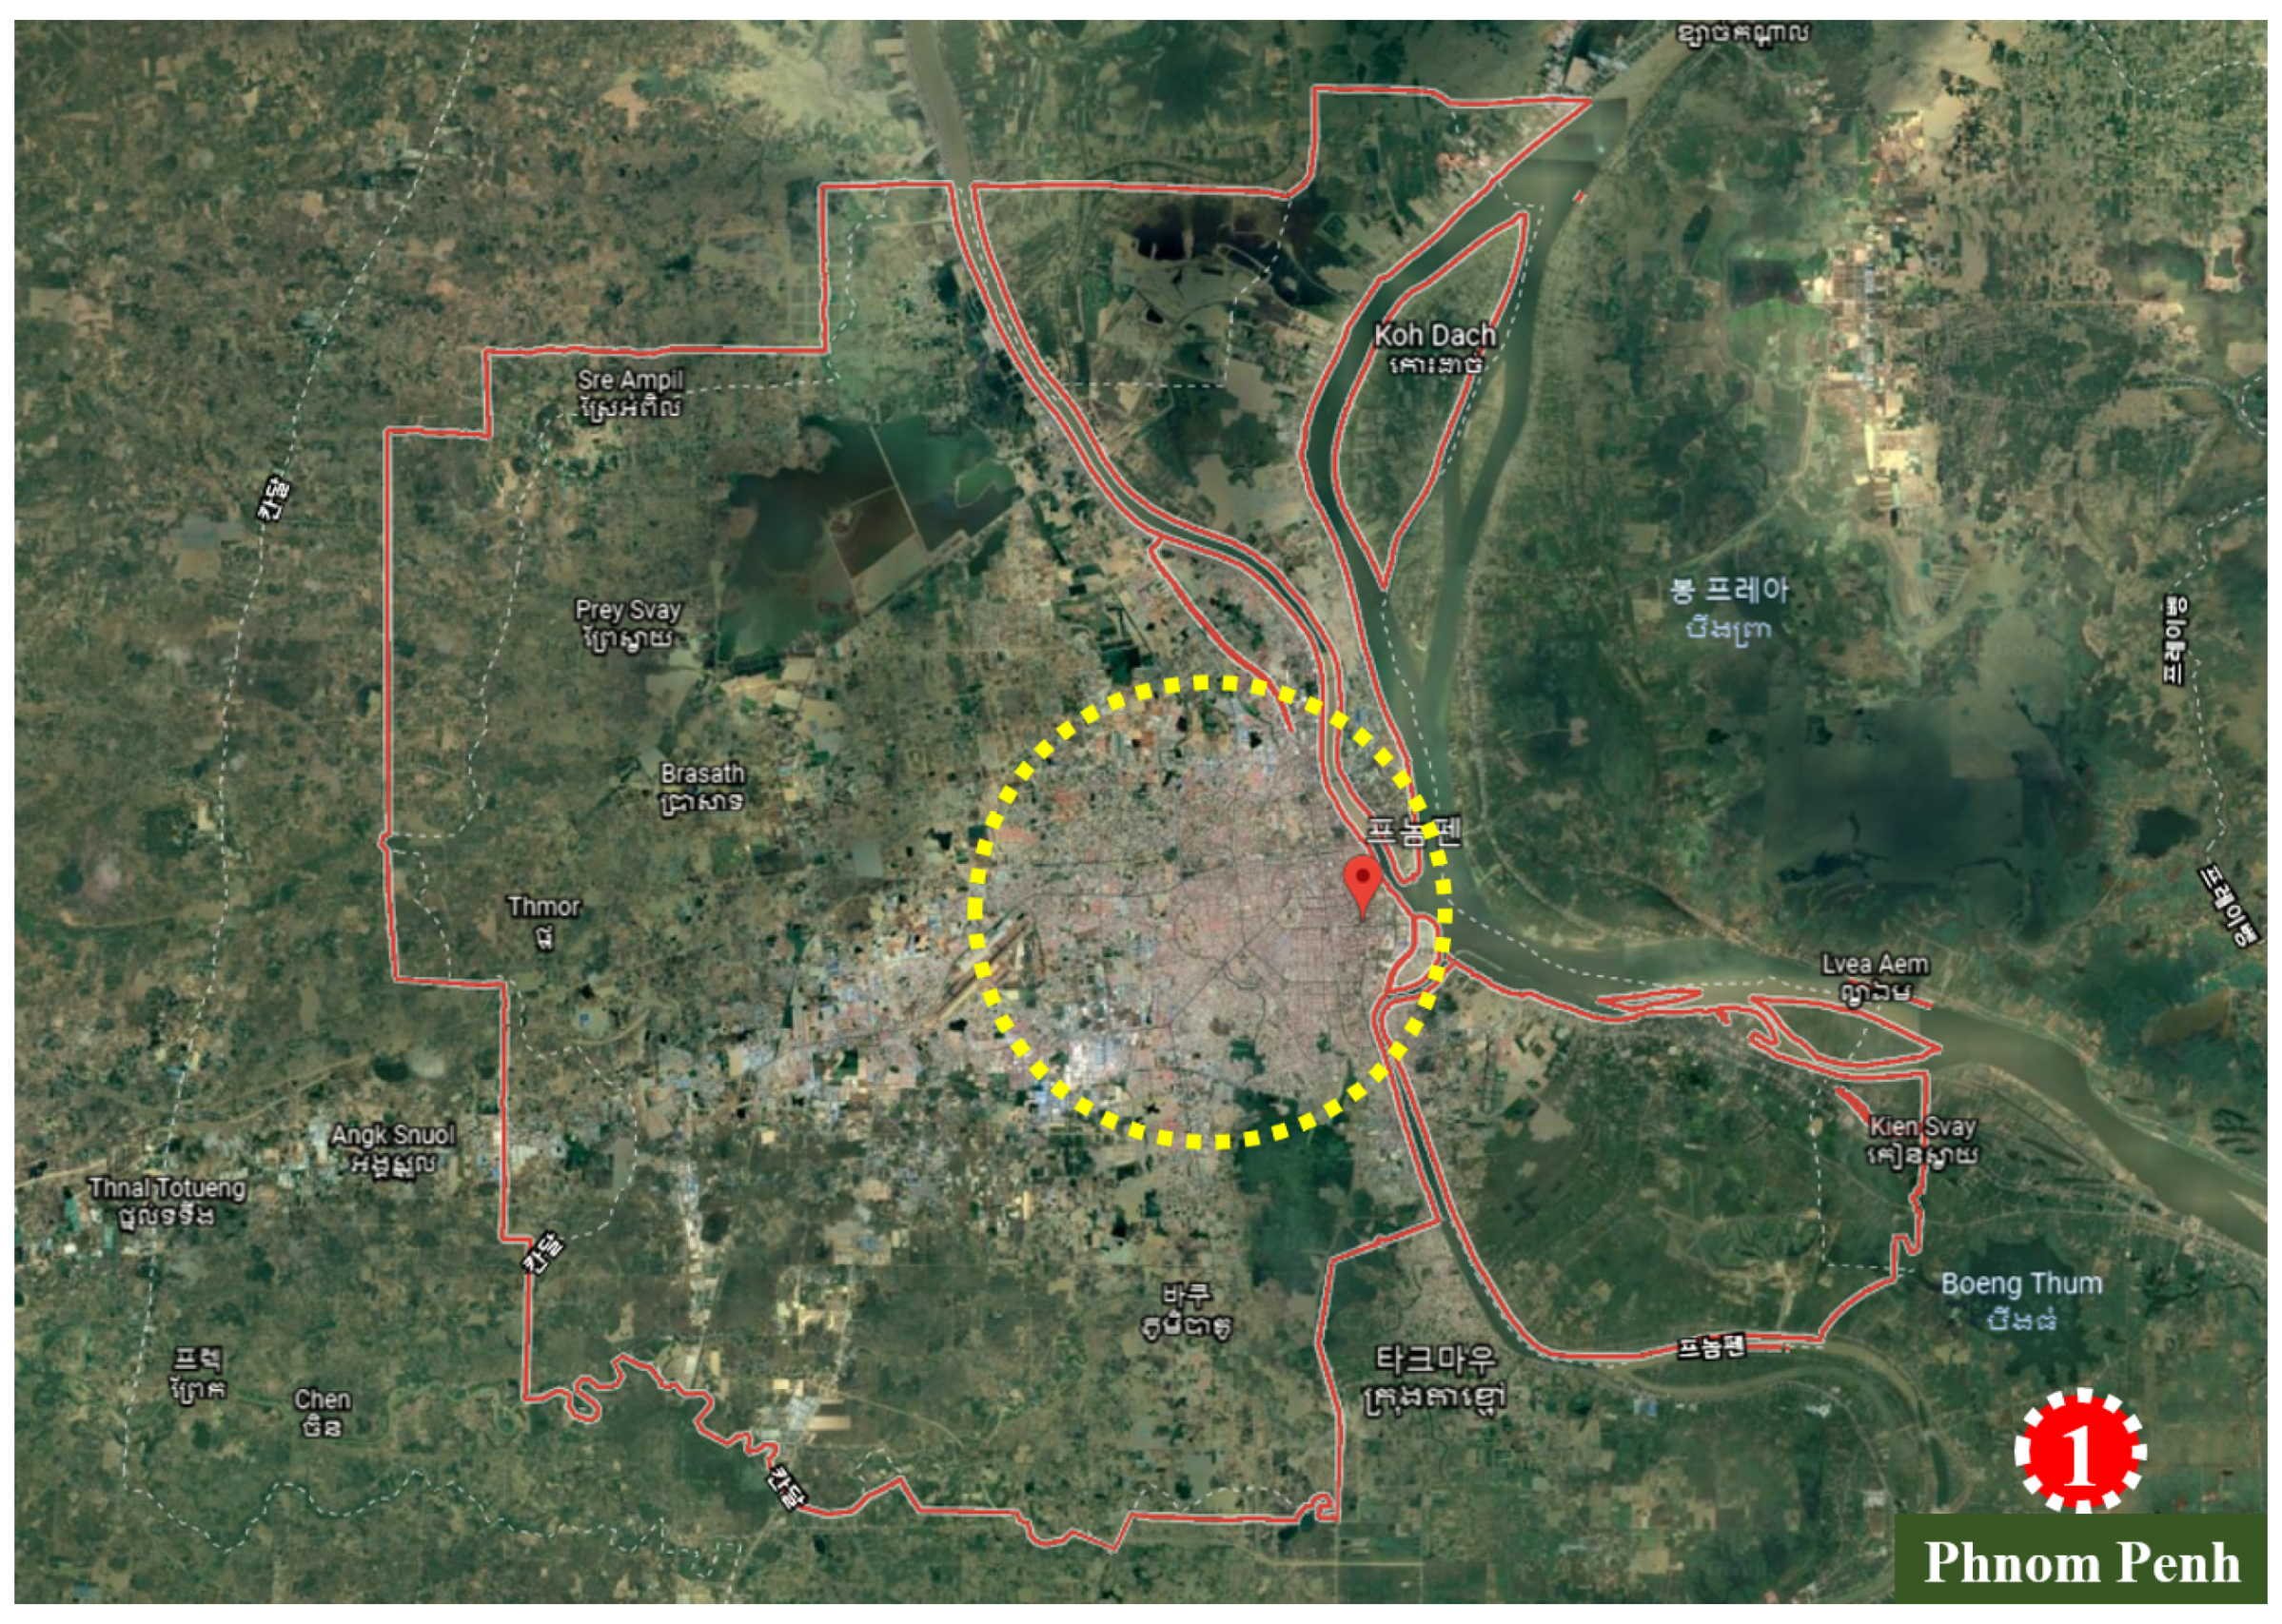
3.2. City Selection and Locations
3.3. Data Sources and Validation
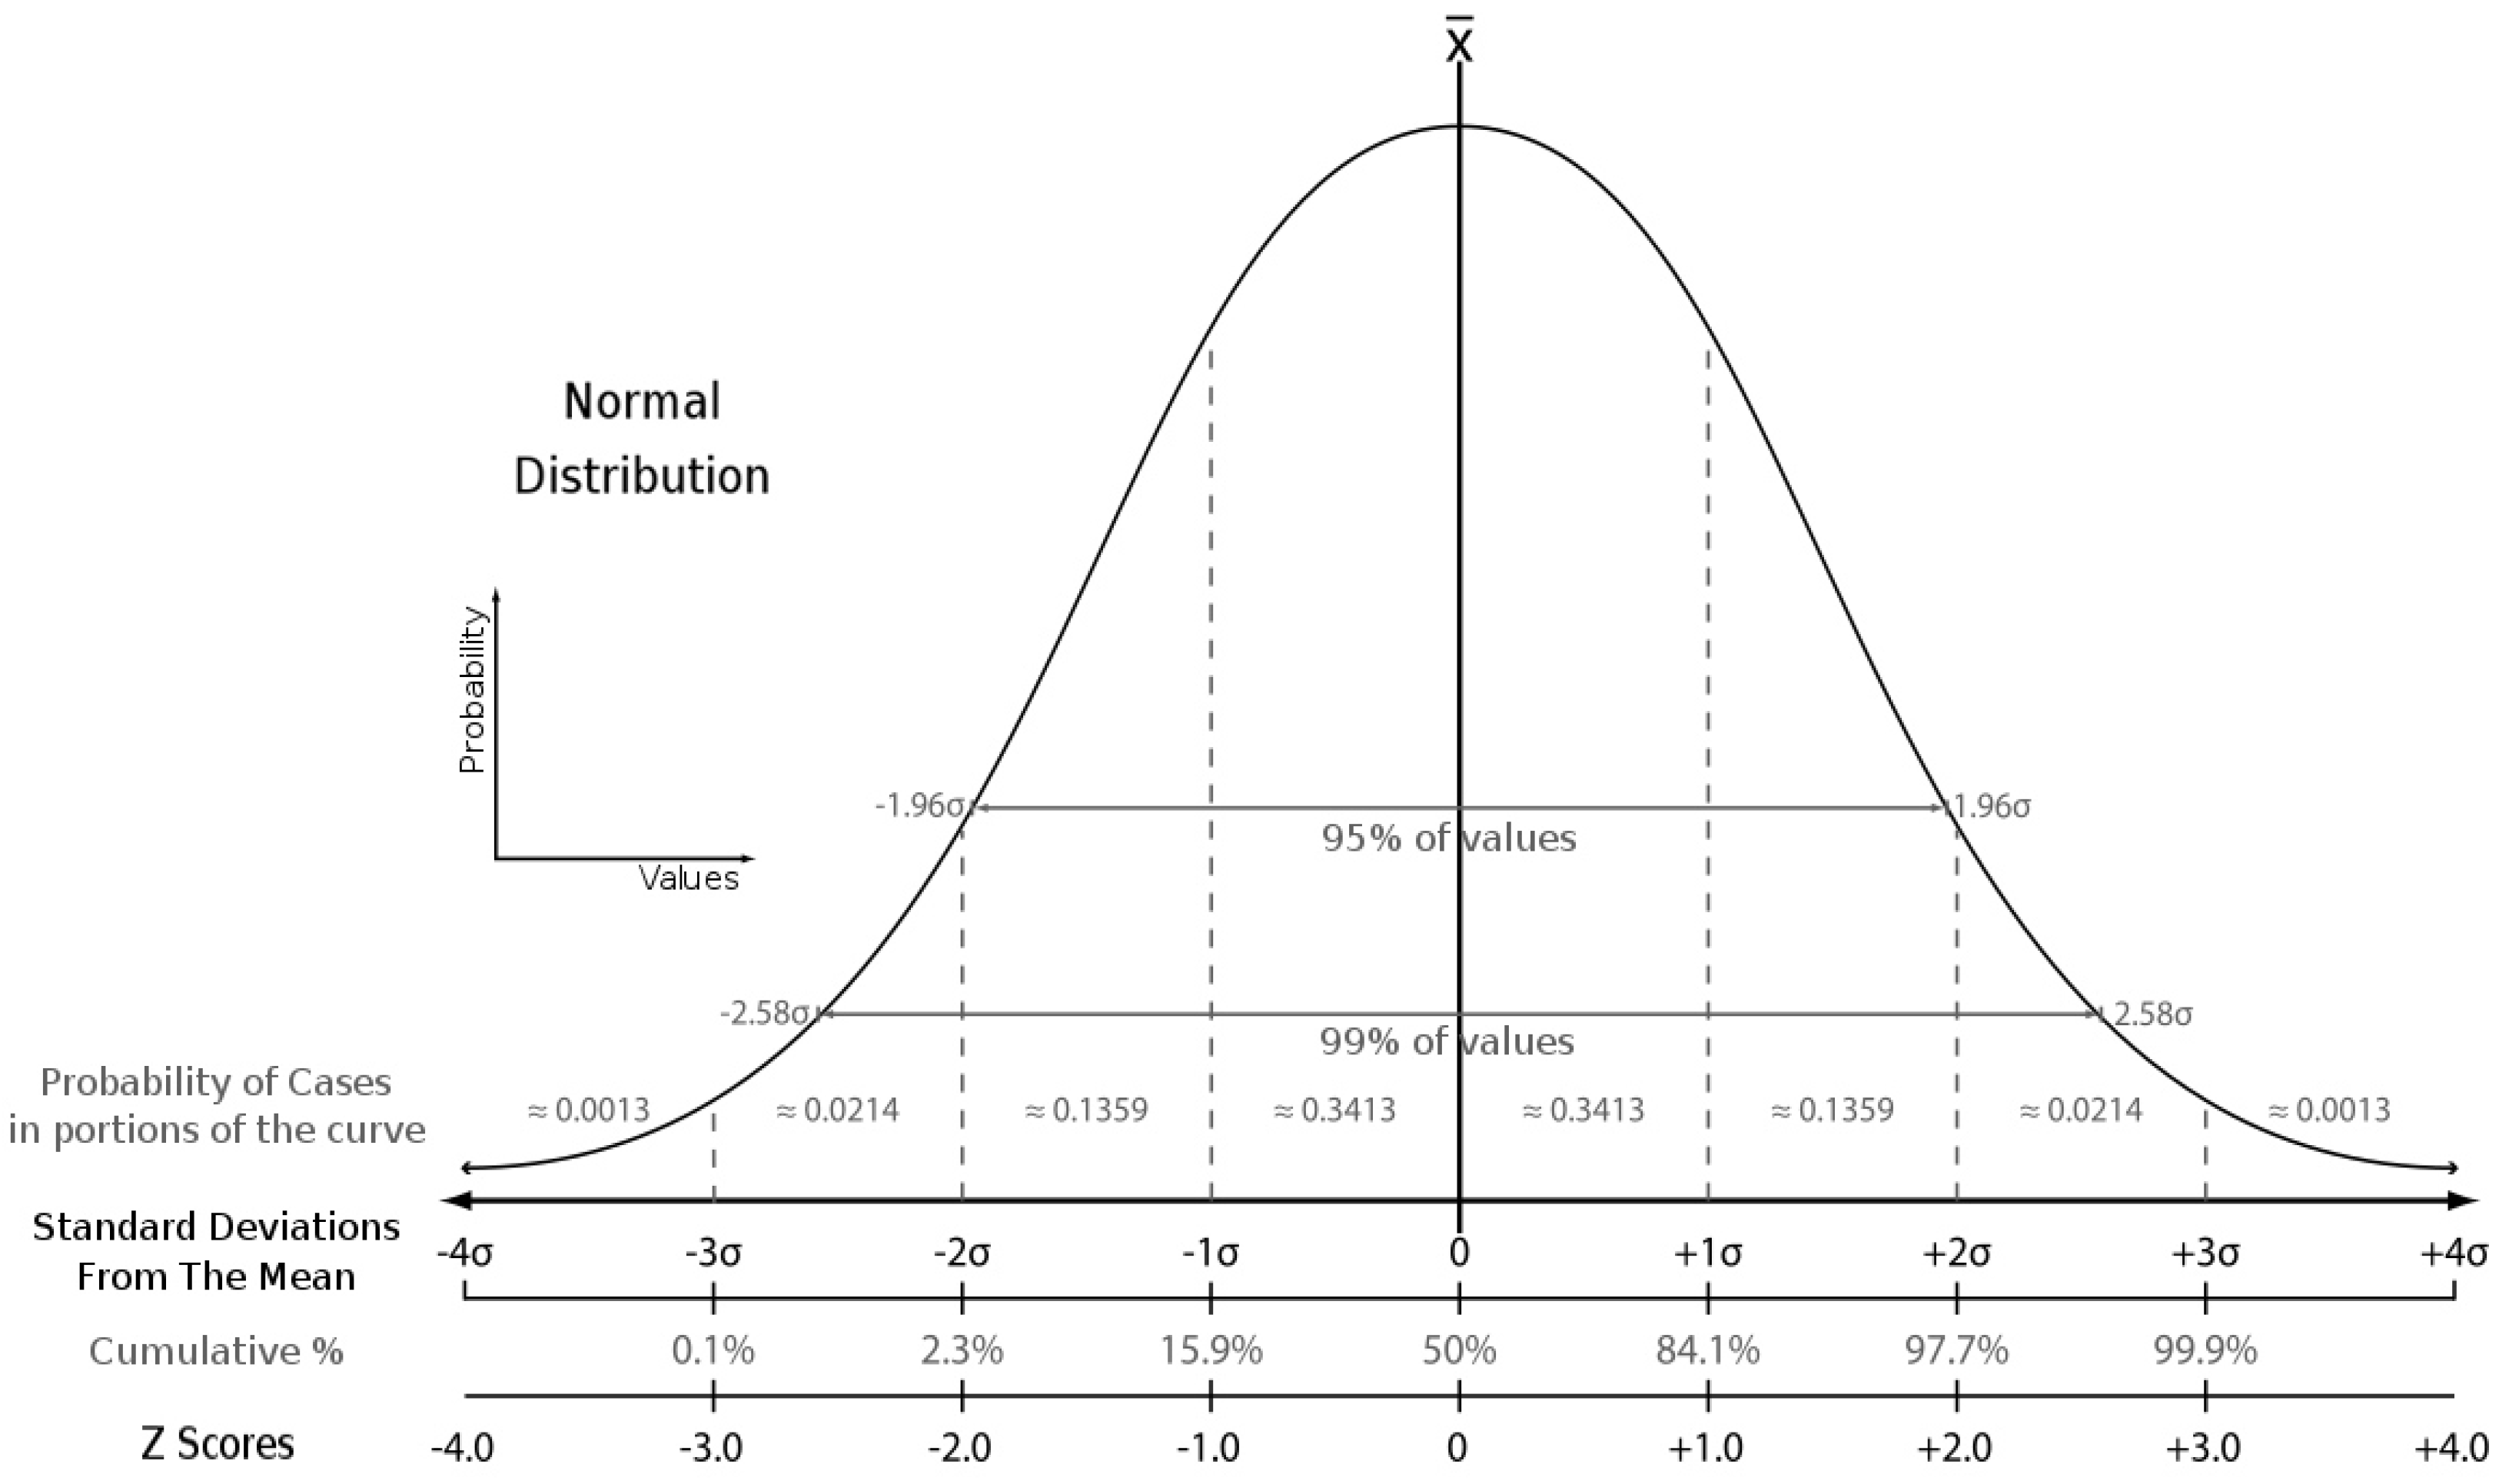
3.4. Standard Scores for Comparative Assessment
4. Results
4.1. Environmental Dimension
4.2. Social Dimension
4.3. Economic Dimension
4.4. Weighting Scores of Indicators
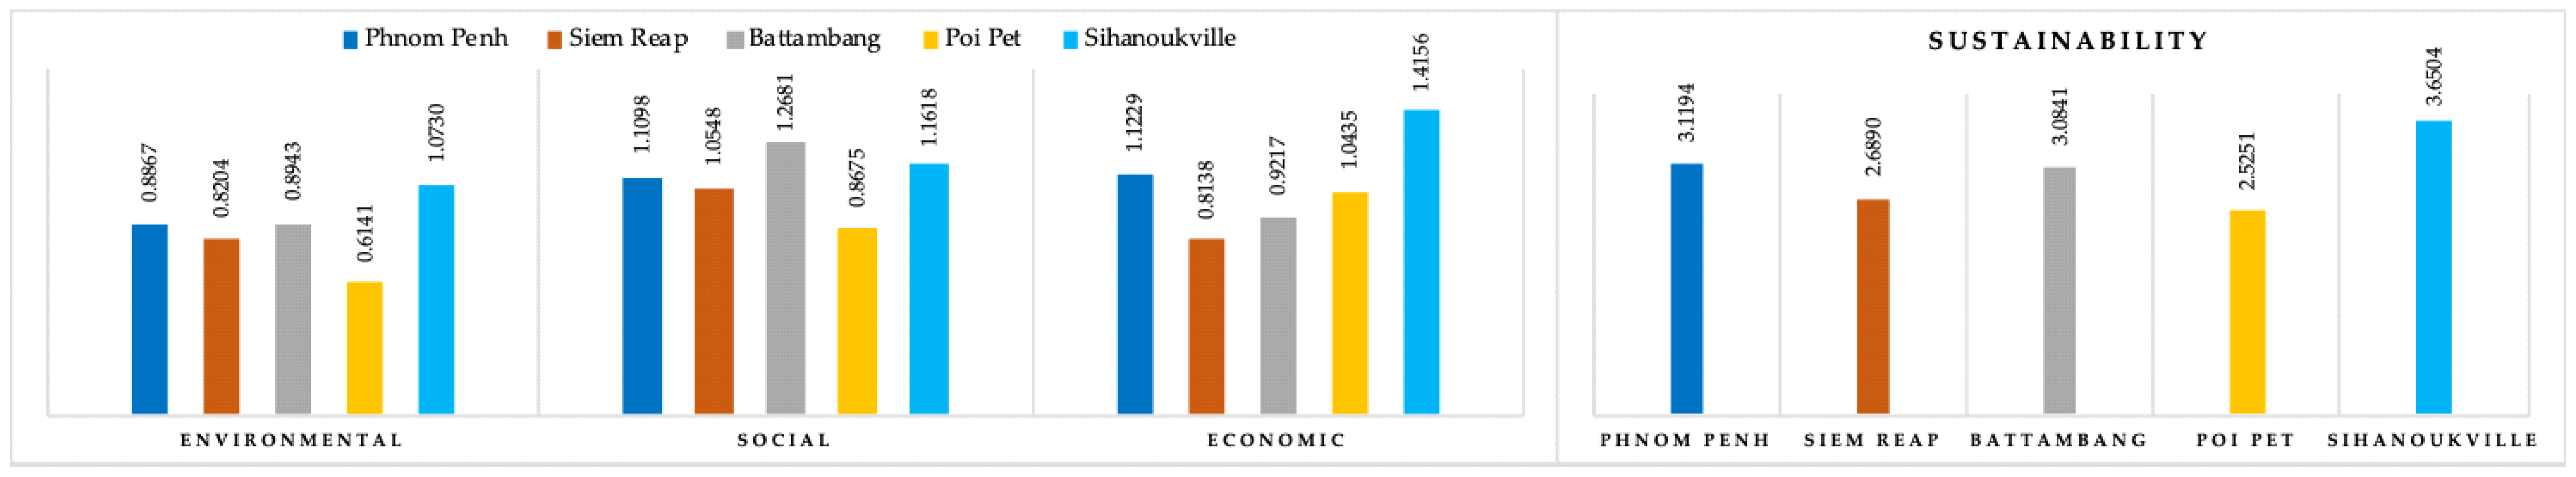
4.5. Standard of Urban Sustainability in Cambodia
5. Discussion and Implications
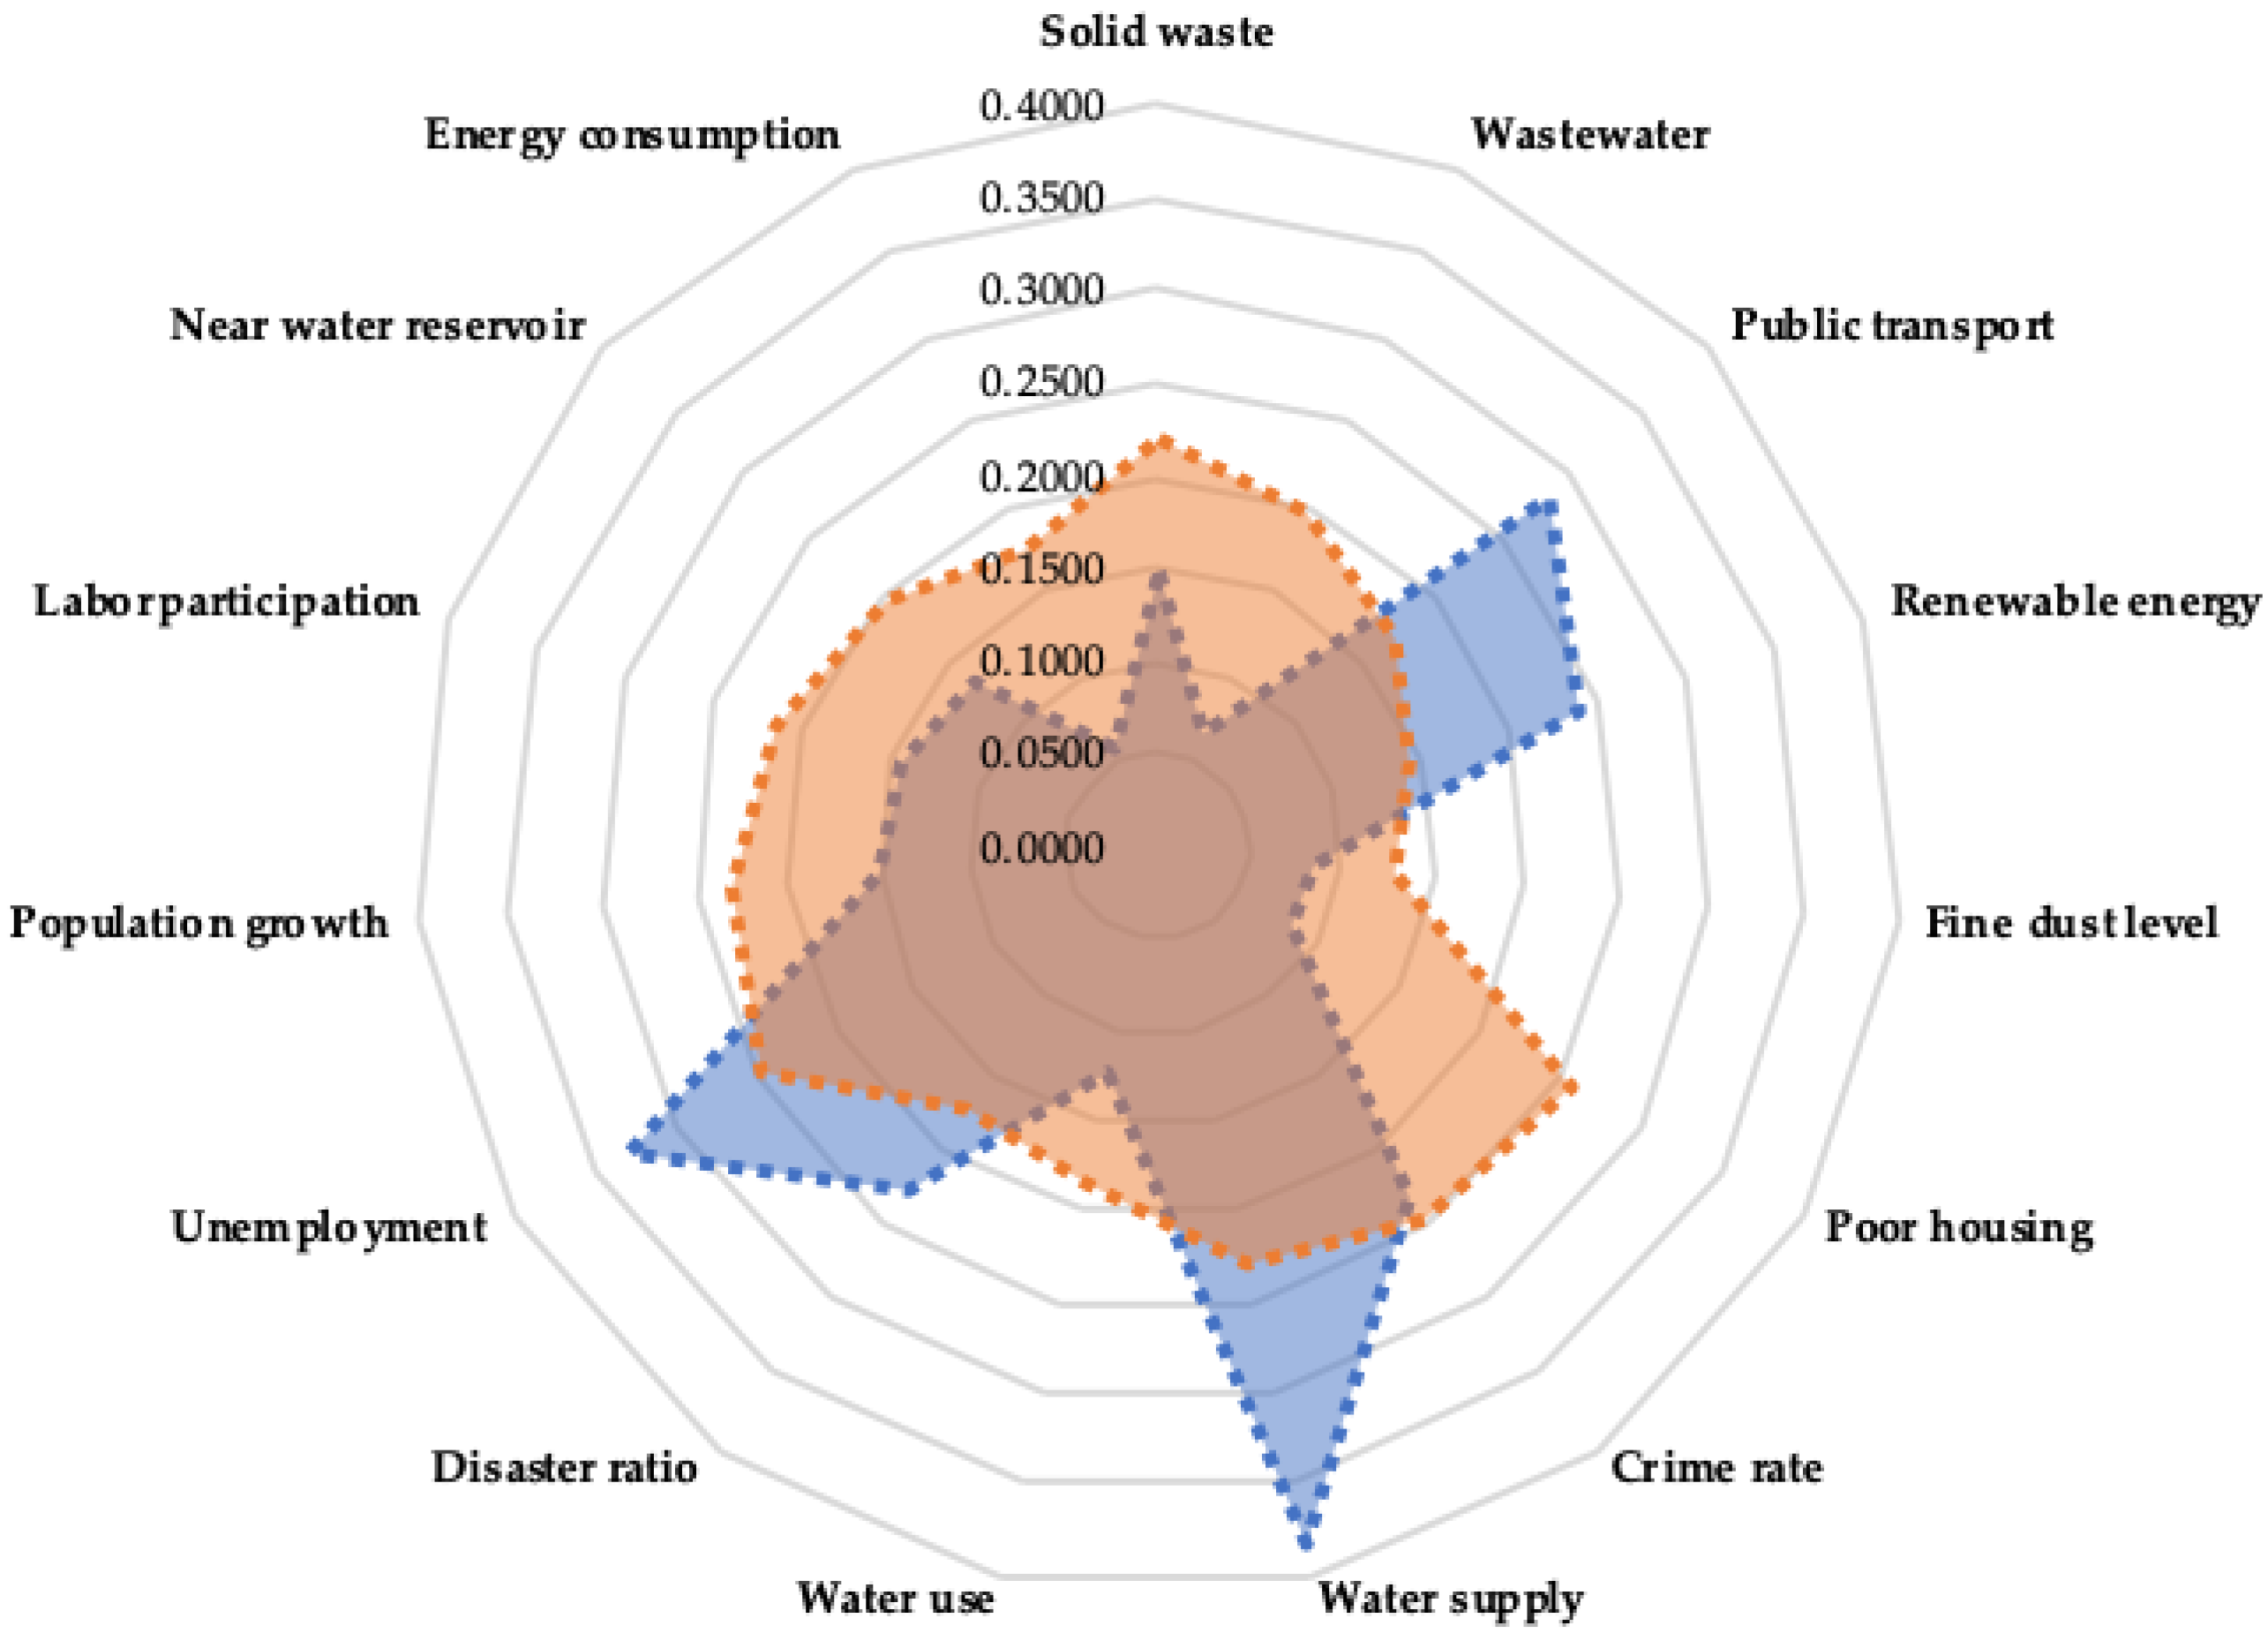
5.1. Sustainability of Phnom Penh
5.2. Sustainability of Siem Reap
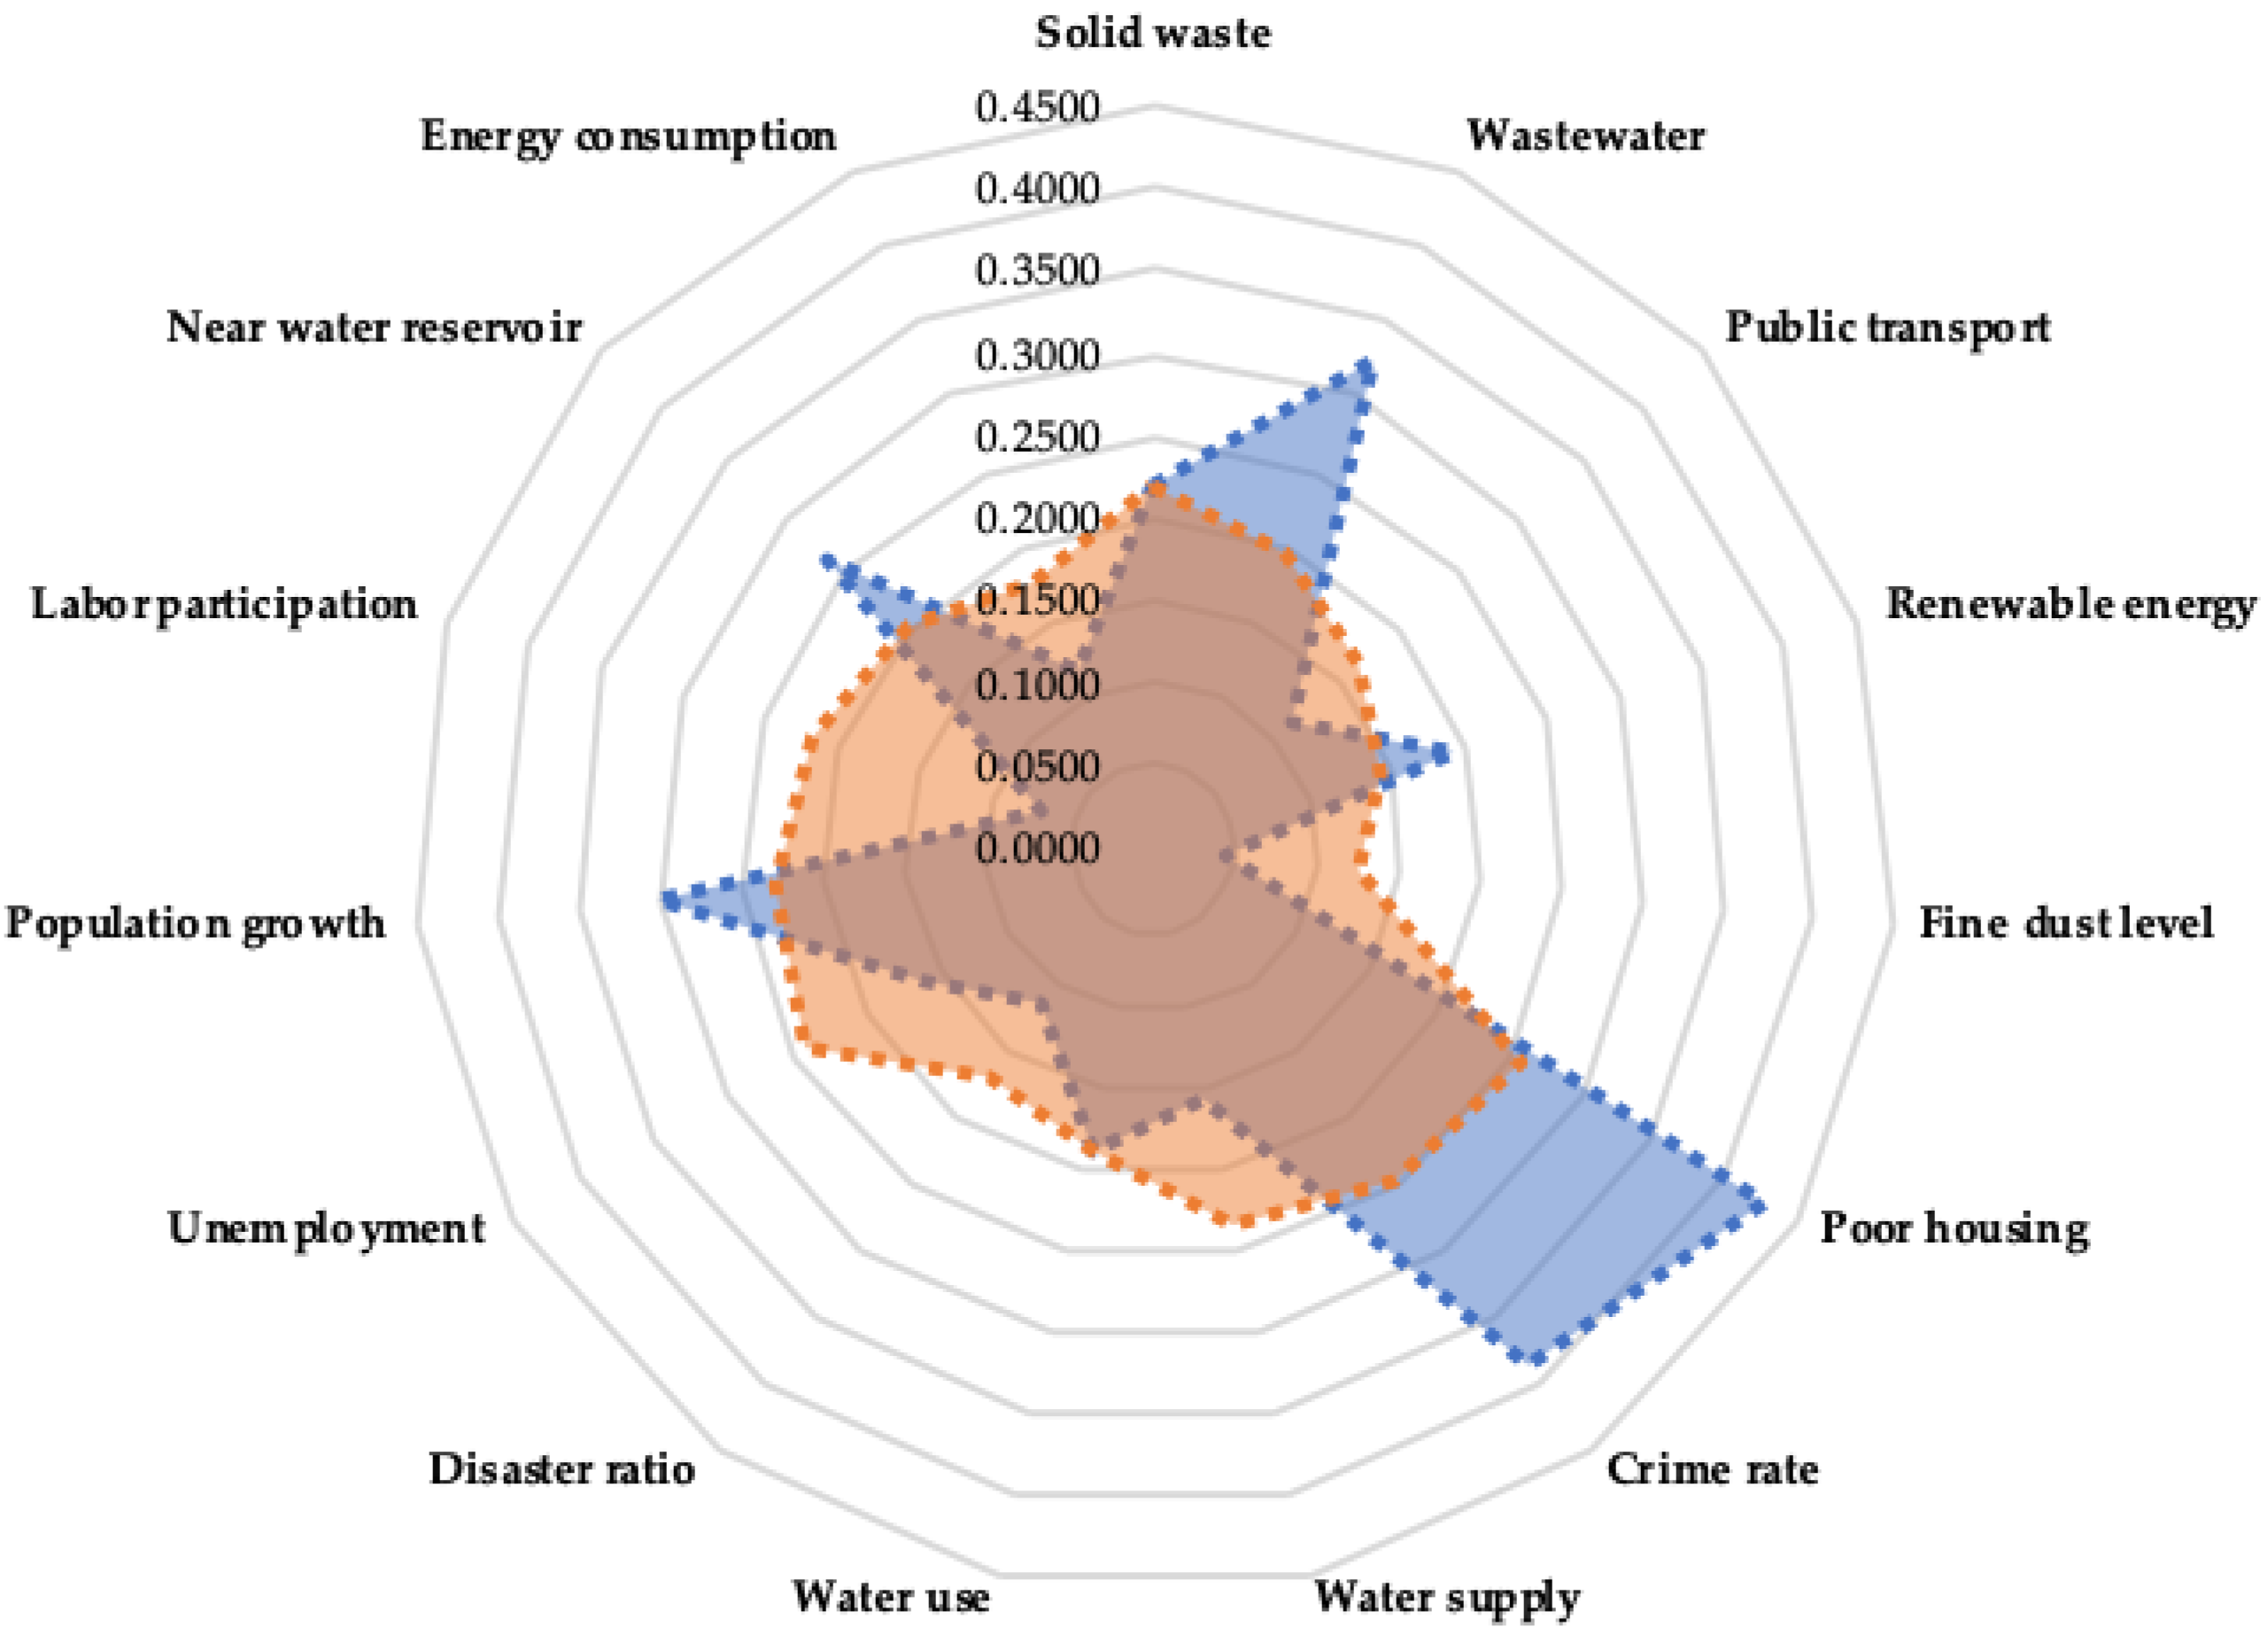
5.3. Sustainability of Battambang
5.4. Sustainability of Poi Pet
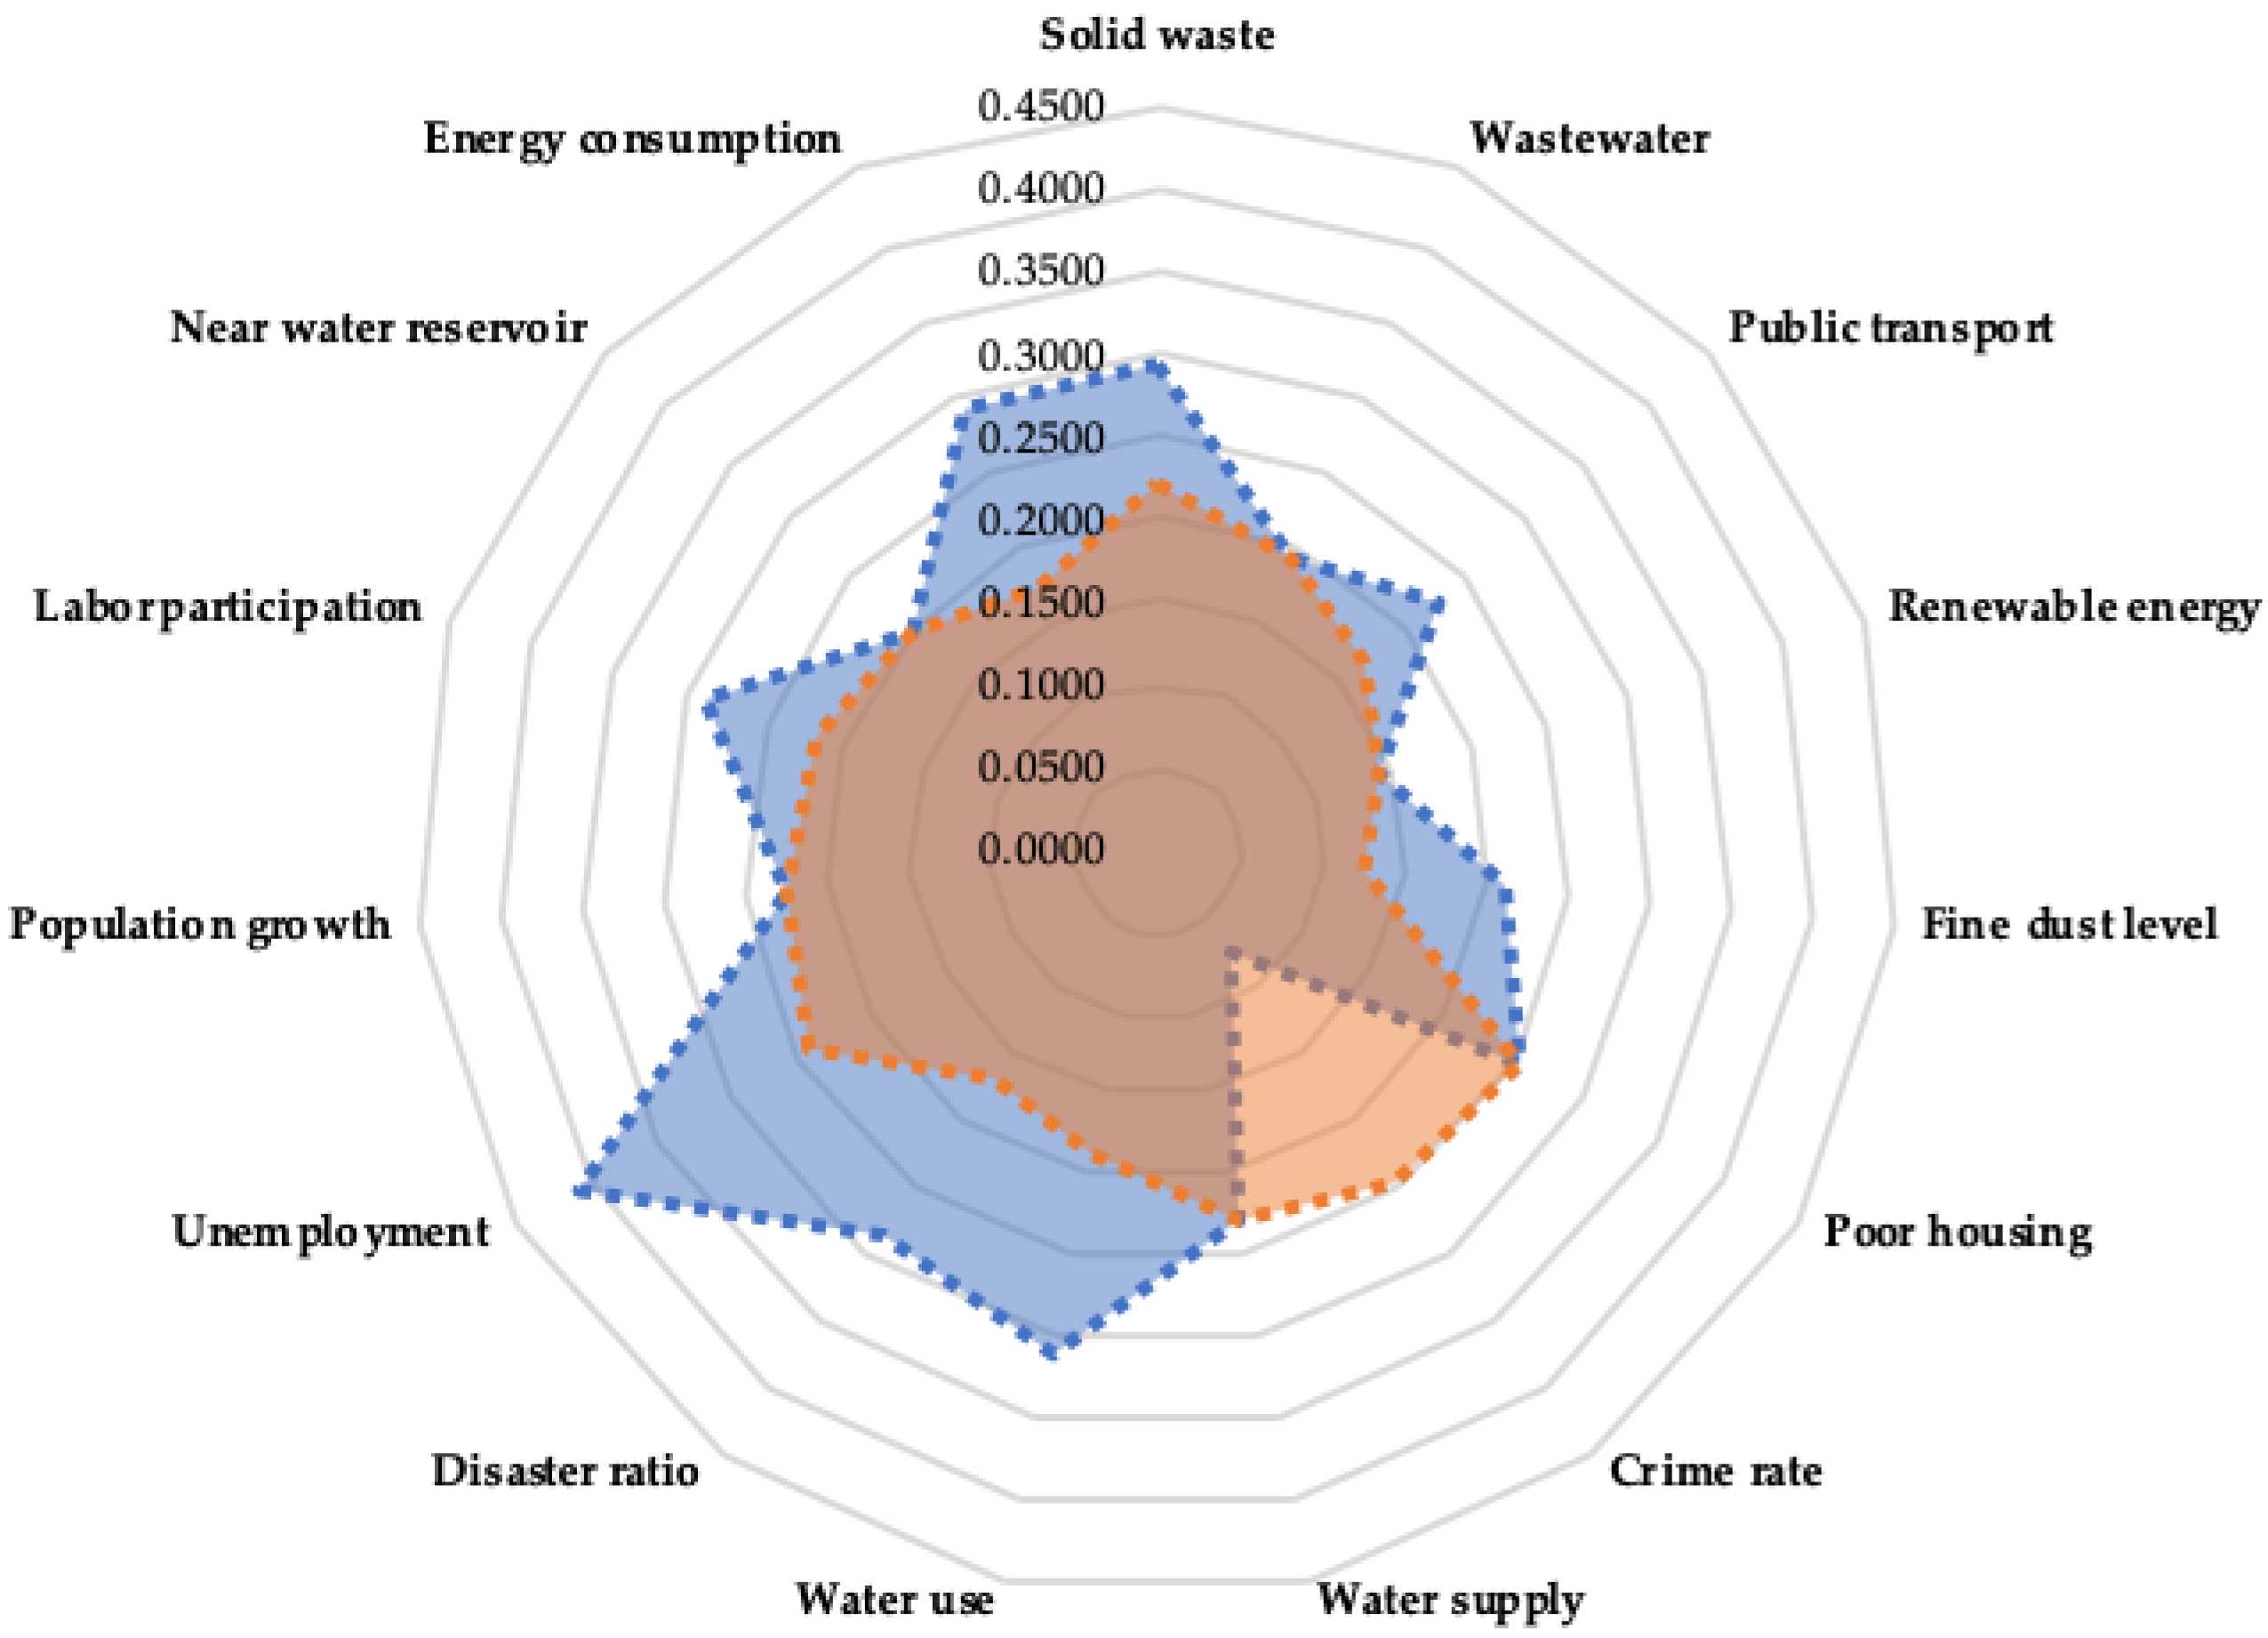
5.5. Sustainability of Sihanoukville
5.6. Significance of the Priority Weights of Indicators in Urban Sustainability Assessment
6. Conclusions
Funding
Acknowledgments
Conflicts of Interest
Appendix A. Urban Sustainability Index

| Indicator | Dimension | Weight | |||
|---|---|---|---|---|---|
| Origin | Conversion | 100-Scale | In Percentage | ||
| Solid waste collection rate | Environmental | 0.0437 | 0.0437+(0.4506÷15) | 0.0737 | 7.37% |
| Wastewater treatment ratio | 0.0352 | 0.0352+(0.4506÷15) | 0.0652 | 6.52% | |
| Public transport sharing rate | 0.0268 | 0.0268+(0.4506÷15) | 0.0568 | 5.68% | |
| Renewable energy shared rate | 0.0178 | 0.0178+(0.4506÷15) | 0.0478 | 4.78% | |
| Fine dust level (PM2.5, PM10) | 0.0124 | 0.0124+(0.4506÷15) | 0.0424 | 4.24% | |
| Slum/poor settlement rate | Social | 0.0557 | 0.0557+(0.4506÷15) | 0.0857 | 8.57% |
| Crime rate or prevention | 0.0470 | 0.0470+(0.4506÷15) | 0.0770 | 7.70% | |
| Potable water supply ratio | 0.0469 | 0.0469+(0.4506÷15) | 0.0769 | 7.69% | |
| Water consumption rate | 0.0320 | 0.0320+(0.4506÷15) | 0.0620 | 6.20% | |
| Disaster prevention | 0.0274 | 0.0274+(0.4506÷15) | 0.0574 | 5.74% | |
| Unemployment rate | Economic | 0.0516 | 0.0516+(0.4506÷15) | 0.0816 | 8.16% |
| Population growth rate | 0.0462 | 0.0462+(0.4506÷15) | 0.0762 | 7.62% | |
| Labor force participation rate | 0.0421 | 0.0421+(0.4506÷15) | 0.0721 | 7.21% | |
| Water reservoir coverage | 0.0362 | 0.0362+(0.4506÷15) | 0.0662 | 6.62% | |
| Energy consumption rate | 0.0284 | 0.0284+(0.4506÷15) | 0.0584 | 5.84% | |
| Total | Sustainability | 0.5494 | 0.5494 + 0.4506 | 1.0000 | 100.00% |
Appendix B. Sources of Data

Appendix C. Calculation of Data
| Transport Mean | Phnom Penh | Siem Reap | Battambang | Poi Pet | Sihanoukville |
|---|---|---|---|---|---|
| Total inland transport means | 101,080 | 20,000 | 17,819 | 13,606 | 8946 |
| Small passenger cars | 8647 | 2737 | 1467 | 1242 | 463 |
| Large passenger cars | 1762 | 1263 | 843 | 544 | 638 |
| Tricycles | 641 | 507 | 221 | 121 | 184 |
| Total public transport means | 11,050 | 4507 | 2531 | 1907 | 1285 |
| Public transport sharing rate | 10.93 | 22.54 | 14.20 | 14.02 | 14.36 |
| Date | Phnom Penh | Siem Reap | Battambang | Poi Pet | Sihanoukville | Source |
|---|---|---|---|---|---|---|
| 27 January 2020 | 29 | 17 | 20 | 13 | 8 | [105] |
| 31 January 2020 | 30 | 48 | 65 | 44 | 20 | [106] |
| 18 February 2020 | 12 | 30 | 29 | 24 | 12 | [107] |
| Average | 24 | 32 | 38 | 27 | 13 | - |
| Type of Disaster | Phnom Penh | Siem Reap | Battambang | Poi Pet | Sihanoukville |
|---|---|---|---|---|---|
| Windstorm | 0.1 | 0.3 | 0.2 | 0.2 | 0.1 |
| Floods | 5.9 | 0.3 | 1.6 | 0.9 | 0.0 |
| Total | 6.0 | 0.6 | 1.8 | 1.1 | 0.1 |
| Category | Phnom Penh | Siem Reap | Battambang | Poi Pet | Sihanoukville |
|---|---|---|---|---|---|
| Total provincial populations | 1,474,489 | 1,096,248 | 1,312,051 | 789,953 | 221,360 |
| Populations in labor force | 862,097 | 576,946 | 684,604 | 450,387 | 126,938 |
| Labor force participation rate | 58.47 | 52.63 | 52.18 | 57.01 | 57.34 |
| Total employed populations | 538,058 | 493,881 | 467,033 | 323,617 | 127,262 |
| Unemployed populations | 324,039 | 83,065 | 217,571 | 126,770 | −324 |
| Unemployment rate | 0.38 | 0.14 | 0.32 | 0.28 | 0.00 |
Appendix D. Standard Z-Score Table
| Negative Standard Score | Positive Standard Score | ||||||||||||||||||||
|---|---|---|---|---|---|---|---|---|---|---|---|---|---|---|---|---|---|---|---|---|---|
| Z | 0.00 | 0.01 | 0.02 | 0.03 | 0.04 | 0.05 | 0.06 | 0.07 | 0.08 | 0.09 | Z | 0.00 | 0.01 | 0.02 | 0.03 | 0.04 | 0.05 | 0.06 | 0.07 | 0.08 | 0.09 |
| −3.5 | 0.0002 | 0.0003 | 0.0003 | 0.0003 | 0.0003 | 0.0003 | 0.0003 | 0.0003 | 0.0003 | 0.0003 | 0.0 | 0.5000 | 0.5040 | 0.5080 | 0.5120 | 0.5160 | 0.5199 | 0.5239 | 0.5279 | 0.5319 | 0.5359 |
| −3.4 | 0.0003 | 0.0003 | 0.0004 | 0.0004 | 0.0004 | 0.0004 | 0.0004 | 0.0004 | 0.0005 | 0.0005 | 0.1 | 0.5398 | 0.5438 | 0.5478 | 0.5517 | 0.5557 | 0.5596 | 0.5636 | 0.5675 | 0.5714 | 0.5753 |
| −3.3 | 0.0005 | 0.0005 | 0.0005 | 0.0005 | 0.0006 | 0.0006 | 0.0006 | 0.0006 | 0.0006 | 0.0007 | 0.2 | 0.5793 | 0.5832 | 0.5871 | 0.5910 | 0.5948 | 0.5987 | 0.6026 | 0.6064 | 0.6103 | 0.6141 |
| −3.2 | 0.0007 | 0.0007 | 0.0007 | 0.0008 | 0.0008 | 0.0008 | 0.0008 | 0.0009 | 0.0009 | 0.0009 | 0.3 | 0.6179 | 0.6217 | 0.6255 | 0.6293 | 0.6331 | 0.6368 | 0.6406 | 0.6443 | 0.6480 | 0.6517 |
| −3.1 | 0.0010 | 0.0010 | 0.0010 | 0.0011 | 0.0011 | 0.0011 | 0.0012 | 0.0012 | 0.0013 | 0.0013 | 0.4 | 0.6554 | 0.6591 | 0.6628 | 0.6664 | 0.6700 | 0.6736 | 0.6772 | 0.6808 | 0.6844 | 0.6879 |
| −3.0 | 0.0013 | 0.0014 | 0.0014 | 0.0015 | 0.0015 | 0.0016 | 0.0016 | 0.0017 | 0.0018 | 0.0018 | 0.5 | 0.6915 | 0.6950 | 0.6985 | 0.7019 | 0.7054 | 0.7088 | 0.7123 | 0.7157 | 0.7190 | 0.7224 |
| −2.9 | 0.0019 | 0.0019 | 0.0020 | 0.0021 | 0.0021 | 0.0022 | 0.0023 | 0.0023 | 0.0024 | 0.0025 | 0.6 | 0.7257 | 0.7291 | 0.7324 | 0.7357 | 0.7389 | 0.7422 | 0.7454 | 0.7486 | 0.7517 | 0.7549 |
| −2.8 | 0.0026 | 0.0026 | 0.0027 | 0.0028 | 0.0029 | 0.0030 | 0.0031 | 0.0032 | 0.0033 | 0.0034 | 0.7 | 0.7580 | 0.7611 | 0.7642 | 0.7673 | 0.7704 | 0.7734 | 0.7764 | 0.7794 | 0.7823 | 0.7852 |
| −2.7 | 0.0035 | 0.0036 | 0.0037 | 0.0038 | 0.0039 | 0.0040 | 0.0041 | 0.0043 | 0.0044 | 0.0045 | 0.8 | 0.7881 | 0.7910 | 0.7939 | 0.7967 | 0.7995 | 0.8023 | 0.8051 | 0.8078 | 0.8106 | 0.8133 |
| −2.6 | 0.0047 | 0.0048 | 0.0049 | 0.0051 | 0.0052 | 0.0054 | 0.0055 | 0.0057 | 0.0059 | 0.0060 | 0.9 | 0.8159 | 0.8186 | 0.8212 | 0.8238 | 0.8264 | 0.8289 | 0.8315 | 0.8340 | 0.8365 | 0.8389 |
| −2.5 | 0.0062 | 0.0064 | 0.0066 | 0.0068 | 0.0069 | 0.0071 | 0.0073 | 0.0075 | 0.0078 | 0.0080 | 1.0 | 0.8413 | 0.8438 | 0.8461 | 0.8485 | 0.8508 | 0.8531 | 0.8554 | 0.8577 | 0.8599 | 0.8621 |
| −2.4 | 0.0082 | 0.0084 | 0.0087 | 0.0089 | 0.0091 | 0.0094 | 0.0096 | 0.0099 | 0.0102 | 0.0104 | 1.1 | 0.8643 | 0.8665 | 0.8686 | 0.8708 | 0.8729 | 0.8749 | 0.8770 | 0.8790 | 0.8810 | 0.8830 |
| −2.3 | 0.0107 | 0.0110 | 0.0113 | 0.0116 | 0.0119 | 0.0122 | 0.0125 | 0.0129 | 0.0132 | 0.0136 | 1.2 | 0.8849 | 0.8869 | 0.8888 | 0.8907 | 0.8925 | 0.8944 | 0.8962 | 0.8980 | 0.8997 | 0.9015 |
| −2.2 | 0.0139 | 0.0143 | 0.0146 | 0.0150 | 0.0154 | 0.0158 | 0.0162 | 0.0166 | 0.0170 | 0.0174 | 1.3 | 0.9032 | 0.9049 | 0.9066 | 0.9082 | 0.9099 | 0.9115 | 0.9131 | 0.9147 | 0.9162 | 0.9177 |
| −2.1 | 0.0179 | 0.0183 | 0.0188 | 0.0192 | 0.0197 | 0.0202 | 0.0207 | 0.0212 | 0.0217 | 0.0222 | 1.4 | 0.9192 | 0.9207 | 0.9222 | 0.9236 | 0.9251 | 0.9265 | 0.9279 | 0.9292 | 0.9306 | 0.9319 |
| −2.0 | 0.0228 | 0.0233 | 0.0239 | 0.0244 | 0.0250 | 0.0256 | 0.0262 | 0.0268 | 0.0274 | 0.0281 | 1.5 | 0.9332 | 0.9345 | 0.9357 | 0.9370 | 0.9382 | 0.9394 | 0.9406 | 0.9418 | 0.9429 | 0.9441 |
| −1.9 | 0.0287 | 0.0294 | 0.0301 | 0.0307 | 0.0314 | 0.0322 | 0.0329 | 0.0336 | 0.0344 | 0.0351 | 1.6 | 0.9452 | 0.9463 | 0.9474 | 0.9484 | 0.9495 | 0.9505 | 0.9515 | 0.9525 | 0.9535 | 0.9545 |
| −1.8 | 0.0359 | 0.0367 | 0.0375 | 0.0384 | 0.0392 | 0.0401 | 0.0409 | 0.0418 | 0.0427 | 0.0436 | 1.7 | 0.9554 | 0.9564 | 0.9573 | 0.9582 | 0.9591 | 0.9599 | 0.9608 | 0.9616 | 0.9625 | 0.9633 |
| −1.7 | 0.0446 | 0.0455 | 0.0465 | 0.0475 | 0.0485 | 0.0495 | 0.0505 | 0.0516 | 0.0526 | 0.0537 | 1.8 | 0.9641 | 0.9649 | 0.9656 | 0.9664 | 0.9671 | 0.9678 | 0.9686 | 0.9693 | 0.9699 | 0.9706 |
| −1.6 | 0.0548 | 0.0559 | 0.0571 | 0.0582 | 0.0594 | 0.0606 | 0.0618 | 0.0630 | 0.0643 | 0.0655 | 1.9 | 0.9713 | 0.9719 | 0.9726 | 0.9732 | 0.9738 | 0.9744 | 0.9750 | 0.9756 | 0.9761 | 0.9767 |
| −1.5 | 0.0668 | 0.0681 | 0.0694 | 0.0708 | 0.0721 | 0.0735 | 0.0749 | 0.0764 | 0.0778 | 0.0793 | 2.0 | 0.9772 | 0.9778 | 0.9783 | 0.9788 | 0.9793 | 0.9798 | 0.9803 | 0.9808 | 0.9812 | 0.9817 |
| −1.4 | 0.0808 | 0.0823 | 0.0838 | 0.0853 | 0.0869 | 0.0885 | 0.0901 | 0.0918 | 0.0934 | 0.0951 | 2.1 | 0.9821 | 0.9826 | 0.9830 | 0.9834 | 0.9838 | 0.9842 | 0.9846 | 0.9850 | 0.9854 | 0.9857 |
| −1.3 | 0.0968 | 0.0985 | 0.1003 | 0.1020 | 0.1038 | 0.1056 | 0.1075 | 0.1093 | 0.1112 | 0.1131 | 2.2 | 0.9861 | 0.9864 | 0.9868 | 0.9871 | 0.9875 | 0.9878 | 0.9881 | 0.9884 | 0.9887 | 0.9890 |
| −1.2 | 0.1151 | 0.1170 | 0.1190 | 0.1210 | 0.1230 | 0.1251 | 0.1271 | 0.1292 | 0.1314 | 0.1335 | 2.3 | 0.9893 | 0.9896 | 0.9898 | 0.9901 | 0.9904 | 0.9906 | 0.9909 | 0.9911 | 0.9913 | 0.9916 |
| −1.1 | 0.1357 | 0.1379 | 0.1401 | 0.1423 | 0.1446 | 0.1469 | 0.1492 | 0.1515 | 0.1539 | 0.1562 | 2.4 | 0.9918 | 0.9920 | 0.9922 | 0.9925 | 0.9927 | 0.9929 | 0.9931 | 0.9932 | 0.9934 | 0.9936 |
| −1.0 | 0.1587 | 0.1611 | 0.1635 | 0.1660 | 0.1685 | 0.1711 | 0.1736 | 0.1762 | 0.1788 | 0.1814 | 2.5 | 0.9938 | 0.9940 | 0.9941 | 0.9943 | 0.9945 | 0.9946 | 0.9948 | 0.9949 | 0.9951 | 0.9952 |
| −0.9 | 0.1841 | 0.1867 | 0.1894 | 0.1922 | 0.1949 | 0.1977 | 0.2005 | 0.2033 | 0.2061 | 0.2090 | 2.6 | 0.9953 | 0.9955 | 0.9956 | 0.9957 | 0.9959 | 0.9960 | 0.9961 | 0.9962 | 0.9963 | 0.9964 |
| −0.8 | 0.2119 | 0.2148 | 0.2177 | 0.2206 | 0.2236 | 0.2266 | 0.2296 | 0.2327 | 0.2358 | 0.2389 | 2.7 | 0.9965 | 0.9966 | 0.9967 | 0.9968 | 0.9969 | 0.9970 | 0.9971 | 0.9972 | 0.9973 | 0.9974 |
| −0.7 | 0.2420 | 0.2451 | 0.2483 | 0.2514 | 0.2546 | 0.2578 | 0.2611 | 0.2643 | 0.2676 | 0.2709 | 2.8 | 0.9974 | 0.9975 | 0.9976 | 0.9977 | 0.9977 | 0.9978 | 0.9979 | 0.9979 | 0.9980 | 0.9981 |
| −0.6 | 0.2743 | 0.2776 | 0.2810 | 0.2843 | 0.2877 | 0.2912 | 0.2946 | 0.2981 | 0.3015 | 0.3050 | 2.9 | 0.9981 | 0.9982 | 0.9982 | 0.9983 | 0.9984 | 0.9984 | 0.9985 | 0.9985 | 0.9986 | 0.9986 |
| −0.5 | 0.3085 | 0.3121 | 0.3156 | 0.3192 | 0.3228 | 0.3264 | 0.3300 | 0.3336 | 0.3372 | 0.3409 | 3.0 | 0.9987 | 0.9987 | 0.9987 | 0.9988 | 0.9988 | 0.9989 | 0.9989 | 0.9989 | 0.9990 | 0.9990 |
| −0.4 | 0.3446 | 0.3483 | 0.3520 | 0.3557 | 0.3594 | 0.3632 | 0.3669 | 0.3707 | 0.3745 | 0.3783 | 3.1 | 0.9990 | 0.9991 | 0.9991 | 0.9991 | 0.9992 | 0.9992 | 0.9992 | 0.9992 | 0.9993 | 0.9993 |
| −0.3 | 0.3821 | 0.3859 | 0.3897 | 0.3936 | 0.3974 | 0.4013 | 0.4052 | 0.4090 | 0.4129 | 0.4168 | 3.2 | 0.9993 | 0.9993 | 0.9994 | 0.9994 | 0.9994 | 0.9994 | 0.9994 | 0.9995 | 0.9995 | 0.9995 |
| −0.2 | 0.4207 | 0.4247 | 0.4286 | 0.4325 | 0.4364 | 0.4404 | 0.4443 | 0.4483 | 0.4522 | 0.4562 | 3.3 | 0.9995 | 0.9995 | 0.9995 | 0.9996 | 0.9996 | 0.9996 | 0.9996 | 0.9996 | 0.9996 | 0.9997 |
| −0.1 | 0.4602 | 0.4641 | 0.4681 | 0.4721 | 0.4761 | 0.4801 | 0.4840 | 0.4880 | 0.4920 | 0.4960 | 3.4 | 0.9997 | 0.9997 | 0.9997 | 0.9997 | 0.9997 | 0.9997 | 0.9997 | 0.9997 | 0.9997 | 0.9998 |
| 0.0 | 0.5000 | 0.5040 | 0.5080 | 0.5120 | 0.5160 | 0.5199 | 0.5239 | 0.5279 | 0.5319 | 0.5359 | 3.5 | 0.9998 | 0.9998 | 0.9998 | 0.9998 | 0.9998 | 0.9998 | 0.9998 | 0.9998 | 0.9998 | 0.9998 |
References
- Angel, S.; Parent, J.; Civco, D.L.; Blei, A.M. The Atlas of Urban Expansion; Lincoln Institute of Land Policy: Cambridge, MA, USA, 2012. [Google Scholar]
- United Nations. 68% of the World Population Projected to Live in Urban Areas by 2050, Says UN, 2018. Available online: https://www.un.org/development/desa/en/news/population/2018-revision-of-world-urbanization-prospects.html (accessed on 7 November 2019).
- Richard, F. Does Urbanization Drive Southeast Asia’s Development? Available online: https://www.citylab.com/life/2017/01/southeast-asia-martin-prosperity-institute/511952/ (accessed on 18 October 2019).
- Cambodian Ministry of Royal Palace. The Royal Decree on the Establishment of the National Committee for Clean City Assessment; Ministry of Royal Palace: Phnom Penh, Cambodia, 2011. [Google Scholar]
- NCCCA. The Action Plan 2011–2014. Available online: http://www.cambodiacleancity.gov.kh/kh/documents (accessed on 14 January 2019).
- NCCCA. Why Clean City Contest? Available online: http://www.cambodiacleancity.gov.kh/kh (accessed on 14 January 2020).
- NCCCA. Clean City Standard. Available online: http://www.cambodiacleancity.gov.kh/kh/documents (accessed on 14 January 2020).
- NCCCA. The First Clean City Contest. Available online: http://www.cambodiacleancity.gov.kh/kh/award/5484w2u244x243f403 (accessed on 25 October 2019).
- NCCCA. The Second Clean City Contest. Available online: http://www.cambodiacleancity.gov.kh/kh/award/4464w2t224x253f423 (accessed on 25 October 2019).
- Cambodian Ministry of Royal Palace. The Royal Decree on the Establishment of the National Council for Sustainable Development; Ministry of Royal Palace: Phnom Penh, Cambodia, 2015. [Google Scholar]
- National Council for Sustainable Development; Global Green Growth Institute; International Centre for Environmental Management. Green City Strategic Planning Methodology, 2016. Available online: http://gggi.org/wp-content/uploads/2016/08/Annex-A-AAS1507-REP-006-Final-Green-city-strategic-planning-methodology.pdf (accessed on 14 January 2019).
- National Council for Sustainable Development. The Environment and Natural Resources Code of Cambodia: Revised Ninth Draft (Draft 9.1); National Council for Sustainable Development: Phnom Penh, Cambodia, 2017.
- United Nations―General Assembly. Transforming Our World: The 2030 Agenda for Sustainable Development; Resolution adopted by the General Assembly; United Nations: New York, NY, USA, 2015. [Google Scholar]
- Chan, P. Child-Friendly Cities and Communities. 2020. Available online: https://www.semanticscholar.org/paper/Child-Friendly-Cities-and-Communities-Chan/3d429a6581d4f3c553e6d723a8e9b1e331144c9f (accessed on 20 June 2020).
- National Council for Sustainable Development; Global Green Growth Institute; International Centre for Environmental Management. The Green City Strategic Plan 2017–2026 and List of Priority Green City Investment Projects for Phnom Penh; National Council for Sustainable Development: Phnom Penh, Cambodia, 2016.
- Sovanndy, P. SDG Localization into Cambodian Context: Progress, M&E Framework and Next Step. Available online: http://www.cdc-crdb.gov.kh/cdc/twg_network/twg_network_february_2017/documents/session_3-sdg_localisation.pdf (accessed on 20 June 2020).
- Ministry of Planning. Progress and Challenges in the Process of Pre-Localization of Global SDG into Cambodian Context; Ministry of Planning―General Directorate of Planning: Phnom Penh, Cambodia, 2017.
- Royal Government of Cambodia. Cambodian Sustainable Development Goals Framework (2016–2030); Royal Government of Cambodia: Phnom Penh, Cambodia, 2018. [Google Scholar]
- World Bank. Cambodia: Achieving the Potential of Urbanization; World Bank Group―Cambodia Country Office: Phnom Penh, Cambodia, 2018. [Google Scholar]
- National Committee for Clean City Assessment. List of Legal Documents for Supporting the Processes of National Committee for Clean City Assessment; General Secretariat of the National Committee for Clean City Assessment: Phnom Penh, Cambodia, 2017. [Google Scholar]
- Derodofa, N. ASEAN Cooperation on Environmentally Sustainable Cities (ESC) Regional Vision: The ASEAN Response beyond 2015. Available online: https://hls-esc.org/documents/6hlsesc/PL06%20-%20ASEAN%20Secretariat.pdf (accessed on 15 August 2020).
- Lee, D.J.; Lee, M.H. Regarding Creativity Evaluation of Small and Medium-Sized Cities in Capital Area: Focused on Fourteen Main Small and Medium-Sized Cities. J. Korea Appr. Soci. 2014, 13, 107–122. Available online: https://www.kci.go.kr/kciportal/ci/sereArticleSearch/ciSereArtiView.kci?sereArticleSearchBean.artiId=ART001938794 (accessed on 7 September 2020).
- Lee, D.J. Evaluation of Urban Growth Management in Metropolis of Korea. Ph.D. Thesis, Hanyang University, Seoul, Korea, February 2015. [Google Scholar]
- Han, S.M.; Lee, M.H. Analysis of Evaluation Indicators for the Development and Management of Sustainable and Resilient Cities: Focusing on the Goal 11 of UN Sustainable Developments Goals (SDGs). J. Korean Reg. Dev. Assoc. 2017, 29, 1–24. [Google Scholar]
- United Nations. Outcomes on Sustainable Development. 1992. Available online: https://www.un.org/en/development/devagenda/sustainable.shtml (accessed on 7 April 2020).
- United Nations. Environment and Sustainable Development: Implementation of Agenda 21 and the Programme for the Further Implementation of Agenda 21; United Nations: New York, NY, USA, 2002. [Google Scholar]
- Earth Summit. Building partnerships for sustainable development. 2002. Available online: www.earthsummit2002.org (accessed on 2 November 2019).
- National Strategic Plan on Green Growth 2013–2030. Available online: https://policy.asiapacificenergy.org/ru/node/2806 (accessed on 14 January 2019).
- United Nations. Report of the United Nations Conference on Sustainable Development; A/CONF.216/16; United Nations: New York, NY, USA, 2012. [Google Scholar]
- World Commission on Environment and Development. From One Earth to One World: An Overview; Oxford University Press: Oxford, UK, 1987. [Google Scholar]
- European Commission. The 2005 Review of EU Sustainable Development Strategy: Initial Stocktaking and Future Orientations; European Union: Brussels, Belgium, 2005. [Google Scholar]
- Ziccai, E. Over two decades in pursuit of sustainable development: Influence, transformations, limits. Environ. Dev. 2012, 1, 79–90. [Google Scholar] [CrossRef]
- Cobbinah, P.B.; Erdiaw-Kwasie, M.O.; Amoateng, P. Rethinking sustainable development within the framework of poverty and urbanization in developing countries. Environ. Dev. 2015, 13, 18–32. [Google Scholar] [CrossRef]
- United Nations Department of Econimic and Social Affairs. World Urbanization Prospects: The 2011 Revision; United Nations: New York, NY, USA, 2012. [Google Scholar]
- Ogbodo, S.G. The paradox of the concept of sustainable development under Nigeria’s environmental law. J. Sustain. Dev. 2010, 3, 201–207. [Google Scholar] [CrossRef] [Green Version]
- United Nations Environment Program. Towards a Green Economy: Pathways to Sustainable Development and Poverty Eradication; United Nations Environment Program: Nairobi, Kenya, 2011. [Google Scholar]
- Alkire, S.; Santos, M.E. Acute multidimensional poverty: A new index for developing countries. In Proceedings of the German Development Economics Conference, Berlin, Germany, 24–26 June 2011. [Google Scholar]
- Chandy, L.; Ledlie, N.; Penciakova, V. Africa’s Challenge to End Extreme Poverty by 2030: Too Slow or Too Far Behind? Available online: http://www.brookings.edu/blogs/up-front/posts/2013/05/29-africa-challenge-end-extreme-poverty-2030-chandy (accessed on 25 July 2020).
- Cobbinah, P.B.; Black, R. Thwaites Dynamics of poverty in developing countries: Review of poverty reduction approaches. J. Sustain. Dev. 2013, 6, 25–35. [Google Scholar] [CrossRef] [Green Version]
- United Nations. The Millennium Development Goals Report; United Nations: New York, NY, USA, 2013. [Google Scholar]
- Visser, W. Corporate Social Responsibility in Developing Countries. In The Oxford Handbook of Corporate Social Responsibility; Crane, A., McWilliams, A., Matten, D., Moon, J., Siegel, D., Eds.; Oxford University Press: Oxford, UK, 2008; pp. 473–479. [Google Scholar]
- Cohen, B.; Winn, M.I. Market imperfections, opportunity and sustainable entrepreneurship. J. Bus. Ventur. 2007, 22, 29–49. [Google Scholar] [CrossRef]
- Azmat, F. Sustainable development in developing countries: The role of social entrepreneurs. Int. J. Public Adm. 2013, 36, 293–304. [Google Scholar] [CrossRef]
- Chan, P. The Development and Prioritization of Consensus Sustainable City Indicators for Cambodia. Ph.D. Thesis, Hanyang University, Seoul, Korea, August 2020. [Google Scholar]
- Ministry of Royal Palace. Law on the Ratification of the Kingdom of Cambodia to the Agreement on the Establishment of the Global Green Growth Institute; Ministry of Royal Palace: Phnom Penh, Cambodia, 2012. [Google Scholar]
- GGGI. Agreement on the Establishment of Global Green Growth Institute. 2012. Available online: http://gggi.org/site/assets/uploads/2017/10/Agreement-on-the-Establishment-of-the-GGGI.pdf (accessed on 14 February 2019).
- Patricia, B. Sustainable Cities and What That Means. 2018. Available online: https://blogs.rochester.edu/thegreendandelion/2018/07/sustainable-cities-and-what-that-means/ (accessed on 11 May 2019).
- Sustainable Cities: Creating a Promise for Future Generations. Available online: https://www.esilv.fr/en/sustainable-cities-creating-better-sustainability-for-future-generations/ (accessed on 22 June 2020).
- Tanguay, G.A.; Rajaonson, J.; Lefebvre, J.F.; Lanoie, P. Measuring the sustainability of cities: An analysis of the use of local indicators. Ecol. Indic. 2010, 10, 407–418. [Google Scholar] [CrossRef]
- Jonathan, G.; Fu, J.; Yu, G.; Steve, B. The role of supply chain leadership in the learning of sustainable practice: Toward an integrated framework. J. Clean. Prod. 2016, 137, 1458–1469. [Google Scholar]
- Winter, M.; Knemeyer, A.M. Exploring the integration of sustainability and supply chain management current state and opportunities for future inquiry. Int. J. Phys. Distrib. Logist. Manag. 2013, 43, 18–38. [Google Scholar] [CrossRef]
- Department of Green Economy. Available online: https://ncsd.moe.gov.kh/dge (accessed on 22 June 2020).
- NCSD.; GGGI. Phnom Penh Sustainable City Plan 2018–2030. Available online: https://ncsd.moe.gov.kh/resources/document/sustainable-city-plan-phnom-penh-2018-2030en (accessed on 22 June 2020).
- United Nations. The Sustainable Development Agenda. Available online: https://www.un.org/sustainabledevelopment/development-agenda-retired/ (accessed on 22 June 2020).
- Janoušková, S.; Hák, T.; Moldan, B. Global SDGs Assessments: Helping or Confusing Indicators? Sustainability 2018, 10, 1540. [Google Scholar] [CrossRef] [Green Version]
- UN-Habitat. SDG Goal 11 Monitoring Framework. 2016. Available online: http://unhabitat.org/sdg-goal-11-monitoring-framework/ (accessed on 14 January 2020).
- UN-Habitat. SDG Goal 11 Monitoring Framework. A Guide to Assist National and Local Governments to Monitor Report on SDG 11 Indicators. 2016. Available online: https://www.local2030.org/library/view/60 (accessed on 14 January 2020).
- Institute of Statistics, Ministry of PlanningNational. General Population Census of the Kingdom of Cambodia 2019; Institute of Statistics, Ministry of PlanningNational: Phnom Penh, Cambodia, 2019.
- Siem Reap Provincial Department of Planning. Siem Reap Commune Database 2018 Code No. 17; Siem Reap Provincial Department of Planning: Siem Reap, Cambodia, 2019. [Google Scholar]
- Battambang Provincial Department of Planning. Battambang Commune Database 2018 Code No. 2; Battambang Provincial Department of Planning: Battambang, Cambodia, 2019. [Google Scholar]
- Banteay Meanchey Provincial Department of Planning. Banteay Meanchey Commune Database 2018 Code No. 1; Banteay Meanchey Provincial Department of Planning: Banteay Meanchey, Cambodia, 2019. [Google Scholar]
- List of Municipalities in Cambodia by Population. Available online: https://en.wikipedia.org/wiki/List_of_cities_and_towns_in_Cambodia (accessed on 11 May 2020).
- Kandal Provincial Department of Planning. Kandal Commune Database 2018 Code No. 8; Kandal Provincial Department of Planning: Kandal, Cambodia, 2019. [Google Scholar]
- Pursat Provincial Department of Planning. Pursat Commune Database 2018 Code No. 15; Pursat Provincial Department of Planning: Pursat, Cambodia, 2019. [Google Scholar]
- Oddar Meanchey Provincial Department of Planning. Oddar Meanchey Commune Database 2018 Code No. 22; Oddar Meanchey Provincial Department of Planning: Oddar Meanchey, Cambodia, 2019. [Google Scholar]
- Kampong Thom Provincial Department of Planning. Kampong Thom Commune Database 2018 Code No. 6; Kampong Thom Provincial Department of Planning: Kampong Thom, Cambodia, 2019. [Google Scholar]
- Kampong Speu Provincial Department of Planning. Kampong Speu Commune Database 2018 Code No. 5; Kampong Speu Provincial Department of Planning: Kampong Speu, Cambodia, 2019. [Google Scholar]
- Svay Rieng Provincial Department of Planning. Svay Rieng Commune Database 2018 Code No. 20; Svay Rieng Provincial Department of Planning: Svay Rieng, Cambodia, 2019. [Google Scholar]
- Takeo Provincial Department of Planning. Takeo Commune Database 2018 Code No. 21; Takeo Provincial Department of Planning: Takeo, Cambodia, 2019. [Google Scholar]
- Kaeb Provincial Department of Planning. Kaeb Commune Database 2018 Code No. 23; Kaeb Provincial Department of Planning: Kaeb, Cambodia, 2019. [Google Scholar]
- Kampong Chhnang Provincial Department of Planning. Kampong Chhnang Commune Database 2018 Code No. 4; Kampong Chhnang Provincial Department of Planning: Kampong Chhnang, Cambodia, 2019. [Google Scholar]
- Kampong Cham Provincial Department of Planning. Kampong Cham Commune Database 2018 Code No. 3; Kampong Cham Provincial Department of Planning: Kampong Cham, Cambodia, 2019. [Google Scholar]
- Tboung Khmum Provincial Department of Planning. Tboung Khmum Commune Database 2018 Code No. 25; Tboung Khmum Provincial Department of Planning: Tboung Khmum, Cambodia, 2019. [Google Scholar]
- Kampot Provincial Department of Planning. Kampot Commune Database 2018 Code No. 7; Kampot Provincial Department of Planning: Kampot, Cambodia, 2019. [Google Scholar]
- Pailin Provincial Department of Planning. Pailin Commune Database 2018 Code No. 24; Pailin Provincial Department of Planning: Pailin, Cambodia, 2019. [Google Scholar]
- Stung Treng Provincial Department of Planning. Stung Treng Commune Database 2018 Code No. 19; Stung Treng Provincial Department of Planning: Stung Treng, Cambodia, 2019. [Google Scholar]
- Ratanakiri Provincial Department of Planning. Ratanakiri Commune Database 2018 Code No. 16; Ratanakiri Provincial Department of Planning: Ratanakiri, Cambodia, 2019. [Google Scholar]
- Koh Kong Provincial Department of Planning. Koh Kong Commune Database 2018 Code No. 9; Koh Kong Provincial Department of Planning: Koh Kong, Cambodia, 2019. [Google Scholar]
- Kratie Provincial Department of Planning. Kratie Commune Database 2018 Code No. 10; Kratie Provincial Department of Planning: Kratie, Cambodia, 2019. [Google Scholar]
- Prey Veng Provincial Department of Planning. Prey Veng Commune Database 2018 Code No. 14; Prey Veng Provincial Department of Planning: Prey Veng, Cambodia, 2019. [Google Scholar]
- Preah Vihear Provincial Department of Planning. Preah Vihear Commune Database 2018 Code No. 13; Preah Vihear Provincial Department of Planning: Preah Vihear, Cambodia, 2019. [Google Scholar]
- Mondulkiri Provincial Department of Planning. Mondulkiri Commune Database 2018 Code No. 11; Mondulkiri Provincial Department of Planning: Mondulkiri, Cambodia, 2019. [Google Scholar]
- Royal Government of Cambodia. Sub-Decree on the Formation of Koh Rong City; OCM Peace Palace: Phnom Penh, Cambodia, 2019. [Google Scholar]
- Khmer Times. Koh Rong Islands to Form Kingdom’s Newest City. Available online: https://www.khmertimeskh.com/575652/koh-rong-islands-to-form-kingdoms-newest-city/ (accessed on 11 May 2020).
- Chan, P. Cambodian Green Economy. 2019. Available online: https://www.semanticscholar.org/paper/Cambodian-Green-Economy-Chan/2b3a788abc17041dea4a729ed4f3b3e720c1856b (accessed on 20 June 2020).
- Hák, T.; Janoušková, S.; Moldan, B. Closing the sustainability gap: 30 years after “Our Common Future”, society lacks meaningful stories and relevant indicators to make the right decisions and build public support. Ecol. Indic. 2018, 87, 193–195. [Google Scholar] [CrossRef]
- Hák, T.; Janoušková, S.; Moldan, B. Sustainable development goals: A need for relevant indicators. Ecol. Indic. 2016, 60, 565–573. [Google Scholar] [CrossRef]
- Mastny, L. (Ed.) State of the World 2015: Confronting Hidden Threats to Sustainability; Island Press: Washington, DC, USA, 2015. [Google Scholar]
- Dahl, A.L. Achievements and gaps in indicators for sustainability. Ecol. Indic. 2012, 17, 14–19. [Google Scholar] [CrossRef]
- Pawłowski, A. How Many Dimensions Does Sustainable Development Have? J. Sustain. Dev. 2008, 16, 81–91. [Google Scholar] [CrossRef]
- ASEAN. Annex C—ESC Key Indicators. Available online: http://environment.asean.org/wp-content/uploads/2017/01/Key-Indicators_2017-Endorsed.pdf (accessed on 14 January 2020).
- ASEAN. ASEAN Cooperation on Environmentally Sustainable City. The Introduction. Available online: https://environment.asean.org/awgesc/ (accessed on 14 January 2020).
- Association of Southeast Asian Nations. ASEAN Clean Tourist City Standard; Association of Southeast Asian Nations (ASEAN) Secretariat: Jakarta, Indonesia, 2016. [Google Scholar]
- Kim, H.; Lee, M.H. Analysis of Research Trends and Knowledge Structures of Korean Urban Regeneration. J. Korean Plan. Assoc. 2016, 51, 39–55. [Google Scholar] [CrossRef]
- Kang, M.-S. A Study on the Improvement of Legislation for Higher Efficiency in “Urban Renewal New Deal Projects” through the Establishment of the Integrated Urban Management System. 2018. Available online: https://www.klri.re.kr/eng/publication/1813/view.do (accessed on 15 January 2020).
- Kang, M.H.; Song, H.S.; Lee, M.H. The Satisfaction Differences on Urban Regeneration Revitalization Project between Residents and Merchants: Focused on 13 Urban Regeneration Activation Regions in Seoul. SH Urban Res. Insight 2017, 7, 19–33. [Google Scholar] [CrossRef]
- Han, S.M.; Lee, M.H. Application of Evaluation Index for Urban Sustainability and Resilience: Focused on the Goal 11 of UN Sustainable Development Goals. J. Korea Re. Est. Man. Re. 2019, 29, 7–27. Available online: http://www.earticle.net/Article.aspx?sn=355512 (accessed on 7 September 2020).
- Han, S.M. A Study on the Development and Application of Evaluation Indicators for Sustainable Urban Development and Management. Ph.D. Thesis, Hanyang University, Seoul, Korea, August 2019. [Google Scholar]
- Chan, P.; Lee, M.-H. Developing Sustainable City Indicators for Cambodia through Delphi Processes of Panel Surveys. Sustainability 2019, 11, 3166. [Google Scholar] [CrossRef] [Green Version]
- Chan, P.; Lee, M.-H. Prioritizing Sustainable City Indicators for Cambodia. Urban Sci. 2019, 3, 104. [Google Scholar] [CrossRef] [Green Version]
- Small and Medium Enterprises Development Policies in Cambodia. Available online: https://www.asean.org/storage/images/archive/documents/SME%20Development%20Policies%20in%204%20ASEAN%20Countries%20-%20Cambodia.pdf (accessed on 24 June 2020).
- Arias, M.E. Impacts of Hydrological Alterations in the Mekong Basin to the Tonle Sap Ecosystem. Ph.D. Thesis, University of Canterbury, Christchurch, New Zealand, December 2013. [Google Scholar]
- Phnom Penh Capital Department of Planning. Phnom Penh Commune Database 2018 Code No. 12; Phnom Penh Capital Department of Planning: Phnom Penh, Cambodia, 2019. [Google Scholar]
- Preah Sihanouk Provincial Department of Planning. Preah Sihanouk Commune Database 2018 Code No. 18; Preah Sihanouk Provincial Department of Planning: Preah Sihanouk, Cambodia, 2019. [Google Scholar]
- Ministry of Environment. Announcement on Air Quality Results in the Capital and Provinces of Cambodia Dated on 27 January 2020; Ministry of Environment: Phnom Penh, Cambodia, 2020. [Google Scholar]
- Ministry of Environment. Announcement on Air Quality Results in the Capital and Provinces of Cambodia dated on 31 January 2020; Ministry of Environment: Phnom Penh, Cambodia, 2020. [Google Scholar]
- Ministry of Environment. Announcement on Air Quality Results in the Capital and Provinces of Cambodia dated on 18 February 2020; Ministry of Environment: Phnom Penh, Cambodia, 2020. [Google Scholar]
- Ward, A.W.; Murray-Ward, M. Assessment in the Classroom; Wadsworth: Belmont, CA, USA, 1999. [Google Scholar]
- Comparing the Various Grading Methods in a Normal Distribution. Available online: https://commons.wikimedia.org/wiki/File:The_Normal_Distribution.svg (accessed on 11 May 2020).
- Kreyszig, E. Advanced Engineering Mathematics, 4th ed.; John Wiley & Sons, Inc.: Hoboken, NJ, USA, 1979. [Google Scholar]
- Claude, L.; Svitlana, P.; Joshua, E. Using the Normal Distribution, 2016, A Revision Version on Introduction to Statistics by Claude, 2017. Available online: https://cnx.org/ (accessed on 11 May 2020).


| Target | Indicator | ||
|---|---|---|---|
| 11.1 | Ensuring adequate and affordable housing for all by 2030 | 1 | Proportion of urban population living in slums and poor/informal settlements |
| 11.2 | Providing safe and affordable transport systems for all by 2030 | 2 | Proportion of population convenient access to public transport for everyone in the city |
| 11.3 | Enhancing inclusive urbanization and participatory human settlement planning by 2030 | 3 | Ratio of land consumption to population growth |
| 4 | Proportion of cities with participation structure of civil society in urban planning | ||
| 11.4 | Strengthening efforts to protect cultural and natural heritages | 5 | Total expenditure spent on protection and conservation of cultural and natural heritages |
| 11.5 | Reducing the number of people affected by disasters with a focus on protecting the poor by 2030 | 6 | Number of people affected by disasters |
| 7 | Direct economic loss in relation to global GDP, damage to critical infrastructure | ||
| 11.6 | Reducing the environmental impact by paying attention to air quality and waste management by 2030 | 8 | Proportion of solid waste regularly collected |
| 9 | Annual mean levels of fine particulate matter (e.g., PM2.5 and PM10) in cities | ||
| 11.7 | Providing universal access to urban green and public spaces by 2030 | 10 | Average share of open space for all |
| 11 | Rate of persons victims of physical harassment | ||
| 11.a | Supporting positive links between urban, periurban, and rural areas | 12 | Proportion of population living in cities that integrate population projections and resource needs |
| 11.b | Increasing the number of cities adopting integrated policies and plans towards inclusion by 2020 | 13 | No. of countries adopted disaster risk reduction strategy |
| 14 | Proportion of local governments that adopt/implement local disaster risk reduction strategies | ||
| 11.c | Supporting least developed countries in constructing resilient buildings | 15 | Proportion of financial support to the least developed countries for buildings utilizing local materials |
| Target | Indicator |
|---|---|
| By 2030, reduce adverse per capita environmental impact of cities, including by paying special attention to air quality and municipal waste management | Amount of urban solid waste regularly collected and with adequate final discharge |
| Percentage of the deduction plastic bag used | |
| Percentage of the solid wasted segregate by technical guidance | |
| The number of sites monitored by the air quality on the parameter is the annual average of parameters of CO, NO2, SO2, TSP, PM2.5 and PM10 |
| No. | City | Status | Population | Source |
|---|---|---|---|---|
| 1 | Phnom Penh | Capital of the country | 2,129,371 | [58] |
| 2 | Siem Reap | Municipality of Siem Reap province | 250,798 | [59] |
| 3 | Battambang | Municipality of Battambang province | 163,347 | [60] |
| 4 | Poi Pet | A city in Banteay Meanchey province | 104,156 | [61] |
| 5 | Sihanoukville | Municipality of Preah Sihanouk province | 100,856 | [19,62] |
| 6 | Serei Saophoan | Municipality of Banteay Meanchey province | 87,738 | [61] |
| 7 | Ta Khmau | Municipality of Kandal Province | 82,671 | [63] |
| 8 | Pursat | Municipality of Pursat Province | 68,247 | [64] |
| 9 | Samraong | Municipality of Oddar Meanchey province | 64,639 | [65] |
| 10 | Stung Saen | Municipality of Kampong Thom province | 59,044 | [66] |
| 11 | Chbar Mon | Municipality of Kampong Speu province | 50,252 | [67] |
| 12 | Svay Rieng | Municipality of Svay Rieng province | 47,829 | [68] |
| 13 | Doun Kaev | Municipality of Takeo province | 45,446 | [69] |
| 14 | Bavet | A city in Svay Rieng province | 42,546 | [68] |
| 15 | Kaeb | Municipality of Kaeb province | 41,818 | [70] |
| 16 | Kampong Chhnang | Municipality of Kampong Chhnang province | 40,911 | [71] |
| 17 | Kampong Cham | Municipality of Kampong Cham province | 40,015 | [72] |
| 18 | Suong | A city in Tboung Khmum province | 39,452 | [73] |
| 19 | Kampot | Municipality of Kampot province | 38,595 | [74] |
| 20 | Pailin | Municipality of Pailin province | 34,948 | [75] |
| 21 | Stung Treng | Municipality of Stung Treng province | 33,063 | [76] |
| 22 | Banlung | Municipality of Ratanakiri province | 32,294 | [77] |
| 23 | Khemarak Phoumin | Municipality of Koh Kong province | 30,894 | [78] |
| 24 | Kratie | Municipality of Kratie province | 30,435 | [79] |
| 25 | Prey Veng | Municipality of Prey Veng province | 26,011 | [80] |
| 26 | Preah Vihear | Municipality of Preah Vihear province | 22,983 | [81] |
| 27 | Sen Monorom | Municipality of Mondulkiri province | 13,871 | [82] |
| 28 | Koh Rong | A city in Preah Sihanouk province | - | [83] |
| Rank | Indicator (In-short) | Weight | CC | GC | UN SDG 11 | CSDG 11 |
|---|---|---|---|---|---|---|
| 1 | Slum-poor settlement rate | 0.0557 | √ | |||
| 2 | Unemployment rate | 0.0516 | √ | |||
| 3 | Crime prevention | 0.0470 | √ | |||
| 4 | Potable water supply | 0.0469 | √ | |||
| 5 | Population growth rate | 0.0462 | √ | |||
| 6 | Low-income housing ratio | 0.0445 | ||||
| 7 | Solid waste collection rate | 0.0437 | √ | √ | √ | √ |
| 8 | Labor force participation rate | 0.0421 | √ | |||
| 9 | Construction risk prevention | 0.0400 | ||||
| 10 | Traffic congestion reduction | 0.0398 | ||||
| 11 | Average household income | 0.0366 | ||||
| 12 | Water reservoir coverage | 0.0362 | √ | |||
| 13 | Quality residential buildings | 0.0356 | ||||
| 14 | Wastewater treatment ratio | 0.0352 | √ | √ | ||
| 15 | New jobs created per year | 0.0345 | ||||
| 16 | Water consumption rate | 0.0320 | √ | |||
| 17 | Urban population density | 0.0291 | ||||
| 18 | Energy consumption rate | 0.0284 | √ | |||
| 19 | Waste reduction initiatives | 0.0284 | ||||
| 20 | Disaster prevention | 0.0274 | √ | |||
| 21 | Public transport sharing rate | 0.0268 | √ | √ | √ | |
| 22 | Insurance-registered ratio | 0.0237 | ||||
| 23 | Sidewalk improvement | 0.0234 | ||||
| 24 | Urban park ratio | 0.0229 | √ | √ | ||
| 25 | No. of public parking lots | 0.0209 | ||||
| 26 | Heritage conservation budget | 0.0195 | √ | √ | ||
| 27 | Renewable energy shared rate | 0.0178 | √ | √ | ||
| 28 | Tourism growth rate per year | 0.0173 | √ | |||
| 29 | Urban forest ratio per capita | 0.0150 | ||||
| 30 | Fine dust level (PM2.5, PM10) | 0.0124 | √ | √ | ||
| 31 | Number of playgrounds | 0.0114 | ||||
| 32 | Biodiversity gardens | 0.0086 | ||||
| Total | 1.0000 | - | ||||
| Rank | Indicator | Weight | Sustainability Dimension |
|---|---|---|---|
| 1 | Slum-poor settlement rate | 0.0557 | Social |
| 2 | Unemployment rate | 0.0516 | Economic |
| 3 | Crime prevention | 0.0470 | Social |
| 4 | Potable water supply ratio | 0.0469 | Social |
| 5 | Population growth rate | 0.0462 | Economic |
| 6 | Solid waste collection rate | 0.0437 | Environmental |
| 7 | Labor force participation rate | 0.0421 | Economic |
| 8 | Water reservoir coverage | 0.0362 | Economic |
| 9 | Wastewater treatment ratio | 0.0352 | Environmental |
| 10 | Water consumption rate | 0.0320 | Social |
| 11 | Energy consumption rate | 0.0284 | Economic |
| 12 | Disaster prevention | 0.0274 | Social |
| 13 | Public transport sharing rate | 0.0268 | Environmental |
| 14 | Urban park ratio | 0.0229 | Social |
| 15 | Heritage conservation budget | 0.0195 | Social |
| 16 | Renewable energy shared rate | 0.0178 | Environmental |
| 17 | Tourism growth rate per year | 0.0173 | Economic |
| 18 | Fine dust level (PM2.5, PM10) | 0.0124 | Environmental |
| Dimension | No. | Indicator | Weight | In Percentage |
|---|---|---|---|---|
| Environmental | 1 | Solid waste collection rate | 0.0737 | 7.37% |
| 2 | Wastewater treatment ratio | 0.0652 | 6.52% | |
| 3 | Public transport sharing rate | 0.0568 | 5.68% | |
| 4 | Renewable energy shared rate | 0.0478 | 4.78% | |
| 5 | Fine dust level (PM2.5, PM10) | 0.0424 | 4.24% | |
| Social | 1 | Slum-poor settlement rate | 0.0857 | 8.57% |
| 2 | Crime rate or prevention | 0.0770 | 7.70% | |
| 3 | Potable water supply ratio | 0.0769 | 7.69% | |
| 4 | Water consumption rate | 0.0620 | 6.20% | |
| 5 | Disaster prevention | 0.0574 | 5.74% | |
| Economic | 1 | Unemployment rate | 0.0816 | 8.16% |
| 2 | Population growth rate | 0.0762 | 7.62% | |
| 3 | Labor force participation rate | 0.0721 | 7.21% | |
| 4 | Water reservoir coverage | 0.0662 | 6.62% | |
| 5 | Energy consumption rate | 0.0584 | 5.84% | |
| Total | 15 | 1.0000 | 100.00% | |
| City | Publishing Department (Published Year) | Ref. |
|---|---|---|
| Phnom Penh | Phnom Penh Capital Department of Planning (2019) | [103] |
| Siem Reap | Siem Reap Provincial Department of Planning (2019) | [59] |
| Battambang | Battambang Provincial Department of Planning (2019) | [60] |
| Poi Pet | Banteay Meanchey Provincial Department of Planning (2019) | [61] |
| Sihanoukville | Preah Sihanouk Provincial Department of Planning (2019) | [104] |
| Indicator | Characteristics of the Data | Impact |
|---|---|---|
| Solid waste | Percentage of households accessing to solid waste collection services | + |
| Wastewater | Percentage of households installed proper toilets/wastewater storages | + |
| Public transport | The ratio of public transport means compared to total transport means | + |
| Renewable energy | Percentage of houses using solar PV | + |
| Fine dust level | Level of PM 2.5 (μg/m3) | ─ |
| Poor housing | Percentage of households living in low-quality housings | ─ |
| Crime rate | The ratio of murder/robbery/kidnapping cases per 10,000 households | ─ |
| Potable water supply | The ratio of households accessing to potable water supply infrastructure | + |
| Water consumption | Percentage of households having clean-water consuming habits | + |
| Disaster-affected ratio | The ratio of storms and floods affected per 1000 households | ─ |
| Unemployment rate | Unemployment rate | ─ |
| Population growth | Population growth rate per year | + |
| Labor participation | The ratio of the population aged from 18 to 60 years old | + |
| Near water reservoir | Percentage of households accessible to water sources less than 150m | + |
| Energy consumption | Percentage of households accessing to electricity | + |
| Indicators | Phnom Penh | Siem Reap | Battambang | Poi Pet | Sihanoukville |
|---|---|---|---|---|---|
| Solid waste | 82.2 | 36.2 | 46.6 | 18.6 | 70.1 |
| Wastewater | 92.5 | 91.1 | 93.7 | 93.4 | 92.8 |
| Public transport | 10.93 | 22.54 | 14.20 | 14.02 | 14.36 |
| Renewable energy | 0.00 | 5.55 | 0.70 | 0.36 | 0.39 |
| Fine dust level | 23.67 | 31.67 | 38.00 | 27.00 | 13.33 |
| Poor housing | 0.08 | 1.20 | 0.00 | 0.20 | 0.10 |
| Crime rate | 0.9 | 0.4 | 0.0 | 0.0 | 6.0 |
| Potable water supply | 98.0 | 98.8 | 85.6 | 83.3 | 97.8 |
| Water consumption | 99.0 | 92.6 | 92.8 | 84.5 | 99.4 |
| Disaster-affected ratio | 6.0 | 0.6 | 1.8 | 1.1 | 0.1 |
| Unemployment rate | 0.38 | 0.14 | 0.32 | 0.28 | 0.00 |
| Population growth | 5.07 | 1.69 | 3.46 | 1.58 | 3.14 |
| Labor participation | 58.47 | 52.63 | 52.18 | 57.01 | 57.34 |
| Near water reservoir | 84.3 | 99.2 | 14.9 | 4182.0 | 92.9 |
| Energy consumption | 99.65 | 98.50 | 98.70 | 99.00 | 99.70 |
| Indicator | City | Z-Score | p-Value | Rank | Score |
|---|---|---|---|---|---|
| Solid waste (+) | Phnom Penh | 1.228 | 0.891 | 1 | 5 |
| Siem Reap | −0.567 | 0.284 | 4 | 2 | |
| Battambang | −0.162 | 0.436 | 3 | 3 | |
| Poi Pet | −1.254 | 0.106 | 5 | 1 | |
| Sihanoukville | 0.756 | 0.776 | 2 | 4 | |
| Wastewater (+) | Phnom Penh | −0.198 | 0.421 | 4 | 2 |
| Siem Reap | −1.580 | 0.057 | 5 | 1 | |
| Battambang | 0.988 | 0.839 | 1 | 5 | |
| Poi Pet | 0.691 | 0.755 | 2 | 4 | |
| Sihanoukville | 0.099 | 0.536 | 3 | 3 | |
| Public transport (+) | Phnom Penh | −0.987 | 0.161 | 3 | 3 |
| Siem Reap | 1.690 | 0.955 | 1 | 5 | |
| Battambang | −0.233 | 0.109 | 4 | 2 | |
| Poi Pet | −0.274 | 0.102 | 5 | 1 | |
| Sihanoukville | −0.196 | 0.274 | 2 | 4 | |
| Renewable energy (+) | Phnom Penh | −0.600 | 0.274 | 5 | 1 |
| Siem Reap | 1.779 | 0.963 | 1 | 5 | |
| Battambang | −0.300 | 0.382 | 2 | 4 | |
| Poi Pet | −0.446 | 0.326 | 4 | 2 | |
| Sihanoukville | −0.433 | 0.334 | 3 | 3 | |
| Fine dust level (─) | Phnom Penh | −0.332 | 0.371 | 2 | 4 |
| Siem Reap | 0.535 | 0.705 | 4 | 2 | |
| Battambang | 1.221 | 0.889 | 5 | 1 | |
| Poi Pet | 0.029 | 0.618 | 3 | 3 | |
| Sihanoukville | −1.453 | 0.074 | 1 | 5 |
| Indicator | City | Z-Score | p-Value | Rank | Score |
|---|---|---|---|---|---|
| Poor housing (─) | Phnom Penh | −0.473 | 0.319 | 2 | 4 |
| Siem Reap | 1.771 | 0.962 | 5 | 1 | |
| Battambang | −0.633 | 0.264 | 1 | 5 | |
| Poi Pet | −0.232 | 0.409 | 4 | 2 | |
| Sihanoukville | −0.433 | 0.334 | 3 | 3 | |
| Crime rate (─) | Phnom Penh | −0.218 | 0.413 | 4 | 2 |
| Siem Reap | −0.413 | 0.341 | 3 | 3 | |
| Battambang | −0.569 | 0.284 | 1 | 5 | |
| Poi Pet | −0.569 | 0.284 | 1 | 5 | |
| Sihanoukville | 1.770 | 0.962 | 5 | 1 | |
| Potable water supply (+) | Phnom Penh | 0.699 | 0.758 | 2 | 4 |
| Siem Reap | 0.804 | 0.788 | 1 | 5 | |
| Battambang | −0.936 | 0.171 | 4 | 2 | |
| Poi Pet | −1.239 | 0.107 | 5 | 1 | |
| Sihanoukville | 0.672 | 0.749 | 3 | 3 | |
| Water consumption (+) | Phnom Penh | 0.880 | 0.811 | 2 | 4 |
| Siem Reap | −0.175 | 0.429 | 4 | 2 | |
| Battambang | −0.142 | 0.444 | 3 | 3 | |
| Poi Pet | −1.510 | 0.066 | 5 | 1 | |
| Sihanoukville | 0.946 | 0.829 | 1 | 5 | |
| Disaster-affected ratio (─) | Phnom Penh | 1.725 | 0.958 | 5 | 1 |
| Siem Reap | −0.558 | 0.288 | 2 | 4 | |
| Battambang | −0.051 | 0.480 | 4 | 2 | |
| Poi Pet | −0.347 | 0.363 | 3 | 3 | |
| Sihanoukville | −0.769 | 0.221 | 1 | 5 |
| Indicator | City | Z-Score | p-Value | Rank | Score |
|---|---|---|---|---|---|
| Unemployment rate (─) | Phnom Penh | 1.018 | 0.846 | 5 | 1 |
| Siem Reap | −0.548 | 0.291 | 2 | 4 | |
| Battambang | 0.627 | 0.736 | 4 | 2 | |
| Poi Pet | 0.365 | 0.644 | 3 | 3 | |
| Sihanoukville | −1.462 | 0.072 | 1 | 5 | |
| Population growth (+) | Phnom Penh | 1.450 | 0.927 | 1 | 5 |
| Siem Reap | −0.904 | 0.184 | 4 | 2 | |
| Battambang | 0.329 | 0.629 | 2 | 4 | |
| Poi Pet | −0.981 | 0.164 | 5 | 1 | |
| Sihanoukville | 0.106 | 0.544 | 3 | 3 | |
| Labor participation (+) | Phnom Penh | 1.014 | 0.844 | 1 | 5 |
| Siem Reap | −0.997 | 0.161 | 4 | 2 | |
| Battambang | −1.152 | 0.125 | 5 | 1 | |
| Poi Pet | 0.511 | 0.695 | 3 | 3 | |
| Sihanoukville | 0.625 | 0.736 | 2 | 4 | |
| Near water reservoirs (+) | Phnom Penh | −0.441 | 0.330 | 4 | 1 |
| Siem Reap | −0.433 | 0.337 | 2 | 2 | |
| Battambang | −0.479 | 0.316 | 5 | 4 | |
| Poi Pet | 1.789 | 0.963 | 1 | 5 | |
| Sihanoukville | −0.436 | 0.334 | 3 | 3 | |
| Energy consumption (+) | Phnom Penh | 0.989 | 0.839 | 2 | 4 |
| Siem Reap | −1.117 | 0.131 | 5 | 1 | |
| Battambang | −0.751 | 0.227 | 4 | 2 | |
| Poi Pet | −0.202 | 0.413 | 3 | 3 | |
| Sihanoukville | 1.081 | 0.860 | 1 | 5 |
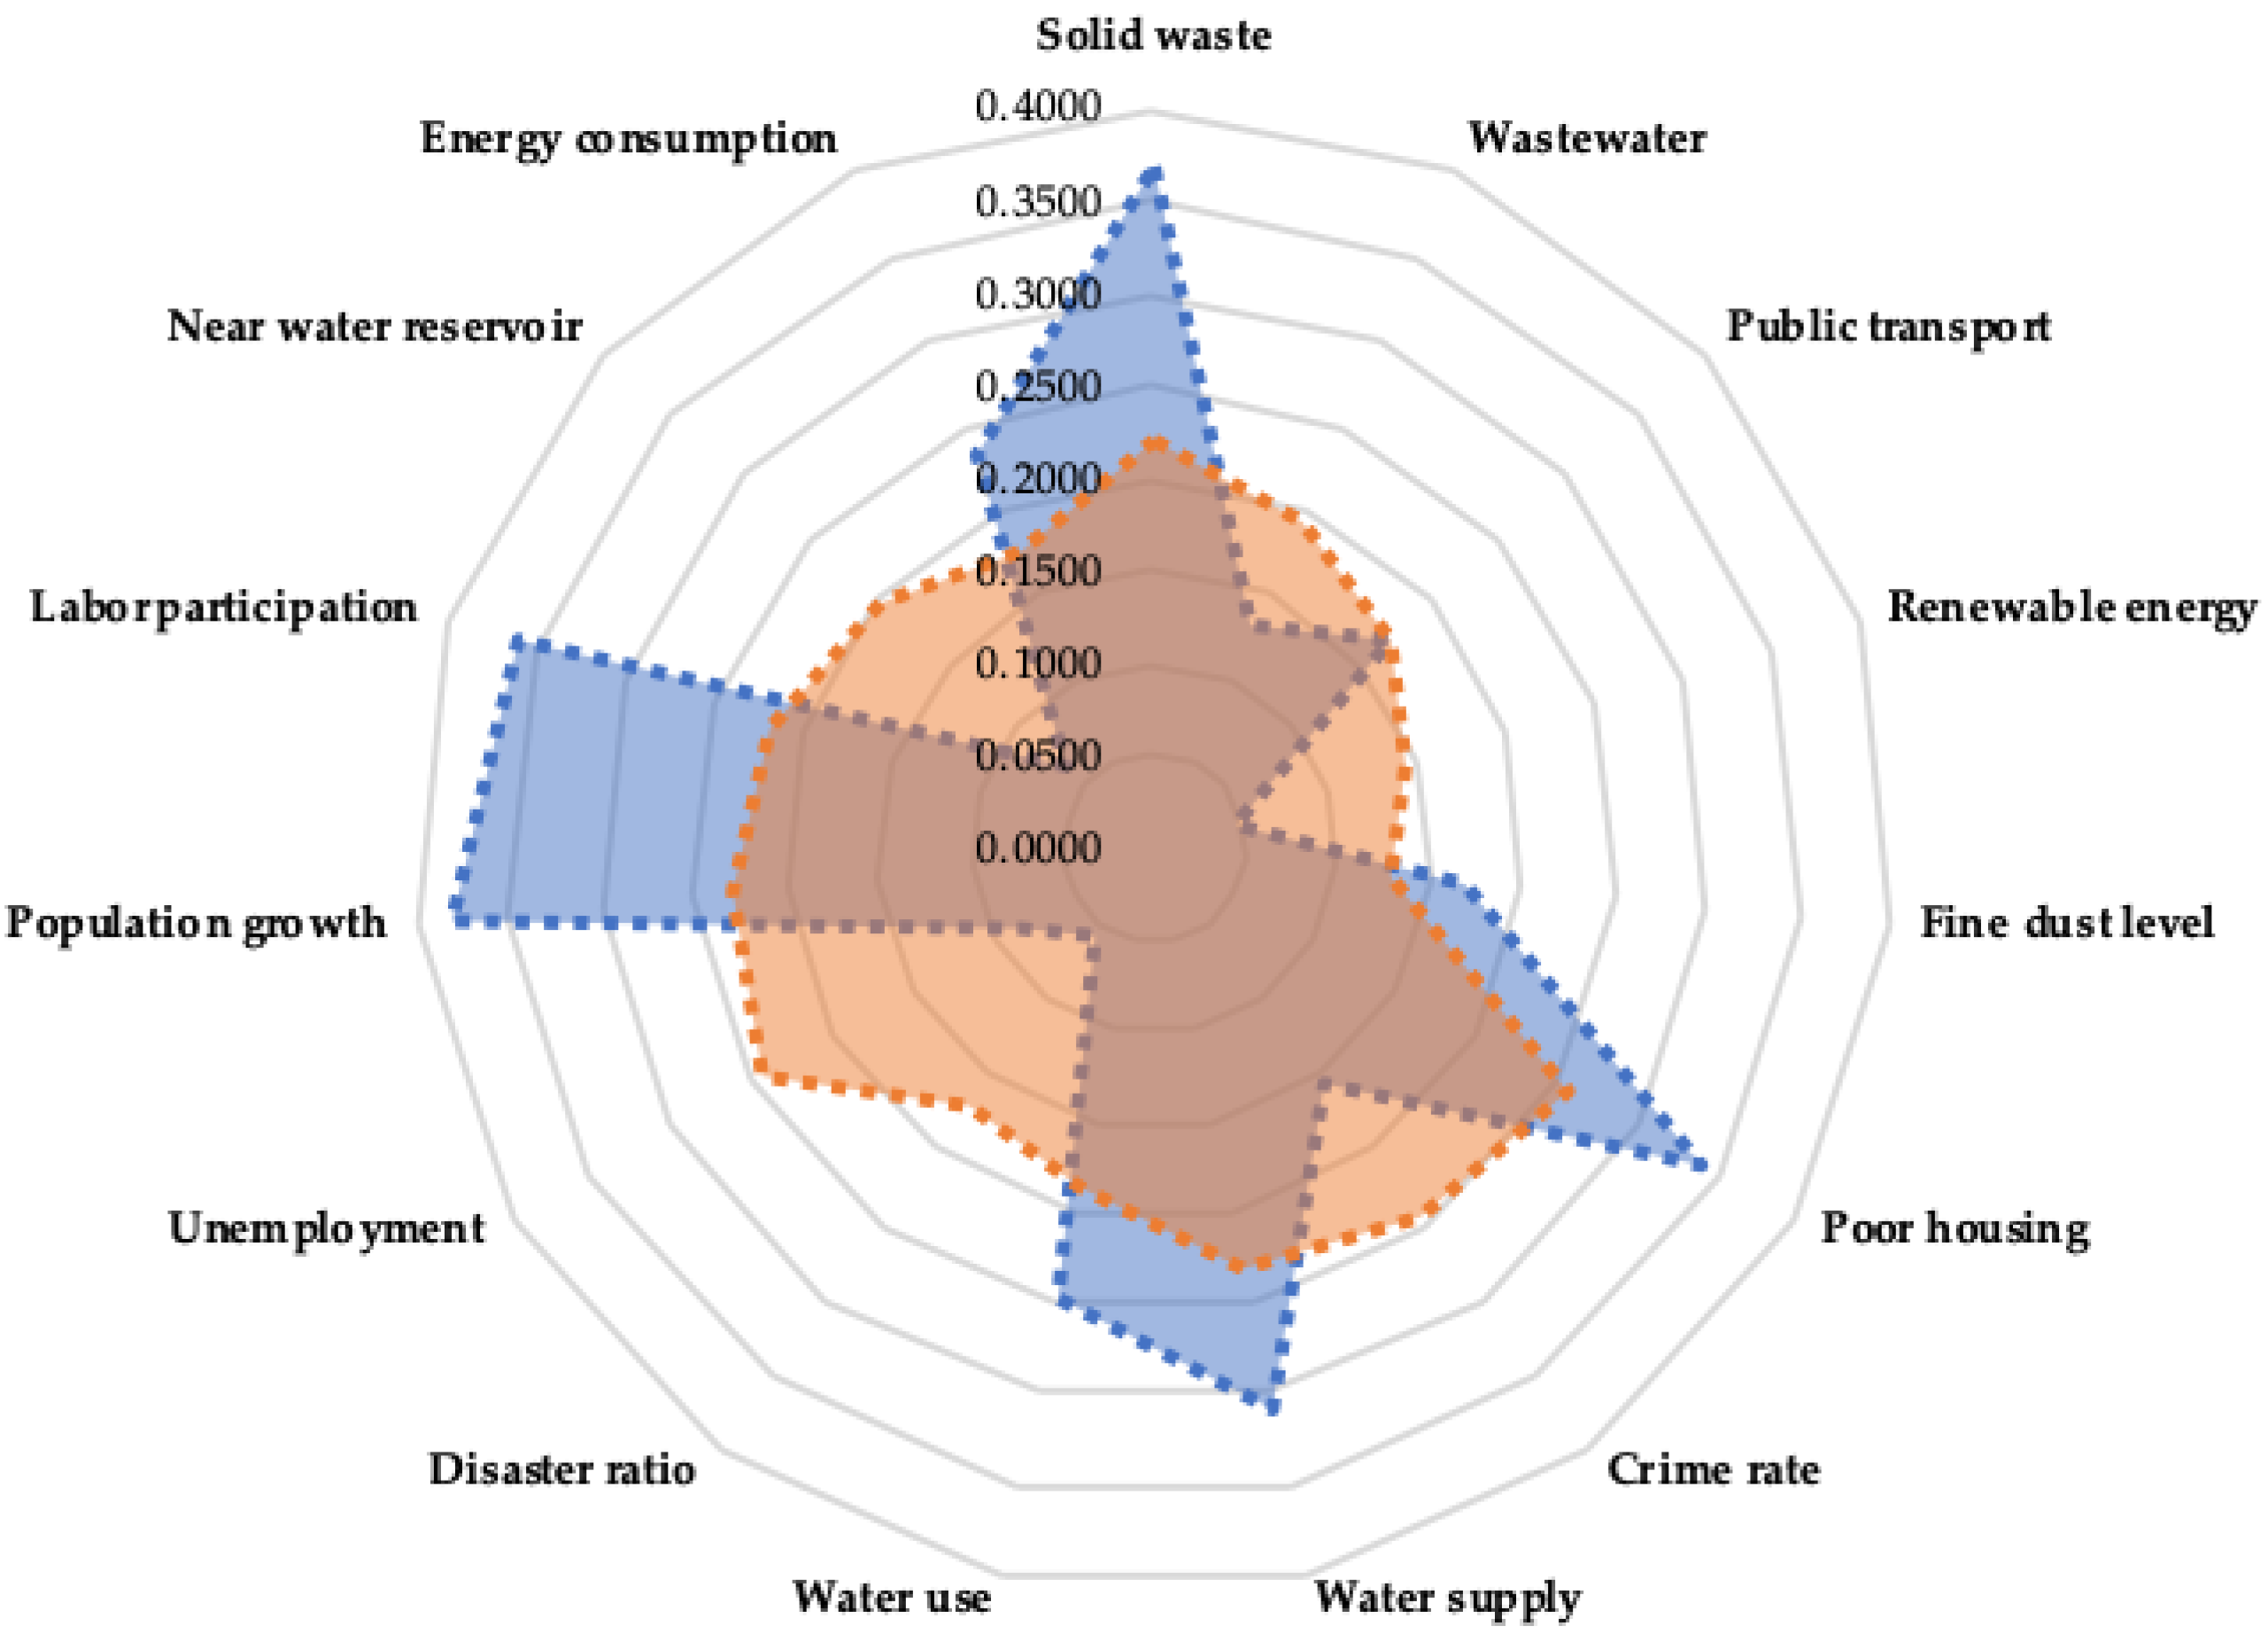
| Indicator | Weight | Phnom Penh | Siem Reap | Battambang | Poi Pet | Sihanoukville | Standard | |||||
|---|---|---|---|---|---|---|---|---|---|---|---|---|
| W-Score | Rank | W-Score | Rank | W-Score | Rank | W-Score | Rank | W-Score | Rank | |||
| Solid waste | 0.0737 | 0.3685 | 1 | 0.1474 | 4 | 0.2211 | 3 | 0.0737 | 5 | 0.2948 | 2 | 0.2211 |
| Wastewater | 0.0652 | 0.1304 | 4 | 0.0652 | 5 | 0.3260 | 1 | 0.2608 | 2 | 0.1956 | 3 | 0.1956 |
| Public transport | 0.0568 | 0.1704 | 3 | 0.2840 | 1 | 0.1136 | 4 | 0.0568 | 5 | 0.2272 | 2 | 0.1704 |
| Renewable energy | 0.0478 | 0.0478 | 5 | 0.2390 | 1 | 0.1912 | 2 | 0.0956 | 4 | 0.1434 | 3 | 0.1434 |
| Fine dust level | 0.0424 | 0.1696 | 2 | 0.0848 | 4 | 0.0424 | 5 | 0.1272 | 3 | 0.2120 | 1 | 0.1272 |
| Environmental | - | 0.8867 | 3 | 0.8204 | 4 | 0.8943 | 2 | 0.6141 | 5 | 1.0730 | 1 | 0.8577 |
| Poor housing | 0.0857 | 0.3428 | 2 | 0.0857 | 5 | 0.4285 | 1 | 0.1714 | 4 | 0.2571 | 3 | 0.2571 |
| Crime rate | 0.0770 | 0.1540 | 4 | 0.2310 | 3 | 0.3850 | 1 | 0.3850 | 1 | 0.0770 | 5 | 0.2464 |
| Potable water supply | 0.0769 | 0.3076 | 2 | 0.3845 | 1 | 0.1538 | 4 | 0.0769 | 5 | 0.2307 | 3 | 0.2307 |
| Water consumption | 0.0620 | 0.2480 | 2 | 0.1240 | 4 | 0.1860 | 3 | 0.0620 | 5 | 0.3100 | 1 | 0.1860 |
| Disaster-affected ratio | 0.0574 | 0.0574 | 5 | 0.2296 | 2 | 0.1148 | 4 | 0.1722 | 3 | 0.2870 | 1 | 0.1722 |
| Social | - | 1.1098 | 3 | 1.0548 | 4 | 1.2681 | 1 | 0.8675 | 5 | 1.1618 | 2 | 1.0924 |
| Unemployment rate | 0.0816 | 0.0816 | 5 | 0.3264 | 2 | 0.1632 | 4 | 0.2448 | 3 | 0.4080 | 1 | 0.2448 |
| Population growth | 0.0762 | 0.3810 | 1 | 0.1524 | 4 | 0.3048 | 2 | 0.0762 | 5 | 0.2286 | 3 | 0.2286 |
| Labor participation | 0.0721 | 0.3605 | 1 | 0.1442 | 4 | 0.0721 | 5 | 0.2163 | 3 | 0.2884 | 2 | 0.2163 |
| Near water reservoir | 0.0662 | 0.0662 | 5 | 0.1324 | 4 | 0.2648 | 2 | 0.3310 | 1 | 0.1986 | 3 | 0.1986 |
| Energy consumption | 0.0584 | 0.2336 | 2 | 0.0584 | 5 | 0.1168 | 4 | 0.1752 | 3 | 0.2920 | 1 | 0.1752 |
| Economic | - | 1.1229 | 2 | 0.8138 | 5 | 0.9217 | 4 | 1.0435 | 3 | 1.4156 | 1 | 1.0635 |
| Sustainability | 1.0000 | 3.1194 | 2 | 2.6890 | 4 | 3.0841 | 3 | 2.5251 | 5 | 3.6504 | 1 | 3.0136 |
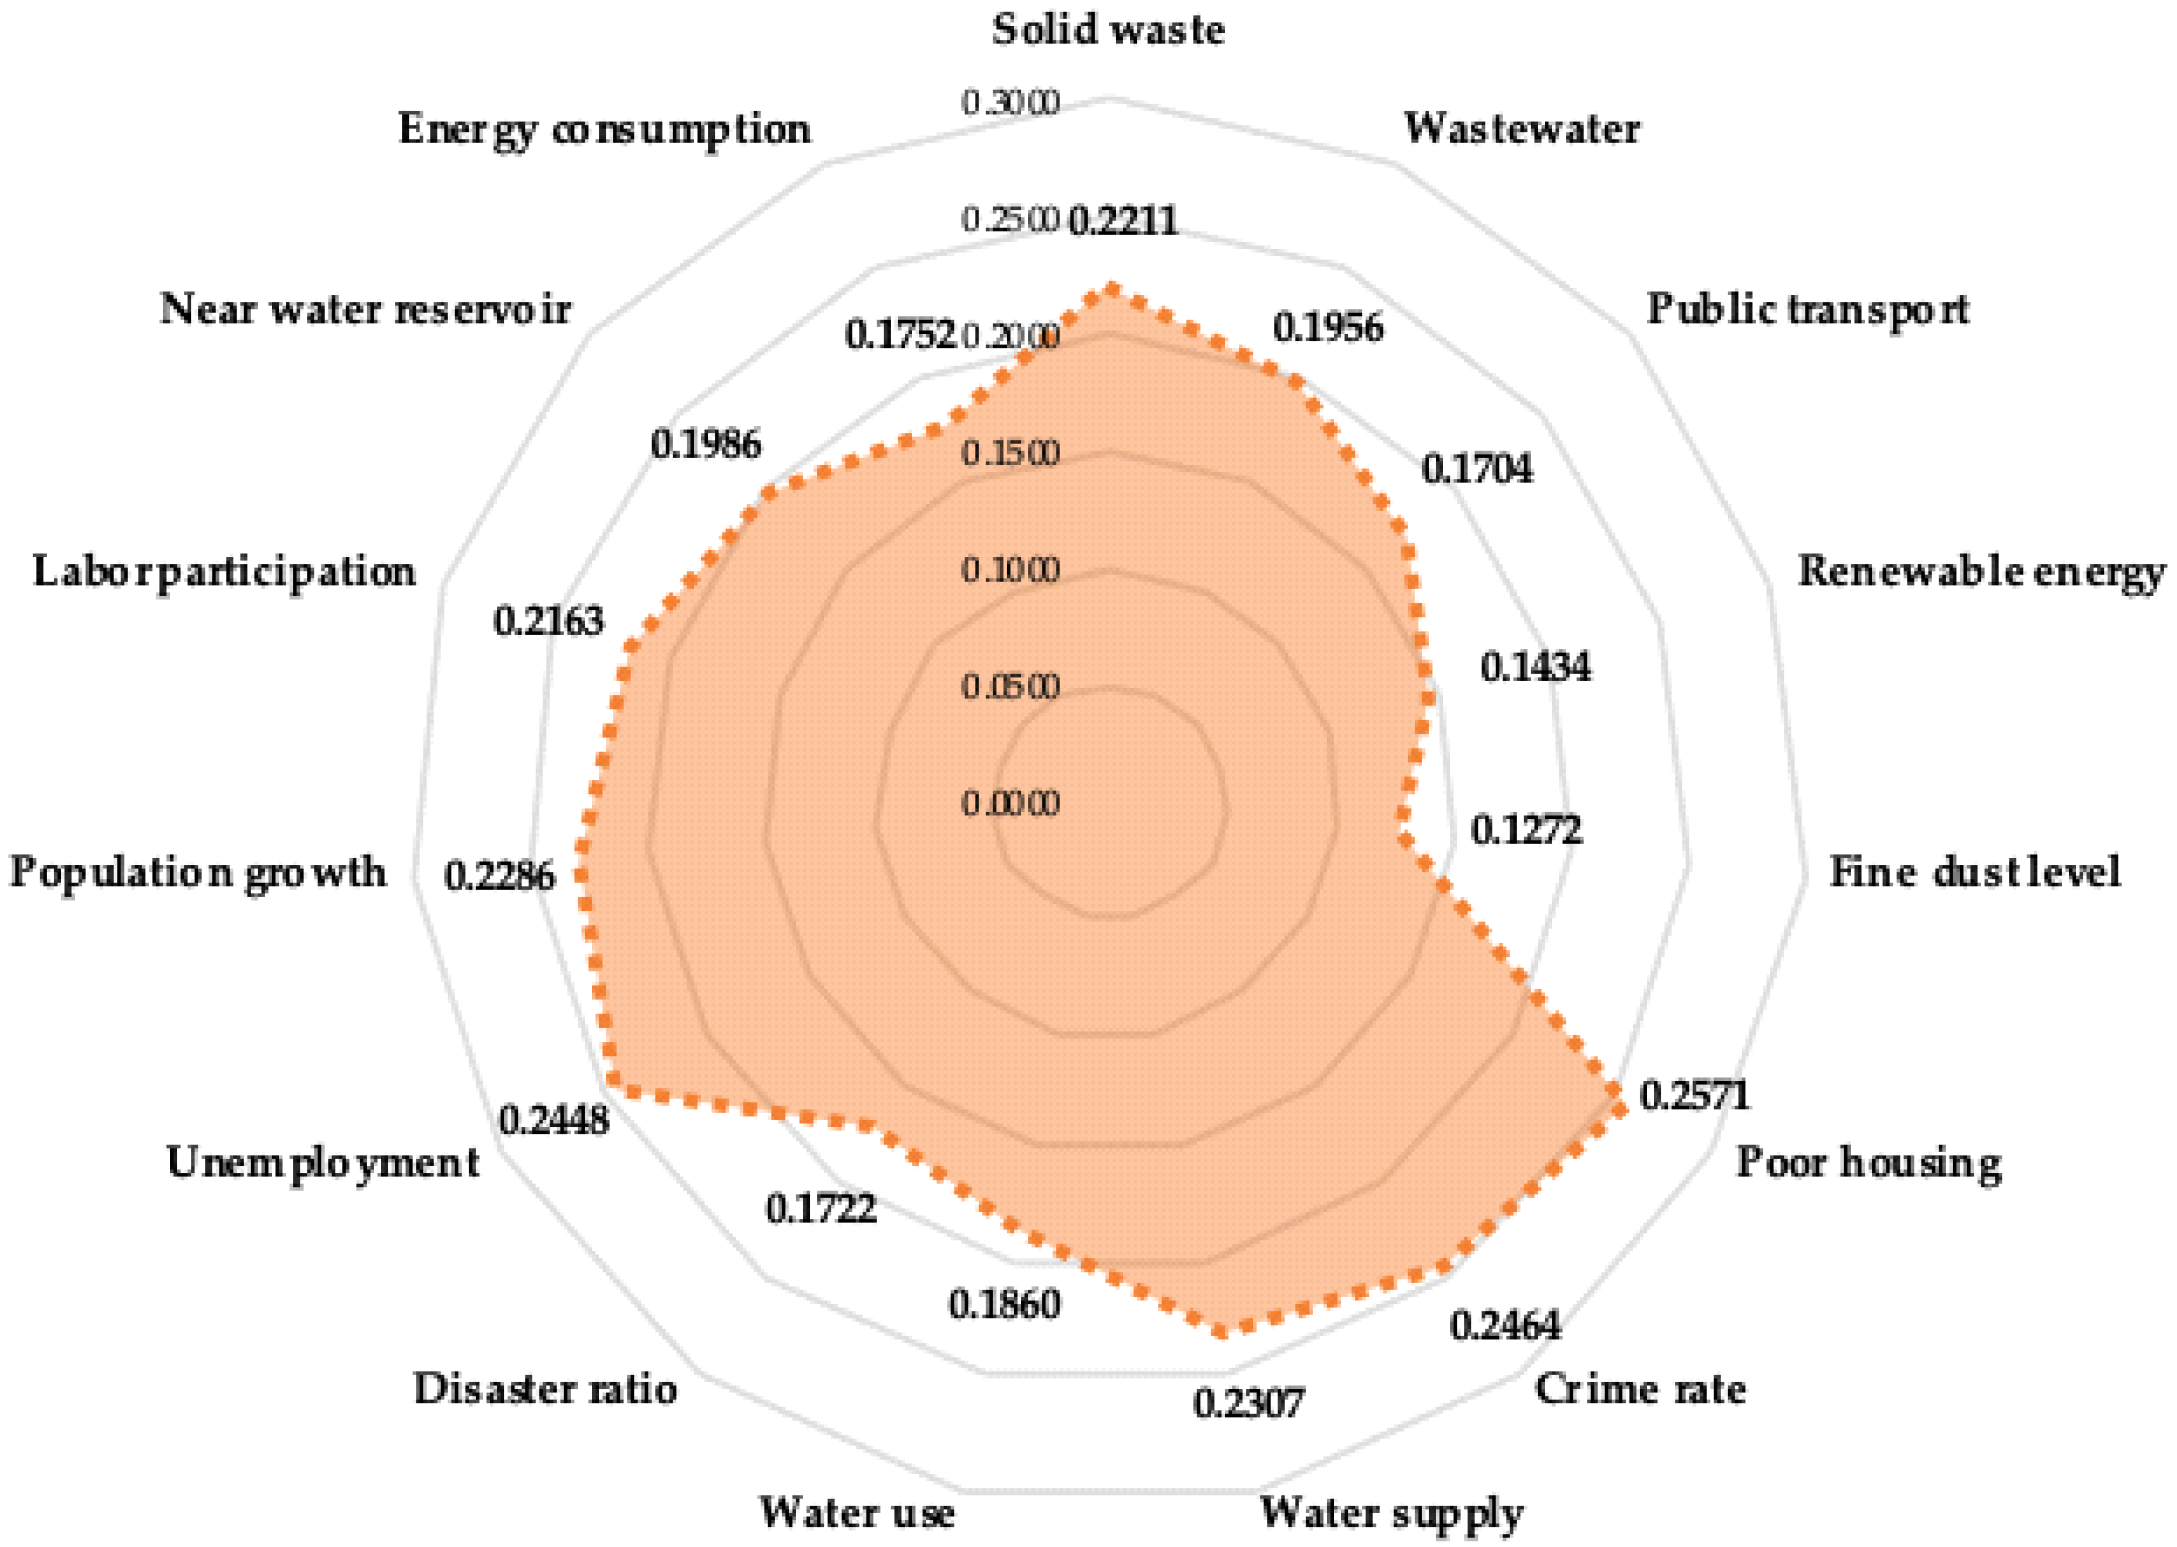
| Dimension | Indicator | Standard |
|---|---|---|
| Environmental | Solid waste | 0.2211 |
| Wastewater | 0.1956 | |
| Public transport | 0.1704 | |
| Renewable energy | 0.1434 | |
| Fine dust level | 0.1272 | |
| Social | Poor housing | 0.2571 |
| Crime rate | 0.2464 | |
| Potable water supply | 0.2307 | |
| Water consumption | 0.1860 | |
| Disaster-affected ratio | 0.1722 | |
| Economic | Unemployment rate | 0.2448 |
| Population growth rate | 0.2286 | |
| Labor participation | 0.2163 | |
| Near water reservoir | 0.1986 | |
| Energy consumption | 0.1752 |
| Sustainability Dimension | City | Unweighted | Weighted | ||
|---|---|---|---|---|---|
| Total Score | Rank | Total Score | Rank | ||
| Environmental | Phnom Penh | 15 | 2 | 0.8866 | 3 |
| Siem Reap | 15 | 2 | 0.8204 | 4 | |
| Battambang | 15 | 2 | 0.8943 | 2 | |
| Poi Pet | 11 | 5 | 0.6141 | 5 | |
| Sihanoukville | 19 | 1 | 1.0730 | 1 | |
| Social | Phnom Penh | 15 | 3 | 1.1098 | 3 |
| Siem Reap | 15 | 3 | 1.0548 | 4 | |
| Battambang | 17 | 1 | 1.2681 | 1 | |
| Poi Pet | 12 | 5 | 0.8675 | 5 | |
| Sihanoukville | 17 | 1 | 1.1618 | 2 | |
| Economic | Phnom Penh | 16 | 2 | 1.1229 | 2 |
| Siem Reap | 11 | 5 | 0.8138 | 5 | |
| Battambang | 13 | 4 | 0.9217 | 4 | |
| Poi Pet | 15 | 3 | 1.0435 | 3 | |
| Sihanoukville | 20 | 1 | 1.4156 | 1 | |
© 2020 by the author. Licensee MDPI, Basel, Switzerland. This article is an open access article distributed under the terms and conditions of the Creative Commons Attribution (CC BY) license (http://creativecommons.org/licenses/by/4.0/).
Share and Cite
Chan, P. Assessing Sustainability of the Capital and Emerging Secondary Cities of Cambodia Based on the 2018 Commune Database. Data 2020, 5, 79. https://doi.org/10.3390/data5030079
Chan P. Assessing Sustainability of the Capital and Emerging Secondary Cities of Cambodia Based on the 2018 Commune Database. Data. 2020; 5(3):79. https://doi.org/10.3390/data5030079
Chicago/Turabian StyleChan, Puthearath. 2020. "Assessing Sustainability of the Capital and Emerging Secondary Cities of Cambodia Based on the 2018 Commune Database" Data 5, no. 3: 79. https://doi.org/10.3390/data5030079
APA StyleChan, P. (2020). Assessing Sustainability of the Capital and Emerging Secondary Cities of Cambodia Based on the 2018 Commune Database. Data, 5(3), 79. https://doi.org/10.3390/data5030079