Abstract
Active mobility, especially cycling, is an essential building block for sustainable urban mobility. Public and private stakeholders are striving to improve conditions for cycling and subsequently increase its modal share. Data are regarded as key for different measures to become efficient and targeted. There is extensive evidence for an increasing amount of mobility data, availability of new data sources and potential usage scenarios for such data. However, little is known about the current use of these data in policy making, planning and related fields. To the best of our knowledge, it has not been investigated yet to which degree professionals in the broader field of cycling promotion benefit from an increasing amount of cycling-related data. Thus, we conducted a multi-lingual online survey among domain professionals and acquired data on their perspectives on current data availability, use and suitability as well as the potential they see for the use of cycling data in the future. In total, we received 325 complete responses from 32 countries, with the vast majority of 241 valid responses originating from Germany, Austria and Italy. Key findings are: 84% of domain professionals attribute high importance to data, and 89% state that they currently cannot or only partly solve their tasks with the data available to them. Results emphasize the need for making more and better suited data available to professionals in cycling-related positions, in both the private and public sector.
Dataset License: CC-BY 4.0
1. Background and Motivation
Awareness of the role of sustainable mobility with regard to climate goals and livability is constantly growing. However, the potential of walking and cycling cannot be fully unlocked in many cases, due to car-centric urban planning and infrastructure design. In order to make sustainable mobility more visible and to provide a sound evidence base for decision and planning processes, data on cycling and walking mobility are of crucial importance.
Various technological developments such as advances in sensor technology, internet of things and smart devices have enabled opportunities for mobile data acquisition. Paired with an increased uptake and acceptance of these technologies in society and their frequent application by a large number of users, this led to growing amounts of data being generated. Currently, no weakening of this trend has been observed, thus resulting in data volumes not manageable by conventional means [1]. New opportunities, driven by technological advancements, are widely anticipated in the context of smart cities, transport research and urban mobility [2,3,4,5]. Following the growing amount of mobility data being collected by various stakeholders, high expectations are attributed to their potential for policy makers and planners in the context of active mobility, especially cycling. Lee and Sener recently reviewed traditional and emerging data sources for cycling and walking mobility and, in addition to generally increasing data availability, found several key challenges related to validity, sampling bias, privacy, lack of contextual information and data accessibility [6].
However, in contrast to this growing amount of data on cycling, Steenberghen et al. found that 60% of surveyed representatives of responsible national authorities from EU member states, Norway and Switzerland were not able to provide the average annual distance cycled per inhabitant at the national level [7]. Against the backdrop of a frequently cited data deluge [8], these findings appear counter-intuitive, especially when the high level of aggregation is taken into account. We thus hypothesize that although there exist vast amounts of mobility data, these data are not enough, not appropriate or not accessible to those cycling professionals who would require it for their daily tasks. To our knowledge, no previous research quantitatively estimated the gap between data demand and opportunities offered through data currently available to domain professionals. To fill this gap, we designed and conducted a multilingual online survey in summer 2020 that was distributed via professional networks in the domain of cycling mobility. The investigation of current and future data use and demand emerged as part of the research project “Bicycle Observatory” (https://bicycle-observatory.zgis.at, accessed on 30 September 2021), which aimed at fusing technical sensor data (such as trajectories and counting data) with social science data (e.g., from interviews and questionnaires) for deriving a multi-dimensional, spatially differentiated picture of cycling mobility [9].
2. Data Description
The presented dataset contains all completed responses to the online survey conducted in the period from 23 June 2020 to 31 August 2020. A total of 568 unique site visitors were registered, out of which 325 completed the survey (57%). We presume the high dropout rate resulted from the narrow definition of our target group and accordingly expert-oriented formulation of questions.
2.1. Survey Structure, Content and Design
The survey consisted of four sections, each focusing on a different aspect: (1) the individual (professional) background of respondents, (2) their current use of cycling data, (3) assessment of their current data use and (4) respondents’ wishes regarding future data access and use. A full reference of survey questions and pre-defined multiple-choice options is provided in Appendix B. In Table A1 (Appendix A), the individual fields (corresponding to questions in the survey and metadata) in the dataset are described.
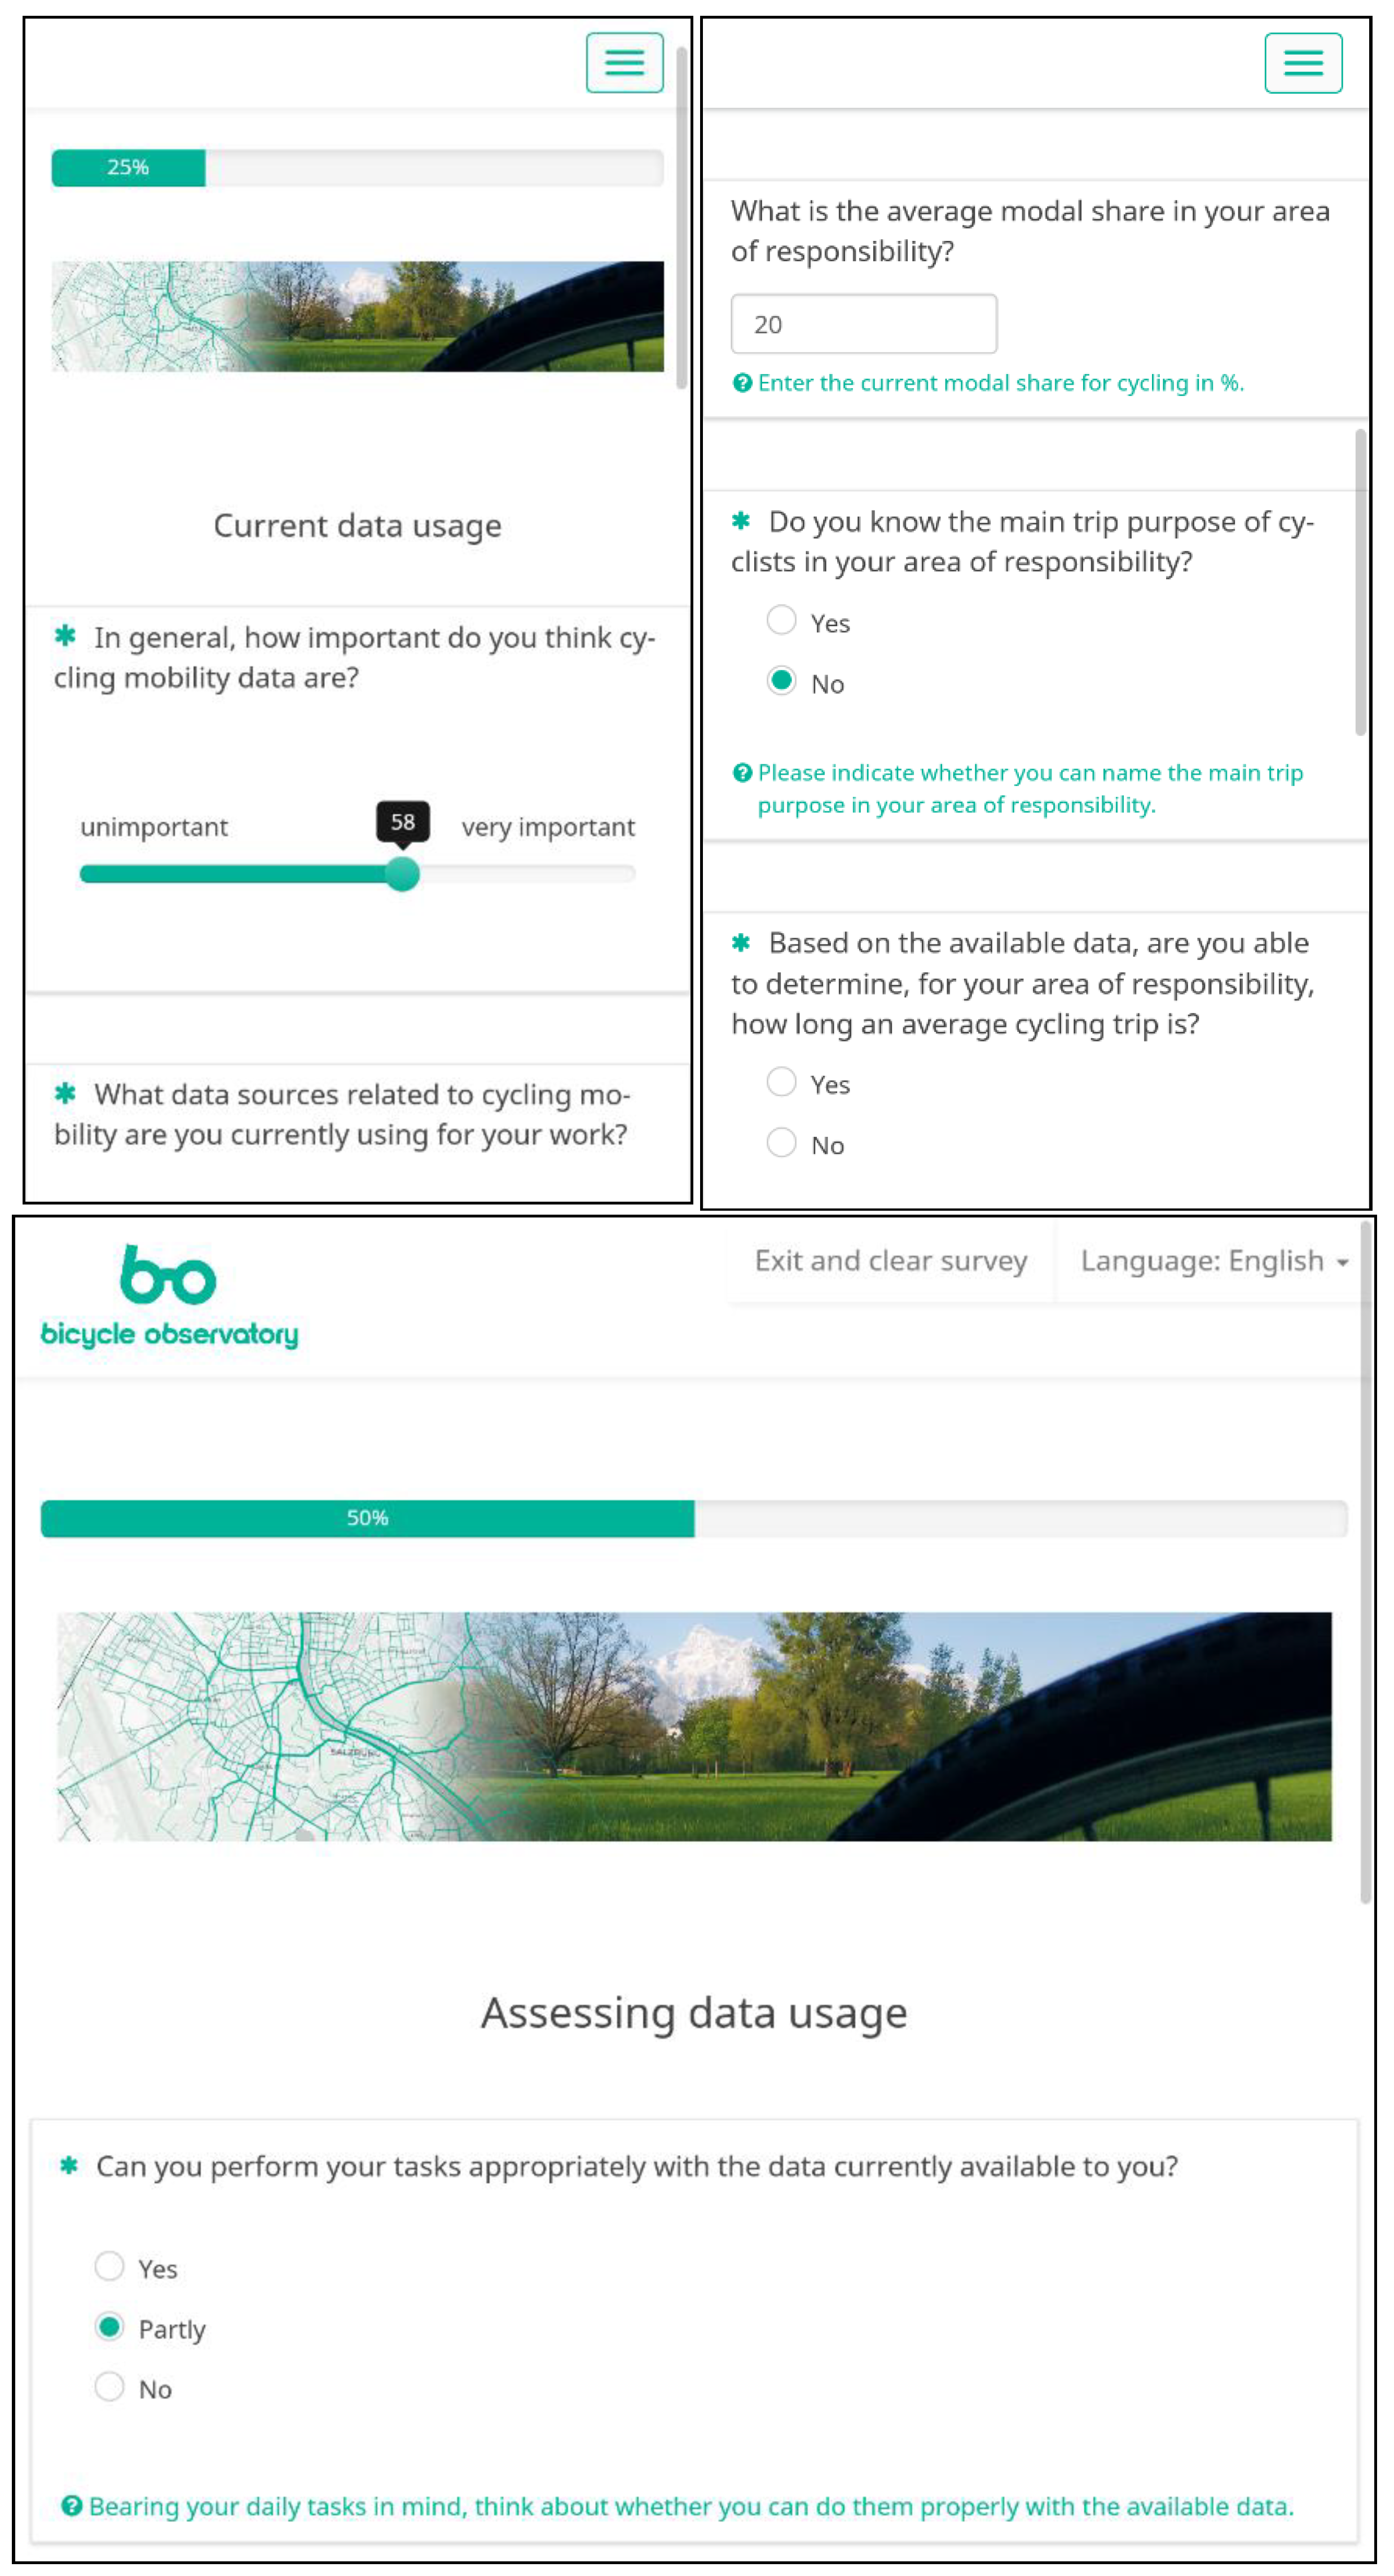
Figure 1 shows the responsive design of our online survey for different screen sizes. A reduced and clear design was utilized with unobtrusive application of key visuals and project color themes for optimum readability and usability.
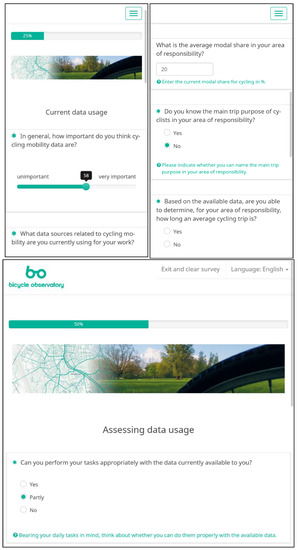
Figure 1.
Responsive survey design for mobile devices (top) and small desktop views (bottom).
2.2. Data Format
The data are provided in CSV format with fields separated by semicolon and encoding using UTF-8 charset (see https://doi.org/10.5281/zenodo.5705609 for data download). All survey text is in English language; only free text answers are included in original language as entered by respondents. The first row contains column headers denominating metadata fields and survey questions. Empty field data corresponds to no answer for that particular question. For questions with multiple choice options, each option is included as a separate column with binary status value (“Yes” or “No”). If the option “other” was given, the corresponding field contains the free text value provided by respondents in the original language.
2.3. Survey Respondents
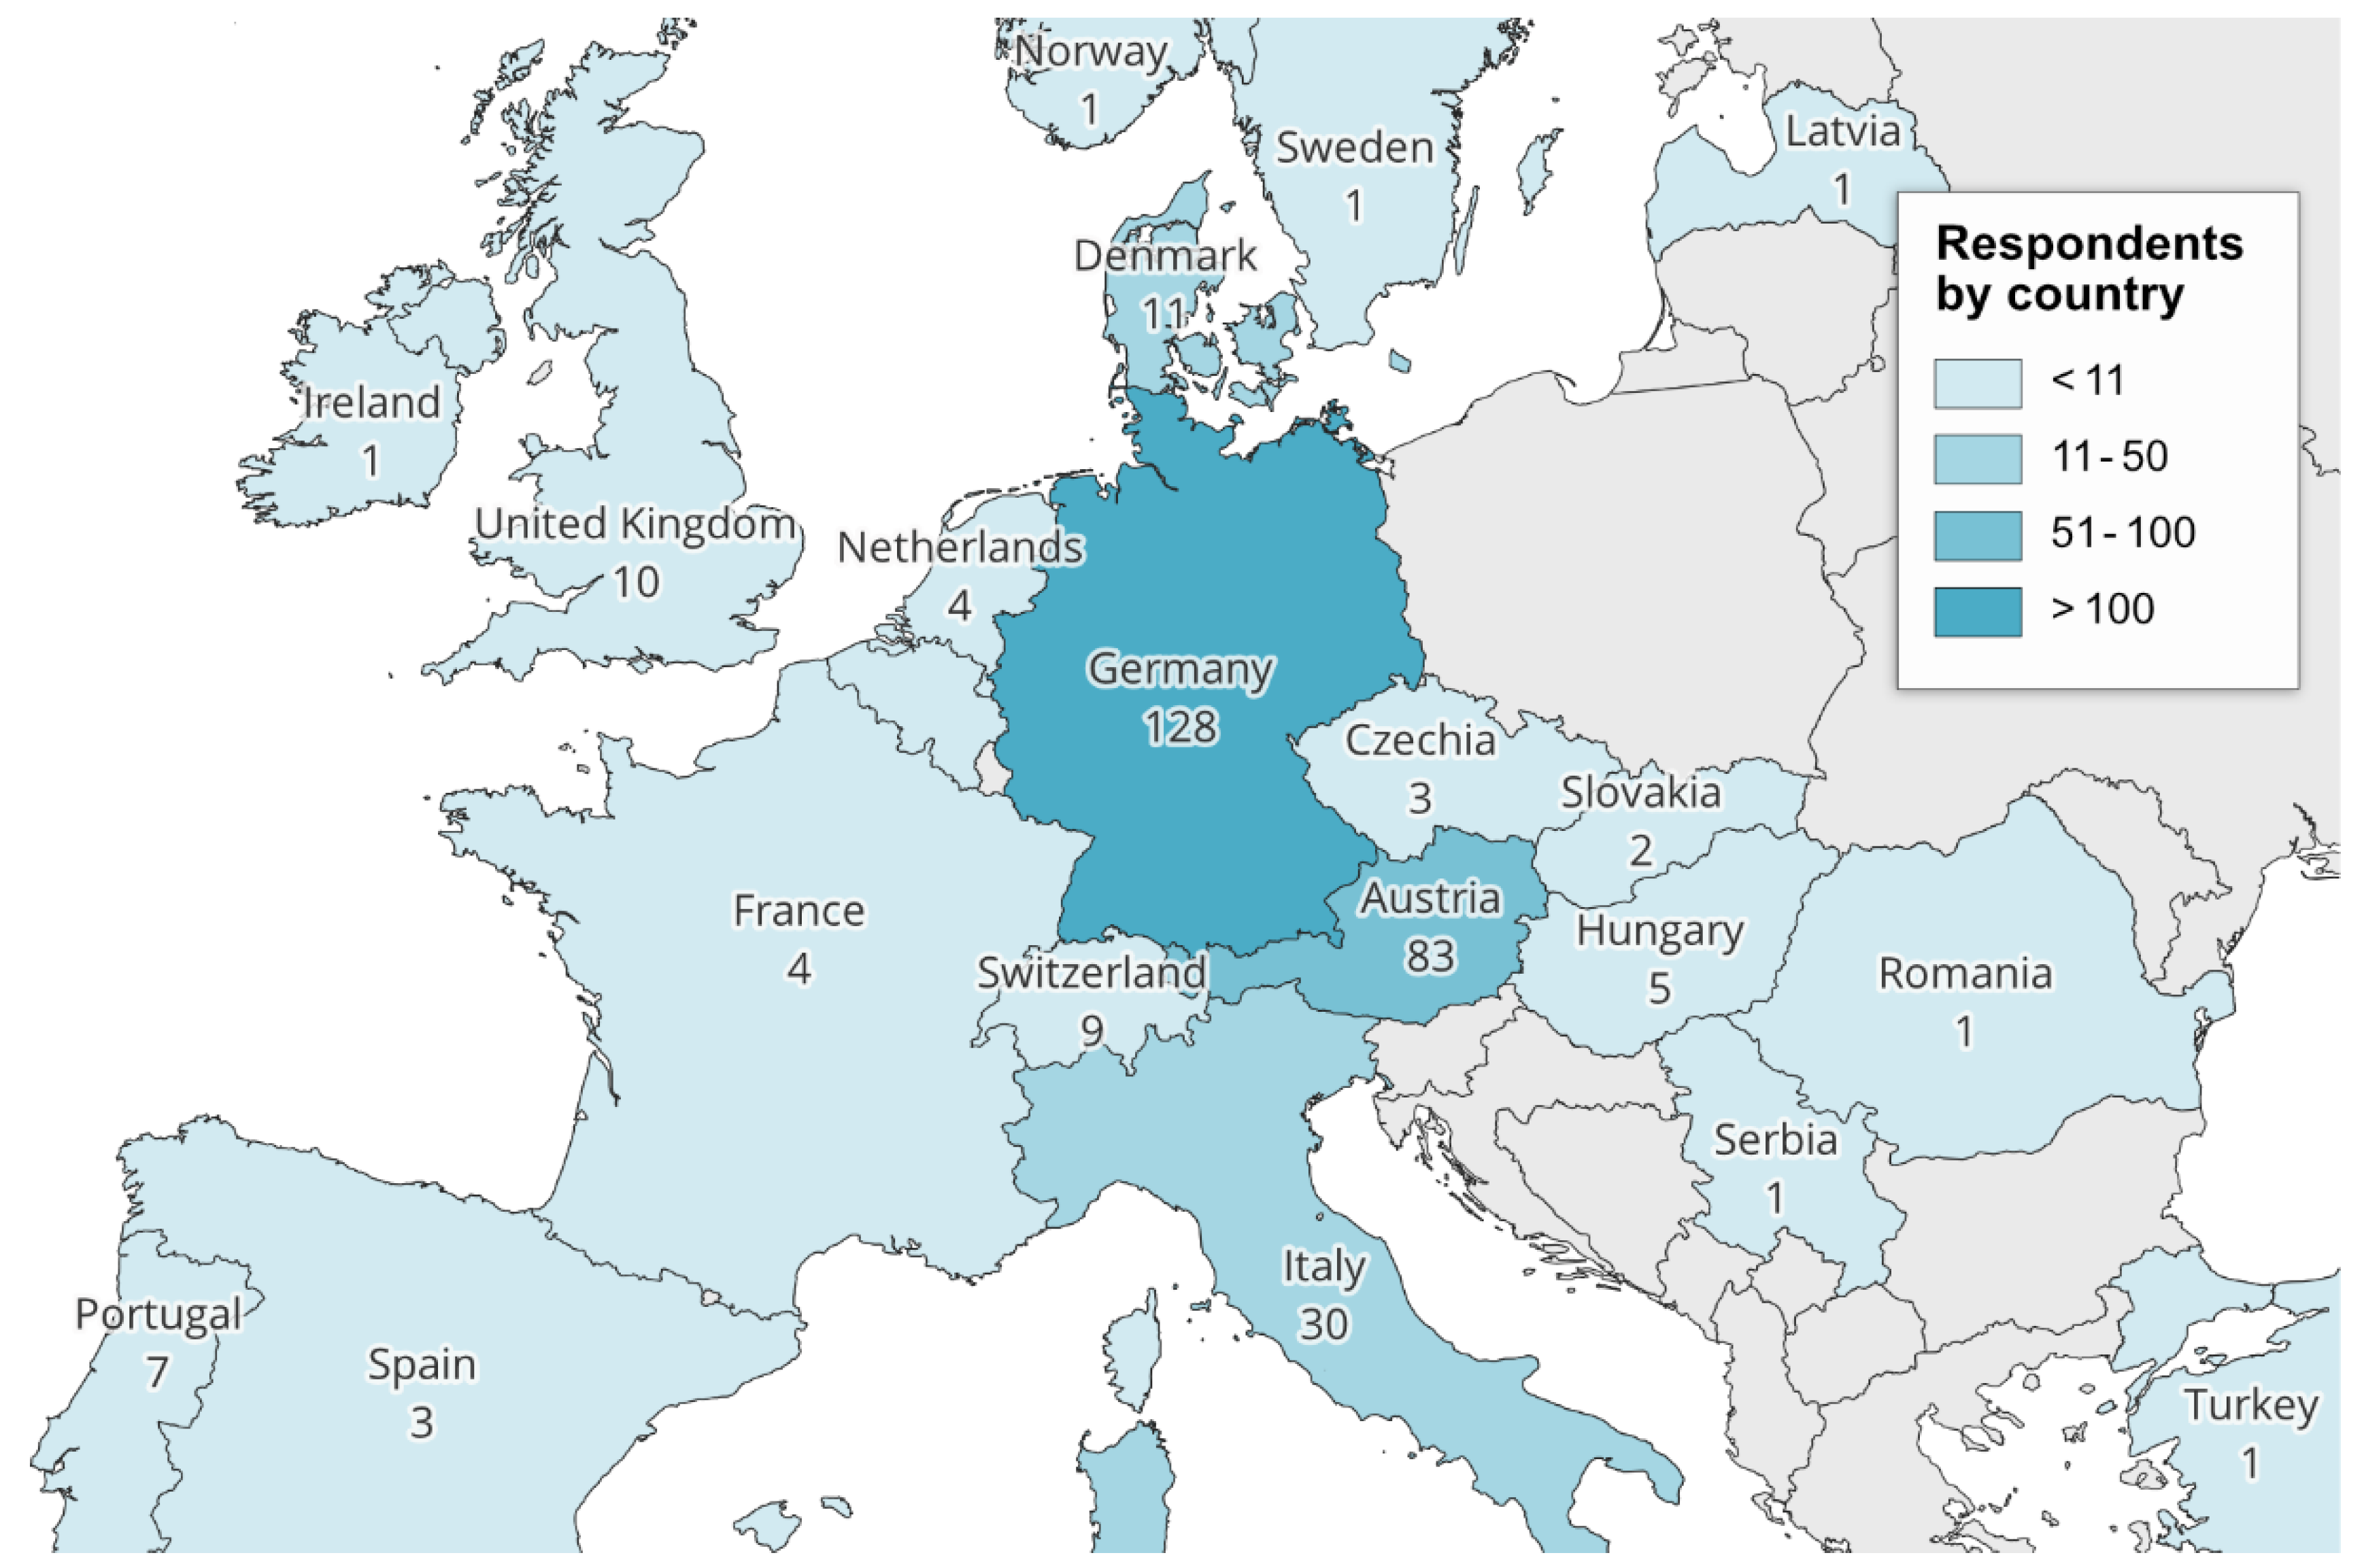
While responses from 32 different countries were registered, participation showed a European focus with respondents from Germany, Austria and Italy contributing 74.2% of all answers (for geographic distribution of respondents, see Figure 2). The majority of participants (36%) worked in public service, followed by the private sector (23%), academia (14%) and NGOs (11%). Respondents’ geographic scope of work was mainly local (35%, city or municipality) or regional (29.5%). Still, 19.4% stated a national and 16.0% an international scope of work.

Figure 2.
Geographic distribution of survey respondents.
The mean reported age was 45 years, with 87% of respondents belonging to an age group from 25 to 59 years. Gender distribution was biased towards male respondents who formed the majority of 65%, whereas female respondents contributed 34% of the answers.
2.4. Descriptive Statistics—Key Findings
Survey responses support the general perception that high importance is attributed to data on cycling mobility. Eighty-four percent of respondents rated the importance of cycling data with at least 80 out of 100 points, whereas merely 3% perceived the data as neutral or unimportant (equal to or below 60 points). Regarding current data availability and suitability, 75% of domain professionals stated they were only partly able to solve their tasks using the data available to them, with only 11% being fully able to solve their tasks, and 13% not able to solve them at all from data (see Figure 3).
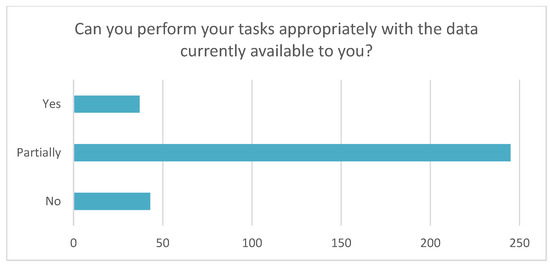
Figure 3.
Suitability of data for daily tasks of domain professionals.
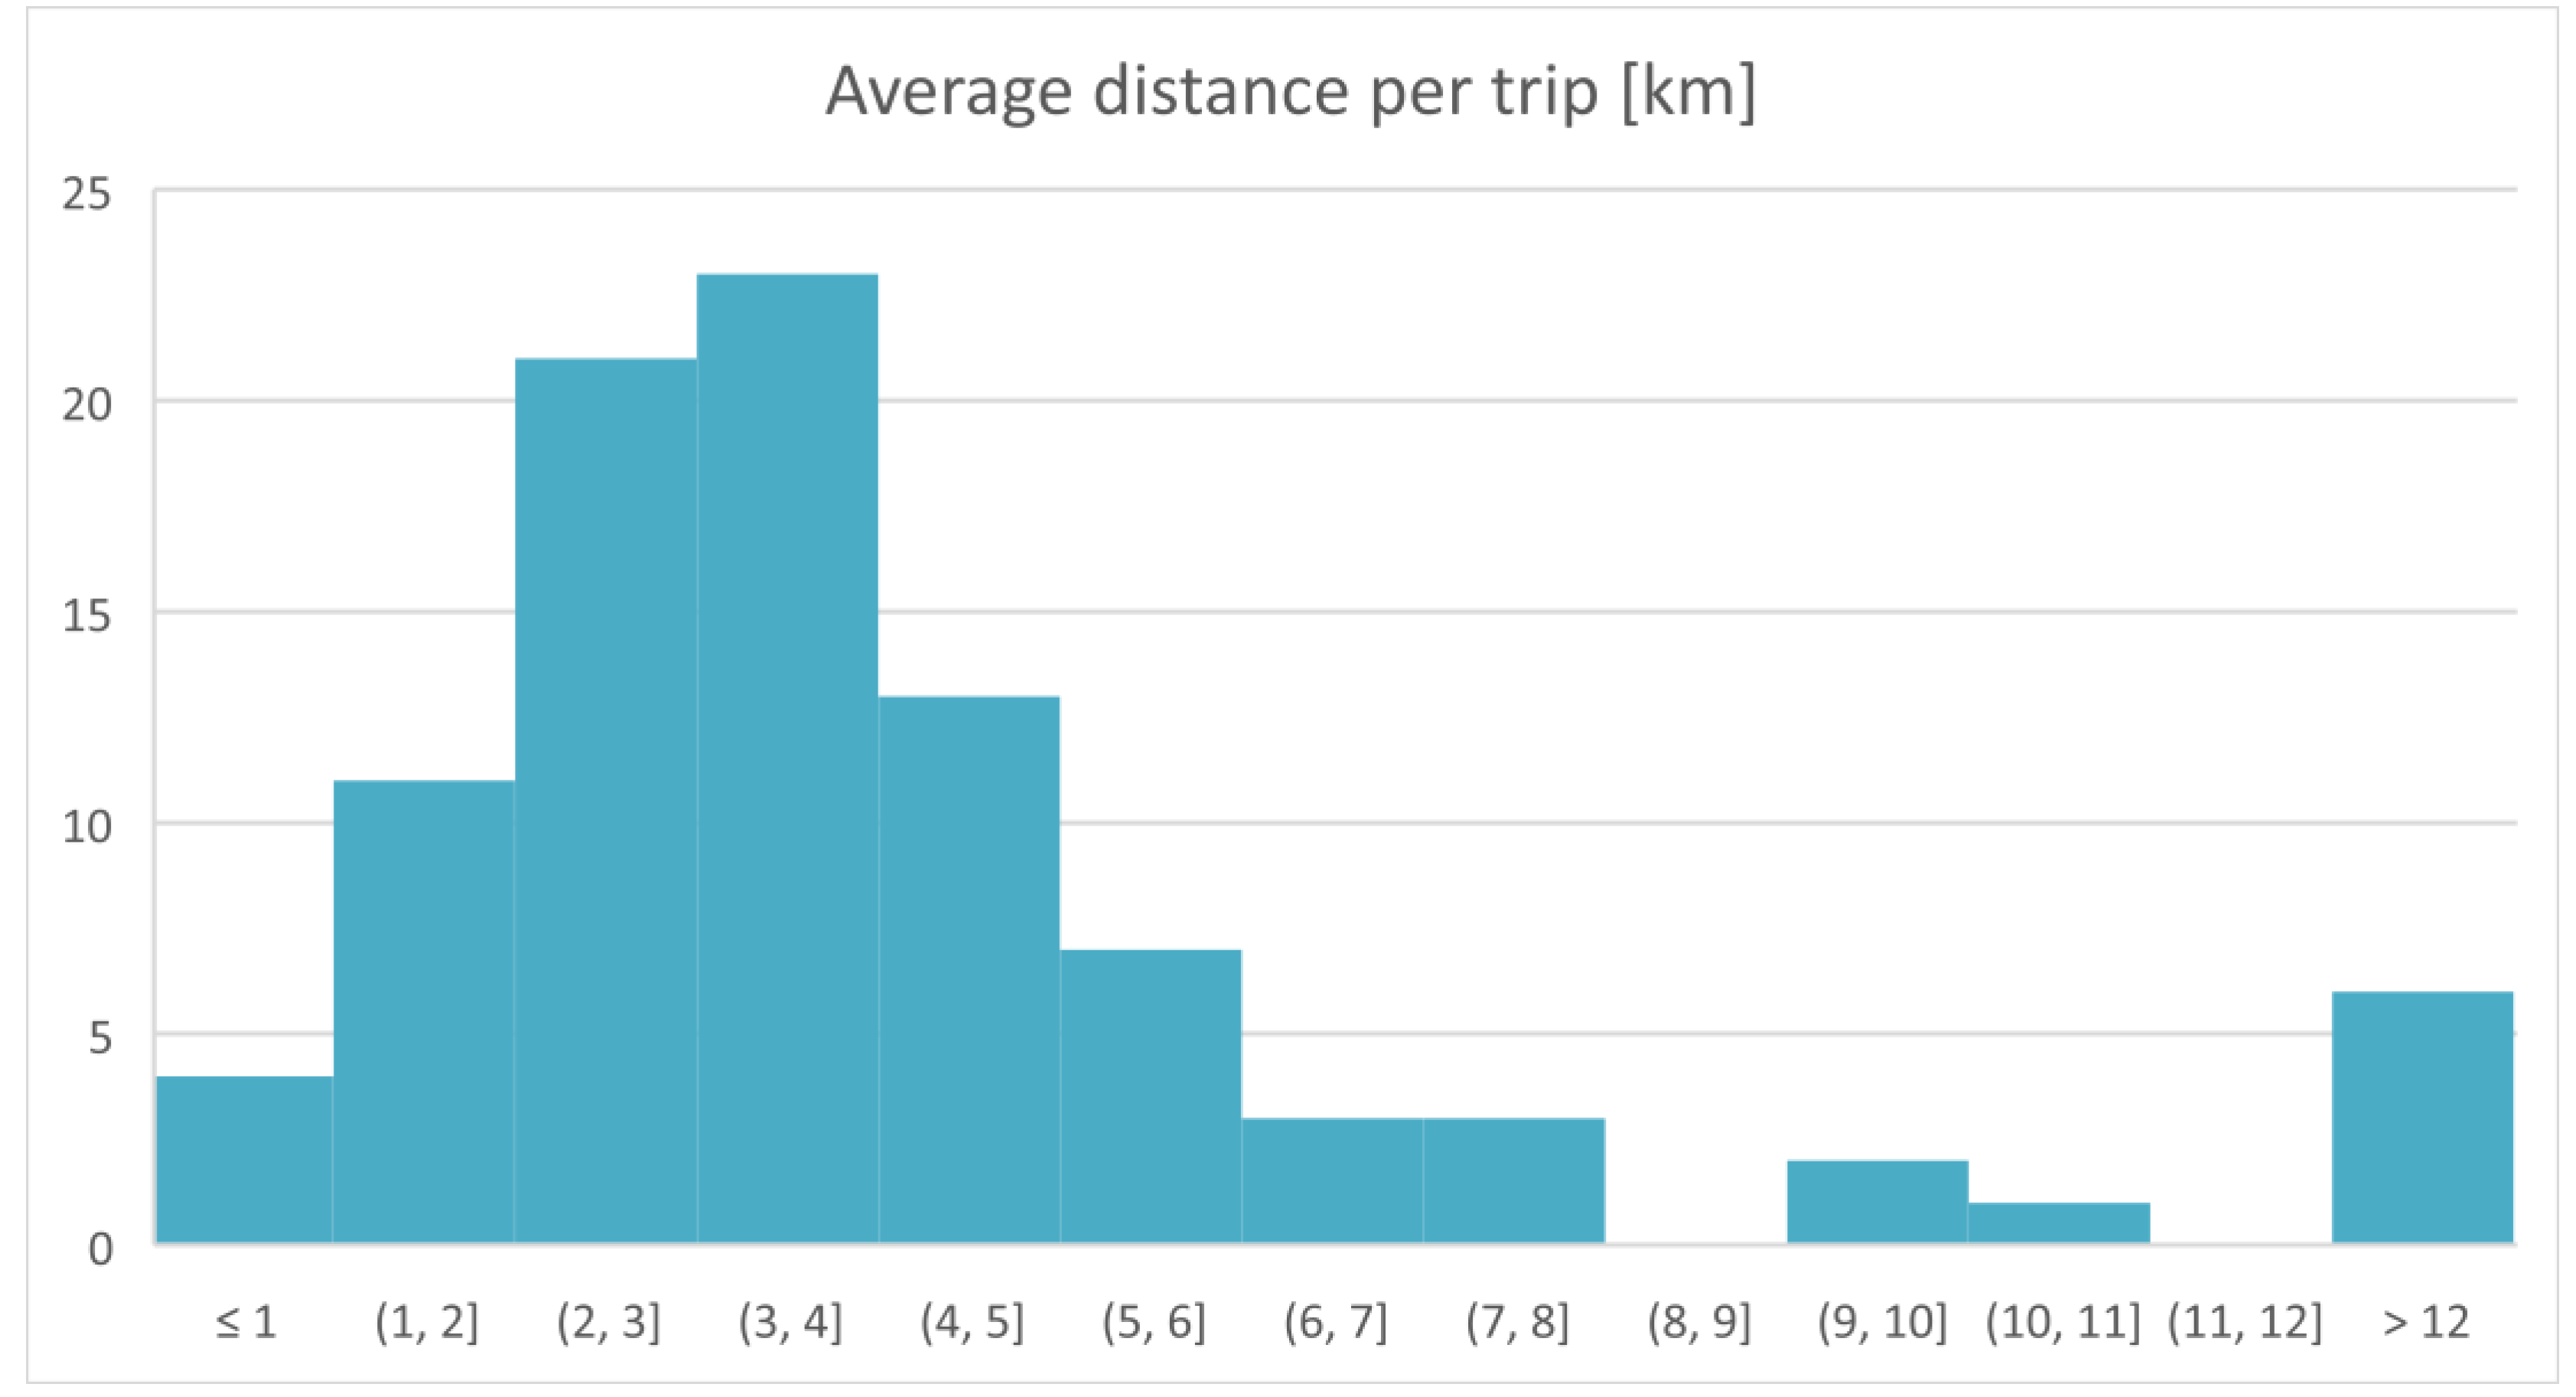
While 60% of respondents reported they were able to quantify the modal share of cycling for their area of responsibility, only 51% were able to state the main trip purpose based on available data. This number further decreases to only 31% of respondents being able to quantify the average travel distance per cycling trip. Reported numbers show high variation (see Figure 4 for variation in reported trip length as an example). This may partly be explainable by factual variation of the investigated indicators based on location and professional scope as well as by potential uncertainties resulting from data availability and methods applied for deriving trip length. These aspects require further research. Furthermore, different response patterns can be observed depending on participants’ country of origin. However, the sample sizes for single countries are too small for in-depth comparative analysis.

Figure 4.
Histogram of reported average distance in km traveled per cycling trip within respondents’ area of responsibility.
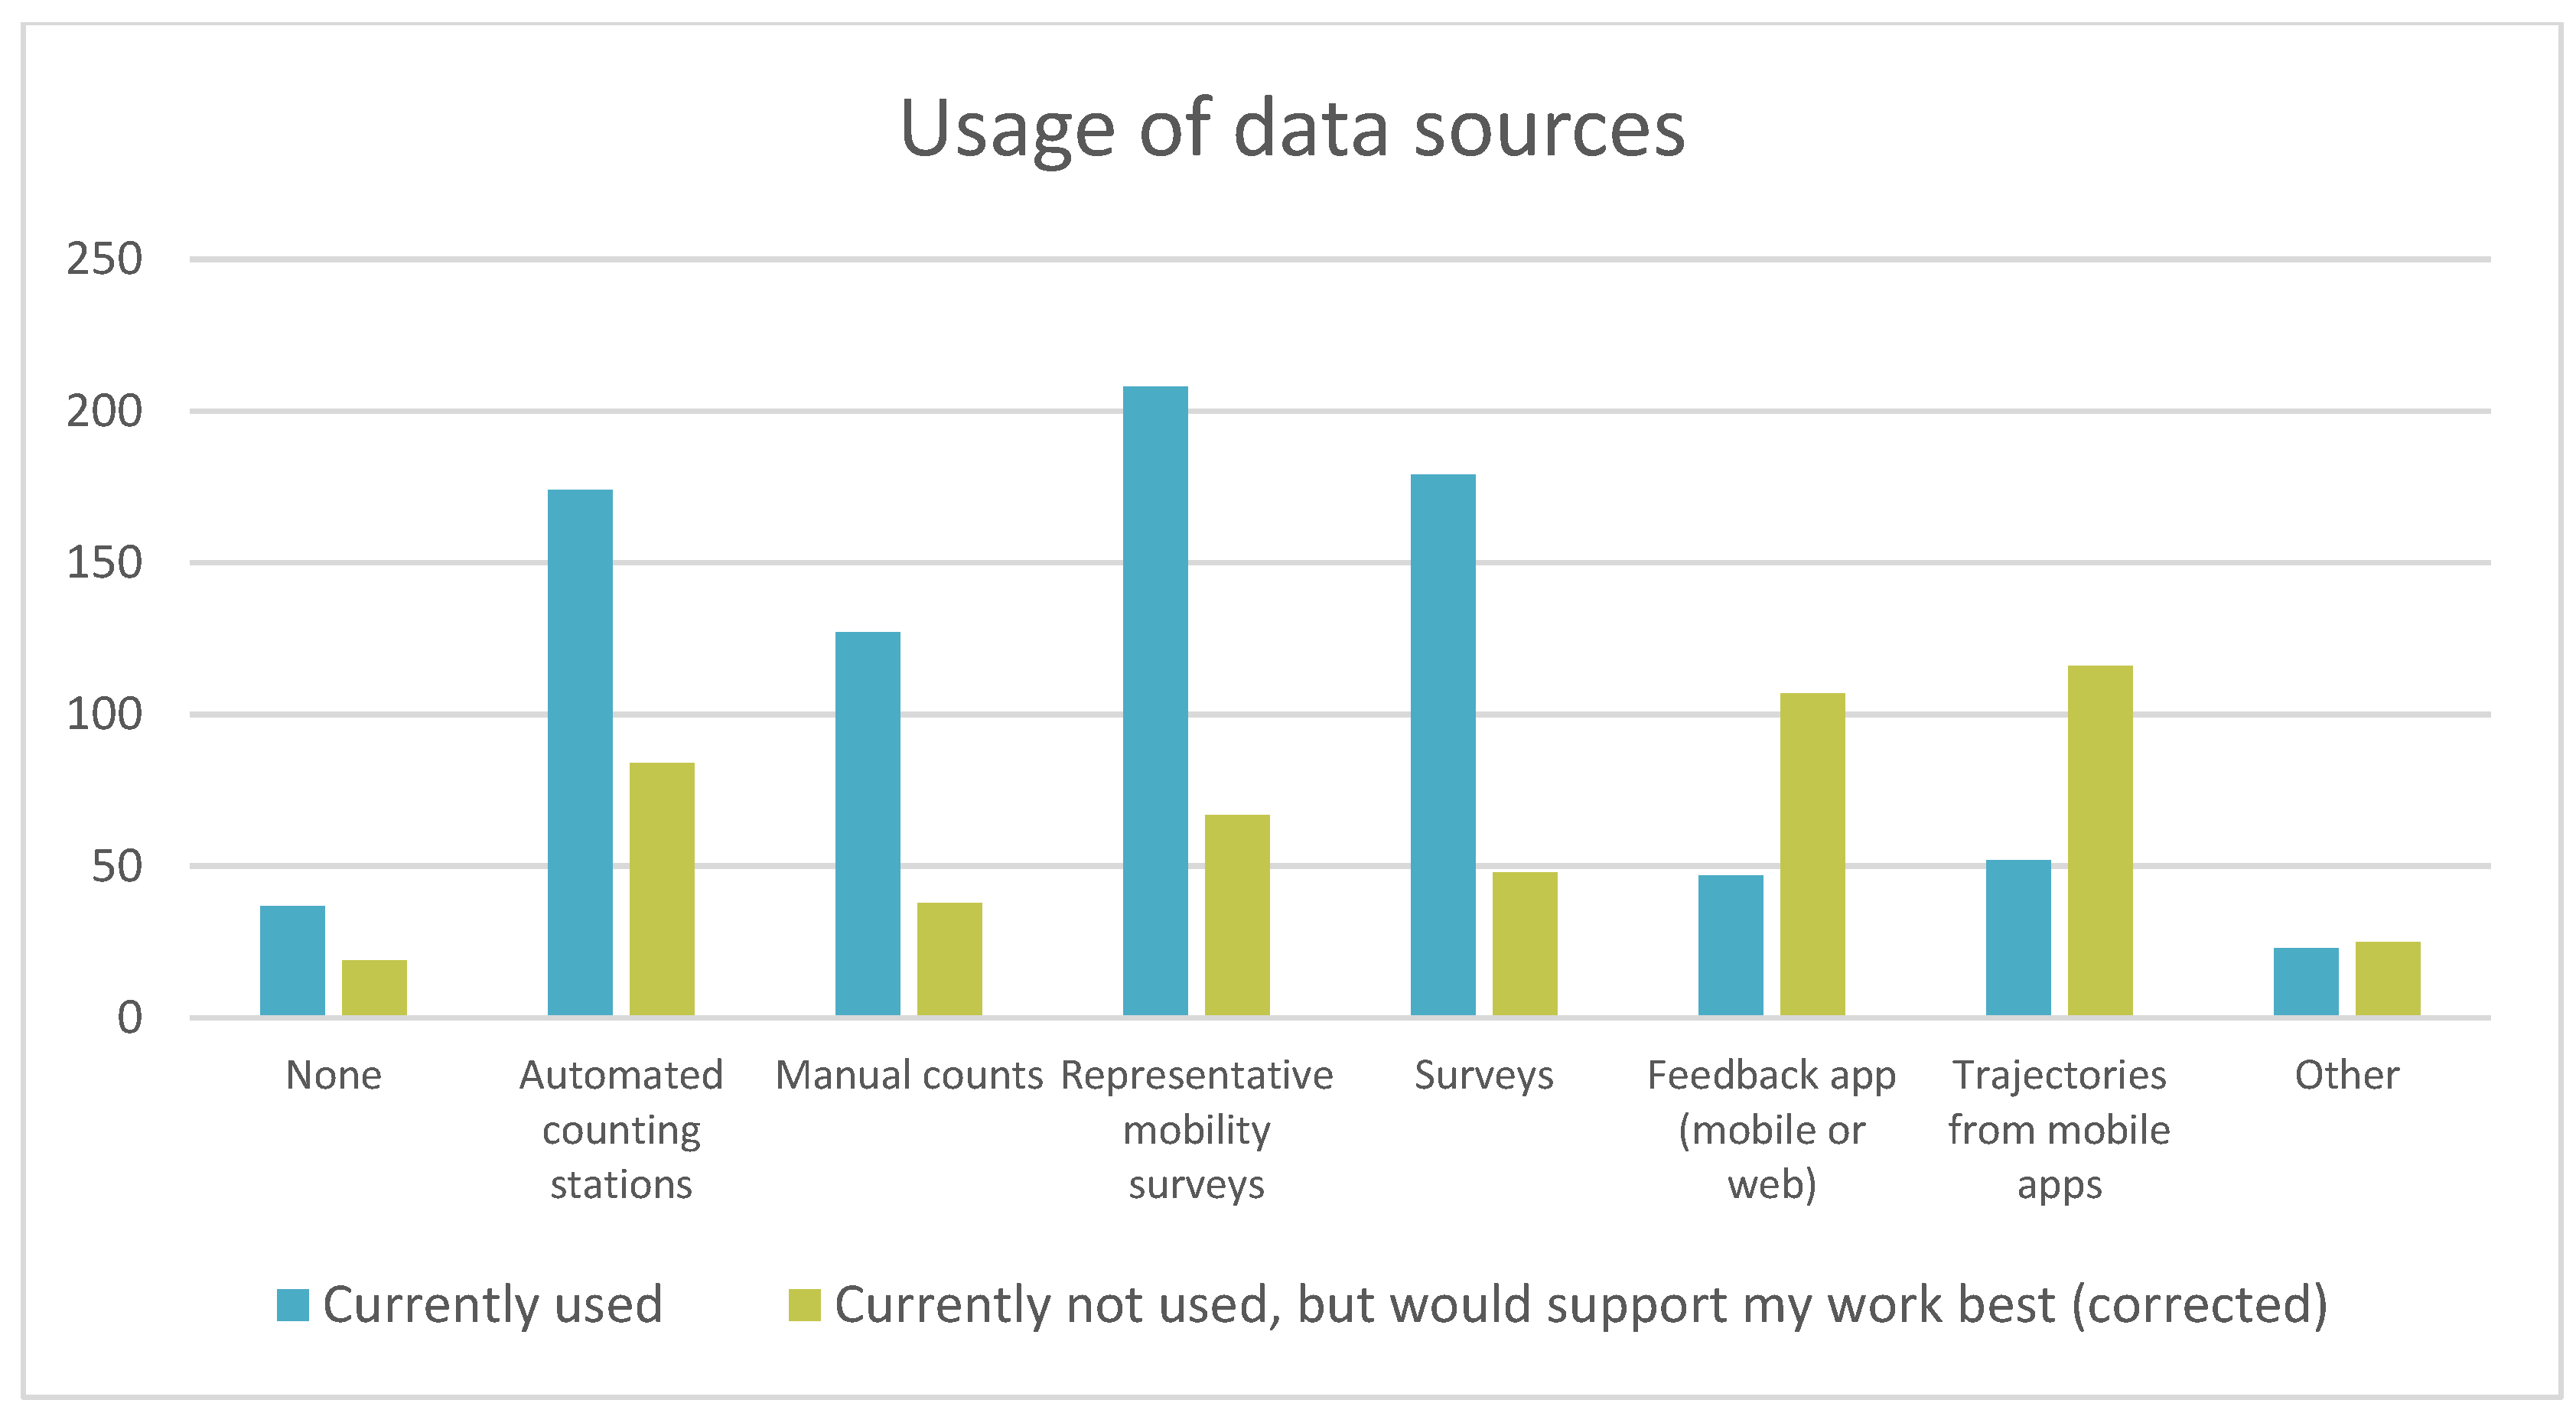
Regarding current data usage, we observed a focus on traditional data sources, whereas high potential was attributed to emerging data sources for the future, as visualized in Figure 5.
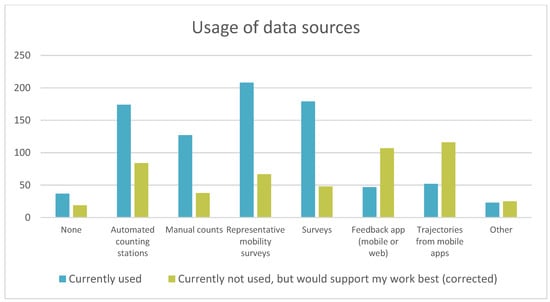
Figure 5.
Current use of data sources and attributed potential for the future.
Overall, survey responses indicated a gap between the need for cycling data and their current availability and suitability for domain professionals to fulfill their daily tasks in the domain of cycling mobility.
3. Methods
We designed and launched an open snowball survey in six different languages, in order to reach a maximum number of experts for our data acquisition. It consisted of 19 questions divided into four sections. Most questions were set to be obligatory for obtaining comprehensive results. Such obligatory questions were marked with a ‘*’ in the question overview provided in Appendix B. Starting from the German base version, the survey was translated into English, Italian, Dutch, Russian, and Spanish languages by native speakers.
The target group was clearly defined to be domain professionals in planning, politics, the private sector and research within the field of cycling mobility. We invited multipliers from our professional network to distribute the invitation for the online survey among their peers and used national and international mailing lists and social media channels for promoting the survey. There was no technical restriction on survey access, while introductory text and domain-specific questions clearly addressed the aforementioned target group. This approach was chosen in order to offer easy access and to preserve the privacy of participants. However, as a result, the survey data cannot be representative for countries and domains.
For technical implementation of the online survey, we used an instance of the open-source survey software LimeSurvey [10] hosted on infrastructure by the University of Salzburg. It allowed for providing direct web links to specific language versions while retaining the option to manually change the language within the web frontend. For ease of use and recognition value, a simplistic responsive frontend design with minimal project branding was utilized. Screenshots can be found in Appendix A.
Data were exported from our survey webserver in CSV format. Prior to publication, only minor processing was applied to the data: Errors in CSV structure due to CSV separator characters present in free text fields were corrected, and missing century information for participants’ birth years was added. Furthermore, we removed incomplete answers from participants who quit the survey before final submission and excluded internal metadata fields from the dataset. As the field “as_num_trip_length” contained numerous implausible values for average length of bicycle trips, the derived column “as_num_trip_length_corr” was added. It comprises original values converted to integers and values below 50 m multiplied by 1000 in order to represent kilometers. As data showed inconsistencies regarding answers to question 17 (future data sources that currently cannot be accessed) when compared to answers to question 7 (current sources used), we introduced new columns “future_sources_corr_<name>” with answers to question 17 set to “No”, where the corresponding answer to question 7 was “Yes” (except for option “None”).
4. Conclusions
The data from this survey provide valuable insights into how cycling-related data are currently used by professionals. Although an increasing number of data sources have emerged in recent years, and the benefits of data among professionals are evident, we found a gap between current practice and demands. High importance was attributed to cycling data, while only 11% of respondents were able to completely fulfill their daily tasks based on data. Apart from this, we regard this dataset as an important contribution to the discussion on a frequently stated data deluge on the one hand and an experience of data scarcity in many everyday tasks on the other. The findings of this survey study underline the importance of a nuanced approach towards a prevalent data optimism in academia and the private sector. The published dataset serves as a starting point for further investigations of national differences, current practices and demands at various levels of responsibility and of opportunities for translating existing data pools into value creation where data are needed. Future research could benefit from a systematic, representative assessment with balanced contributions at a global scale. Furthermore, assessing the quality of available data appears to be another important research direction.
The lack of suitable and accessible data, which we found as a key result in this study, impedes the implementation of effective and efficient measures for promoting active, sustainable mobility. The results of the survey indicate the benefit of sound data and an evidence basis, respectively, in planning, designing, monitoring and management tasks. Against this backdrop, we call for systematic data generation and provision, as well as for concepts and feasible implementation routines for data fusion and secondary data use.
Author Contributions
C.W. was involved in setup of the online survey, processed the dataset and wrote the manuscript. M.L., project leader of “Bicycle Observatory”, was involved in conceptualization of the survey, set up the online survey and contributed to the manuscript. All authors have read and agreed to the published version of the manuscript.
Funding
The Project Bicycle Observatory (FFG Nr. 865176) is co-funded by the Austrian Ministry for Transport, Innovation and Technology (BMVIT) under the program “Mobility of the Future”. The following partners are involved in the project: (1) University of Salzburg, Department of Geoinformatics–Z_GIS (coordinator), (2) Salzburg Research Forschungsgesellschaft m.b.H., (3) Helios, and (4) PRISMA solutions EDV-Dienstleistungen GmbH.
Data Availability Statement
Data are available at https://doi.org/10.5281/zenodo.5705609.
Acknowledgments
The authors appreciate the great support of Steve Colvin (English), Lorena Abad (Spanish), Luuk van Meer (Dutch), Dana Kaziyeva (Russian) and Patrick Kofler (Italian), who translated the survey. Furthermore, the help of Christian Seekircher, who provided the technical infrastructure for the online survey, is greatly acknowledged.
Conflicts of Interest
The authors declare no conflict of interest. The funders had no role in the design of the study, in the collection, analyses, or interpretation of data, in the writing of the manuscript, or in the decision to publish the results.
Appendix A

Table A1.
Description of dataset fields.
Table A1.
Description of dataset fields.
| Section | Question No. | Question Type | Field ID | Datatype |
|---|---|---|---|---|
| Metadata | - | - | response_id | Integer |
| Metadata | - | - | date_submitted | Date and Time [DD.MM.YYYY HH:mm] |
| Metadata | - | - | start_language | String |
| 1 | 1 * | single choice options + other | field_of_work | String (defined items) |
| 1 | 1 * | single choice options + other | field_of_work_other | String (free text) |
| 1 | 2 * | single choice options | geo_scope | String (defined items) |
| 1 | 3 * | single choice options | country | String (defined items) |
| 1 | 4 * | single choice options | gender | String (defined items) |
| 1 | 5 * | value input | year_of_birth | Integer |
| 2 | 6 * | slider (0–100) | data_importance | Integer [%] |
| 2 | 7 * | multiple choice + other | current_source_none | String/Boolean [Yes/No] |
| 2 | 7 * | multiple choice + other | current_source_rep_mobility _surveys | String/Boolean [Yes/No] |
| 2 | 7 * | multiple choice + other | current_source_manual_counts | String/Boolean [Yes/No] |
| 2 | 7 * | multiple choice + other | current_source_automated _counts | String/Boolean [Yes/No] |
| 2 | 7 * | multiple choice + other | current_source_surveys | String/Boolean [Yes/No] |
| 2 | 7 * | multiple choice + other | current_source_feedback_app | String/Boolean [Yes/No] |
| 2 | 7 * | multiple choice + other | current_source_app_traj | String/Boolean [Yes/No] |
| 2 | 7 * | multiple choice + other | current_source_other | String (free text) |
| 2 | 8 * | multiple choice + other | current_task_none | String/Boolean [Yes/No] |
| 2 | 8 * | multiple choice + other | current_task_infra_planning | String/Boolean [Yes/No] |
| 2 | 8 * | multiple choice + other | current_task_measure_eval | String/Boolean [Yes/No] |
| 2 | 8 * | multiple choice + other | current_task_particip | String/Boolean [Yes/No] |
| 2 | 8 * | multiple choice + other | current_task_monitoring | String/Boolean [Yes/No] |
| 2 | 8 * | multiple choice + other | current_task_communication | String/Boolean [Yes/No] |
| 2 | 8 * | multiple choice + other | current_task_research | String/Boolean [Yes/No] |
| 2 | 8 * | multiple choice + other | current_task_other | String (free text) |
| 3 | 9 * | single choice options | as_data_appropriate | String (defined items) |
| 3 | 10 * | single choice options | as_know_share | String/Boolean [Yes/No] |
| 3 | 11 | numeric input | as_num_share | Float [%] |
| 3 | 12 * | single choice options | as_know_trip_purpose | String/Boolean [Yes/No] |
| 3 | 13 * | single choice options + other | as_main_trip_purpose | String (defined items) |
| 3 | 13 * | single choice options + other | as_main_trip_purpose_other | String (free text) |
| 3 | 14 * | single choice options | as_konw_trip_length | String/Boolean [Yes/No] |
| 3 | 15 | numeric input | as_num_trip_length | String (free text) |
| 3 | 15 | [derived from as_num_trip_length] | as_num_trip_length_corr | Integer [meters] |
| 3 | 16 * | single choice options + other | as_main_motivation | String (defined items) |
| 3 | 16 * | single choice options + other | as_main_motivation_other | String (free text) |
| 4 | 17 * | multiple choice + other | future_source_none | String/Boolean [Yes/No] |
| 4 | 17 * | multiple choice + other | future_source_rep_mobility_ surveys | String/Boolean [Yes/No] |
| 4 | 17 * | multiple choice + other | future_source_manual_counts | String/Boolean [Yes/No] |
| 4 | 17 * | multiple choice + other | future_source_automated_counts | String/Boolean [Yes/No] |
| 4 | 17 * | multiple choice + other | future_source_surveys | String/Boolean [Yes/No] |
| 4 | 17 * | multiple choice + other | future_source_feedback_app | String/Boolean [Yes/No] |
| 4 | 17 * | multiple choice + other | future_source_app_traj | String/Boolean [Yes/No] |
| 4 | 17 * | multiple choice + other | future_source_other | String (free text) |
| 4 | 18 * | multiple choice + other | future_task_none | String/Boolean [Yes/No] |
| 4 | 18 * | multiple choice + other | future_task_infra_planning | String/Boolean [Yes/No] |
| 4 | 18 * | multiple choice + other | future_task_measure_eval | String/Boolean [Yes/No] |
| 4 | 18 * | multiple choice + other | future_task_particip | String/Boolean [Yes/No] |
| 4 | 18 * | multiple choice + other | future_task_monitoring | String/Boolean [Yes/No] |
| 4 | 18 * | multiple choice + other | future_task_communication | String/Boolean [Yes/No] |
| 4 | 18 * | multiple choice + other | future_task_research | String/Boolean [Yes/No] |
| 4 | 18 * | multiple choice + other | future_task_other | String (free text) |
| Remarks | 19 | text input | remarks | String (free text) |
| 4 | 17 * | [derived columns] | future_source_corr_<name> | String/Boolean [Yes/No] |
* denotes compulsory questions.
Appendix B
A transcript of the full questionnaire is provided in the table below.
1. Which field are you currently working in? * (single choice)
|
| 2. What is the geographic scope of your current job? * (single choice) |
|
| 3. Which country are you currently working in? * (single choice) |
| < list of countries > |
| 4. You are … * (single choice) |
|
| 5. You were born in … * |
| < numeric input > (Please enter your year of birth.) |
| 6. In general, how important do you think cycling mobility data are? * |
| unimportant -------o------- very important |
| 7. What data sources related to cycling mobility are you currently using for your work? * (multiple choice) |
|
| 8. For which tasks are you currently using data on cycling mobility? * (multiple choice) |
|
| 9. Can you perform your tasks appropriately with the data currently available to you? * (single choice) |
|
| 10. Do you know the modal share of cycling in your area of responsibility (local, regional, national, international)? * (single choice) |
|
| 11. What is the average modal share in your area of responsibility? |
| < numeric input > (Enter the current modal share for cycling in %.) |
| 12. Do you know the main trip purpose of cyclists in your area of responsibility? * (single choice) |
|
| 13. To your knowledge, what is the main purpose for cycling in your area of responsibility? * (single choice) |
|
| 14. Based on the available data, are you able to determine, for your area of responsibility, how long an average cycling trip is? * (single choice) |
|
| 15. With regard to your area of responsibility, how long is the average distance cycled per trip? |
| < numeric input > (Please enter the average trip distance in meters.) |
| 16. What do you think is the main motivation for cyclists in your area of responsibility? * (single choice) |
|
| 17. Which data sources, which you currently cannot access, would support your work best? * (multiple choice) |
|
| 18. For which tasks would you like to use these additional data on cycling mobility? * (multiple choice) |
|
| 19. Would you like to tell us anything else? |
| < text input > (Please write your answer here.) |
References
- Batty, M. Big Data, Smart Cities and City Planning. Dialogues Hum. Geogr. 2013, 3, 274–279. [Google Scholar] [CrossRef] [PubMed]
- Kitchin, R. Big Data, New Epistemologies and Paradigm Shifts. Big Data Soc. 2014, 1, 2053951714528481. [Google Scholar] [CrossRef] [Green Version]
- Miller, H.J.; Shaw, S.-L. Geographic Information Systems for Transportation in the 21st Century. Geogr. Compass 2015, 9, 180–189. [Google Scholar] [CrossRef]
- Anda, C.; Erath, A.; Fourie, P.J. Transport Modelling in the Age of Big Data. Int. J. Urban Sci. 2017, 21, 19–42. [Google Scholar] [CrossRef]
- Milne, D.; Watling, D. Big Data and Understanding Change in the Context of Planning Transport Systems. J. Transp. Geogr. 2019, 76, 235–244. [Google Scholar] [CrossRef]
- Lee, K.; Sener, I.N. Emerging Data for Pedestrian and Bicycle Monitoring: Sources and Applications. Transp. Res. Interdiscip. Perspect. 2020, 4, 100095. [Google Scholar] [CrossRef]
- Steenberghen, T.; Tavares, T.; Richardson, J.; Himpe, W.; Crabbé, A. Support Study on Data Collection and Analysis of Active Modes Use and Infrastructure in Europe; Publications Office of the European Union; European Commission: Luxembourg, Cermany, 2017. [Google Scholar] [CrossRef]
- Bell, G.; Hey, T.; Szalay, A. Beyond the Data Deluge. Science 2009, 323, 1297–1298. [Google Scholar] [CrossRef] [PubMed]
- Loidl, M.; Wagner, A.; Kaziyeva, D.; Zagel, B. Bicycle Observatory–Eine Räumlich Differenzierte, Kontinuierliche Beobachtung Der Fahrradmobilität. AGIT J. Angew. Geoinformatik 2020, 6, 263–271. [Google Scholar]
- Limesurvey GmbH. LimeSurvey: An Open Source Survey Tool; LimeSurvey GmbH: Hamburg, Germany, 2003. [Google Scholar]

Publisher’s Note: MDPI stays neutral with regard to jurisdictional claims in published maps and institutional affiliations. |
© 2021 by the authors. Licensee MDPI, Basel, Switzerland. This article is an open access article distributed under the terms and conditions of the Creative Commons Attribution (CC BY) license (https://creativecommons.org/licenses/by/4.0/).