Abstract
Indoor positioning has garnered significant interest over the last decade due to the rapidly growing demand for location-based services. As a result, a multitude of techniques has been proposed to localize objects and devices in indoor environments. Wireless fingerprinting, which leverages machine learning, has emerged as one of the most popular positioning approaches due to its low implementation cost. The prevailing fingerprinting-based positioning mainly utilizes wireless fidelity (Wi-Fi) and Bluetooth low energy (BLE) signals. However, the RSS of Wi-Fi and BLE signals are very sensitive to the layout of the indoor environment. Thus, any change in the indoor layout could potentially lead to severe degradation in terms of localization performance. To foster the development of new positioning methods, several open-source location fingerprinting datasets have been made available to the research community. Unfortunately, none of these public datasets provides the received signal strength (RSS) measurements for indoor environments with different layouts. To fill this gap, this paper presents a new hybrid Wi-Fi and BLE fingerprinting dataset for multi-floor indoor environments with different layouts to facilitate the future development of new fingerprinting-based positioning systems that can provide adaptive positioning performance in dynamic indoor environments. Additionally, the effects of indoor layout change on the location fingerprint and localization performance are also investigated.
Dataset License: CC-BY
1. Introduction
During the last decade, the advancement and widespread proliferation of smart mobile devices have sparked great interest in location-based services, such as tracking of humans or objects in smart buildings to enable energy management, positioning of products in industry 4.0, wireless network optimization and navigation for robots and the visually impaired. Since precise localization of users or devices is crucial in realizing location-based services, indoor positioning systems have become the subject of intense research in academia and industry.
Over the years, a wide variety of indoor positioning techniques have been developed. Based on the estimation algorithm, the mainstream indoor positioning techniques can be broadly categorized as geometric and fingerprinting. Two primary geometric techniques are triangulation and trilateration. To estimate the target’s position, the triangulation approach finds the angles between the transmitters and the target, and then the geometric properties of triangles are applied [1,2,3]. On the other hand, in the trilateration method, the distances between the transmitters and the target are measured, and the geometric principles of circles, spheres, or triangles are applied to determine the location of the target [4,5]. Owing to the severe multipath issue and non-line-of-sight (NLoS) signal propagation that arise in indoor environments, the position estimates of geometric positioning methods are error-prone.
Unlike the geometric approaches, fingerprinting-based methods are data-driven, and they involve two phases, namely the offline training phase and the online localization phase. In the offline training phase, the fingerprinting-based approaches first construct a radio map by recording the received signal strengths (RSSs) at each pre-determined location and their corresponding coordinates, also known as location fingerprints. Then, in the online localization phase, the target’s position is estimated via machine learning techniques by comparing the measured RSS to the location fingerprints collected on the radio map. The use of various signals has been proposed for fingerprinting-based positioning. Among them, wireless fidelity (Wi-Fi) and Bluetooth low-energy signals are the most widely studied. By and large, as compared to the geometric counterparts, fingerprinting-based approaches can achieve a relatively higher degree of precision as the radio map takes into account the detrimental effects of the indoor environments, such as reflections and obstructions, compared to the geometric counterpart [6,7].
In the literature, several location fingerprinting datasets have been published to enable fair comparison and meaningful evaluation of various fingerprinting-based positioning approaches. Table 1 summarizes the critical public fingerprinting datasets that could be used for indoor positioning purposes. As seen from the table, none of these existing fingerprinting datasets collects the RSS measurements for different layouts of the same indoor area. Collecting location fingerprinting datasets of different layouts for the large indoor area is a formidable task as massive effort will be required, and the data collection process is extremely tedious and time-consuming. It is essential to highlight that one of the main technical hurdles which hinder the practical implementation of fingerprinting-based schemes is that these approaches suffer from severe performance degradation in terms of localization performance under the circumstance of indoor layout changes as the RSS of wireless signals are very sensitive to the environmental dynamics [8,9,10].

Table 1.
The comparison of different indoor fingerprint datasets published in the past years.
Motivated by the aforementioned gap in the current literature, this paper presents a new Wi-Fi and BLE fingerprint dataset for different layouts of the same multi-floor indoor area. An indoor positioning testbed was set up, and a measurement campaign was carried out at the Faculty of Engineering, Multimedia University, Malaysia. To collect such a dataset, a large number of Wi-Fi access points and BLE beacons were deployed. In summary, the primary contributions of this paper are outlined as follows:
- To the best of the authors’ knowledge, this is the first work to provide a large-scale location fingerprinting dataset for different layouts of the same indoor area. This work paves the way for the development of fingerprinting-based positioning techniques that are robust against indoor layout change, and it fosters reproducibility and comparability of techniques in this field.
- The dataset presented in this work provides the location fingerprints for both the Wi-Fi and BLE signals. This contribution will enable future work in this field to enhance localization performance by jointly exploiting both the Wi-Fi and BLE fingerprints.
- A comprehensive investigation is carried out to analyze the effects of the layout changes on the BLE and Wi-Fi signal variations as well as the localization performance of various baseline fingerprinting-based positioning techniques.
The remainder of the paper is laid out as follows. Related works by previous researchers are discussed in Section 2. The collection technique and surroundings are discussed in depth in Section 3. The dataset included in the database is described in Section 4. The analysis and discussion of the results are presented in Section 5. Section 6 concludes with some closing remarks.
2. Related Works
Thus far, there are plenty of indoor fingerprint datasets which are publicly available, as shown in Table 1. Among all the datasets, the famous and widely adopted indoor datasets are UJI IndoorLoc [12], IPIN 2016 Tutorial, ALCALA 2017 Tutorial [8,9,13] and Tampere University [8] datasets.
2.1. UJI IndoorLoc Dataset
The UJI IndoorLoc dataset [12] is the first publicly available dataset for multi-building, multi-floor, fingerprint-based indoor positioning. This dataset consists of fingerprints collected from an area that covers three buildings, each with four to five floors considering indoor and outdoor environments. The total number of APs used in this dataset is 520, and the attributes included are Building, Floor, Latitude and Longitude for each reference point. The total number of reference points (RPs) is 933, and the dataset is then divided into three categories: the training dataset, the testing dataset and the validation dataset. To be more precise, the datasets that are publicly published are only training and testing datasets, which consist of 19,938 and 1111 samples, respectively. The testing dataset was taken 4 months after the training dataset was collected, where 18 users were involved in the process of collecting the training dataset, and each reference point was registered by one to two users at least. There were 14 users during the validation dataset collection, which was executed in 20 min for each building. In this collection activity, 25 devices were used during the RSSI collection. Different devices have a comparable range of potential values; each delivers lower numbers based on the mean and median readings. In addition, the quantity of RSSI scanned by a device is affected by the surroundings and the device itself.
2.2. IPIN 2016 Tutorial, ALCALA 2017 Tutorial Dataset
The IPIN 2016 and ALCALA 2017 datasets [8,9,11,13] were collected in the same corridor of the School of Engineering at the University of Alcala, Spain. The IPIN 2016 Tutorial dataset has 927 training samples and 702 testing samples with a deployment of 168 APs. In contrast, the ALCALA 2017 Tutorial dataset recorded 670 training and 405 testing samples, with 168 APs deployed at the measurement site. Compared to the IPIN 2016 Tutorial dataset, the ALCALA 2017 Tutorial dataset used a thinner grid to collect the training data, and human errors were considered. Both datasets produced similar results using the probabilistic approach in the IndoorLoc Platform, a public repository for comparing and evaluating indoor positioning systems. The results obtained by ALCALA 2017 have a significant difference because with probabilistic-based method ignores the unintentional error. It is also observed that ALCALA 2017 is prone to provide low positions error due to the smaller area covered and shorter distance among the RPs.
2.3. Tampere University Dataset
The Tampere University dataset [8] was collected in three-floor and four-floor buildings at Tampere University. In this site survey, 1478 training samples and 489 testing samples were recorded for the four-floor building with 354 APs, while 583 training samples and 175 testing samples were taken for the three-floor building with 309 APs. The data collected from the two buildings can be considered two independent datasets without any correlation between the data from the two buildings.
2.4. Other Indoor Datasets and Research Gaps
Other than the above datasets, other public indoor fingerprint datasets can be found in [8,9,10,15]. Undoubtedly, the datasets mentioned above play a vital role in spurring indoor positioning research, but the datasets were collected under a fixed indoor environment without considering any environmental variability, such as layout change. This limitation has hindered indoor positioning research from investigating the dependency of fingerprints on environmental factors. To fill this gap, this paper presents a dataset demonstrating the difference among radio maps of fingerprints for a deployment site with different layouts. To the best of the authors’ knowledge, this kind of dataset is not publicly available.
3. Setup and Dataset Collection Procedure
An indoor positioning testbed was set up in the Faculty of Engineering (FOE) at Multimedia University, Cyberjaya, Malaysia. The areas of fingerprint measurement involved are the ground floor, first floor and second floor of Wing C of the three-story FOE building. The corridors of the three floors are surrounded by lecture rooms and laboratories with concrete walls, which are cemented brick walls with a signal attenuation of 3.5 dB for 2.4 GHz Wi-Fi and Bluetooth signals. The testbed for dataset collection has been established along the corridors, but not in the lecture rooms or laboratories because there is a higher chance for the corridors to experience various layout changes due to different activities or exhibitions. Furthermore, there is a greater need to establish an indoor positioning system along the corridors (which has a larger space) than in the lecture rooms or laboratories, where indoor positioning might be redundant. The heights of each floor and the thickness of the floors are 2.7 m and 0.8 m, respectively. On the other hand, the dimensions of the areas of interest for the ground, first and second floors are 51.5 m × 2.1 m, 51.5 m × 2.7 m and 51.5 m × 2.7 m, respectively. Therefore, the total area covered by the fingerprint measurement campaign for all three floors is approximately 386.25 m2. The height and thickness of the floors are illustrated in Figure 1.
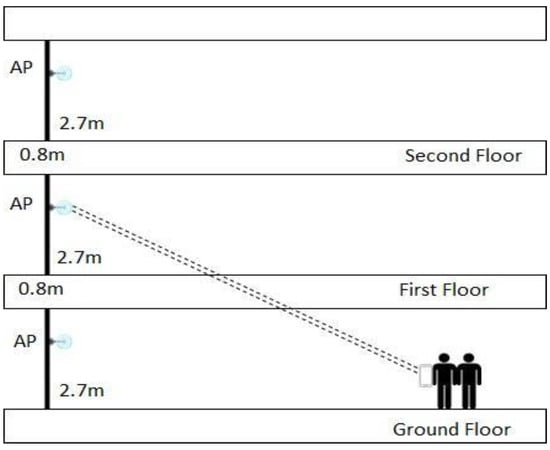
Figure 1.
The height and thickness for each corridor in each floor.
In this dataset collection campaign, the off-the-shelf Sensoro SmartBeacon-4AA Pro is used as the BLE beacon, as shown in Figure 2a. On the other hand, the D-Link 4G LTE mobile router is deployed as Wi-Fi AP, as illustrated in Figure 2b. The selection of the two devices is motivated by their great portability and the ease of deployment because the Sensoro SmartBeacon-4AA Pro is powered by four double-A batteries that can last for a few months, whilst the D-Link 4G LTE mobile routers operate on rechargeable batteries. To provide sufficient wireless signal coverage to the areas of interest, a total of 42 units of BLE beacons and 17 units of Wi-Fi APs were deployed on the site. More specifically, 14 units of BLE beacons were installed on each floor, while the total number of Wi-Fi APs placed on the ground, first and second floors were 5, 6 and 6, respectively. All of the BLE beacons and Wi-Fi APs were configured before collecting the fingerprint data, and they were installed on the corridor wall at the height of 1.7 m, i.e., the optimal height suggested by the vendors. Table 2 and Table 3 summarize the configurations and the settings of the BLE beacons and Wi-Fi APs, respectively. The settings of the BLE beacons and Wi-Fi APs were configured using their suggested in-house applications, shown in Figure 3. In Table 2, it is noted that the advertising interval is configured to 417.5 ms based on the recommendation by the manufacturer. This interval is the optimal interval which can preserve the quality of the average signal measured (reducing the fluctuation) and prolong the battery life of the beacons. On the other hand, it is seen that in Table 3, the advertising interval for WAP is not adjustable. The RSSI calibration indicates the expected value of RSSI when the receiver is at 1 m from the BLE beacon.
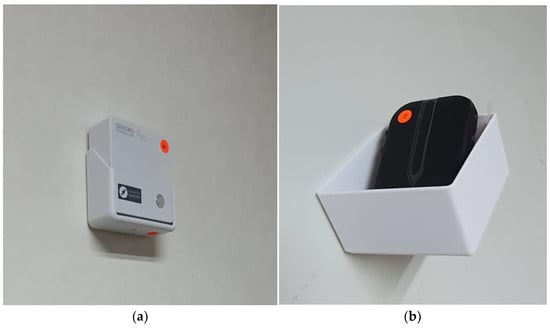
Figure 2.
(a) Sensoro SmartBeacon-4AA Pro and (b) D-Link 4G LTE mobile routers.
Table 2.
The configuration of BLE beacons.
Table 3.
The configuration of Wi-Fi APs.
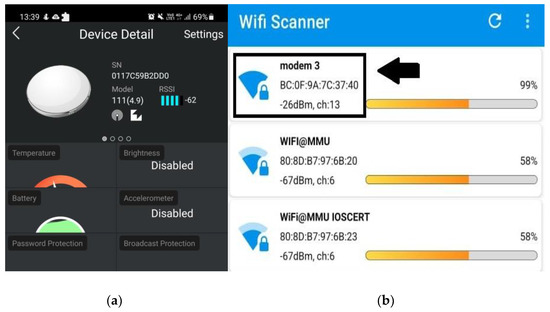
Figure 3.
The interfaces of the fingerprint measurement applications (a) Sensoro application for BLE beacons (b) All Router Setup for WAPs.
The fingerprint data collection was carried out by a trained individual who stood at the pre-determined RPs, holding a mobile device (a receiver) with his/her right hand in front of his/her chest, trying to replicate a person using a mobile device. The pre-determined RPs were arranged in a grid with a 1-m distance between the adjacent RPs. As a result, a total of 384 RPs were established for the entire evaluation site. More explicitly, the total number of RPs on the ground floor was 96, while the first and second floors have 144 RPs. The mobile device used for fingerprint measurement was the Samsung Galaxy Note10 Lite, which can simultaneously detect Bluetooth and Wi-Fi signals. For simplicity and consistency, the mobile station was always held at the same orientation and maintained at the height of 1.5 m from the floor. To measure and collect the Bluetooth and Wi-Fi signals, the mobile device was equipped with the Sensoro application, as shown in Figure 3a, and the All Router Setup application, as illustrated in Figure 3b. For each reference point, 30 samples were measured, and the data were recorded into multiple CSV files.
The fingerprint databases for three different layouts were collected in this work. For the first layout, we considered the scenario without the presence of any obstructions in the measurement site. To create a measurement site with different layouts, multiple partition boards of size 1.5 m × 1.8 m with a thickness of 0.0127 m were placed at various locations along the corridors. In the second layout, the partition boards were only placed on the ground and second floors, as portrayed in Figure 4. The third layout was created by placing the partition boards on every floor, as shown in Figure 5. The total number of partition boards used on each floor for different layouts is tabulated in Table 4.
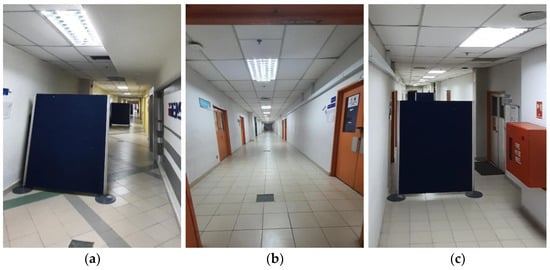
Figure 4.
Example pictures of Layout 2: (a) Ground floor (b) First floor (c) Second floor.
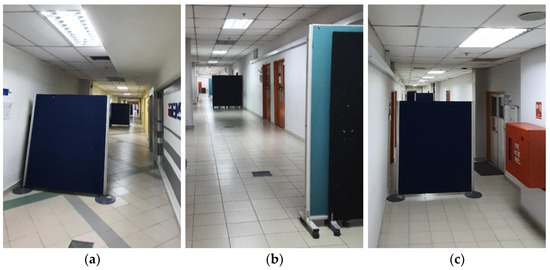
Figure 5.
Example pictures of Layout 3: (a) Ground floor (b) First floor (c) Second floor.
Table 4.
The number of boards placed on each of the floors for different layouts.
Figure 6, Figure 7 and Figure 8 show the measurement site for the three different layouts mentioned above, where the placement of the partition boards is clearly shown in Figure 7 and Figure 8. The layout shown in Figure 6 is named the first layout (without partition board), while the layouts illustrated in Figure 7 and Figure 8 are known as the second and third layouts (with partition boards), respectively. Each figure consists of the floor plans for the ground, first and second floors with multiple RPs (denoted in green dots) tagged with their coordinates measured in meters. The coordinate (0, 0) at the top left corner of each floor is the reference point in which the x-coordinate is increased horizontally to the right while the y-coordinate is increased vertically up. Other than that, the locations of the deployed BLE beacons and Wi-Fi APs are shown in the floor plans, where the BLE beacons are labelled with BLE 1–BLE 42 while the Wi-Fi APs are marked with WAP 1–WAP 17. Both beacons and APs are installed on the walls surrounding the measurement site. From Figure 6, Figure 7 and Figure 8, it is noticed that x = −1 and x = 2 for the ground floor are used to indicate the walls on which the WAPs and BLEs are installed. Similarly, x = −1 and x = 3 for the first and second floors are used to indicate the walls for these two floors.
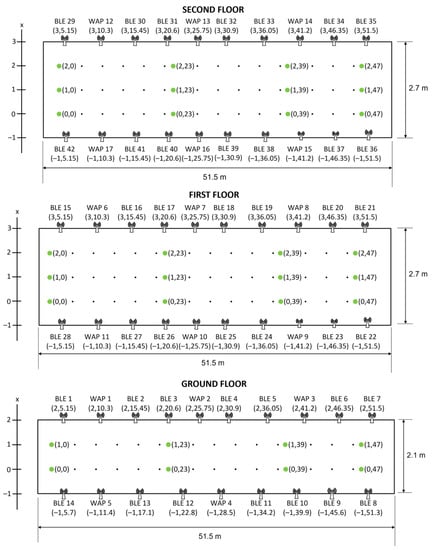
Figure 6.
Floor plans for the ground, first and second floors of Layout 1.
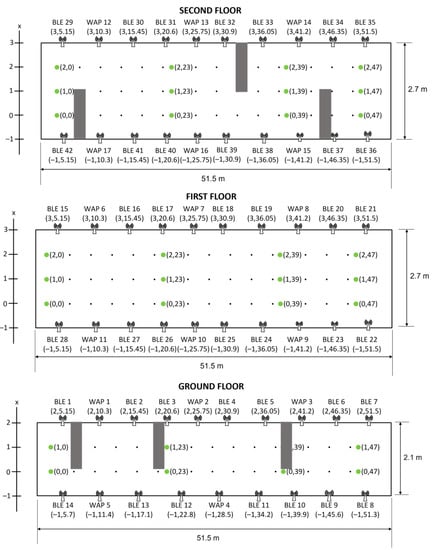
Figure 7.
Floor plan for the ground, first and second floors of Layout 2.
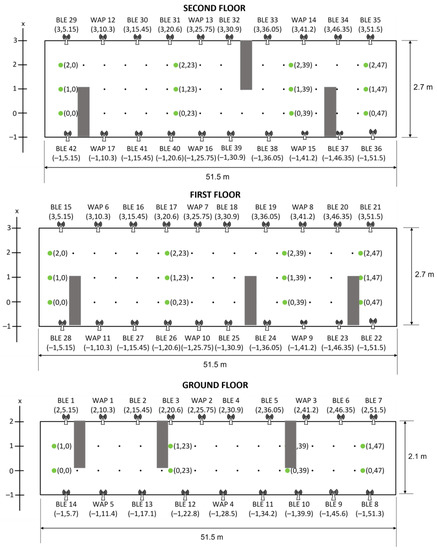
Figure 8.
Floor plan for the ground, first and second floors of Layout 3.
4. Dataset Description (Hybrid-Fingerprint Data with Layout Change (HDLC))
The collected fingerprint dataset consists of BLE and Wi-Fi RSSI for different layouts; hence it is named Hybrid-fingerprint Data with Layout Change (HDLC). In this HDLC dataset, the RSSI values at the identified RPs on different floors are recorded in multiple Excel and CSV files for Layouts 1, 2 and 3. The dataset consists of three folders: Layout 1, Layout 2 and Layout 3. Each layout folder contains one CSV file and three Excel files labelled as Layout #—Raw, Layout #—Ground Floor, Layout #—First Floor and Layout #—Second Floor, where # indicates the layout number (1, 2 or 3). Specifically, the Excel and CSV files of the dataset are illustrated in Figure 9.
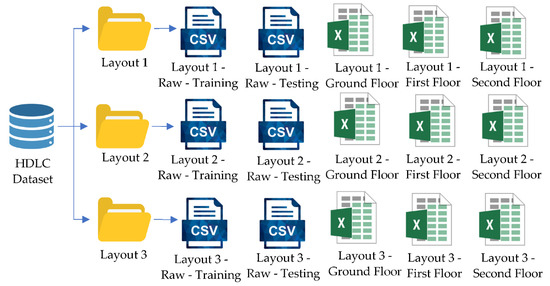
Figure 9.
The hierarchy of the dataset.
In Layout #—Ground Floor, Layout #—First Floor and Layout #—Second Floor files, the recorded RSSI values are measured in the unit of dBm and arranged in the same manner in the spreadsheet, as shown in Table 5, where the 3-D coordinates are represented by (x, y, z) measured in meter. The three files can be identified from the table where z = 0, z = 3.5 and z = 7 indicate the ground, first and second floors, respectively. In each file, there are multiple sheets labeled with x = 0, x = 1 for the Layout #—Ground Floor file while x = 0, x = 1, x = 2 for Layout #—First Floor and Layout #—Second Floor. The x-coordinate labeled with 0, 1 or 2 indicates the horizontal records of RSSI values for each floor shown in the floor plans (Figure 6, Figure 7 and Figure 8). In each Excel file sheet, the x- and z-coordinates are fixed, while the RSSI values measured from 42 BLE and 17 WAPs for different y-coordinates are recorded. During the measurement of RSSI at one specific RP, 30 samples of RSSI values are obtained. Therefore, the RSSI matrix for one RP with coordinates x, y and z can be denoted as
where the first 30 × 42 entries are RSSI measured from BLEs and the following 30 × 17 entries are RSSI records for WAPs. The entries of the RSSI measurement are recorded in dBm, where the undetectable and out-of-the-range BLE and Wi-Fi signals are automatically filled with −110 dBm, close to the noise floor power. The same interpretation can be applied to all three CSV files (Layout #—Ground Floor, Layout #—First Floor and Layout #—Second Floor files).
Table 5.
Example of RSSI entries at different y-coordinates for x = 0 and z = 0 for Layout 1.
Besides the Layout #—Ground Floor, Layout #—First Floor and Layout #—Second Floor files, each layout folder contains one CSV file termed Layout #—Raw, which is the raw data of all the collected RSSI. The data are arranged in the same format as in Table 6. The locations of RPs are identified from (Floor, x, y) where , and . Note that there is only for Floor = 0.
Table 6.
Example of RSSI entries for the training and testing datasets.
5. Analysis of the Datasets
5.1. Impact of Layout Change on RSSI
This section investigates the impact of the interior layout changes on the RSSI values meticulously. The heatmaps of RSSI measurements from the selected BLE beacons and Wi-Fi APs are used to demonstrate the variations of the RSSI and the magnitudes of RSSI differences between different layouts.
5.1.1. BLE Signal
The BLE 17 which is located on the first floor with the coordinates (−1, 19.6) is selected for investigation for all three layouts. Figure 10 illustrates the RSSI distribution of BLE 17 for Layout 1. The vertical axis of the heatmap indicates the floor and the y-coordinate of a particular floor. More specifically, the ground, first and second floors are denoted as G, F and S, respectively, while the numerical value (second character of the notations used in the vertical axis of the heatmap) represents the y-coordinate of the floor. As shown in Figure 10, the signals that are perceived by the mobile measurement device are significant within 10 m, with the RSSI measured between −85 dBm to −73 dBm. Since no partition board is used in this measurement (Layout 1), BLE 17 has a line-of-sight (LoS) transmission to the mobile device where the Bluetooth signals only experience path loss without any attenuation and shadowing effect caused by the obstructions. On the other hand, the signals emitted by BLE 17 are detectable on the ground and second floors, with a significant reduction in RSSI due to the signal attenuation caused by the concrete floors.
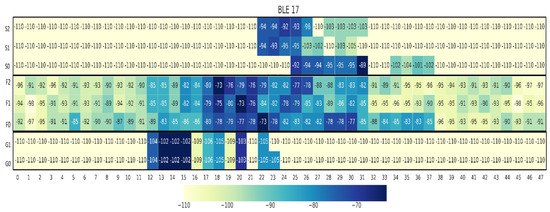
Figure 10.
RSSI distribution of BLE 17 for all three floors of Layout 1.
The Bluetooth signals from BLE 17 were measured again at all RPs on all three floors for Layouts 2 and 3. Figure 11 and Figure 12 demonstrate the heatmaps of all three floors for Layouts 2 and 3, respectively. Compared to the heatmaps shown in Figure 10, the BLE signals are recorded with lower RSSI values after the partition boards are placed on the measurement site. This observation is anticipated as the BLE signals travelling to the measurement device experience attenuation caused by the obstruction of the partition boards. The Bluetooth signal with 2.45 GHz will incur an attenuation and absorption loss of 4–5 dB when the signals penetrate the wooden partition boards.
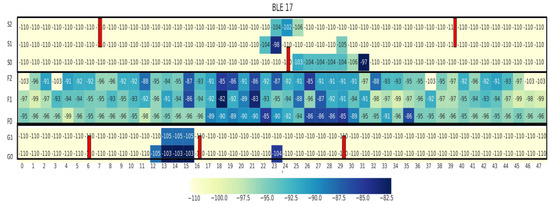
Figure 11.
RSSI distribution of BLE 17 for all three floors of Layout 2. The red box indicates partition board.
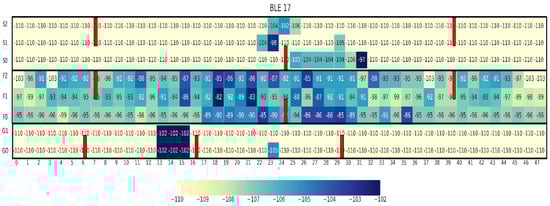
Figure 12.
RSSI distribution of BLE 17 for all three floors of Layout 3. The red box indicates partition board.
To better visualize the impact of the layout changes on the RSSI values, the differences between the RSSI values measured from Layouts 1 and 2 are shown in the heatmap in Figure 13, while the RSSI differences between Layouts 1 and 3 are depicted in Figure 14. The positive values of RSSI difference (dB) shown in Figure 13 and Figure 14 imply that the signal strength becomes weaker after the partition boards are placed at the measurement site. This analysis indicates that the reduction in RSSI values is more significant when the signals travel across multiple partition boards.
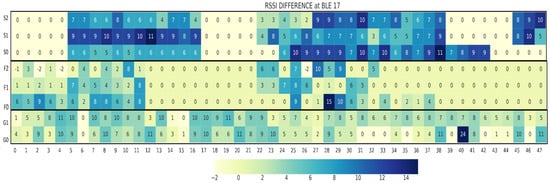
Figure 13.
RSSI differences between Layout 1 and Layout 2 for BLE 17 of all three floors.
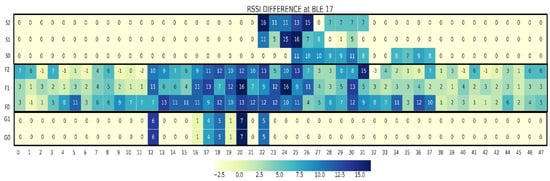
Figure 14.
RSSI difference between Layout 1 and Layout 3 for BLE 17 of all three floors.
5.1.2. Wi-Fi Signal
Having studied the impact of layout change on the BLE signals, in the following, we investigate the impact of layout change on the Wi-Fi signals. Figure 15, Figure 16 and Figure 17 present the RSS distribution of WAP 4 for Layout 1, Layout 2 and Layout 3, respectively. The WAP 4 is placed on the ground floor at coordinate (2, 27.5). In general, it is observed that the RSSI values of the Wi-Fi signals on the ground floor are relatively much stronger than those on the first and second floors due to the reasons that WAP 4 is located on the ground floor. Hence, the Wi-Fi signals suffer from strong attenuation by the concrete floors as it propagates to the first and second floors. Also, similar to the BLE signals, the Wi-Fi signals also become weaker after the partition boards are placed on the measurement site.
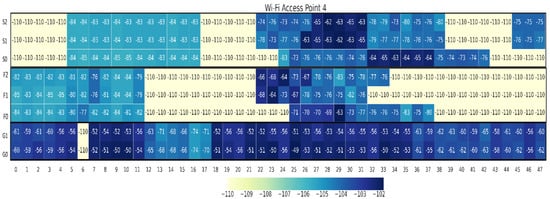
Figure 15.
RSSI distributions of Wi-Fi Access Point 4 for Layout 1 of all three floors.
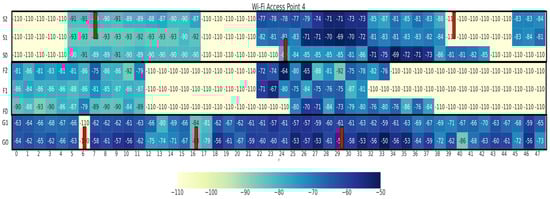
Figure 16.
RSSI distributions of Wi-Fi Access Point 4 for Layout 2 of all three floors. The red box indicates partition board.
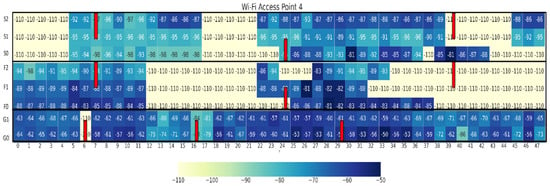
Figure 17.
RSSI distributions of Wi-Fi Access Point 4 for Layout 3 of all three floors. The red box indicates partition board.
Figure 18 sheds light on the distribution of the RSSI differences between Layouts 1 and 2. On the other hand, the distribution of the RSSI differences between Layouts 1 and 3 is characterized in Figure 19. The results in Figure 18 and Figure 19 demonstrate that the RSSI fluctuation owing to the layout change is significant and can even reach 46 dB.
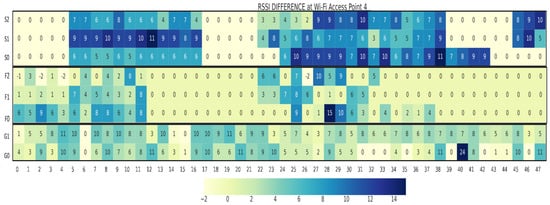
Figure 18.
RSSI difference between Layout 1 and Layout 2 for Wi-Fi Access Point 4 of all three floors.
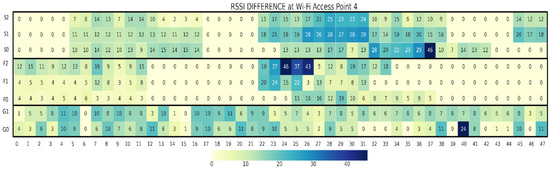
Figure 19.
RSSI difference between Layout 1 and Layout 3 for Wi-Fi Access Point 4 of all three floors.
5.2. Localization Performances
This section presents the positioning results for the well-known conventional localization techniques using the proposed dataset. The same mobile station with the same orientation and height is employed in the positioning phase. The localization schemes considered are K-Nearest Neighbours (KNN), decision tree (DT), random forest (RF) and multilayer perceptron (MLP), and their corresponding performance is tabulated in Table 7, Table 8, Table 9 and Table 10, respectively. A detailed examination of the results tabulated in Table 7, Table 8, Table 9 and Table 10 reveals that the average positioning errors for the conventional localization techniques under consideration are within 6.16 m. The floor accuracies are at least 99% when there is no layout change, i.e., when the indoor layout of the training dataset is exactly the same as that of the testing dataset. On the other hand, significant performance degradation in terms of an average positioning error up to 3 m difference is observed when the indoor layout changes, i.e., when the indoor layout of the training dataset is different from that of the testing dataset. This observation is because the RSS variation arising from the layout change will cause discrepancies between the online RSS readings and radio map. As a result, the pattern matching process might fail, leading to the misclassification of locations.
Table 7.
Localization performance of KNN technique for different values of K.
Table 8.
Localization performance of DT technique.
Table 9.
Localization performance of RF technique.
Table 10.
Localization performance of MLP technique.
The cumulative distribution functions (CDFs) shown in Figure 20 provide insight into the distribution of the positioning error. For the KNN-based positioning method, the number of nearest neighbors is set as 1. Generally, the performance trends of the CDF of positioning errors are in good agreement with the observations in Table 7, Table 8, Table 9 and Table 10. As expected, all the techniques considered attain a higher probability of better positioning performance for the scenario with no layout change than those with layout change. For instance, the probability of positioning errors within 2 m for KNN without layout change is 48.95%. On the other hand, the probabilities for KNN to achieve positioning errors less than 2 m when the indoor layout changes from Layouts 1 to Layout 2 and from Layouts 1 to Layout 3 are 40.83% and 34.50%, respectively. From Figure 20, it is also noteworthy that the impacts of layout change from Layout 1 to Layout 3 for all the positioning schemes under consideration are more significant than those of the layout change from Layout 1 to Layout 2. The reason for this observation is as follows. For Layout 2, only the indoor environments for two floors (ground floor and second floor) differ from those of Layout 1. On the other hand, for Layout 3, the indoor environment for all the floors differs from Layout 1. Thus, in comparison to the scenario where the indoor environment changes from Layout 1 to Layout 2, the fingerprinting-based positioning techniques considered suffer more significant performance degradation when the indoor environment changes from Layout 1 to Layout 3 as the area affected by the latter is more extensive.
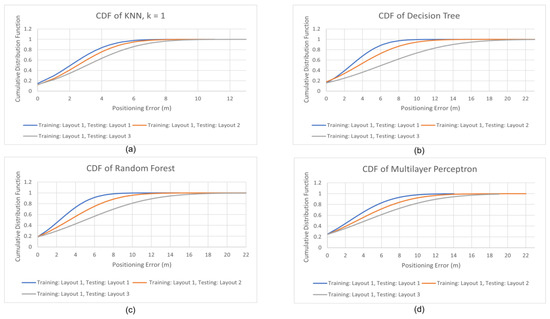
Figure 20.
CDFs of positioning error for different positioning techniques: (a) KNN, (b) Decision tree, (c) Random forest, (d) Multilayer perceptron.
6. Conclusions and Future Works
This paper introduces a new hybrid Wi-Fi and BLE fingerprinting dataset with the aim to aid the future development of fingerprinting-based positioning techniques that are robust against indoor layout change. An indoor positioning testbed was set up, and a measurement campaign was carried out to collect the location fingerprints for three different indoor layouts of a multi-floor building at Multimedia University. The dataset presented in this work has 63 attributes, which consist of the RSSI measured from 42 units of BLE beacons and 17 units of WAP, the corresponding floor number and the coordinates. To facilitate the use of this dataset, other essential information such as the data acquisition process, layouts of the indoor environments, configuration and positions of the WAPs and BLE beacons, the locations of the obstructions used to vary the layout of the indoor environment, etc., are fully detailed as well. In addition, this paper also studies the effects of the indoor layout change on the RSSI variation and localization performance of various baseline fingerprinting-based positioning techniques. Results demonstrate that indoor layout significantly impacts the RSSI and localization performance. Finally, it is essential to highlight that the proposed dataset can also serve as the basis for other research problems apart from indoor positionings, such as wireless channel modeling, Wi-Fi and BLE coverage improvement, etc. Moreover, this dataset is also essential if future research intends to focus on adaptive indoor positioning algorithms that can adapt to various layouts dynamically.
The published dataset in this paper comprises two-dimensional indoor fingerprint data with a fixed position of the transceivers. To diversify the dataset, we intend to vary the heights of the transmitters and receivers to collect three-dimensional indoor fingerprint data subject to various layouts. Furthermore, it is also essential to investigate the impact of device heterogeneity on the fingerprint quality for different layouts.
Author Contributions
Conceptualization, A.N.N.H.; methodology, A.N.N.H.; software, A.N.N.H.; validation, A.N.N.H.; formal analysis, A.N.N.H.; resources, A.N.N.H.; data curation, A.N.N.H.; writing—original draft preparation, A.N.N.H.; writing—review and editing, Y.H.N., C.K.T. and D.C.; supervision, Y.H.N. and C.K.T.; project administration, Y.H.N. and C.K.T.; funding acquisition, Y.H.N. and C.K.T. All authors have read and agreed to the published version of the manuscript.
Funding
This research was funded by Ministry of Higher Education Malaysia, grant number FRGS/1/2019/ICT02/MMU/03/13.
Institutional Review Board Statement
Not applicable.
Informed Consent Statement
Not applicable.
Data Availability Statement
Dataset is available on https://doi.org/10.5281/zenodo.7306455, accessed on 3 November 2022.
Conflicts of Interest
The authors declare no conflict of interest.
References
- Wang, W.; Marelli, D.; Fu, M. Fingerprinting-Based Indoor Localization Using Interpolated Preprocessed CSI Phases and Bayesian Tracking. Sensors 2020, 20, 2854. [Google Scholar] [CrossRef] [PubMed]
- Racko, J.; Machaj, J.; Brida, P. Wi-Fi Fingerprint Radio Map Creation by Using Interpolation. Procedia Eng. 2017, 192, 753–758. [Google Scholar] [CrossRef]
- Zheng, J.; Li, K.; Zhang, X. Wi-Fi Fingerprint-Based Indoor Localization Method via Standard Particle Swarm Optimization. Sensors 2022, 22, 5051. [Google Scholar] [CrossRef] [PubMed]
- Xia, S.; Liu, Y.; Yuan, G.; Zhu, M.; Wang, Z. Indoor Fingerprint Positioning Based on Wi-Fi: An Overview. ISPRS Int. J. Geo-Inf. 2017, 6, 135. [Google Scholar] [CrossRef]
- Yang, T.; Cabani, A.; Chafouk, H. A Survey of Recent Indoor Localization Scenarios and Methodologies. Sensors 2021, 21, 8086. [Google Scholar] [CrossRef] [PubMed]
- Brena, R.F.; García-Vázquez, J.P.; Galván-Tejada, C.E.; Muñoz-Rodriguez, D.; Vargas-Rosales, C.; Fangmeyer, J. Evolution of Indoor Positioning Technologies: A Survey. J. Sens. 2017, 2017, 2630413. [Google Scholar] [CrossRef]
- Ji, T.; Li, W.; Zhu, X.; Liu, M. Survey on Indoor Fingerprint Localization for BLE. In Proceedings of the 2022 IEEE 6th Information Technology and Mechatronics Engineering Conference (ITOEC), Chongqing, China, 4–6 March 2022; pp. 129–134. [Google Scholar] [CrossRef]
- Lohan, E.S.; Torres-Sospedra, J.; Leppäkoski, H.; Richter, P.; Peng, Z.; Huerta, J. Wi-Fi Crowdsourced Fingerprinting Dataset for Indoor Positioning. Data 2017, 2, 32. [Google Scholar] [CrossRef]
- Mendoza-Silva, G.M.; Richter, P.; Torres-Sospedra, J.; Lohan, E.S.; Huerta, J. Long-Term Wi-Fi Fingerprinting Dataset for Research on Robust Indoor Positioning. Data 2018, 3, 3. [Google Scholar] [CrossRef]
- Mendoza-Silva, G.M.; Matey-Sanz, M.; Torres-Sospedra, J.; Huerta, J. BLE RSS Measurements Dataset for Research on Accurate Indoor Positioning. Data 2019, 4, 12. [Google Scholar] [CrossRef]
- Montoliu, R.; Sansano, E.; Torres-Sospedra, J.; Belmonte, O. IndoorLoc Platform: A Public Repository for Comparing and Evaluating Indoor Positioning Systems. In Proceedings of the 2017 International Conference on Indoor Positioning and Indoor Navigation (IPIN), Sapporo, Japan, 18–21 September 2017; pp. 1–8. [Google Scholar] [CrossRef]
- Torres-Sospedra, J.; Montoliu, R.; Martinez-Uso, A.; Avariento, J.P.; Arnau, T.J.; Benedito-Bordonau, M.; Huerta, J. UJIIndoorLoc: A New Multi-Building and Multi-Floor Database for WLAN Fingerprint-Based Indoor Localization Problems. In Proceedings of the 2014 International Conference on Indoor Positioning and Indoor Navigation (IPIN), Busan, Korea, 27–30 October 2014; pp. 261–270. [Google Scholar] [CrossRef]
- Torres-Sospedra, J.; Jiménez, A.R.; Knauth, S.; Moreira, A.; Beer, Y.; Fetzer, T.; Ta, V.C.; Montoliu, R.; Seco, F.; Mendoza-Silva, G.M.; et al. The Smartphone-Based Offline Indoor Location Competition at IPIN 2016: Analysis and Future Work. Sensors 2017, 17, 557. [Google Scholar] [CrossRef] [PubMed]
- Torres-Sospedra, J.; Montoliu, R.; Mendoza-Silva, G.M.; Belmonte, O.; Rambla, D.; Huerta, J. Providing Databases for Different Indoor Positioning Technologies: Pros and Cons of Magnetic Field and Wi-Fi Based Positioning. Mob. Inf. Syst. 2016, 2016, 6092618. [Google Scholar] [CrossRef]
- Aranda, F.J.; Parralejo, F.; Álvarez, F.J.; Torres-Sospedra, J. Multi-Slot BLE Raw Database for Accurate Positioning in Mixed Indoor/Outdoor Environments. Data 2020, 5, 67. [Google Scholar] [CrossRef]


Publisher’s Note: MDPI stays neutral with regard to jurisdictional claims in published maps and institutional affiliations. |
© 2022 by the authors. Licensee MDPI, Basel, Switzerland. This article is an open access article distributed under the terms and conditions of the Creative Commons Attribution (CC BY) license (https://creativecommons.org/licenses/by/4.0/).