1. Introduction
With more than 400 million confirmed cases and almost 5.8 million deaths globally recorded at the time of writing (February 2022) [
1], the COVID-19 pandemic has strongly impacted all aspects of our lives. As never before, since the first generalised lockdown, our societies have accelerated their digital transformation [
2] and have once more realised how important data is, not only to directly study and measure the pandemic, but also to analyse and address its consequences on multiple societal sectors. The importance of data to fight COVID-19 has clearly come with the related demand for adequate mechanisms to access, store, share, use, process and protect them [
3,
4,
5].
In Europe, Commission President von der Leyen had already put data-related issues at the very centre of the European Union (EU) political guidelines before the COVID-19 crises unleashed. Indeed, one of the six priorities included in the political agenda for the European Commission 2019–2024, titled ‘A Europe fit for the digital age’, stressed the need for Europe to grasp the opportunities offered by digital technology to achieve technological sovereignty [
6]. The Recovery and Resilience Facility established in response to the COVID-19 pandemic reiterated that the new Europe should be more digital and prescribed that at least 20% of the EUR 672.5 billion provided to EU Member States in loans and grants have to be used for the digital transformation [
7]. Published just before the beginning of the pandemic, the European strategy for data [
8] envisages the development of a European single market for data through the establishment of European domain-specific data spaces in strategic sectors such as industry, health, transportation and environment. While aiming to facilitate the free flow of data across actors and sectors to create value for economy and society, the strategy recognises that a number of data-related obstacles are to be addressed such as availability, interoperability, quality, governance and (lack of) digital skills.
Geospatial data, i.e., data which is georeferenced or georeferenceable, represents a wide share of all the data that is produced and exchanged and so far has played an important role in addressing the COVID-19 pandemic. In [
9], authors provide an early review of scientific applications leveraging geospatial analyses to study or address the COVID-19 pandemic, classifying them into five categories: spatiotemporal analysis, health and social geography, environmental variables, data mining and web-based mapping. A follow-up of the study [
10] analysed 221 papers published in the second half of 2020 and revealed an increase in the use of spatial and spatiotemporal statistical tools as well as remote sensing approaches.
There is increasing evidence that in modern society—and the COVID-19 crisis is yet another example—geospatial data informing policy-making and contributing to the public good is not only produced by the public sector, as in traditional Spatial Data Infrastructures (SDIs), but also by alternative actors and among them, citizens [
8,
11,
12]. The most well-known project of citizen-generated data in the geospatial domain is OpenStreetMap (OSM) [
13], which involves volunteers worldwide in the creation and update of a global map of the world available under an open access license and currently used by an endless number of actors, including humanitarian organisations, businesses and governments [
14,
15,
16].
With this background, the work described in this paper focuses on the specific contribution of the OSM project to address the first wave of the COVID-19 crisis, i.e., approximately from February to May 2020, in Italy. The analysis of the many initiatives carried out in Italy—which sometimes differed from other OSM-related activities happened around the world to respond to the COVID-19 crisis—is used as a basis for discussing the potential role that OSM can play, and the impact it can bring, from a general data space/ecosystem perspective as mentioned in the European strategy for data. As a matter of fact, while the focus of the initiatives described is on the local (mainly urban) level—which reflects the very large scale and high detail of OSM data—the present work seeks to understand how the lessons learnt can be scaled within the broader framework of European-wide data spaces, and what is the contribution that OSM could bring to the establishment and operation of those data spaces.
The remainder of the paper is organised as follows.
Section 2 provides baseline information on the OSM project, including how to contribute and how to use data, to provide readers who are not familiar with it with the necessary information to fully understand the remaining part of the paper.
Section 3 offers an overview of the main activities emerged all around the world to produce and make use of OSM data during the early phase of the COVID-19 emergency. This is followed by
Section 4, focused on the specific initiatives where OSM was used to fight the pandemic in Italy, highlighting for each of them the involved actors, data and data flows. Building on such experiences,
Section 5 summarises the lessons learnt and discusses the role and nature of OSM as an enabler for building sustainable data ecosystems at the local level. The paper concludes with
Section 6, which evaluates the OSM contribution to address the issues listed in the European strategy for data and draws some lines for future research about OSM in the broader European context.
2. OpenStreetMap
Started in 2004 and currently recognised as the most popular example of Volunteered Geographic Information (VGI), the OpenStreetMap project aims to crowdsource the creation and updating of an open access geospatial database of the whole world [
17]. At the time of writing (February 2022), more than 8 million people have registered to the OSM project (which is a necessary condition to contribute data), although only 1.7 million people—referred to as OSM contributors in the following—have actually contributed some data [
18]. Concretely, OSM is a database of geospatial vector features licensed under the Open Database License (ODbL) [
19] and representing any object located on the Earth’s surface and being verifiable, that is, such that multiple independent observers would collect the same observation [
20]. This is the reason why, e.g., raster and spatiotemporal observations are outside the scope of OSM [
21]. Together with the rich ecosystem of tools, services and applications built on top of them, OSM data are currently used by a growing number of actors (including governmental organisations and businesses) and have stimulated high interest among academics and researchers [
14,
22].
According to the OSM data model, every object is characterized by a geometric and a semantic component. The geometry can be described by: (i) a node, i.e., a point feature defined by a latitude and a longitude, used to represent, e.g., an address or a tree; (ii) a way, i.e., an ordered list of nodes used to represent both a linear feature (e.g., a highway or a river) and a polygon feature (e.g., a building or a land-use area); and (iii) a relation, i.e., a relationship between multiple nodes, ways and/or other relations [
23]. The semantic component of OSM objects is described by attributes, called tags and consisting of key-value pairs. For example, the tag
landuse = residential (where
landuse is the key and
residential is the value) specifies that the polygon to which it is associated is a residential area. Each OSM object representing a real-world feature has at least one tag, but there is no limit to the number of tags that an object can have. More details on the OSM data model are provided in [
24].
Since the inception of the project, OSM tags have been collectively agreed and are still managed and kept up-to-date by the global OSM community. This community-driven taxonomy is also known as the OSM folksonomy [
25]. The reference list of tags is maintained on the OSM wiki [
26]; proposals for including or removing/deprecating tags are managed through open voting processes on the same wiki. It is important to note that, despite the existence of the OSM folksonomy and the recommendation to make use of it, when mapping, OSM contributors are left free to use the tags they want. This occasionally leads to the improper use of tags and is the main source of concern on the semantic accuracy of the OSM database—see, e.g., [
27,
28,
29].
Contributing data to OSM requires the use of one of the available editors [
30], which all make use of the
OSM API [
31] to read and write from/to the database. Whatever editor is used to contribute OSM data, there are three main sources from which data can be derived [
14]. The first one is field survey, i.e., the contributor makes a direct observation of the real-world objects (e.g., by recording GPS tracks or taking pictures or notes) before adding them to OSM. The second way of contributing is remote mapping, which consists of adding OSM objects by digitizing them on top of satellite imagery whose license is compatible with the ODbL. This contribution method is especially used in humanitarian projects, when basic elements such as roads and buildings are urgently needed and remote volunteers from all over the world help by adding those data. The third way to contribute data to OSM is the bulk import of external datasets (for example produced by public bodies or other organisations) having again a license compatible with the ODbL. Bulk imports are nontrivial and potentially dangerous operations and for this reason they must be first documented, discussed and approved by the relevant (local or national) OSM communities. More information on OSM imports, including guidelines and a list of imported datasets, is available at [
32].
Finally, OSM data can be accessed in multiple ways. In the simplest case, OSM is only used as a basemap in web mapping applications through the access to predefined tiles provided by web services. Instead, the access modes to the actual OSM vector objects are mainly three. First, several organisations offer so-called OSM extracts, i.e., datasets—either static or dynamically generated upon user request—ready for download and corresponding to user-defined areas and/or objects (e.g., all the OSM roads in Italy). Alternatively, OSM data can be accessed through different Application Programming Interfaces (APIs): the most common ones are the above mentioned
OSM API [
31], the
Overpass API [
33] and the
Ohsome API [
34], which also allow to access the history of the OSM database. Finally, the whole OSM database is packed in a single file, the
Planet OSM [
35], updated on a weekly basis; a version of that file including the whole history (
Full History Planet OSM) is also available [
36]. While, on one side, such a huge number of possibilities makes access to OSM data extremely easy, on the other side, it also makes it impossible to measure and trace the actual use of OSM.
From the governance perspective, the OSM project is supported, but not controlled, by the OpenStreetMap Foundation (OSMF) [
37]. The OSMF is an international not-for-profit organisation, which acts as a legal entity for the project, maintains the OSM-related infrastructure and core services (including the
OSM API) and takes care of the economic sustainability of the project. Membership to the OSMF happens on a voluntary basis; members elect the OSMF Board and can join several working groups dealing with specific aspects such as data, communication and licensing.
Finally, one of the topics related to OSM that has been most investigated is data quality, which is of direct relevance for the actual use of the data. A huge body of literature exists, where several OSM quality metrics [
38,
39,
40] have been evaluated through extrinsic and intrinsic methods. While extrinsic quality assessments evaluate the quality of OSM datasets by comparison against corresponding reference datasets, typically released by authoritative or governmental bodies and considered as the ground truth [
27,
41,
42], in intrinsic assessments the quality of OSM datasets is evaluated without using external datasets, usually by looking at the history of the OSM datasets themselves [
24,
43,
44]. A popular indicator to evaluate OSM quality, which reflects the actual suitability of the data for specific applications, is the so-called fitness-for-use or fitness-for-purpose [
45,
46]. Overall, literature shows that—despite being heterogeneous across space—OSM quality is comparable, and sometimes even higher, than authoritative data (see the references mentioned above).
3. COVID-19 and OpenStreetMap
A comprehensive overview of OSM-related use cases during the early phase of the COVID-19 pandemic (approximately the same phase of interest for this work) is provided in [
47]. The authors adopt a holistic approach by considering several use cases from around the world, overall grouped in three categories: (i) use of existing OSM data for COVID-19, (ii) collection of new OSM data for COVID-19, and (iii) academic research with OSM during the COVID-19 response.
The use of existing OSM data in the early stage of the pandemic happened through visualisations of OSM data and geospatial services. The former mainly consisted of dashboards using OSM maps as a background, e.g., in web visualisations showing the number and evolution of COVID-19 cases by country or region, while in the latter OSM data and maps were used to provide specific services such as the identification of areas where traveling was allowed based on the user’s location. The authors also acknowledge that access to the OSM web map tiles—the portions of the OSM basemap generated at different zoom levels—in areas of China and Italy affected by the very first wave of the pandemic, was statistically significant.
The COVID-19 crisis provided also a strong boost for the collection of new OSM data, with the all-time records for the numbers of daily OSM contributors (7209), newly registered OSM users (6259) and newly registered users who contributed data (1019) all set on 14 May 2020 [
48]. The specific ways in which OSM data collection happened highly depended on the status (mainly in terms of availability, completeness and up-to-dateness) of the OSM database across the world. Driven by the Humanitarian OpenStreetMap Team (HOT), an international charitable organisation coordinating mapping in humanitarian contexts, remote mapping was by far the method leading to the highest contribution of data, most notably in African and South American countries where baseline maps were still not available when COVID-19 struck. In those cases, collection of OSM data was requested by local organisations such as Red Crosses, civil protection agencies and other local communities. In other countries where the OSM database was more complete or up-to-date, collection of new data could focus on local, COVID-19-specific information to be collected on the field. With the exception of some global projects such as
healthsites.io [
49], which aims to build an open geospatial dataset of every health care facility in the world, data collection initiatives were usually coordinated by national, regional and even local OSM communities and focused on adding to OSM—sometimes also through the help of bulk imports—more detailed information such as pharmacies, number of beds in hospitals and opening hours of commercial activities. The use cases to fight COVID-19 in Italy, described in
Section 4, all belong to this category.
Finally, the literature review presented in [
47] shows that, still in the early months of the COVID-19 pandemic, OSM data was heavily used in research studies published in medicine and health-related outlets.
4. OpenStreetMap Use Cases to Fight COVID-19 in Italy
Section 3 showed how the global OSM community contributed and made use of OSM data to support actions during the first months of the COVID-19 pandemic. In contrast, in this section we restrict our focus on OSM activations in Italy, which was the first European country to be severely hit by COVID-19 starting from the end of January 2020, with a total of 233,019 infections and 33,415 deaths recorded from that time until the end of May 2020 [
50]. While the COVID-19 pandemic is still ongoing at the time of writing this paper, the following analysis is purposefully limited to the very first months of the crisis, i.e., approximately from February to May 2020, to only consider the first and most immediate reactions of the Italian OSM community. The analysis looks at the specific and diverse initiatives the community carried out in this time frame adopting a data ecosystem perspective, i.e., highlighting actors and their roles (with special focus on the public sector), tools, data and data flows involved in each case. The quality of OSM data contributed in such initiatives is purely evaluated in terms of fitness-for-use, i.e., their actual suitability, usefulness and (potential) value for the specific purpose of addressing the COVID-19 pandemic. Systematic quality assessments are out of scope for the current work, and the general findings from the literature on OSM quality (mentioned at the end of
Section 2) are deemed applicable.
As background information, it is worth saying that Italy is among the top 10 countries in the world in terms of active OSM daily contributors (i.e., contributors making at least one edit to the OSM database per day) with an approximately constant value of 200 [
51]. The Italian OSM community is quite active and well-organised, with multiple communication channels (mailing lists, a Telegram channel, social media and online forum discussions) under the coordination of Wikimedia Italia, the Italian chapter of the OSMF, which provides resources to organise activities and to maintain the software infrastructure used by the community. As mentioned in
Section 2, it is not possible to know exactly who uses OSM data and how. However, from the archives of the Italian OSM mailing list [
52] we know that, among others, some Italian cultural associations and local departments of national emergency associations (e.g., Red Cross, Civil Protection and firefighters) make regular use of OSM data in their activity. We have also gathered evidence that some public sector organisations in Italy, e.g., Piedmont Region, use OSM data as a reference layer to qualitatively check the completeness of their authoritative datasets in view of possible updates [
53].
The remainder of this section is organised around
Table 1, which summarises the initiatives carried out by the Italian OSM community to address the early stage of the COVID-19 emergency in terms of: actors and OSM objects involved in the data creation and data flows; purpose for collecting and using such OSM data; and overall results/effects of the activity. Each of the initiatives is separately described in the following subsections. The quantitative evidence provided in these subsections derives from a processing of the OSM database and its history, performed by the authors using a variety of OSM-related software tools (the Italian database of
taginfo [
54],
Overpass Turbo [
55] and the
Ohsome API [
34,
56]) and made available as a Jupyter notebook at [
57].
4.1. Red Zones
As mentioned in
Section 4, members of the Italian OSM community use several channels to interact and discuss, but the reference one is the
talk-it mailing list [
58]. The first reaction to the COVID-19 outbreak in this mailing list was a thread started on 24 February 2020: just on the previous day, the President of the Italian Council of Ministers issued a decree [
59] activating urgent measures to contain and manage the epidemiological emergency caused by COVID-19 in 11 municipalities labelled as ‘red zones’. As a first action, some Italian OSM mappers suggested to focus on those areas to check and update the map with the aim to support emergency activities. A few sparse mapping activities were thus started in those municipalities, mainly carried out by mappers who were geographically located close to the interested areas. Those activities were mainly focused on adding buildings (tagged as
building = *, depending on the type of building) and Points of Interest (POIs).
Looking at the OSM database in Codogno (province of Lodi, Lombardy Region) and Vo’ (province of Padua, Veneto Region)—the two municipalities, obviously included among the red zones, where the first cases and the first deaths due to COVID-19 were recorded in Italy—the number of newly mapped buildings shows that very specific and rapid mapping actions took place during the first week after the decree, with the addition of about 15 buildings in Vo’ (from 2584 to 2598) and more than 5000 in Codogno (from 302 to 5846). The difference in the mapping effort can be explained by the fact that, while in Codogno very few buildings were available before the beginning of the pandemic, almost all the existing buildings in Vo’ were already mapped. In addition, the analysis of access to OSM tiles performed by [
47] and mentioned in
Section 3 was exactly referred to Lombardy Region, and showed that the OSM map was accessed with a significantly high frequency during the early phase of the pandemic.
4.2. Pharmacies
Health facilities and services are places of paramount importance to access during epidemic emergencies. As mentioned in
Section 3, at the global scale the
healthsites.io project [
49] aimed to add accurate healthcare location data to OSM to support the COVID-19 response. In Italy, even before the pandemic unfold, the Ministry of Health released the national dataset of the location of pharmacies [
60] as open data under the Italian Open Data Licence v2.0 [
61].
On 21 March 2020 the Italian OSM community started a discussion on the
talk-it mailing list [
62] to propose the use of the aforementioned dataset to update the location and information about pharmacies (tag
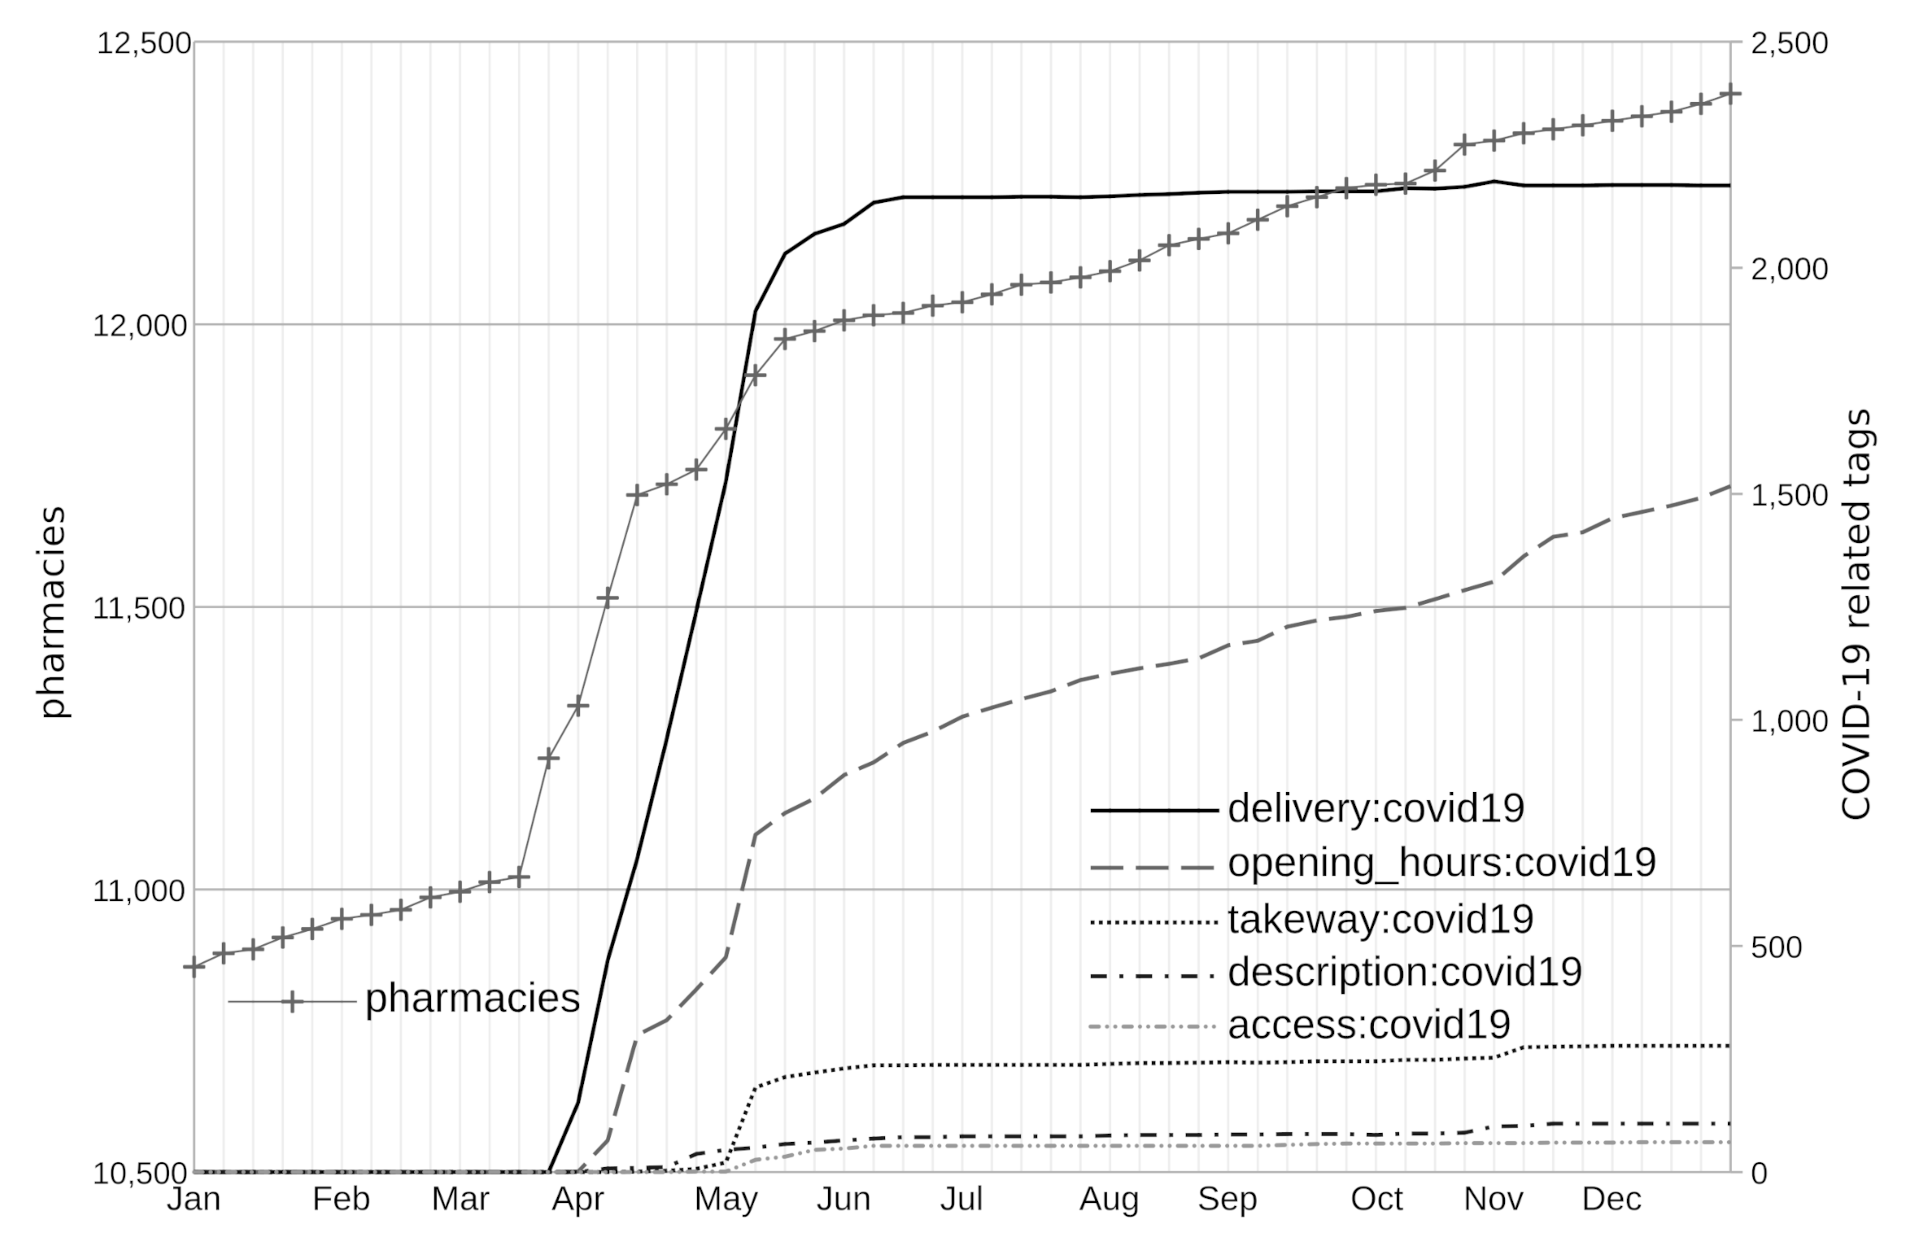
amenity = pharmacy) in OSM. Especially during the first phase of the pandemic, pharmacies were in fact the primary places where people could find protective face masks. Therefore, a detailed and updated mapping of available pharmacies was an effective way to help address the spread of the virus. The Ministry of Health’s dataset currently includes about 30,000 active pharmacies, while the OSM database in Italy counted about 11,000 as of mid-March 2020. During the first two months after the start of this mapping activity (i.e., until the end of May), Italian mappers added nearly 1000 new pharmacies to OSM, increasing the available information by approximately 9.5% (see
Figure 1). After this first period, and with the general improvement of the COVID-19 situation in Italy happened towards the summer, the rate of addition of new pharmacies gradually decreased (see
Figure 1).
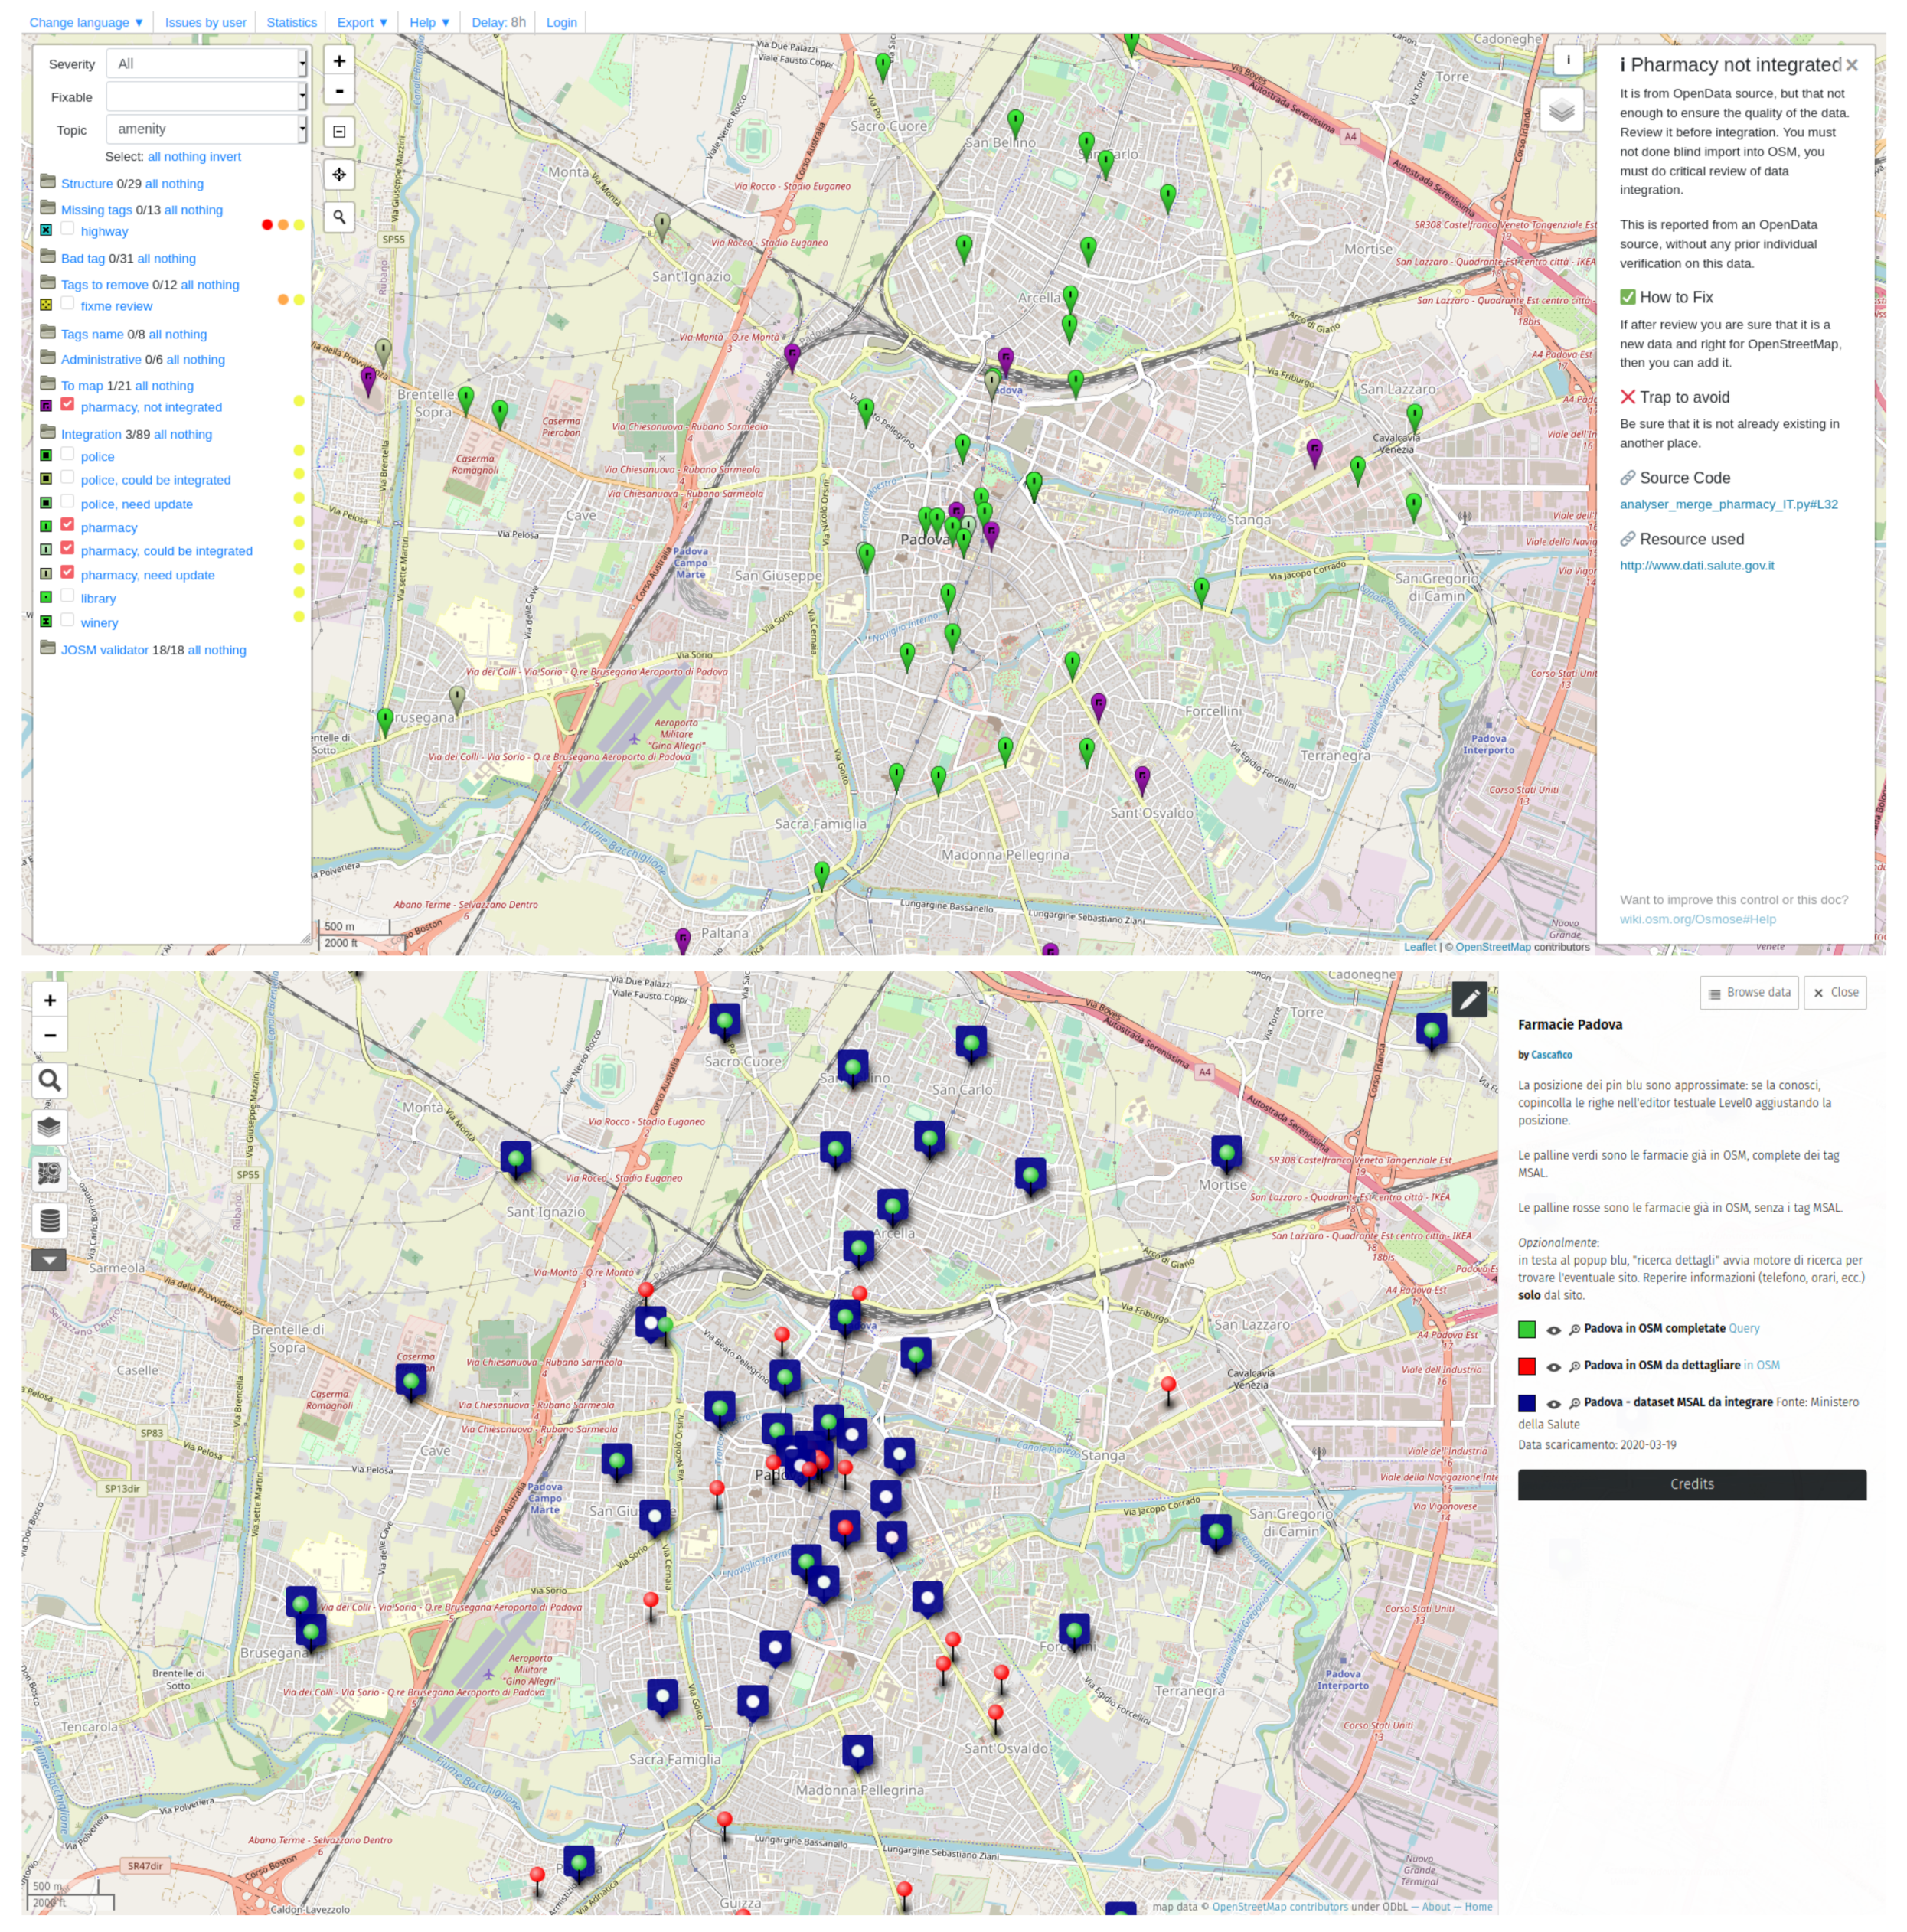
Several users highlighted the poor quality of the geographic locations of pharmacies in the dataset from the Ministry of Health, which sometimes were even some hundreds of metres away from the real locations. This reason—in addition to the usual challenge of ensuring not to duplicate information that already exists in OSM—made a bulk import of the whole dataset inside OSM extremely dangerous to perform. Given this limitation, only localised updates and integration of pharmacies were done, mainly through projects created by members of the Italian community using two online tools:
Osmose [
63] and
uMap [
64] (see
Figure 2). This process was typically performed through: (i) the manual inspection of the information about pharmacies included in the authoritative dataset; (ii) its comparison with the information included in the corresponding OSM pharmacies, if existing; and (iii) the addition or modification of the corresponding OSM pharmacies (position and tags, the latter including e.g., name, address and national reference id), if needed.
4.3. Delivery Services
Another core mapping activity performed by the Italian OSM community during the early stage of the COVID-19 pandemic was the creation and update of COVID-19-related information about commercial activities. This activity was not only limited to Italy, since it happened as well in some other European countries but not in the rest of the world. A partial explanation is that this detailed mapping (see below) could only take place when specific baseline information is already available in OSM, which is not yet the case in many areas of the world (see also
Section 3).
More in detail, the global OSM community quickly reacted to the pandemic by creating a COVID-19 tagging system [
65], i.e., a set of new OSM tags to characterise several elements of commercial activities that could be impacted by the effects and legislative rules caused by the pandemic. Those elements included, e.g., the opening hours of the businesses (that in most cases were changed, even multiple times, as a consequence of the national or local rules in place) and the delivery or takeaway services specifically activated (or kept active) by shops and restaurants during the lockdown period(s).
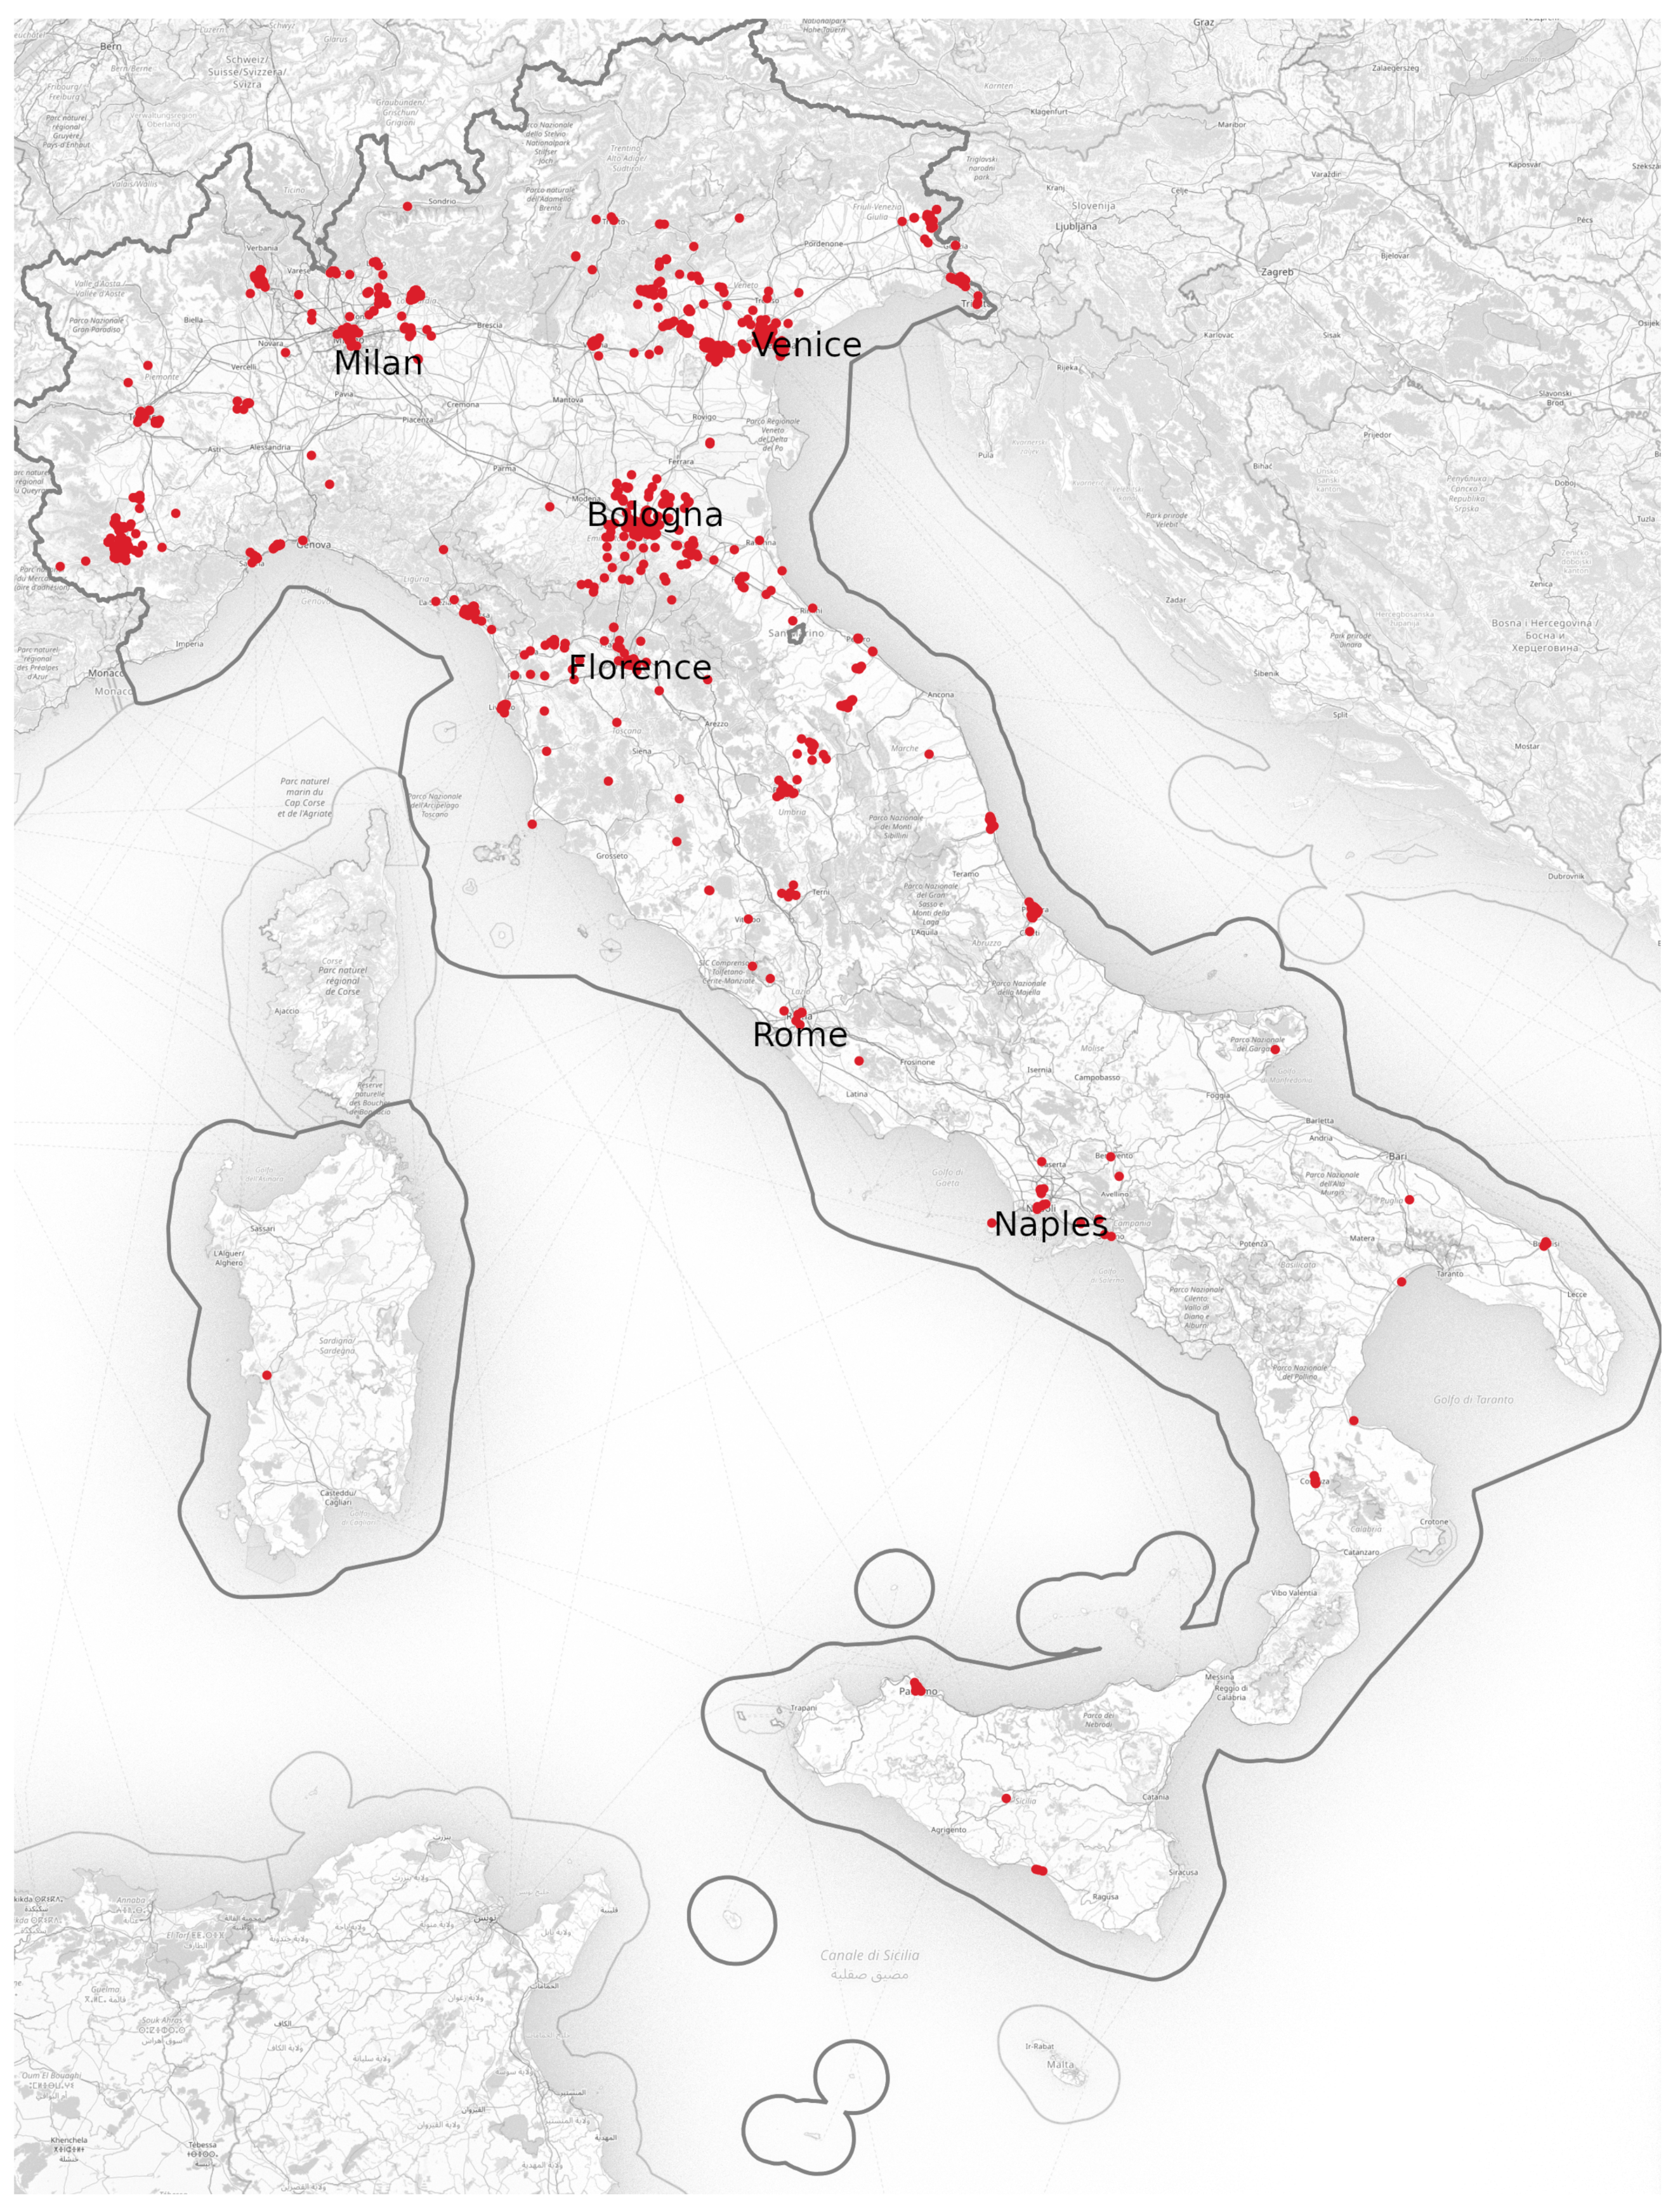
Table 2 lists the most popular OSM keys introduced to map COVID-19 attributes of commercial activities, providing for each one a description, the number of occurrences in the whole OSM database and the number of occurrences in Italy as of 31 May 2020. Italy accounts for a tiny percentage of the total number of occurrences (1–4%) for all keys, with the exception of
delivery:covid19. This key was used (in addition to the already available
delivery key) to describe whether a commercial activity offered a delivery service during COVID-19 times (possible values are
yes,
no and
only) and around 24% of all its occurrences were in Italy. This was due to the detailed mapping activity (requiring the acquisition of very local information) performed by the Italian OSM community—and mostly concentrated around the largest cities in Northern Italy (see
Figure 3)—especially during the first lockdown period, lasted until May 2020. After that, mapping activities focused on COVID-19-related tagging drastically decreased, with the exception of information on opening hours, which continued to be collected during the following months (see
Figure 1).
Meanwhile, during the first months of the pandemic many public sector administrations in Italy (mainly municipalities, i.e., the smallest administrative units) started parallel initiatives to collect similar information on delivery services in their area and to disseminate that information to citizens. The way in which this was done varied greatly between municipalities, according to, e.g., the size of the area and the mapping/IT services of the municipality that were already in place. Two main variants can be summarised: (i) the release of openly-licensed datasets in interoperable, machine-readable formats through official (already existing) catalogues or portals; and (ii) the dissemination of unstructured documents (PDF files, images, spreadsheets) via simple web pages or through social media.
The first category included, among others, the municipalities of Bologna and Milano, which released ad hoc, structured datasets (in CSV and JSON/GeoJSON formats) through both static web pages and their open data (geo)portals at [
66,
67], respectively. These datasets were licensed under the CC BY 4.0 open licence [
68] with the additional specification required to satisfy the compatibility with OSM’s ODbL license. As usually, the release of those datasets was brought to the attention of the community and discussed on the
talk-it mailing list, but in both cases a full import was not completed. This was mainly due to the strict rules required for importing external datasets into the OSM database, concerns about some attributes included in the datasets and the lack of volunteers available on site to perform a quick data validation (with the additional constraints imposed during the lockdown). In the case of Bologna, the import procedure was described in the OSM wiki [
69] and then—similarly to the case of pharmacies described in
Section 4.2—performed (but not fully completed) through the use of
uMap [
70].
Under the second category, several municipalities activated networks (sometimes in collaboration with local newspapers or companies) to collect similar information on delivery services offered by commercial activities to citizens, but they disseminated it using nonstandard and non-geospatial formats and services, e.g., through simple lists published in HTML pages or PDF files and spreadsheets downloadable from the web, and without a specific licence. We are aware of at least eight small and medium-sized Italian local administrations (Carrara, Cuneo, Gubbio, Padova, Rubano, San Pietro in Gu, Savigliano and Venezia) where, thanks to the work of some OSM volunteers (often one single person in each administration), those lists were reused to improve the OSM database with information on delivery services (see
Table 3). Information on the existence of these initiatives was disseminated by word of mouth (mainly through the
talk-it mailing list and social networks) and through some online dissemination events, which facilitated their later replication in other areas.
4.4. Maps to Visualise COVID-19-Related Information
Concerning the activities presented in
Section 4.3, an effort was also made at various levels to make the information added to OSM more easily accessible to general users and citizens. This was necessary since all the new tags created and used by the OSM community to describe COVID-19-related information (see
Table 2) are not within those rendered on the standard OSM map available on the OSM website [
13] (based on the CartoCSS style [
71]) and thus are not visible to general users. Two approaches were followed to increase access to those data: the first at the local and the second at the national scale.
In relation to the former, in most of the cases listed in
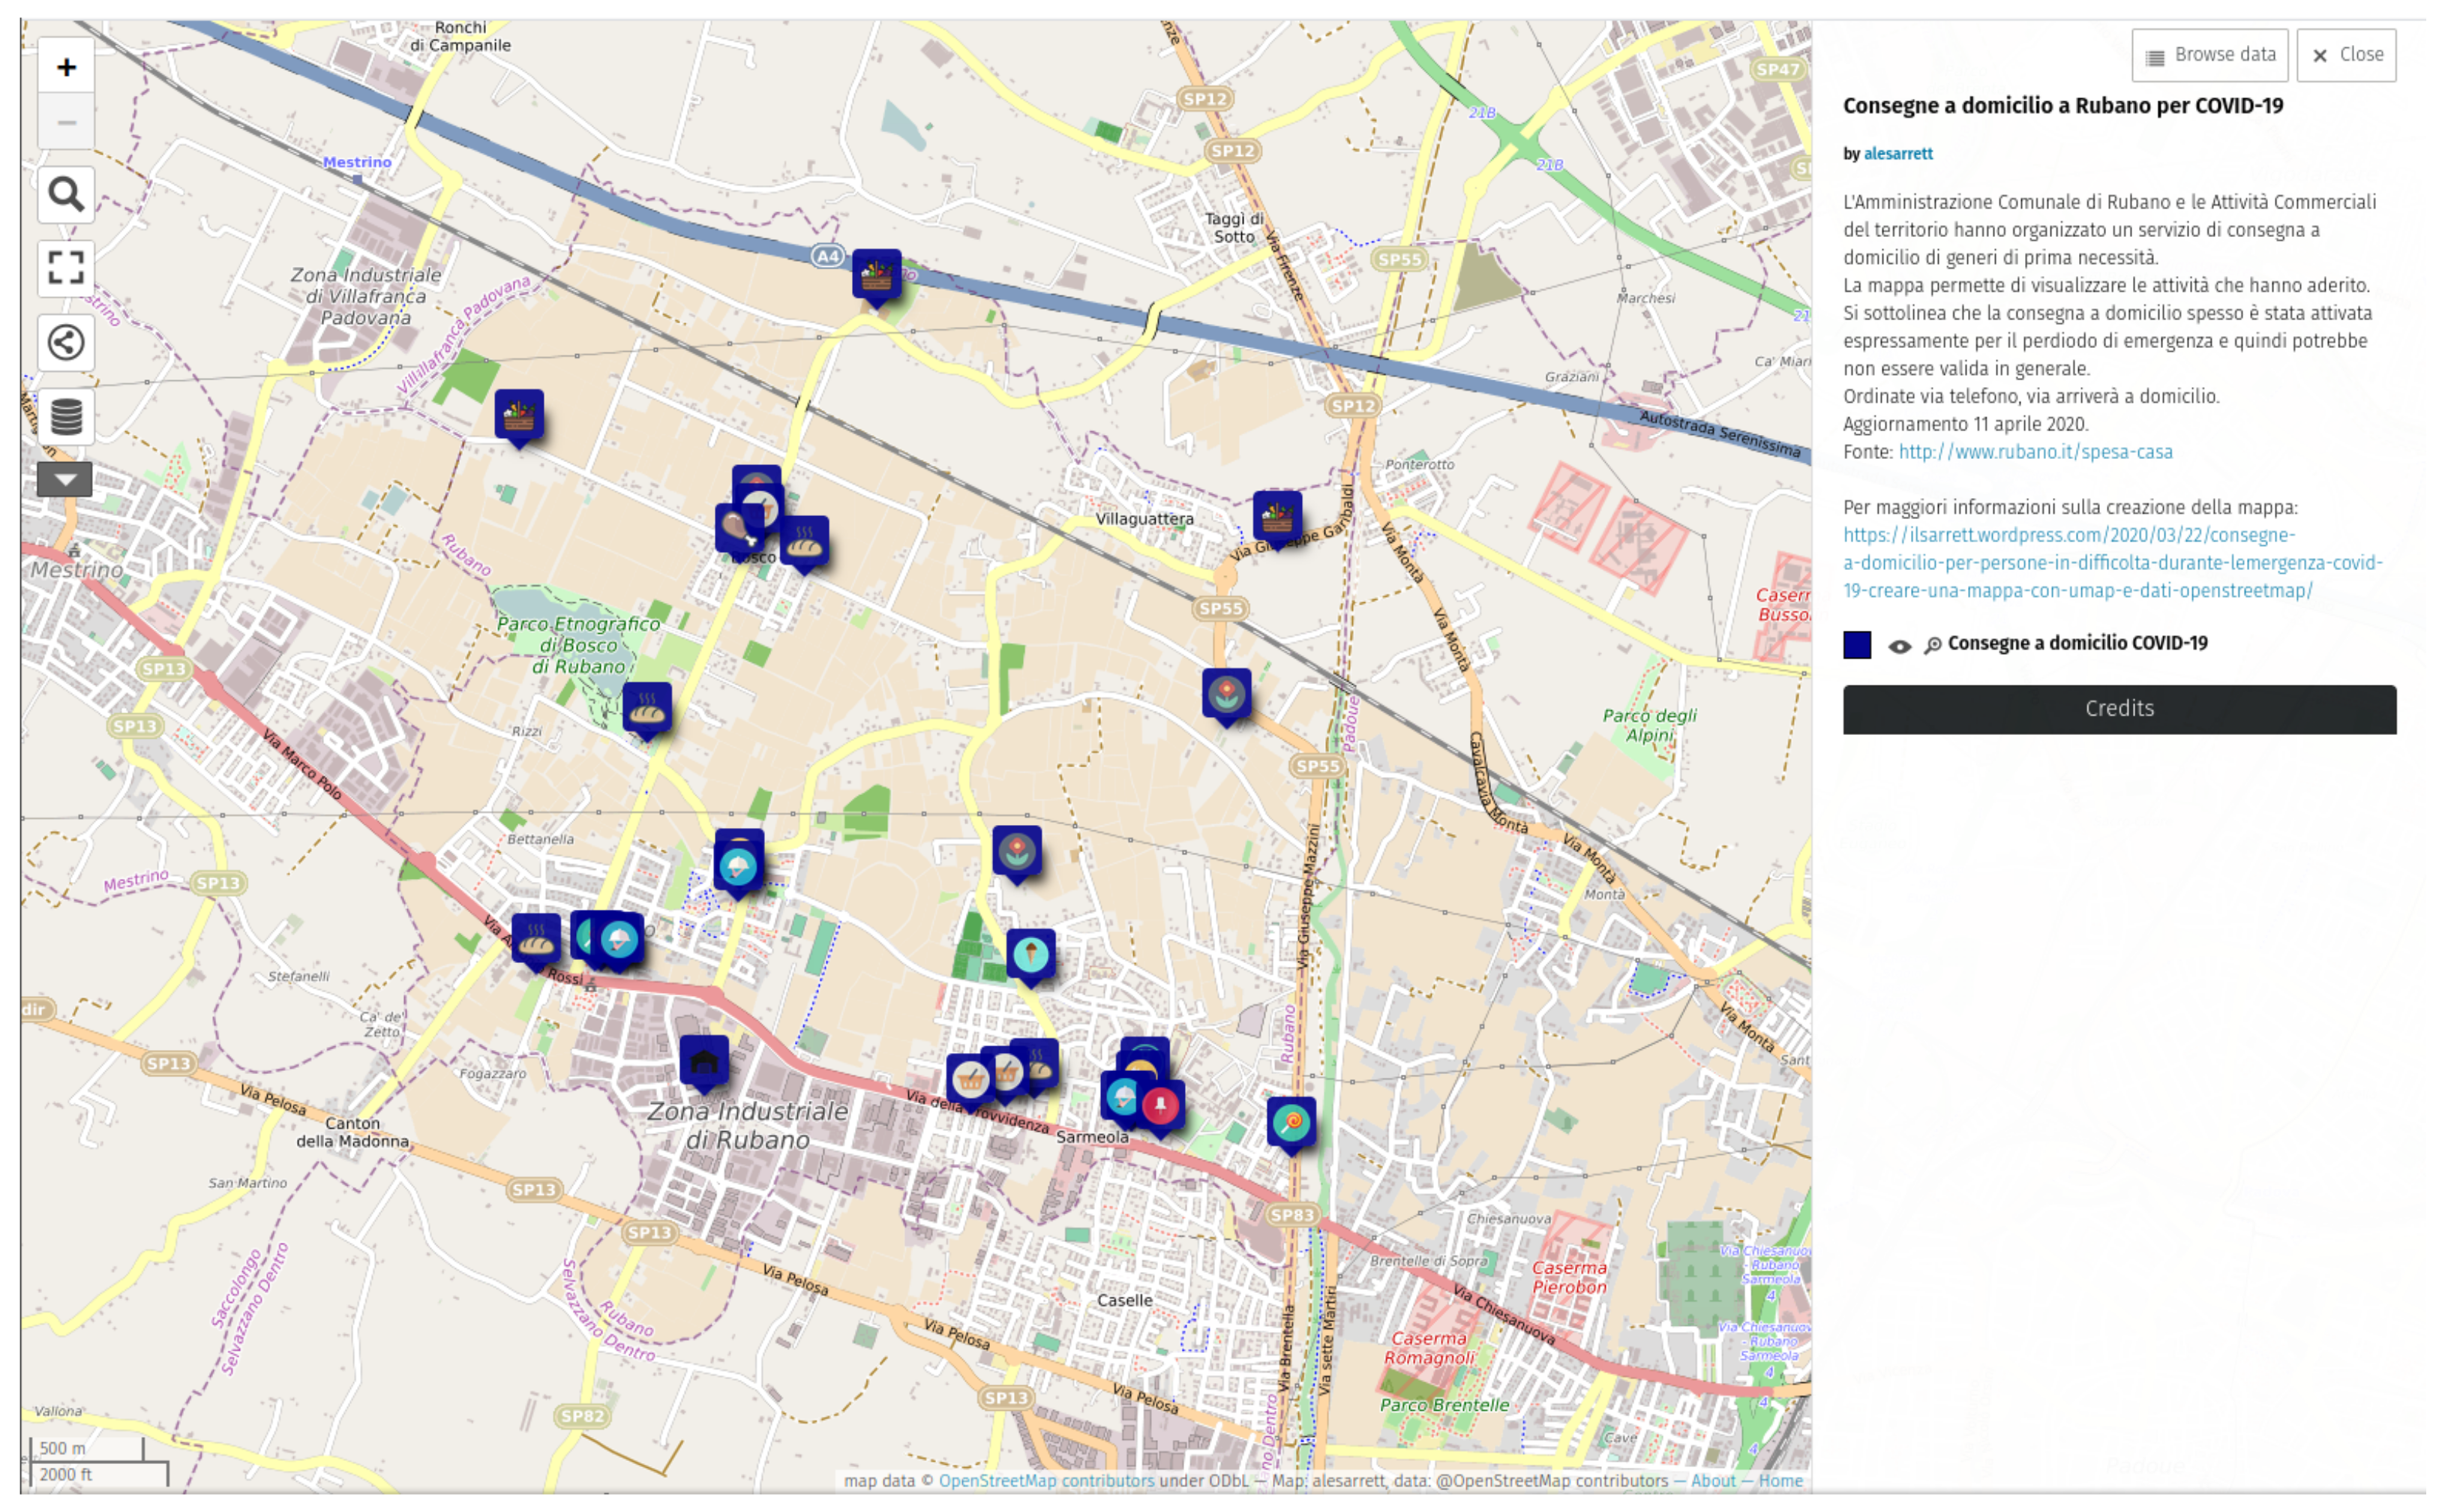
Table 3, OSM mappers—usually living in or having a deep knowledge of specific areas—created simple web maps to show the COVID-19-related information provided by local municipalities and previously added to OSM, thus making it easily accessible to general users. Beginning with the first examples of Cuneo and Rubano (the latter shown in
Figure 4), all maps were once again made using
uMap [
64], which allows users to define custom point icons representing categories of commercial activities. The links to such web maps (see
Table 3) were shared with citizens and with the local administrations themselves, which in some cases recognised the effort and the usefulness of the maps, and included links to them in their institutional web pages. An example is available at [
72].
At the national scale, the Italian OSM community joined
Ça reste ouverte [
73], an initiative started by the French OSM community reflecting a country-wide approach to the OSM mapping of open and closed commercial activities, based on both the new COVID-19-specific tagging (see
Section 4.3) and a list of rules derived from the national and regional laws applied in the country to address the pandemic. A few Italian mappers contributed to the project by translating the interface of the portal into the Italian
Restiamo aperti [
74,
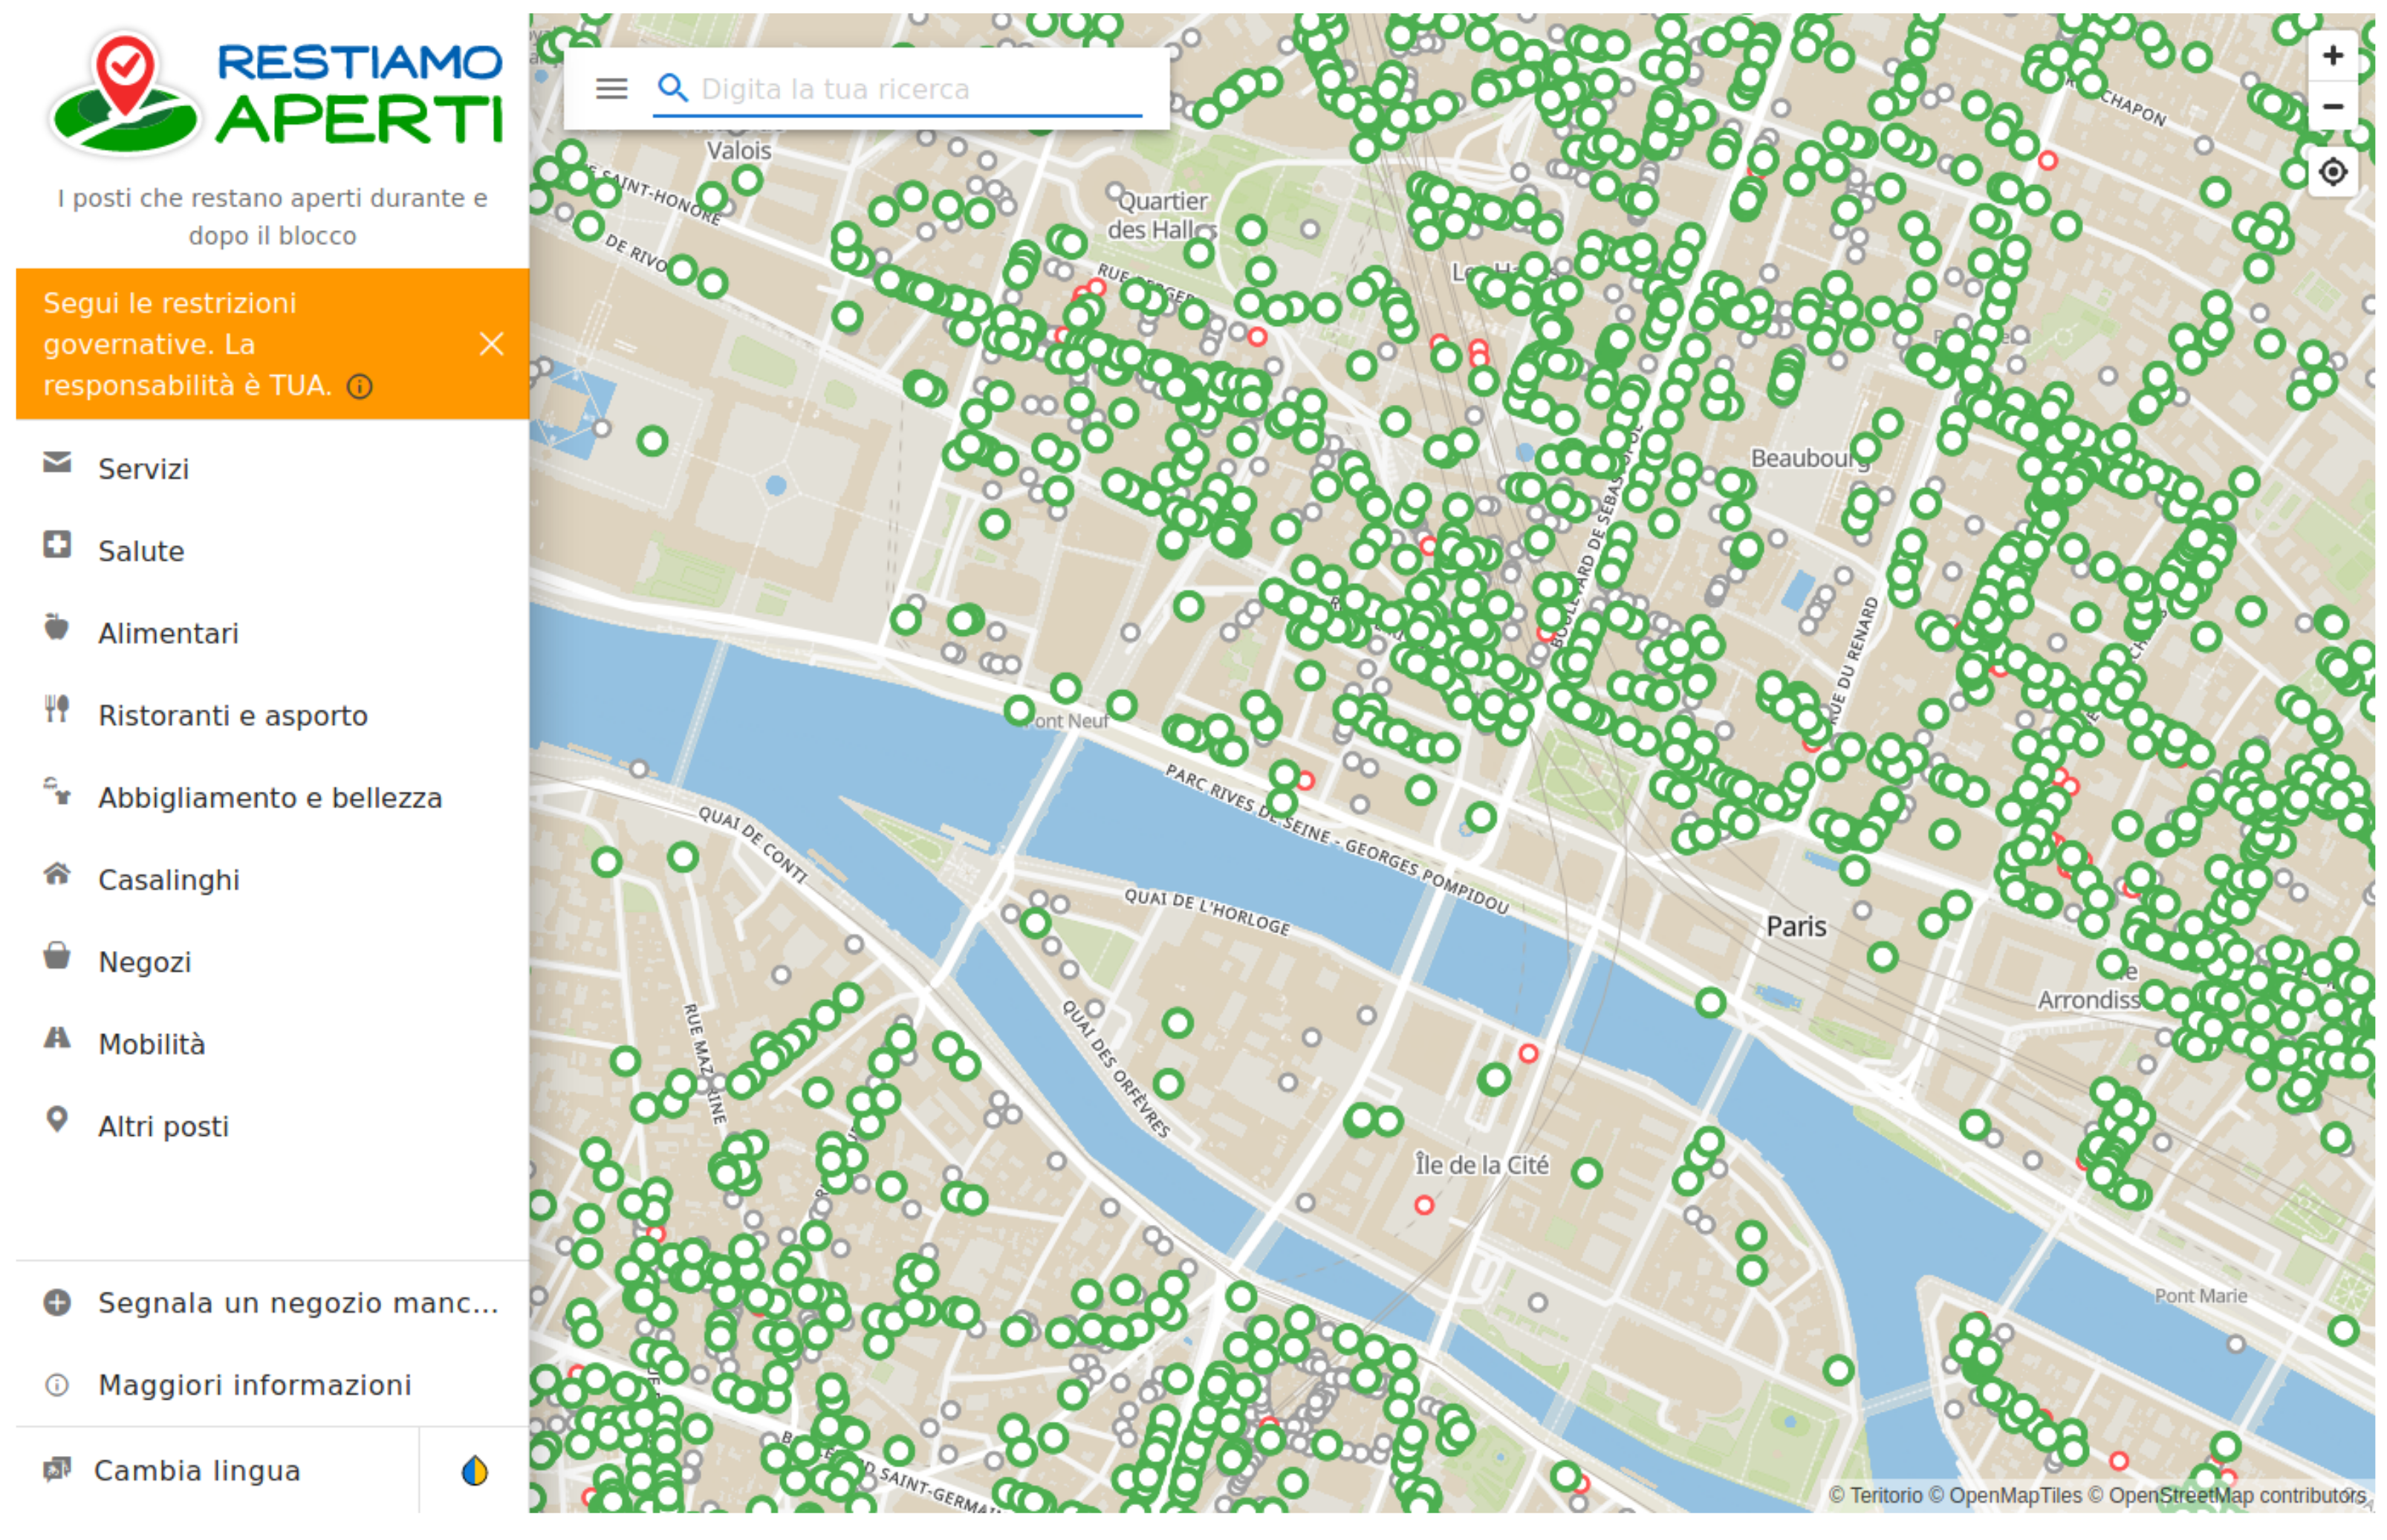
75] (see
Figure 5) and defining the categories of shops/activities to be included in the project for the Italian implementation.
The project Ça reste ouverte was mainly active during the very first lockdown period started in March 2020, while the Italian implementation was officially available (through the support of Wikimedia Italia, which bought the web domain) only since the beginning of May. At the end of September 2020, once the pressure from COVID-19 eased over the summer months, both the original (French) and the Italian portals were dismissed, since information on closure of commercial activities was no longer necessary as most activities had already reopened and/or come back to prepandemic opening hours. However, when a new COVID-19 emergency started in November 2020, the original portal was opened again while the Italian one was kept off, mainly because COVID-19 restrictions became more and more local (at the level of regions, provinces and even municipalities), rather than national and thus they were very difficult to be followed and reflected in the OSM data.
4.5. Development/Update of Specific OSM Tools
Ideally, the activities described so far could have been also organised and coordinated using collaborative editing tools such as the
Tasking Manager software developed by HOT [
76], which coordinates OSM collaborative mapping projects performed by remote volunteers. The Italian OSM community used to have a local instance of the
Tasking Manager in the past, which, however, was based on an old and unsupported version of the software that was not working properly at the time the COVID-19 crisis unfolded. This was one of the reasons why most of the activities were carried out, or at least started, by individual mappers. In any case, a side effect of this issue was the proposal by the OSM community to reactivate the use of the Italian
Tasking Manager, which was financially supported by Wikimedia Italia and led to the deployment and operation of an updated version of the software since early 2021 [
77].
In addition to the most obvious action of contributing COVID-19-related data directly to OSM, the pandemic created a favourable and stimulating environment for the development of new software to improve OSM data collection in general. First, after a long discussion in the
talk-it mailing list, an open source web application was created [
78] to allow general users (with no previous OSM knowledge) to map the location of addresses, which are among the key objects in OSM (as well as in any other database) regardless of COVID-19. By selecting a position on a map and filling a simple web form, the address is translated into an OSM note [
79], i.e., a geolocated description visible to OSM mappers who can then use it as a source of information to add an OSM address feature. The web application provided also a quick overview on the OSM project targeting beginners. An evolution of this tool was another open source web application [
80], created again by the Italian OSM community with the goal of helping general users without previous OSM experience to map commercial activities and their related attributes, including COVID-19-related information (see
Table 2).
5. Discussion
Building on the initiatives carried out by the Italian OSM community presented in
Section 4, in this section we reflect on the role played by OSM within the geospatial data ecosystems emerged in Italy in the aftermath of the COVID-19 emergency.
The first and most obvious evidence is that the Italian OSM community was able to create/update data (and related maps) with a level of scale and granularity higher than any other dataset that local administrations could have ever produced within the same period of time. This applied, e.g., to building data in red zones (see
Section 4.1) as well as information on delivery services (see
Section 4.3). In the latter case, it is true that few municipalities were also able to collect data on the opening hours and delivery options of the commercial activities available in their areas and share these with citizens. Even when this happened, it was almost impossible for them to: (i) identify the details for all existing commercial activities; (ii) identify those details in a reasonably short amount of time; and (iii) keep those details updated, especially given how frequently they changed during the early stage of the pandemic. Outsourcing tasks such as these—that need to be completed in a short amount of time and requiring a deep local knowledge—to the crowd is exactly one of the main reasons behind the success of OSM [
14].
More in general, top-down approaches typical of traditional Spatial Data Infrastructures (SDIs), where the public sector is the only producer of and responsible for geospatial information, are increasingly replaced by nonlinear models where different actors, including citizens, have their say in producing and updating (rather than only consuming) geospatial information [
12]. Several recent studies agree in considering such geospatial data ecosystems as the modern evolution of SDIs, see, e.g., [
81,
82,
83,
84]. The initiatives presented in
Section 4 well reflect this, depicting OSM as the centrepiece of multiple data ecosystems at the local (municipality or city) level, where several actors contribute in both providing and consuming data (see
Table 1). Going even beyond, the OSM project itself—meant as the database together with the surrounding community of contributors, users and stakeholders [
22]—can be seen as a complex data ecosystem where data is also produced (in addition to being used) by a multitude of actors (each for their own purpose), including governments (mainly through imports, see the official catalogue at [
85]), businesses and non-governmental organisations [
15,
16,
86].
Interoperability is a key aspect of any data ecosystem and one of the main success factors of OSM. In all the cases described in
Section 4, OSM interoperability made it possible to seamlessly aggregate and use data—originally collected by multiple contributors at the local level—for any use case at the urban, regional and even national scale. From the semantic perspective, interoperability is ensured by the simplicity of the OSM data model and the set of tags collectively defined and agreed upon by the community. For example, there has been no other initiative outside OSM capable to build a semantically consistent database on delivery services during the COVID-19 pandemic (see
Section 4.3). The technical interoperability of OSM data to fight the pandemic was also ensured by default, since the whole database is provided in the same coordinate reference system and can be downloaded and processed in all formats supported by mainstream Geographic Information Systems (GIS) tools [
21]. Finally, all OSM data—no matter how and where it was collected—is available under the same open access license (the ODbL, see
Section 2), thus intrinsically ensuring the legal interoperability.
All such interoperability levels of OSM data, which in some cases can be even higher than in national and continental SDIs [
21], have been exactly the main driver for the establishment of an ecosystem of software tools (typically open source) specifically designed to download, extract, process, analyse and visualise OSM data [
14,
21]. Among others, these include
uMap and
Osmose that were widely used by the Italian community to both control the process of adding authoritative data (pharmacies and commercial activities, see
Section 4.2 and
Section 4.3) into OSM, and create custom maps to visualise OSM data on commercial activities offering delivery services (see
Section 4.4). The open source tools adopted or newly developed by the Italian community itself during the early stage of the COVID-19 pandemic (see
Section 4.5) are just other examples of how easy it is to build new software solutions based on an interoperable database.
The initiatives described in
Section 4 to address the COVID-19 pandemic in Italy allow us also to shed light on the governance of the related local data ecosystems and of the OSM database in general. Relying on the classification of emerging models of data governance proposed in [
87], we could best associate OSM-related data ecosystems to the case of data cooperatives. This is because the overall approach is decentralised, i.e., the actors participating in the ecosystems (mainly OSM contributors and public bodies) share data voluntarily—a phenomenon termed ‘data altruism’ in the European strategy for data [
8]—yet they retain control over the way those data are shared and managed. What maintains a relationship of trust within the cooperative is the OSM ODbL license, which acts as a legally binding contract between all parties. In the early stages of the COVID-19 emergency in Italy, whatever was the underlying motivation [
88], OSM contributors added new data that could be used by any actor under the terms of the ODbL. Similarly, public bodies such as the Ministry of Health in the case of pharmacies (see
Section 4.2) and the municipalities of Bologna and Milano in the case of commercial activities (see
Section 4.3) gave consent to reuse their data under the terms of the ODbL. It was exactly for these reasons that anyone else could further reuse those data (and any part of the OSM database in general) while still meeting the terms of the license. Examples are Red Crosses and civil protection agencies, but also the volunteers who created customised maps to better visualise the data (see
Section 4.4), researchers like us who studied the COVID-19 societal response and potentially anyone else willing to benefit from the data ecosystem.
In this context, the relationship between authoritative (geospatial) data collected by the public sector and crowdsourced OSM data collected by citizens deserves an additional reflection. Having said above that traditional SDIs no longer exist since multiple additional data sources have become mainstream, it is the appropriate time to think whether traditional processes for data collection/updates from the public sector still make sense or a shift towards the (larger) use of OSM data is somehow necessary. A recent report compiled by geospatial experts from different sectors (academia, businesses, standardisation bodies and other associations) urge the public sector to consider stopping the production of geospatial data at scales that are readily available on other platforms, including OSM, and think instead of supporting those platforms through long-term partnerships [
81]. According to the same report, sustainability is even at a higher risk for smaller municipalities, for which, “to survive and prosper in an ecosystem, collaborators could be OpenStreetMap and/or open-source software developers” [
81]. On the other hand, a close cooperation with governments at all scales is also recognised as being at the core of OSM sustainability [
89]. The initiatives described in
Section 4.3 and
Section 4.4 are perfect examples of how such collaborations could be beneficial to both the public sector and the OSM community.
Building once again on the experiences described in
Section 4, a separate reflection is needed about the activities and the internal governance of the OSM Italian community during the early stage of the COVID-19 pandemic, and of the OSM community in general. All the initiatives to fight COVID-19 in Italy were started or highly driven by one or few contributors, who decided to dedicate their time to discuss with the community, add new data to OSM, organise mapping projects, develop new OSM software tools, etc. The only scale at which this approach could generate a concrete and innovative effect is the local one (i.e., city or municipality, see
Figure 3 for a significant example). This is exactly at the core of the whole OSM project, which is based on the idea that many contributors dispersed across the world (the crowd), each with a knowledge of a particular local area, can all together create and update a global map [
14]. As the Italian experiences have shown once again, innovation in OSM always starts local yet holds the potential to scale up and become global. What happened in the Italian case reflects well the decentralised nature of the OSM project and community, organised around a do-ocracy model where “actions speak louder than words” [
90].
Following from this, the initiatives carried out by the Italian community to fight the COVID-19 crisis point out another key aspect of OSM as an ‘innovation lab’, i.e., a place where—facilitated by the use of the OSM open and interoperable data and open source software tools—experiments are performed in an agile and flexible manner, and new solutions are seamlessly proposed, evaluated and improved by the community based on continuous cycles of user feedback. Such a peculiar feature of OSM explains why certain activities may not be well-structured and in some cases start but are eventually not completed, see, e.g., the import of datasets of commercial activities offering delivery services published by the municipalities of Milano and Bologna described in
Section 4.3. In other words, the “sandboxing” approach adopted in OSM may not always lead to full and bullet-proof results—the same objective of OSM, i.e., the creation of a database including any geospatial object in the world, is by definition impossible to complete—but prove that new and innovative approaches work in practice and hold the potential to be scaled. In the same case of commercial activities offering delivery services, the approach started by OSM was then reused by several other actors, including, e.g., Google that created and still maintains its own database.
As a final discussion point, it is interesting to relate the nature and dynamics of the OSM-based urban data ecosystems described in
Section 4 to the findings in [
84], where authors provide a list of 37 recommendations on the approaches needed to ensure the evolution of contemporary SDIs into self-sustainable data ecosystems. Those recommendations are articulated into four categories pertaining to the governance of the ecosystems, the engagement of stakeholders, the technical dimension and the economic sustainability. We leave to the readers to check those recommendations in detail, as we simply highlight that the OSM-based data ecosystems created in Italy to address the COVID-19 crisis, and to a large extent the OSM project itself, inherently implement the vast majority of them.
6. Conclusions
In this paper we analysed the initiatives carried out by the Italian OSM community to address the early stage of the COVID-19 pandemic (approximately from February to May 2020) in Italy, which was one of the first countries in the world to be severely affected. While different in terms of dynamics, datasets and actors involved, those initiatives shared the objective to help fight the crisis by making available, in a short amount of time, new data and new services through the OSM project.
We used those initiatives as a means to analyse the OSM-based geospatial data ecosystems that emerged at the local level, and even the OSM project itself seen from an ecosystem point of view. To conclude the paper, we now relate the findings back to the European policy context around data sharing with a view to understand what contribution OSM could potentially bring to the establishment of the data spaces envisaged by the European strategy for data [
8] and reflect on opportunities to exploit and challenges to address. We do that through an analytical approach, where we discuss how well OSM is positioned to address each of the problems listed in the European strategy for data that currently hold the EU back from realising its potential in the data economy.
Availability of data: OSM is the most complete geospatial database in the world, offering a global (i.e., also European) coverage and an extremely high granularity up to the local scale. In contrast to many datasets provided by national mapping agencies across Europe, the open license of OSM data allows immediate integration and reuse in any GIS system. The literature offers several examples where OSM data is used “for the public good” as mentioned in [
8], e.g., to combat emergencies [
91] and to improve public services, as shown in this paper.
Imbalances in market power: OSM prevents the creation of market imbalances because everyone—from the public sector to businesses, academics, non-governmental organisations and citizens—has the same right of access and reuse of OSM data under the terms of its ODbL license.
Data interoperability and quality: The default interoperability ensured by the OSM data model makes OSM data readily available for consistent use across borders, while the simplicity of the model itself allows for an easy conversion of the data in any GIS format. As mentioned in
Section 2, OSM quality in all its components (e.g., positional accuracy, completeness, semantic accuracy, temporal accuracy and up-to-dateness) is typically heterogeneous across space yet was demonstrated by the literature to be comparable, if not even higher, than authoritative data at least in specific areas.
Data governance: Roughly based on a data cooperative governance model regulated by the ODbL license, the OSM project welcomes any actor in both collecting new data and making use of the existing data. Both the public and the private sector have a key role in shaping today’s OSM ecosystem [
15,
85].
Data infrastructures and technologies: The OSMF maintains the core infrastructures and services of the OSM project. In addition, a rich ecosystem of innovative (open source) tools was created and is improved on a continuous basis by OSM communities and third parties to facilitate the extraction, download, analysis and use of OSM data for multiple purposes [
14].
Empowering individuals to exercise their rights: When adding data to the OSM database, contributors retain control over the way that data is shared and managed by agreeing to the legal terms of the license. All services operated by the OSMF comply with a clear privacy policy [
92] and the mapping guidelines prohibit mapping personal information that violates the privacy of people [
93].
Skills and data literacy: There is a very low entry barrier to the OSM project. Volunteers can easily learn how to contribute and use data, which is ultimately one of the success factors of OSM. A huge amount of learning material is available (see e.g., the resources provided by
LearnOSM [
94] and
TeachOSM [
95]) and educational efforts targeting the young generations exist at the global level, e.g., through the YouthMappers network [
96].
Cybersecurity: The whole content of the OSM database, including the full history of changes, is perpetually and securely stored in the database and can be used under the terms of the ODbL. The crowdsourcing philosophy behind OSM makes it possible to vandalise the database (as already happened in the past) but those changes are usually spotted and reverted by the local communities in a very short period of time [
97].
The discussion above demonstrates that OSM could offer an important contribution to the establishment of the data spaces described in the European strategy for data [
8]. Being geospatial information pervasive, several domain-specific data spaces could benefit from OSM, primarily including the European Green Deal data space, the European agriculture data space, the European mobility data space and the European health data space. This will not happen without certain challenges needing to be addressed. First, as demonstrated by the Italian initiatives to fight COVID-19, OSM communities have a huge potential to innovate but they mainly act in a decentralised way and often rely on the voluntary effort of few contributors. Thus, alone they might not be able to address tasks requiring higher degrees of effort and/or covering wider scales. Collaboration with other actors in the data economy, e.g., through partnerships, joint initiatives or incentives for data collection and use, is not only mutually beneficial but often necessary for the sustainability of data ecosystems. In turn, this calls for a cultural change by all actors, especially the public sector, which should embrace OSM as an opportunity rather than a competitor.
As a next concrete step at the EU level, OSM may strongly support the public sector in implementing the recent Open Data Directive, requiring the provision of so-called high-value datasets (i.e., datasets whose reuse generates strong benefits to the economy and society) under an open license and available through APIs [
98].


