Article

Regulation of Catalase Expression and Activity by DhHog1 in the Halotolerant Yeast Debaryomyces hansenii Under Saline and Oxidative Conditions

by
Ileana de la Fuente-Colmenares
1,2,
James González
1,*,
Norma Silvia Sánchez
3,
Daniel Ochoa-Gutiérrez
1,
Viviana Escobar-Sánchez
1 and
Claudia Segal-Kischinevzky
1,*
1
Laboratorio de Biología Molecular y Genómica, Departamento de Biología Celular, Facultad de Ciencias, Universidad Nacional Autónoma de México, Avenida Universidad # 3000, Cd. Universitaria, Coyoacán, Mexico City 04510, Mexico
2
Posgrado en Ciencias Biológicas, Universidad Nacional Autónoma de México, Avenida Universidad # 3000, Cd. Universitaria, Coyoacán, Mexico City 04510, Mexico
3
Departamento de Genética Molecular, Instituto de Fisiología Celular, Universidad Nacional Autónoma de México, Ciudad Universitaria, Mexico City 04510, Mexico
*
Authors to whom correspondence should be addressed.
J. Fungi 2024, 10(11), 740; https://doi.org/10.3390/jof10110740
Submission received: 3 October 2024 / Revised: 20 October 2024 / Accepted: 24 October 2024 / Published: 26 October 2024
(This article belongs to the Special Issue Stress Research in Filamentous Fungi and Yeasts)

Abstract

:
Efficient transcriptional regulation of the stress response is critical for microorganism survival. In yeast, stress-related gene expression, particularly for antioxidant enzymes like catalases, mitigates reactive oxygen species such as hydrogen peroxide (H2O2), preventing cell damage. The halotolerant yeast Debaryomyces hansenii shows oxidative stress tolerance, largely due to high catalase activity from DhCTA and DhCTT genes. This study evaluates D. hansenii’s response to oxidative stress caused by H2O2 under saline conditions, focusing on cell viability, gene expression, and catalase activity. Chromatin organization in the promoter of DhCTA and DhCTT was analyzed, revealing low nucleosome occupancy in promoter regions, correlating with active gene expression. Stress-related motifs for transcription factors like Msn2/4 and Sko1 were found, suggesting regulation by the DhHog1 MAP kinase. Analysis of a Dhhog1Δ mutant showed DhHog1’s role in DhCTA expression under H2O2 or NaCl conditions. These findings highlight DhHog1’s critical role in regulating the stress response in D. hansenii, offering insights for enhancing stress tolerance in halotolerant yeasts, particularly for industrial applications in saline wastewater management.

1. Introduction

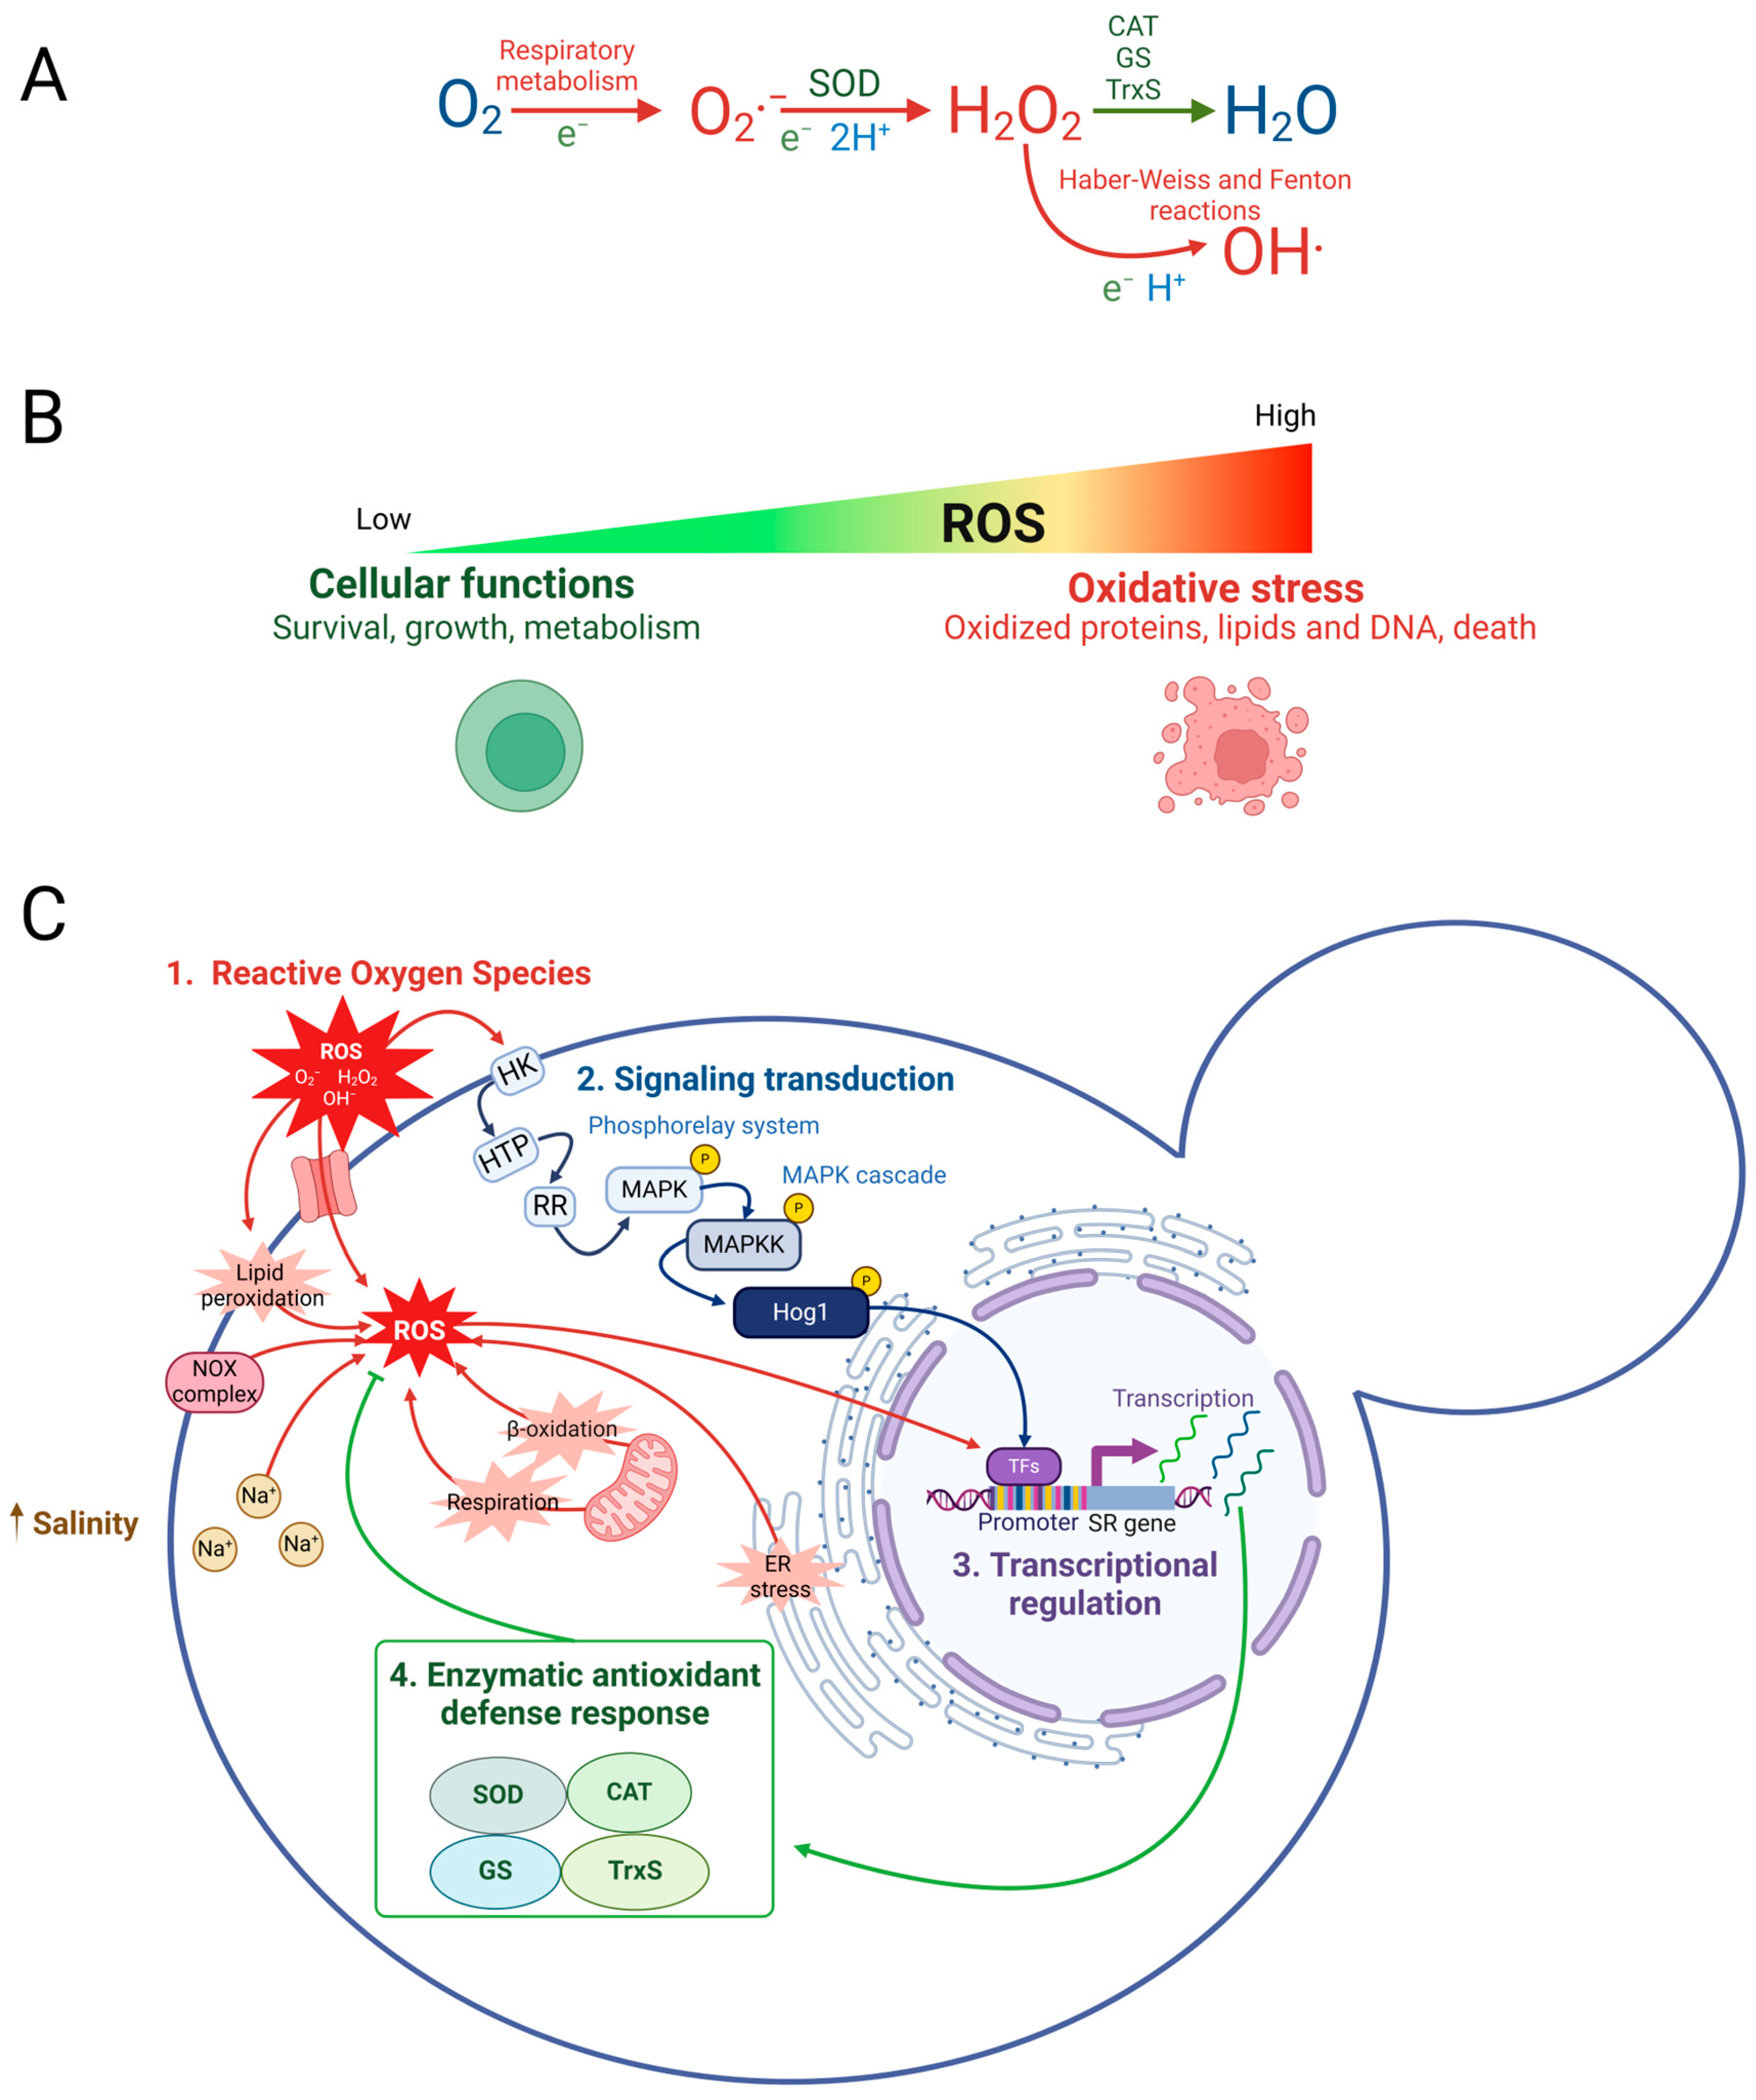
In yeast, exposure to moderate oxidative stress conditions triggers a transient adaptive response [1], enhancing tolerance to higher levels of the same stress [2,3]. Salt and oxidative stress tolerance is acquired through osmolyte synthesis and increased scavenging of ROS [4,5,6]. Oxidative stress primarily arises from internal metabolic processes, particularly respiration, as well as external stressors [7,8,9]. ROS, such as superoxide anions (O2·), hydrogen peroxide (H2O2), and hydroxyl radicals (·OH), are inevitable by-products of aerobic metabolism (Figure 1A). While ROS are crucial for cellular signaling and homeostasis maintenance, their excessive accumulation can overwhelm the antioxidant defenses of the cell, leading to oxidative stress (Figure 1B). This condition occurs when the balance between ROS production and elimination is disturbed, potentially causing cytotoxic effects, such as lipid, protein, and nucleic acid damage, which can result in cell death [7,8,10].
To mitigate the deleterious effects of ROS, aerobic microorganisms have evolved sophisticated antioxidant defense mechanisms, which are particularly crucial in yeast under oxidative stress (Figure 1C) [11,12]. The cellular stress response encompasses a suite of defense mechanisms activated in response to oxidative stress, involving several transcription factors (TFs) such as Msn2/Msn4 (Msn2/4), Sko1, Skn7, Yap1, among others, to regulate the expression of hundreds of genes aimed at countering stress and repairing cellular damage [13,14,15,16,17]. The oxidative stress response is characterized by the upregulation of genes encoding antioxidant enzymes, such as catalases (CAT), which play pivotal roles in scavenging ROS. CAT catalyzes the breakdown of H2O2 into H2O and O2, thereby preventing the harmful accumulation of ROS [11,18,19,20]. The expression of CAT is tightly regulated at the transcriptional level, often involving chromatin remodeling mechanisms that either facilitate or inhibit gene expression in response to oxidative stress [21,22].
Figure 1. Schematic representation of reactive oxygen species (ROS) triggering oxidative stress response. (A) ROS, such as superoxide anion (O2·), are produced during oxygen metabolism and converted to hydrogen peroxide (H2O2) by superoxide dismutase (SOD). H2O2 is further broken down by catalase (CAT), the glutathione system (GS), and the thioredoxin system (TrxS). (B) Low ROS levels maintain homeostasis, while elevated levels cause oxidative stress, damaging lipids, proteins, and DNA, leading to cell death. (C) Oxidative stress response: (i) ROS sources (red) include NADPH oxidases, lipid peroxidation, respiration, β-oxidation, endoplasmic reticulum (ER) stress or external factors such as high salinity (Na+). ROS can disturb redox homeostasis, resulting in oxidative damage. (ii) Signal transduction (blue) involves a phosphorelay system (hybrid sensor histidine kinase HK, phosphoryl transfer protein HPT) and a response regulator protein (RR). This system activates the Hog1 MAP kinase cascade (MAPK and MAPKK), leading to the phosphorylation and activation of Hog1. (iii) Phosphorylated Hog1 modulates transcription factors (purple) like Msn2/4 and Sko1 to regulate stress response genes (SR genes). (iv) Enzymatic antioxidant defense (green, SOD, CAT, GS, TrxS) neutralize ROS. Based on [20,23,24]. Created using BioRender.com with license UY27G222GA.
Jof 10 00740 g001
The yeast Saccharomyces cerevisiae is useful as a model for studying oxidative stress responses, where the high osmolarity glycerol (HOG) MAP kinase pathway plays a central role, which consists of a phosphorylation cascade that activates ScHog1 MAPK (mitogen-activated protein kinase) [25,26,27,28]. The phosphorylated ScHog1 protein is essential for activating TFs (Figure 1C), such as Msn2/4 and Sko1, which are critical for the expression of antioxidant genes [20,29]. The Schog1Δ mutant significantly reduces the expression of these genes, and its cell viability decreases under stress conditions, highlighting its importance in the oxidative stress response [30]. Debaryomyces hansenii, a halotolerant yeast, provides a unique model for studying stress responses due to its ability to thrive in hyperosmotic environments [31,32,33]. These conditions typically induce cellular stress, disturbing redox homeostasis and leading to oxidative damage. Its halotolerance is attributed to the robustness of the hyperosmolarity response of the HOG pathway [34,35]. It has been reported that the phosphorylated Hog1 protein directs the adaptive response for cell survival through glycerol accumulation and reprogramming the expression of genes that mitigate osmotic stress [36]. Unlike S. cerevisiae, D. hansenii displays significantly higher catalase activity, attributed to the expression of two catalase genes, DhCTA and DhCTT, homologous to ScCTA and ScCTT in S. cerevisiae [11,37]. These catalase genes are constitutively expressed under various growth conditions, including saline conditions, suggesting that D. hansenii has evolved a robust antioxidant defense system to cope with its challenging osmotic environments [11,38].
Although the role of the DhHog1 pathway in D. hansenii halotolerance is well established [34,35], its specific contribution to the regulation of catalase expression under oxidative conditions has not yet been evaluated. Given the crucial function of catalases in mitigating ROS-induced damage [11,39], it is essential to understand the mechanisms governing the expression of DhCTA and DhCTT under oxidative stress. This study aimed to investigate the adaptive response of D. hansenii by analyzing catalase expression and activity under saline and oxidative conditions. Our findings indicate that exposure to H2O2 shock reduces cell viability while transiently increasing catalase expression and activity. Additionally, low nucleosome occupancy was observed in the promoters of DhCTA and DhCTT, correlating with their active expression. Finally, DhHog1 was identified as a key regulator of DhCTA expression under both saline and oxidative conditions.

2. Material and Methods

2.1. Strains and Growth Conditions

The D. hansenii Y7426 wild-type (WT) and an isogenic Dhhog1Δ mutant (HOG1::SAT1-yeYFP1), obtained by [35], were used in this study. The WT strain was maintained on YPD (1% yeast extract, 2% peptone, and 2% glucose, w/v) plates with 2% agar (w/v), while the Dhhog1Δ mutant strain was maintained on YPD plates with 2% agar (w/v) supplemented with 150 μg/mL nourseothricin.
Cultures were pre-grown overnight, washed, and inoculated into fresh YPD medium with or without 0.6 M NaCl, as specified in each assay, to an initial optical density at 600 nm (OD600) of 0.05. Cells were then incubated until the mid-exponential growth phase (14–16 h). Cultures were incubated at 28 °C with continuous shaking (180 rpm).

2.2. Growth Curves

WT and Dhhog1Δ strains were grown in YPD with and without 0.6 M NaCl. Cell growth was monitored by measuring OD600. Cultures in the corresponding growth media were inoculated at an OD600 of 0.05 with water-washed cells from the pre-culture and monitored for 72 h. Each growth curve was performed in triplicate.

2.3. Cell Viability After H2O2 Gradient Shock Assay

Cells were inoculated in 5 mL aliquots of YPD with 0.6 M NaCl and different concentrations of H2O2 (0, 2.5, 5, 10, 20, and 30 mM), adjusting the OD600 to 1. The cultures were incubated for 3 h. After the oxidative treatment, H2O2 was removed by washing the cells once with sterile water. The washed cells were resuspended in 5 mL of sterile water and tenfold serially diluted. From each dilution, 10 μL were spotted on YPD plates and incubated at 28 °C for 3 or more days.
H2O2 sensitivity assays at different time intervals were evaluated following a modified method from [40]. Cells were harvested by centrifugation, washed with sterile water, and adjusted to an OD600 of 1 in fresh YPD with 0.6 M NaCl supplemented with 30 mM H2O2. The cultures were incubated for 180 min, with aliquots taken at 0, 15, 30, 60, 120, and 180 min and also spotted on YPD plates and incubated at 28 °C; photographs were taken after 3 or more days.

2.4. Specific Catalase Activity Determination

Cell-free crude extracts were prepared from 50–100 mL aliquots of culture to test specific catalase activity. Cells were lysed in PBS (pH 7) 100 mM + 20% glycerol using sterile glass microbeads (425–600 μm, Sigma G9268, St. Louis, MO, USA) vortexing for 1 min and incubating on ice for 1 min, and the procedure was repeated 4 times. After cold centrifugation for 15 min at 14,000 rpm, protein extracts were kept on ice until the specific catalase activity assay, which was conducted using varying volumes of the extract (1, 2.5, 5, 10, 20 or 40 μL, total volume 1 mL) and protein quantification with the Bradford assay, using a BSA protein standard curve, were performed.
Specific catalase activity was determined by a method adapted from [41]. A sample (1–40 μL) of the cell-free crude extract was mixed with 2.9 mL of assay mixture (100 mM sodium phosphate buffer, pH 7.0, and 1 μL/100 mL Triton X-100) in a 3 mL quartz cuvette. The reaction was initiated by adding 100 μL of 500 mM H2O2 (final concentration of 16.6 mM). Catalase activity was monitored by OD240nm decay over 3 min. Catalase total activity was calculated based on the rate of decomposition of H2O2, which is inversely proportional to the reduction of absorbance at 240 nm. Catalase activities were normalized to total protein and expressed as µmol of H2O2 oxidized per minute per mg of protein.

2.5. RNA Extraction

Strains were grown in YPD with or without 0.6 M NaCl to the mid-log growth phase, and then fresh media was inoculated to have samples of 0, 14, or 24 h. Cells were incubated with or without 30 mM H2O2 for 0, 15, 30, 60, 120, and 180 min. After treatment, cells were washed with sterile water to remove the H2O2. Total yeast RNA was extracted from 50–100 mL of cell cultures following a modified method from [42]. Briefly, cells were washed with sterile DEPC-treated water, resuspended in AE buffer (50 mM sodium acetate, 10 mM EDTA), and mechanically disrupted using a vortex mixer with sterile glass microbeads (425–600 μm, Sigma G9268), phenol pH 4.5 and 0.25% SDS. Then, the samples were incubated for 5 min at 65 °C and vortexed for 30 s twice. The mixture was chilled and centrifuged at 16,000× g to separate the aqueous and phenol phases. The aqueous phase was extracted twice with phenol:chloroform:isoamyl alcohol (25:24:1) and once with chloroform:isoamyl alcohol (24:1). RNA precipitation was performed by adding 0.1 volumes of 3 M sodium acetate and 2.5 volumes of cold absolute ethanol and incubated at −20 °C for 30 min, followed by centrifugation (16,000× g). The resulting pellet was washed in 75% ethanol, air-dried, and resuspended in RNase-free water. RNA integrity was verified with 1% denaturing agarose gel electrophoresis, and concentration was determined by measuring A260/280 and A260/230 ratios using a nanospectrophotometer (Perl IMPLEN, Implen GmbH, München, Germany).

2.6. Analysis of Gene Expression

Total RNA was digested with DNAse I (Q1 RNase-Free DNase, Promega, Madison, WI, USA) to remove any contaminating genomic DNA, and cDNA synthesis was performed using the RevertAid H Minus First Strand cDNA Synthesis kit (Thermo Scientific, Waltham, MA, USA) following the manufacturer’s recommendations using random primers. RT-qPCR analysis was performed using primers initially screened for the absence of dimer formation and cross-hybridization. Primer pairs with 90–100% amplification efficiencies were used (Table 1). The qPCR analysis was conducted using a Rotor-Gene Q machine from Qiagen (Hilden, Germany) and the KAPA SYBR FAST (BIOSYSTEMS, Cape Town, South Africa) as a detector dye, following the specified profile settings: 95 °C for 3 min (1 cycle), 95 °C for 15 s, 58 °C for 15 s, and 72 °C for 15 s (30 cycles), followed by a final extension at 72 °C for 10 min. Transcripts of DhCTA (ID: 2904338, locus DEHA2F10582g), DhCTT (ID: 2913632, locus DEHA2B16214g) and DhSTL1 (ID: 2902951, locus DEHA2E01364g) were normalized using transcripts of DhRPS3 (ID: 2905489, locus DEHA2G22770g) [43] or DhACT1 (ID: 2901278, locus DEHA2D05412g) [35] by the standard curve method. The mean value ± SD of three biological replicates is presented. Fold change was calculated by normalizing the H2O2-treated sample’s relative expression against non-treated ones (YPD).

2.7. Nucleosome Scanning Assay

Nucleosome scanning assays (NuSA) were performed by adapting a previously described method [44,45]. Cells were grown at mid-log in YPD with 0.6 M NaCl and compared against cells grown in YPD with 0.6 M NaCl incubated with 30 mM H2O2 for 60 min. Briefly, cells were cross-linked with 1% formaldehyde and incubated for 20 min at room temperature. Subsequently, cells were treated with 125 mM glycine and incubated for 5 min at room temperature. Samples were then centrifuged and washed with Tris-buffered saline (50 mM Tris-Cl, pH 7.5, 150 mM NaCl), followed by incubation in Buffer Z2 (1 M sorbitol, 50 mM Tris-Cl at pH 7.4, 10 mM β-mercaptoethanol) containing 2 mg of zymolyase-20T (Sigma L2524) for 20 min at 30 °C on a shaker. Spheroplasts were pelleted by centrifugation at 3000 rpm and resuspended in 1.5 mL of NPS buffer (0.5 mM spermidine, 0.075% NP-40, 50 mM NaCl, 10 mM Tris, pH 7.4, 5 mM MgCl2, 1 mM CaCl2, 1 mM β-mercaptoethanol).
DNA digestions with MNase were performed as previously reported [46]. Samples were divided into three 500-µL aliquots, which were then digested with 22.5 units of MNase (Nuclease S7 from Roche) from 10 to 50 min at 37 °C. Digestions were stopped with 12 μL of stop buffer (50 mM EDTA and 1% SDS) and treated with 100 µg of proteinase K at 65 °C overnight. DNA was extracted twice with phenol/chloroform and precipitated with 20 µL of 5 M NaCl (100 mM) and 685 µL of isopropanol (1:1) overnight at −20 °C. The precipitates were resuspended in 40 µL of TE buffer and incubated with 20 mg RNase A for 1 h at 37 °C. Samples with monosomal bands were cut and purified using the GFX PCR DNA and Gel Band Purification Kit (reference 28903470; Illustra, Buckinghamshire, UK).
DNA samples were diluted 1:20 and used for qPCR to independently determine the relative MNase protection of DhCTA (DEHA2F10582g) and DhCTT (DEHA2B16214g) promoter regions (−625 to +250 bp). qPCR was carried out as follows: 95 °C for 5 min (1 cycle), 95 °C for 15 s, 58 °C for 20 s, and 72 °C for 20 s (30 cycles). The relative protection of DhCTT and DhCTA was calculated as a ratio considering the amplification of a region of DhVCX1-2 with the following deoxyoligonucleotides pair: forward 5′-TCTCCAGTCAATTACCTTTTGG-3′; and reverse, 5′-AATTCAACCAGAAAATGGCATTAG-3′ (Figure S2E,F). PCR deoxyoligonucleotides for DhCTT and DhCTA promoters are described in Tables S2 and S3, which amplify from around −625 to +250 bp of each locus, with coordinates given relative to the ATG +1. All presented NuSAs represent the mean values and standard errors (SE) of at least two independent biological replicates and four technical replicates.

2.8. Promoter Analysis

The nucleotide sequences of the genes DhCTA (ID: 2904338, locus DEHA2F10582g), DhCTT (ID: 2913632, locus DEHA2B16214g), DhSOD1 (ID: 2905248, locus DEHA2G17732g), DhENA1 (ID: 2904382, locus DEHA2G09108g), DhSTL1 (ID: 2902951, locus DEHA2E01364g), and DhGPD1 (ID: 2903610, locus DEHA2F09372g) were obtained from the NCBI Gene database (https://www.ncbi.nlm.nih.gov/gene/) accessed on 3 September 2023. An intergenic region spanning from −625 bp upstream to the start codon of each gene was analyzed using the Regulatory Sequence Analysis Tools (RSAT) platform (https://rsat.france-bioinformatique.fr/fungi/) accessed on 11 November 2023, specifically employing the matrix-scan quick tool within the Fungi Server (https://rsat.france-bioinformatique.fr/fungi/matrix-scan_form.cgi) accessed on 11 November 2023 [47]. Binding motifs to transcription factors associated with stress response were identified, including MSN2/4 (ID: 2899670, locus DEHA2A08382g), SKN7 (ID: 2913769, locus DEHA2B08052g), SKO1 (ID: 2901375, locus DEHA2D09196g), and YAP1 (ID: 904514, locus DEHA2G02420g). These transcription factors were selected based on the presence of predicted orthologs in the D. hansenii genome, identified through the predicted ortholog cluster from the Candida Gene Order Browser [48] or from the list of orthologs in D. hansenii previously identified by the best reciprocal hit method against S. cerevisiae genes [49]. The matrices for each motif were retrieved from the JASPAR database: MSN2/4 (ID: MA0341.1/MA0342.1), SKN7 (ID: MA038.1), SKO1 (ID: MA0382.1), and YAP1 (ID: MA0415.1), using the 2020 core non-redundant fungi collection. An organism-specific background model estimation method was applied, and a p-value threshold of E3 was used for significant determination.

2.9. Identification of Putative Orthologs of Transcription Factors

The amino acid sequences of transcription factor proteins were retrieved from the NCBI protein database (https://www.ncbi.nlm.nih.gov/protein accessed on 6 July 2024) for the following: ScMsn2/4 (ID: NP_013751.1/NP_012861.1), ScSkn7 (ID: KZV10951.1), ScSko1 (ID: NP_014232.1), and ScYap1 (ID: KZV08838.1) from S. cerevisiae; DhMsn2 (ID: CAG84649.2), DhSkn7 (ID: CAG85310.2), DhSko1 (ID: XP_458864.2), and DhYap1 (ID: XP_461648.2) from D. hansenii; and CaMsn4 (ID: XP_723438.2), CaSkn7 (ID: AAQ08008.1), CaSko1 (ID: XP_019330633.1), and Cap1 (ID: KAL1577880.1) from C. albicans. The groups of orthologous TFs were aligned using Clustal Omega v 1.2.4 (EMBL-EBI, Hinxton, UK) on 9 July 2024 [50]. The overall percentage identity and conserved domains between the orthologs of S. cerevisiae, D. hansenii, and C. albicans were calculated using the pairwise alignment tool in Jalview 2.11.3 [51].

2.10. Statistical Analysis

Statistical significance was assessed using two-way ANOVA, followed by Tukey’s multiple comparison test, or Brown-Forsythe and Welsch ANOVA tests, followed by post hoc multiple comparison according to Dunnett, using GraphPad Prism v 8.4.2 software. All experiments were conducted with a minimum of three biological replicates. Statistically significant differences are indicated as follows: **** p ≤ 0.0001; *** p < 0.001; ** p < 0.01; * p < 0.05.

3. Results

3.1. H2O2-Induced Oxidative Stress Triggers Catalase Expression and Activity in D. hansenii

D. hansenii shows the capacity to tolerate various environmental stressors, including salt and oxidative stress [31,52]. To assess oxidative stress tolerance in D. hansenii under saline conditions, cells were grown in rich YPD medium supplemented with 0.6 M NaCl until reaching an OD600 of 1, followed by exposure to a hydrogen peroxide (H2O2) shock across a concentration gradient (0–50 mM) for 3 h. Serial dilutions and spot assays were subsequently performed (Figure S1), as detailed in the Materials and Methods section. Significant sensitivity was observed at 30 mM H2O2, leading to the selection of this concentration for subsequent experiments (Figure 2A). Aliquots were collected to analyze cell viability at different time intervals (0, 15, 30, 60, 120, and 180 min), revealing a decrease in viability after 60 min (Figure 2B). Subsequently, the expression and activity of catalase A (DhCta) and catalase T (DhCtt) were analyzed in cells treated with 30 mM H2O2 with 0.6 M NaCl as previously described (Figure 2A). RT-qPCR analysis showed a transient increase of up to 5-fold in the expression of both DhCTA and DhCTT (Figure 2C). This upregulation in gene expression was accompanied by a corresponding increase in specific catalase activity, which peaked between 60 and 120 min after H2O2 exposure before returning to baseline levels by the third hour of treatment (Figure 2D). Notably, basal catalase activity is moderately high in the absence of H2O2. These findings suggest that D. hansenii can tolerate oxidative stress induced by H2O2 under saline conditions, responding with a transient upregulation of DhCTA and DhCTT catalase expression and activity.

3.2. Nucleosome Occupancy and Putative TF Binding Motifs Distribution in DhCTA and DhCTT Promoters

The expression of catalase genes in S. cerevisiae is regulated through a complex interplay of mechanisms, including oxidative stress responses, general stress signals, nutrient availability, and epigenetic regulation [53]. This multifaceted regulation allows the yeast to precisely adjust its antioxidant response according to environmental conditions and the physiological state of the cell, thereby ensuring its survival and adaptation in changing environments.
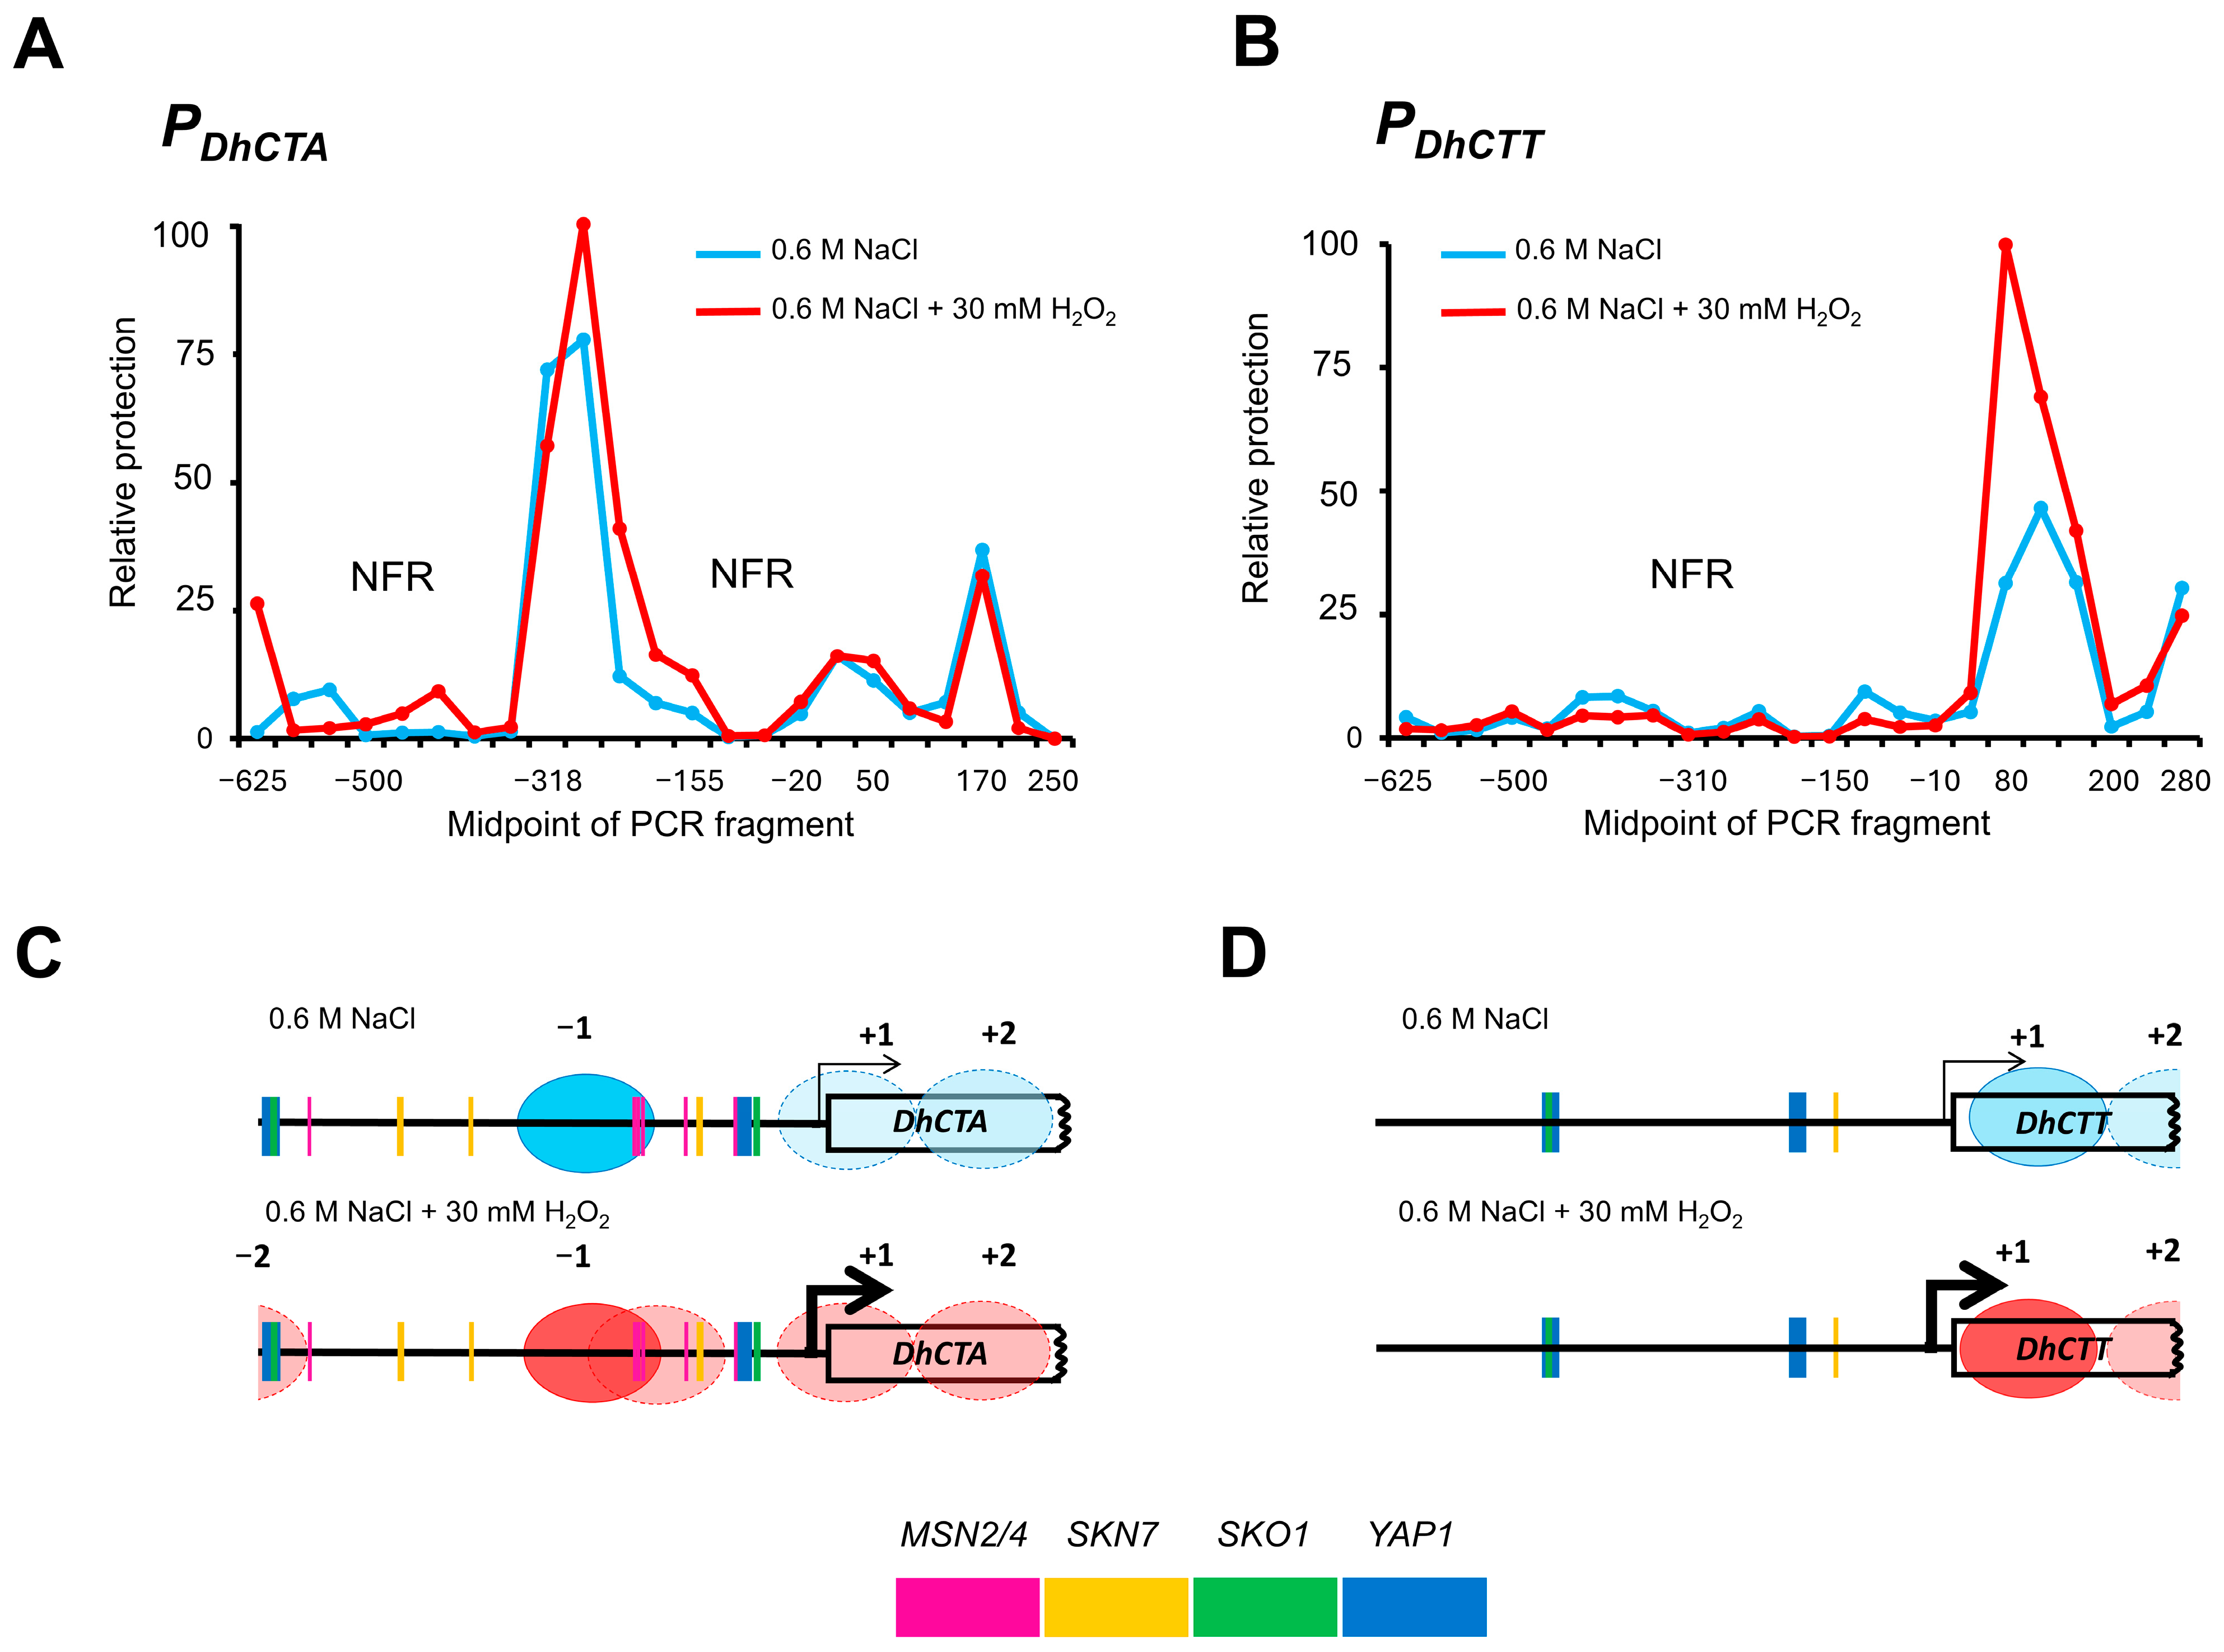
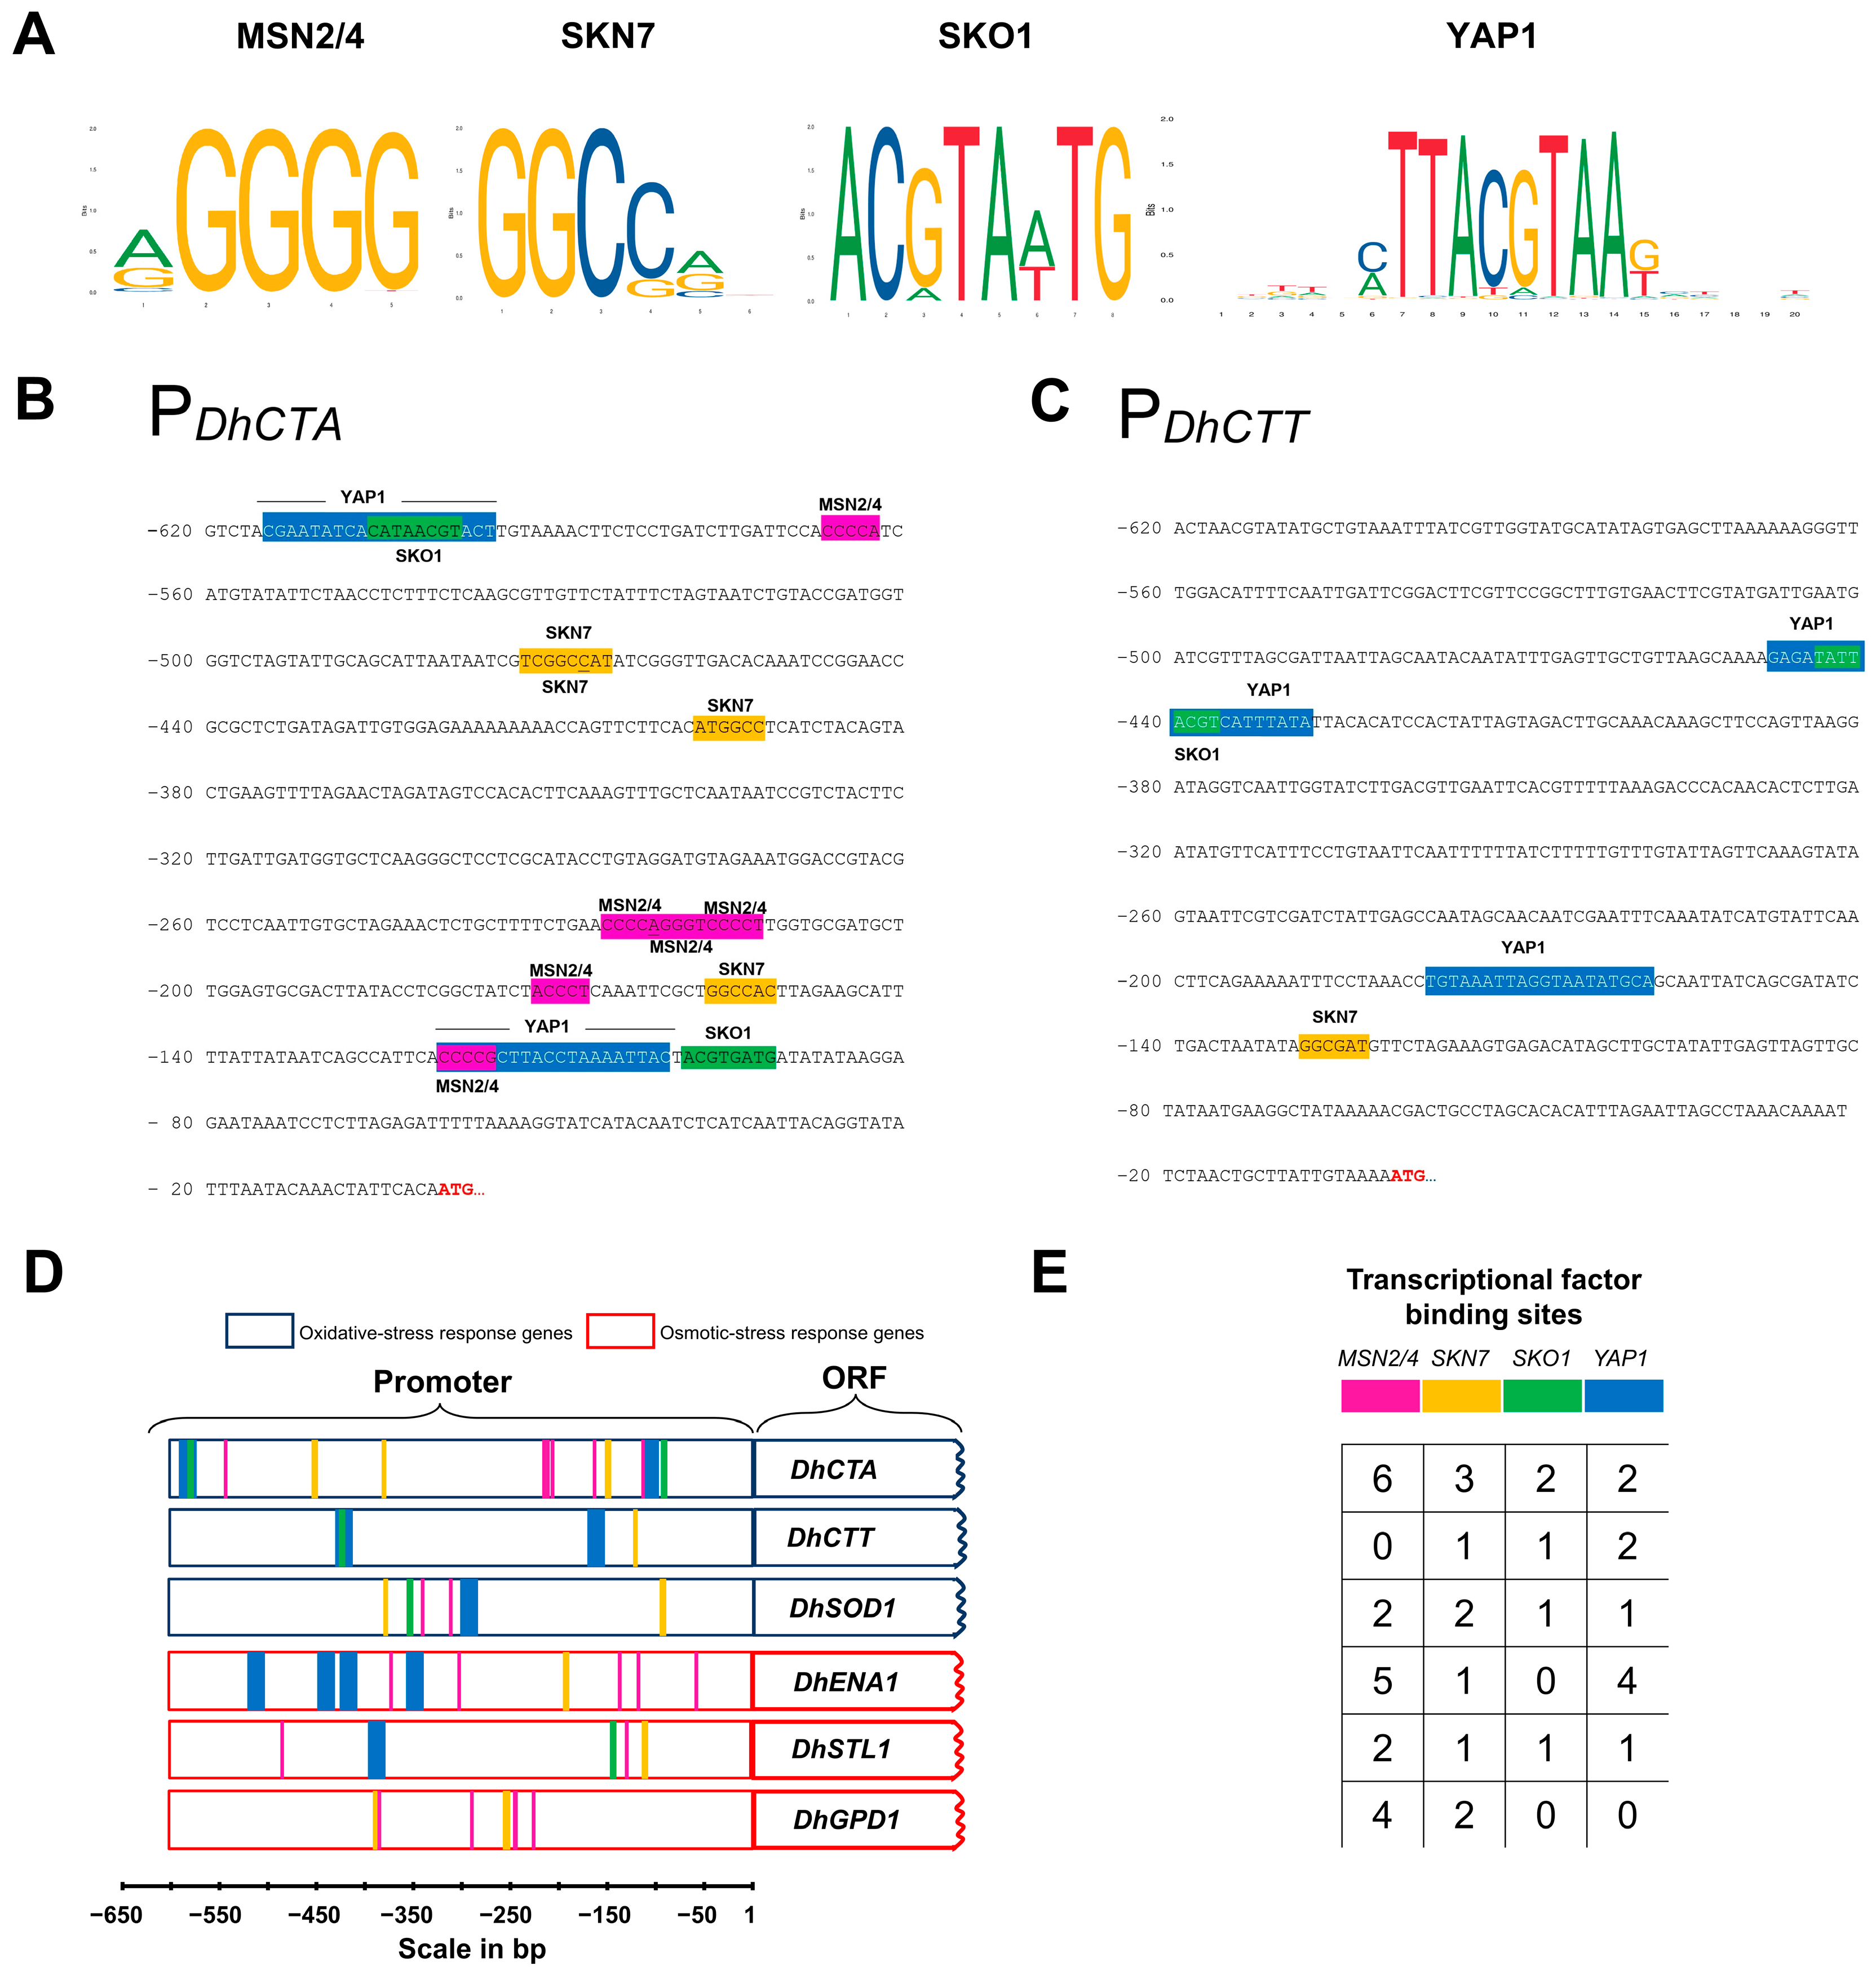
To investigate the regulation of catalases in D. hansenii, we analyzed chromatin arrangement under NaCl exposure at an initial time point and after 60 min of combined NaCl and H2O2 shock, during which an increase in transcript levels was observed (Figure 2C). This analysis was conducted using a Nucleosome Scanning Assay (NuSA) targeting the proximal promoters of both genes. To our knowledge, this study represents the first mononucleosome isolation and nucleosome scanning report in D. hansenii (Figure S2). The analysis extended up to −625 bp from the proximal promoter of both loci, revealing that nucleosome occupancy under these conditions is minimal (Figure 3A,B), a characteristic feature of highly active genes. Furthermore, both genes exhibited Nucleosome-Free Regions (NFR), and the nucleosome positioning remained consistent across the two conditions analyzed. The DhCTA gene exhibited the −2, −1, +1, and +2 nucleosomes, while DhCTT showed the +1 and +2 nucleosomes. Remarkably, nucleosome occupancy did not change in response to H2O2 shock in both genes. However, the −1 nucleosome is strongly positioned in the DhCTA promoter in both conditions (Figure 3C), while the +1 nucleosome is more fixed in the DhCTT promoter after the H2O2 (45% vs. 100%, relative protection) (Figure 3D). To further understand the regulation of these genes, an in silico analysis was conducted to identify putative TF binding motifs within both promoters (Figure 4B,C). In the DhCTA promoter, we identified motifs for MSN2/4, SKN7, SKO1, and YAP1 in the NFR (Figure 4B). Under oxidative conditions, MSN2/4 and SKN7 are located within the fuzzy zone of the −1 nucleosome (Figure 3C). In contrast, the DhCTT promoter contains motifs for SKN7, SKO1, and YAP1 (Figure 4C), and no nucleosomes were found in this region, suggesting an open chromatin (Figure 3D).
To gain a deeper understanding of the transcription factors involved in the regulation of oxidative stress in D. hansenii, we investigated the presence of shared motifs in the promoters of other genes (DhSOD1, DhENA1, DhSTL1, and DhGPD1) that have been experimentally shown to be co-regulated with catalases genes in response to oxidative- or osmotic-stress response [12,35,54]. A motif analysis was performed using Regulatory Sequence Analysis Tools and the position weight matrices from the Jasper database (Figure 4A). As shown in Figure 4D,E, the MSN2/4-binding sequences were present in five promoters analyzed, except for DhCTT. The motif for the SNK7 was identified in all promoters. The SKO1-binding sequence was found in DhCTA, DhCTT, DhSOD1, and DhSTL1. Finally, the YAP1-binding sequence was identified in the promoters of DhCTA, DhCTT, DhSOD1, DhENA1, and DhSTL1. Notably, the most frequently repeated consensus sequence in the DhCTA promoter is the STREs (STress Responsive Elements, NGGGG, or CCCCN), recognized by Msn2/4 for the general stress response (Figure 4B,D,E). In contrast, the MSN2/4-binding site is absent in the DhCTT promoter (Figure 4C), suggesting that DhCTT expression is not transcriptionally activated via Msn2/4.
In addition, to explore the potential conservation of function and regulation of the DhMsn2/4, DhSkn7, DhSko1, and DhYap1 proteins in D. hansenii, their sequences were compared with the homologous of S. cerevisiae and C. albicans using Clustal Omega (Figures S3–S6, Table S1). The sequence comparison reveals conserved or semi-conserved residues within critical domains of these proteins (Table 2), suggesting that their functions and regulatory mechanisms are likely conserved among these yeast species. Furthermore, putative binding motifs for Msn2/4, Skn7, Sko1, or Yap1 have been identified in NFRs of the promoter regions of the DhCTA and DhCTT genes in D. hansenii. This analysis reinforces the idea that the function and regulatory mechanisms of these TF are conserved in S. cerevisiae, D. hansenii, and Candida albicans.

3.3. DhHog1 Regulates the Activity and Expression of Catalase A Under Saline and Oxidative Conditions

The most conserved stress response signaling cascade in fungi is the HOG pathway, in which the final effector is the MAP kinase Hog1 [49]. This kinase activates transcription factors primarily associated with osmotic and oxidative stress in S. cerevisiae, such as Msn2/4 [55] and Sko1 [56,57]. The analysis of NuSA and the identification of binding sites suggest that DhHog1 may be involved in the transcriptional activation of DhCTA and DhCTT genes, as their promoters contain putative motifs for Msn2/4 and/or Sko1 (Figure 3C,D and Figure 4), which are linked to Hog1 MAP kinase.
To evaluate the role of DhHog1 in oxidative stress response, we performed a series of comparative assays using a Dhhog1Δ mutant strain. We measured cell growth and viability in both the WT strain and the Dhhog1Δ mutant in rich medium YPD without NaCl and with 0.6 M NaCl (Figure 5A and Figure S7). The results indicate that both strains exhibit similar growth patterns and show no significant differences in cell viability, consistent with previous findings, suggesting that DhHog1 is not essential at 0.6 M NaCl, although it is active and phosphorylated under these conditions. However, DhHog1 appears to be crucial for maintaining cell viability under higher NaCl concentrations, such as 1 or 2 M NaCl (Figure 5A,B).
Specific catalase activity was measured in both WT and Dhhog1Δ mutant cultured in rich medium YPD and YPD supplemented with 0.6 M NaCl at 0, 14, and 24 h (Figure 6A). As we previously reported [37], the WT strain exhibited an increase in catalase activity under NaCl. However, in a Dhhog1Δ mutant, catalase activity did not increase, suggesting that DhHog1 plays a role in catalase activation under this condition. To further investigate the catalase regulation, we analyzed the transcript levels of DhCTA and DhCTT genes, using DhSTL1 expression as a control of osmotic response (Figure 6B). The expression pattern of DhCTA mirrored that of DhSTL1, which is positively regulated by DhHog1. This indicates that DhHog1 mediates the induction of both genes under NaCl conditions. In contrast, DhCTT did not show increased transcription in the presence of NaCl, suggesting that DhCTT expression is not positively regulated by NaCl or DhHog1.
To investigate the sensitivity of the Dhhog1Δ mutant to oxidative stress under saline conditions, cell viability was analyzed following exposure to varying concentrations of H2O2 (0, 2.5, 5, 10, 20, and 30 mM) in YPD medium with and without 0.6 M NaCl for both WT and Dhhog1Δ strains for 60 min (Figure 7A). The WT strain exhibited sensitivity to H2O2 at concentrations of 5, 10, 20, and 30 mM, regardless of recovery in YPD. In contrast, the Dhhog1Δ mutant displayed heightened sensitivity starting at 2.5 mM H2O2, with this sensitivity further exacerbated when the shock was performed in the presence of NaCl. The expression analysis of DhCTA and DhCTT genes following a 30 mM H2O2 shock revealed that DhCTA expression is dependent on DhHog1, whereas DhCTT expression is not influenced by DhHog1 (Figure 7B). Finally, catalase activity was measured after H2O2 treatment in both strains, showing a significant reduction in catalase activity in the Dhhog1Δ (Figure 7C).

4. Discussion

Despite extensive research, the specific mechanisms by which yeasts adapt to extreme environments remain partially understood [58,59]. In the halotolerant yeast D. hansenii, catalase A and T play a crucial role in defending against oxidative stress by catalyzing the decomposition of H2O2 [11,37]. However, the direct interactions between the pathways regulating responses to combined saline and oxidative conditions and the antioxidant defense systems mediated by catalases, superoxide dismutases, thioredoxins, glutathione, and peroxiredoxins remain poorly characterized [20,60,61,62]. Additionally, while the HOG1 pathway is well characterized in S. cerevisiae for its role in osmotic stress response, the specific function of DhHog1 in D. hansenii under oxidative stress is still under investigation. Therefore, understanding these mechanisms and adaptations is fundamental not only from an ecological and evolutionary perspective but also has biotechnological implications, as halotolerant yeast can be employed in industrial processes under saline conditions.
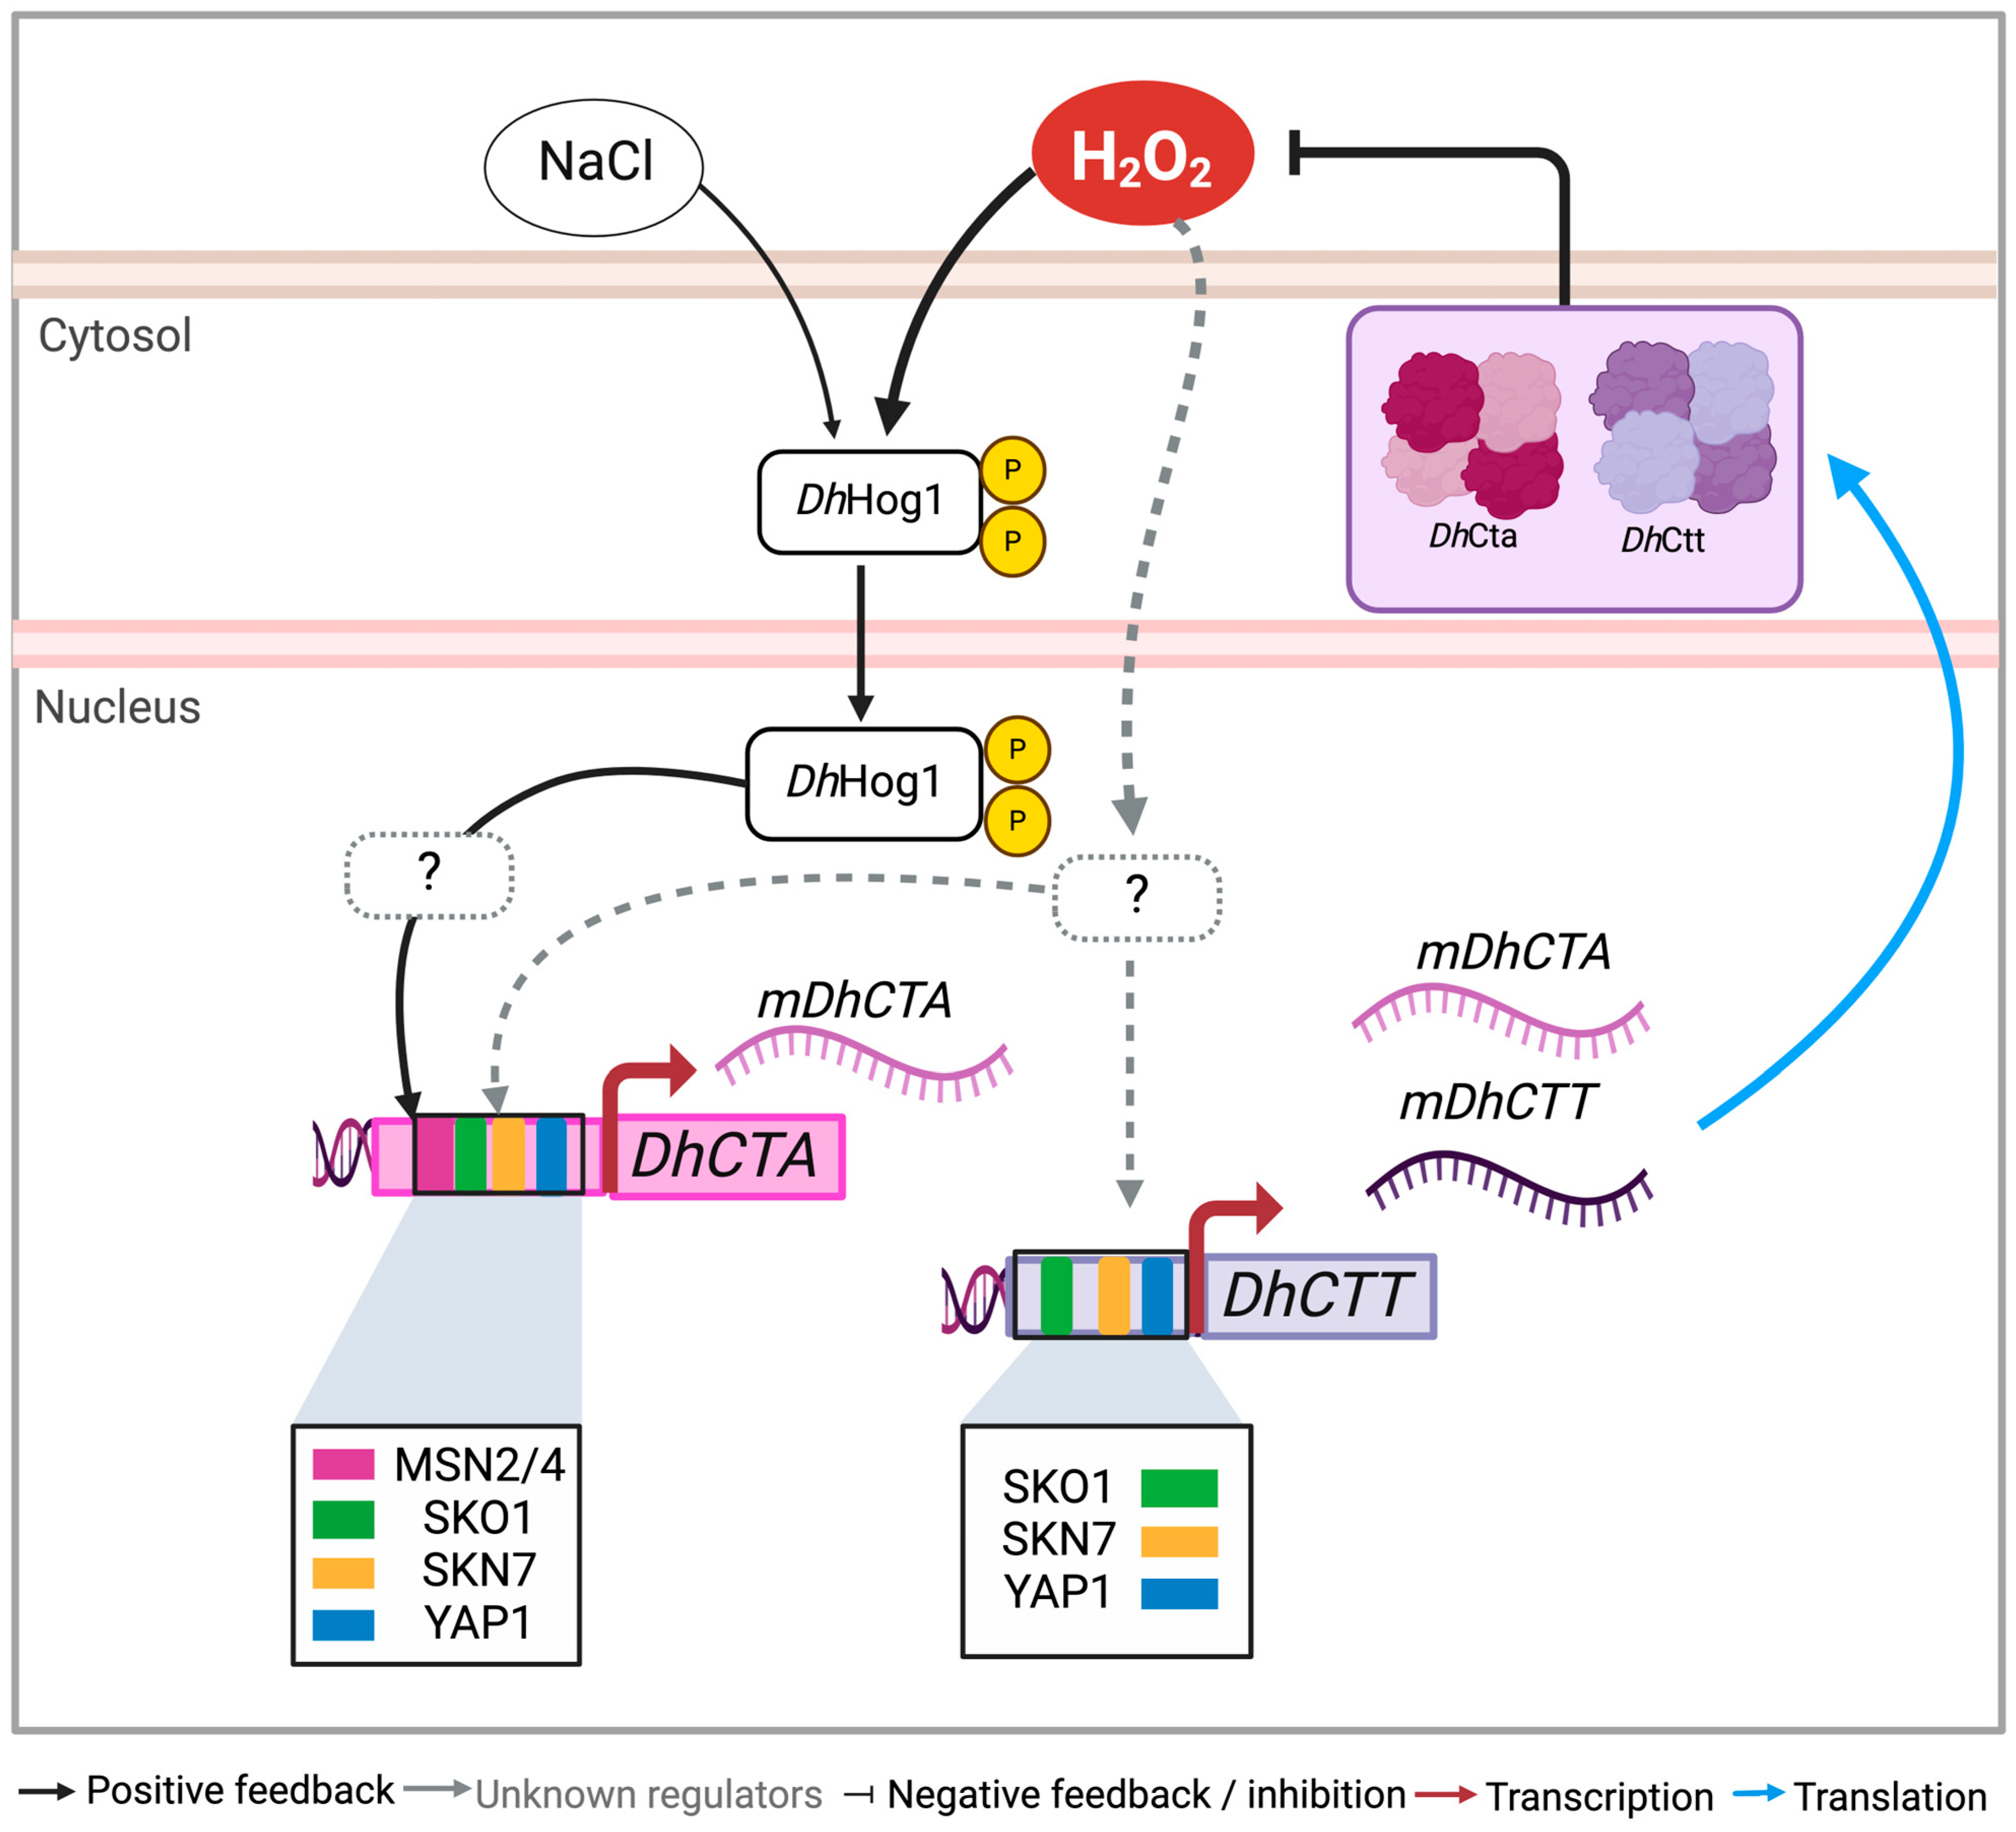
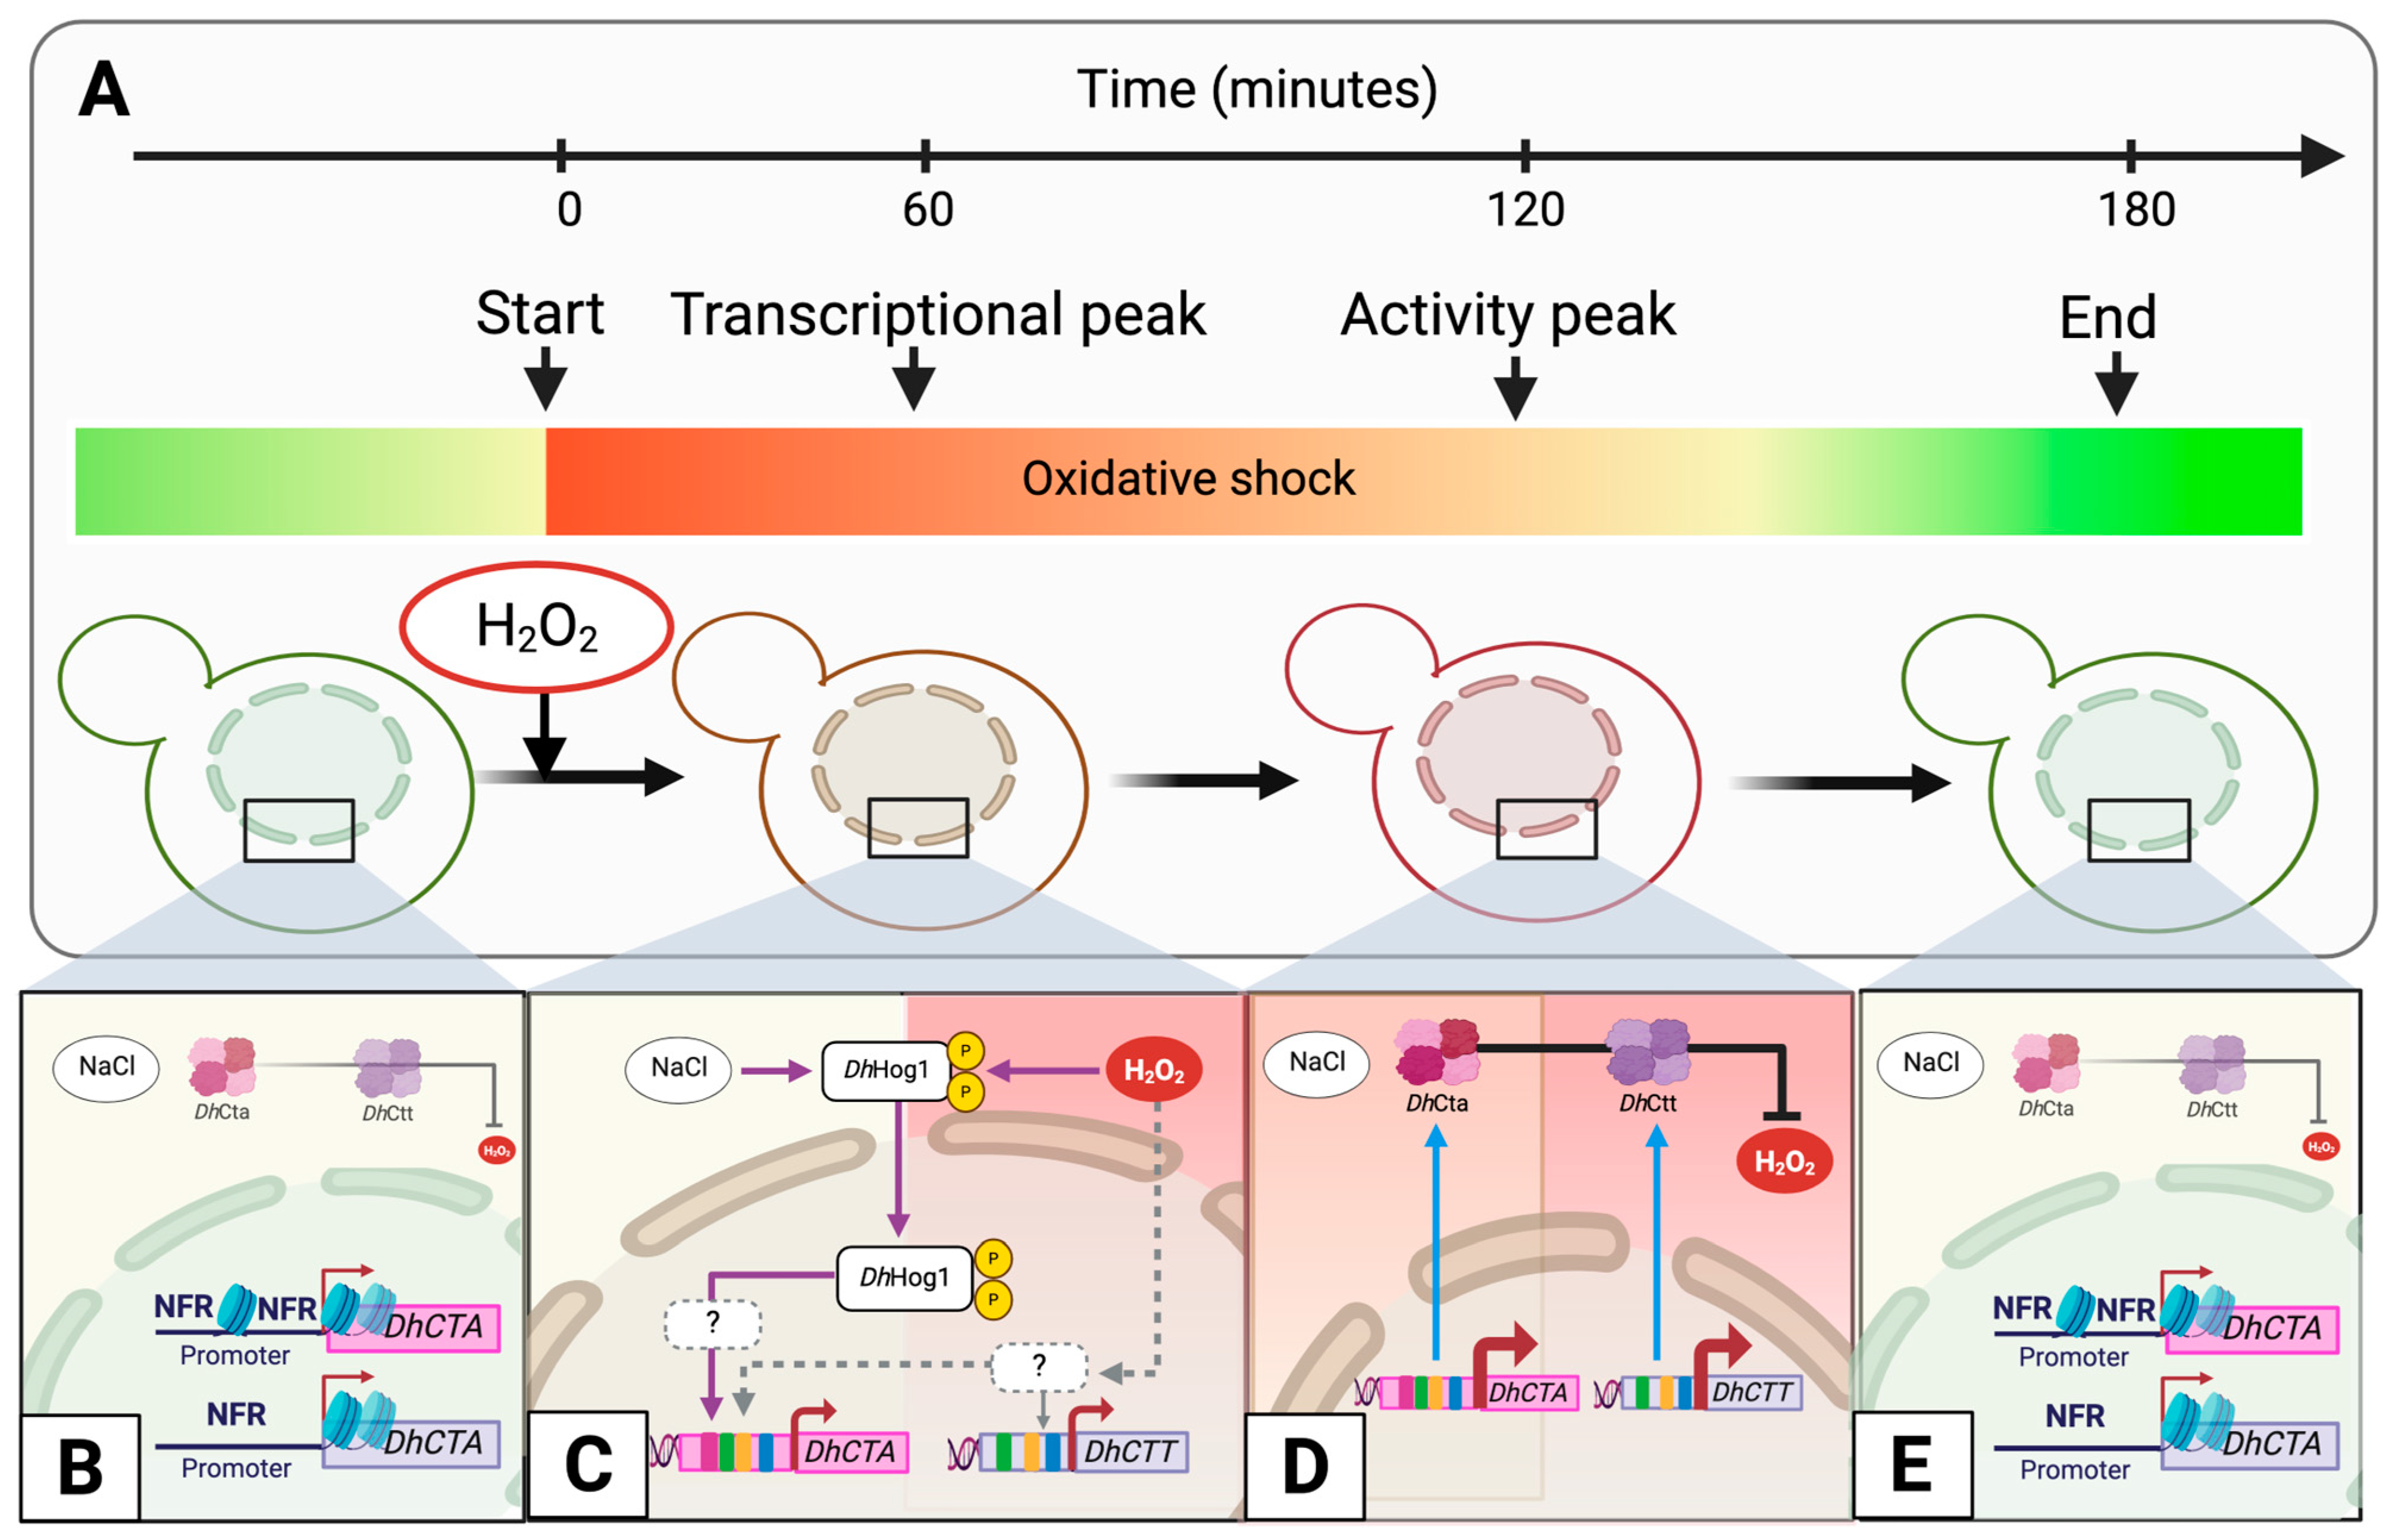
In this study, we explored the regulatory responses of D. hansenii to saline and oxidative conditions (Figure 8). Our findings indicate that under NaCl, an open chromatin state with available binding motifs for Msn2/4, Skn7, Sko1, and Yap1 facilitates the expression of catalases A (peroxisomal/mitochondrial) and T (cytosolic), thereby enhancing the yeast’s capacity to adapt to environmental stress changes. DhHog1 was identified as a key regulator, specifically controlling DhCTA expression under both saline and oxidative conditions, whereas DhCTT operates independently of the DhHog1 function. This suggests a specialized stress response pathway in D. hansenii that could be advantageous for industrial applications requiring robust yeast strains.

4.1. The Expression of DhCTA and DhCTT Genes Increases After Exposure to H2O2 Under NaCl Condition

Saline environments present hostile conditions for many fungi due to induced osmotic stress, ionic toxicity, and oxidative stress [63,64]. Such saline conditions significantly hinder the survival of non-adapted species. However, some yeasts have evolved specific mechanisms to resist and thrive in these environments [32,38,65,66]. The case of D. hansenii is well documented; this halotolerant yeast has developed adaptations to survive in saline environments, such as efficient osmoregulation, ion transport systems, adapted proteins, and enhanced antioxidant enzyme systems [31,54,67]. Moreover, NaCl has been shown to exert a protective effect against externally triggered oxidative stress in D. hansenii [11,68].
In this study, we demonstrated that D. hansenii tolerates oxidative stress induced by H2O2 (30 mM) under typical marine salinity conditions (0.6 M NaCl). After 60 min of exposure, a decrease in cell viability was observed with a transient increase of up to five fold in the expression and activity of catalase DhCta or DhCtt, peaking between 60 and 120 min before returning to baseline after three hours.
In the non-halotolerant yeast S. cerevisiae, the activity of peroxisomal catalase ScCta1 remains unchanged, whereas the activity of cytosolic catalase ScCtt1 significantly increases after exposure to H2O2. Therefore, ScCta1 and ScCtt1 have distinct roles: ScCta1 primarily clears cytosolic ROS, while ScCtt1 handles oxidative stress from external sources [69,70,71]. The induction of ScCtt1 activity is crucial for protecting S. cerevisiae against exogenous H2O2 [18]. In other yeasts, such as Candida nivariensis, Candida albicans, and Candida glabrata, the single catalase enzymes (CnCat, CaCat1, and CgCat1) are upregulated and play significant roles in combating H2O2-induced oxidative stress [19,39].
Unlike S. cerevisiae, our findings demonstrate that both DhCta and DhCtt are induced upon H2O2 exposure in D. hansenii, highlighting the essential additive roles of these catalases in mitigating oxidative stress. These results suggest that D. hansenii responds to oxidative stress by temporarily upregulating the expression of the DhCTA and DhCTT genes, indicative of a robust catalase-based defense system against ROS.
As previously described [11], this system maintains moderately high basal catalase activity under saline conditions in D. hansenii compared to S. cerevisiae (161 ± 5 vs. 8.1 ± 0.5 μmol H2O2 oxidized min−1 mg of protein−1). This elevated activity facilitates the simultaneous induction of both catalase A (peroxisomal/mitochondrial) and catalase T (cytoplasmic), thereby enhancing yeast survival under oxidative stress conditions. Further studies are needed to elucidate the individual contribution of each catalase. This will require the construction of single and double knockout strains in D. hansenii using advanced genetic engineering techniques such as CRISPR/Cas systems, given the complexity of genetic manipulation in this yeast [54,72,73,74].

4.2. Nucleosome Arrangement and Putative TF-Binding Motifs Configurations Between DhCTA and DhCTT Promoters Reveal Divergent Transcriptional Regulation

The transcription start sites are flanked by the first upstream (−1) and downstream (+1) nucleosomes, which are critical regulators of transcription. The +1 nucleosome, noted for its robust position, has been extensively studied due to its role in establishing the structural framework of both repressed and active promoters and its incorporation of histone variants [75,76]. In S. cerevisiae, the 5′ nucleosome-free region (NFR) is delineated by −1 and +1 nucleosomes. Specifically, the −1 nucleosome is situated upstream of the NFR, typically within a region ranging from −300 to −150 bp relative to the transcription start sites. Conversely, the +1 nucleosome defines the downstream boundary of the NFR and is, on average, the most strongly localized nucleosome within the yeast genome [77]. In non-conventional yeasts, few studies have investigated the transcriptional regulation between orthologous genes by examining nucleosomal occupancy and putative TF-binding motif configurations within promoter regions [45,78,79].
In D. hansenii, the role of nucleosome occupancy in relation to specific putative TF-binding motifs involved in gene expression responses to stress conditions has not been explored until now. This study represents the first investigation of nucleosome positioning in D. hansenii. Utilizing nucleosome scanning assays, minimal changes in nucleosome positioning were observed for the promoters of DhCTA and DhCTT under NaCl exposure or combined NaCl with a temporality H2O2 shock (Figure 9A). This stability is likely due to the growth of cells under saline conditions, which maintain an open chromatin state from the outset, accompanied by a basal level of transcription (Figure 9B). Such an open chromatin configuration may facilitate the induction of both catalase genes in response to environmental stress fluctuations.
Furthermore, the DhCTA gene exhibited nucleosomes at positions −2, −1, +1, and +2, whereas the DhCTT gene was largely nucleosome-depleted except for the +1 nucleosome, which remained consistently positioned under both conditions. NFRs are typically observed in the promoters of actively regulated genes and/or those containing multiple evolutionarily conserved motifs that recruit TFs [80], which can collaboratively recruit chromatin remodelers to exclude nucleosomes, thereby facilitating access to other target DNA sites. Interestingly, the +1 nucleosome of the DhCTT gene exhibits significant differences in micrococcal nuclease protection, indicating that it becomes firmly positioned in cells exposed to H2O2 shock. We speculated that this firm positioning plays a crucial role in the transcriptional regulation of the DhCTT gene. In fact, epigenetic memory of an activated state is preserved on histone variants outside the promoters, such as the +1 nucleosome, while epigenetic memory of a repressed state is maintained by nucleosomes within promoters [76,81,82]. This indicates that a well-positioned +1 nucleosome, in conjunction with the absence of nucleosomes in the promoter region, is essential for sustaining an activated state in the DhCTT gene. Future investigations should focus on determining the histone composition or variant turnover of the +1 nucleosome to elucidate their roles in maintaining basal transcription and/or inducing DhCTT expression. This will require a Chromatin Immunoprecipitation (ChIP) assay to analyze post-translational modifications of histones.
On the other hand, nucleosome scans allowed us to identify NFRs, which are key to identifying putative TFs-binding motifs in promoter regions for active transcription factors in response to stress conditions. We identified sequences recognized by TFs, such as Skn7, Sko1, and Yap1, in both catalase promoters. However, the sequences of stress response elements (STREs) for Msn2/4 are present only in the DhCTA promoter (Figure 8). In S. cerevisiae, Yap1- and Skn7-mediated pathways are specifically involved in responses to oxidative and osmotic stresses, respectively [15,20]. Sko1 is a repressor that, when phosphorylated by Hog1, recruits SAGA histone acetylase and SWI/SNF nucleosome-remodeling complexes to activate the expression of stress response genes such as ScCTT1 [14,83]. Msn2/4 controls the expression of more than twenty genes [84,85], including the ScCTT1 gene [15]. Osmotic stress induces the recruitment of Msn2/4 and Hog1 to the ScCTT1 promoter [86]. Our protein sequence comparisons reveal that conserved residues in critical domains of Msn2/4, Snk7, Sko1, and Yap1 suggest similar functions and regulatory mechanisms across yeast species. In our in silico study, we did not find binding motifs for Msn2/4 in the DhCTT promoter, whereas the DhCTA promoter contains six such motifs. This finding suggests that the regulatory mechanism of DhCTA may be similar to that of ScCTT1, indicating divergent transcriptional regulation from DhCTT.

4.3. DhHog1 Regulates the Induction of Catalase A to Adapt Under Saline and Oxidative Conditions

In S. cerevisiae, the expression of ScCTT1 in response to osmotic stress is mediated by the Hog1 pathway through stress response elements (STREs) [87], which are recognized by Msn2/4 [86]. Conversely, H2O2-induced phosphorylation of Hog1 leads to the phosphorylation of Sko1, resulting in the derepression of ScCTT1 [57,87]. However, H2O2 can still induce the expression of ScCTT1 even in Schog1Δ and Scsko1Δ mutants, indicating that ScHog1 and ScSko1 are not essential for its regulation under oxidative stress [57]. In contrast, the induction of ScCTT1 in response to osmotic stress is definitively mediated by the Hog1 pathway.
In C. albicans, CaHog1 is essential for the resistance to oxidative stress, as the Cahog1Δ mutant exhibits sensitivity to H2O2 [88]. Moreover, CaHog1 undergoes activation by phosphorylation when cells are exposed to oxidative stress. Other studies have revealed that CaHog1 can function as both an activator and repressor [89]. In C. glabrata, it has been demonstrated that this yeast can adapt to high levels of H2O2, and this adaptive response is dependent on CgYap1/CgSkn7 and partially on CgMsn2/4 [40]. These findings demonstrate that the regulation of CgCTA1 is primarily controlled by CgSkn7, CgYap1, and CgMsn4, as the deletion of these TFs renders the cells nearly as sensitive to H2O2.
In our study, analysis of NuSA and identification of putative TFs-binding motifs suggest that DhHog1 may be involved in the transcriptional activation of DhCTA and DhCTT genes in D. hansenii, as their promoters contain motifs for DhMsn2/4 and/or DhSko1 (Figure 9B,C). Under saline conditions, the WT strain exhibited increased catalase activity dependent on DhHog1, whereas the Dhhog1Δ did not, suggesting DhHog1’s role in catalase activation. DhHog1 mediates the induction of DhCTA but not DhCTT under saline conditions. The Dhhog1Δ mutant displayed heightened sensitivity to H2O2, especially under saline conditions, indicating the importance of DhHog1 in oxidative stress resistance. Expression analysis confirmed that DhCTA expression depends on DhHog1 during saline and oxidative conditions. In contrast, DhCTT expression showed no significant changes in the Dhhog1Δ mutant under the same conditions.
It is noteworthy that in S. cerevisiae, ScCTT1 is essential for coping with osmotic and oxidative stress. In contrast, in D. hansenii, both DhCTA and DhCTT participate in oxidative stress response, with DhCTA being regulated by DhHog1, similar to the regulation of ScCTT1 by ScHog1 in S. cerevisiae. We speculate that under non-stress conditions (YPD), DhSko1 could repress the expression of catalases. In addition, under saline or oxidative conditions, DhCTA expression is activated via the DhHog1-DhMsn2/4 pathway, while DhCTT expression may be regulated through DhYap1/DhSkn7 and/or combining other unknown regulators. Further research is needed to elucidate how these regulatory networks are coordinated under dual stress conditions by different TFs.

5. Conclusions

This study explores the mechanisms by which the halotolerant yeast D. hansenii adapts to oxidative stress under saline conditions. Upon exposure to H2O2, the yeast transiently increases the expression and activity of catalase genes DhCTA and DhCTT. The promoters of these genes exhibit minimal nucleosome occupancy, maintaining an open chromatin state that facilitates rapid transcriptional activation. Binding motifs for stress-responsive transcription factors such as Msn2/4 and Sko1 were identified in the DhCTA promoter, suggesting their involvement in its regulation.
Importantly, the MAP kinase DhHog1 is essential for inducing DhCTA expression and boosting catalase activity under both saline and oxidative conditions. In contrast, DhCTT expression is independent of DhHog1, implying divergent regulatory mechanisms from DhCTA. These findings highlight the complexity of the stress response pathways in D. hansenii, offering valuable insights for engineering more robust yeast strains suitable for industrial applications. This is especially relevant for the use of D. hansenii in seawater or saline wastewater by-products from industrial activities, which can serve as feedstock in the transition to green biotechnology.

Supplementary Materials

The following supporting information can be downloaded at https://www.mdpi.com/article/10.3390/jof10110740/s1, Figure S1. Assessment of cell survival of D. hansenii following H2O2 shock at different concentrations under NaCl condition. Wild-type cells were treated with 0, 10, 20, 30, 40, and 50 mM H2O2 with shaking for 3 hours, followed by 10-fold serial dilutions (10−1, 10−2, 10−3, 10−4, 10−5). A 10 μL aliquot of each dilution was spotted onto YPD agar plates and incubated for 3 days at 28 °C. Representative image of three independent experiments. Figure S2. Nucleosome scanning assays in D. hansenii. (A) Cells were grown in YPD medium with 0.6 M NaCl (0 min) to the mid-log growth phase and treated with 30 mM H2O2 for 60 min. DNA-proteins cross-linking was performed, and spheroplasts were obtained by zymolyase digestion, followed by MNase digestion at different times, as described in the Materials and Methods section. (B) Gel electrophoresis was used to isolate mono-nucleosomal DNA (140–160 bp), as described in Materials and Methods. (C,D) qPCR analysis was performed to amplify the region of each gene from −625 bp to +250 bp (DhCTA) or +280 bp (DhCTT) relative to the start of the coding region. The tiled black bars above the scale indicate the DNA fragments amplified by qPCR to examine nucleosome occupancy. (E,F) A well-positioned nucleosome within the DhVCX1 coding region (gray oval) was observed in NaCl or NaCl plus 30 mM H2O2 as the mean starting quantity (MSQ). The relative protection of the DhCTA or DhCTT region (C,D) was determined using the peak of the DhVCX1 region. The red horizontal line represents the amplicon used to normalize. Figure S3. Sequence conservation of Msn2 or Msn4 proteins in S. cerevisiae, D. hansenii, and C. albicans. The amino acid sequences of Msn2/4 from S. cerevisiae (ScMSN2, ID: NP_013751.1/ScMSN4, ID: NP_012861.1), D. hansenii (DhMSN2, ID: CAG84649.2), and C. albicans (CaMSN4, ID: XP_723438.2) were aligned using the EMBL-EBI Clustal Omega on 9 July 2024 [50]. In the S. cerevisiae sequence, functional features are highlighted: Transcriptional Activation Domain (TAD) (blue) with Motive B (black, underlined), Nuclear Export Signal (NES) (green), and Nuclear Localization Signal (NLS) (yellow). The DNA-binding domain (DBD) (gray) contains the C2H2 Zinc finger structure with conserved cysteine and histidine residues in red and folding-related sites in blue [90]. Asterisks (*) indicate fully conserved residues; colons (:) indicate semi-conserved residues. Figure S4. Sequence conservation of Skn7 protein in S. cerevisiae, D. hansenii, and C. albicans. The amino acid sequences of Skn7 from S. cerevisiae (ScSKN7, ID: KZV10951.1), D. hansenii (DhSKN77, ID: CAG85310.2), and C. albicans (CaSKN7, ID: AAQ08008.1) were aligned using the EMBL-EBI Clustal Omega on 9 July 2024 [50]. In the S. cerevisiae sequence the following features are highlighted: Heat-shock factor type DNA binding domain (HSF-type DBD) (yellow), with F135 and L142 residues, critical for ScSkn7 activity marked in red and helix-3 residues known to be involved in contacting DNA (S137, R140, N143, Y145 and K149) marked in blue; the ROCK1/Kinectin homology region (HR) motif involved in interaction with Rho1 and Mbp1 (pink) and the Response Regulator domain (RR) (gray) with phospho-accepting aspartate residue (D427) [91,92] important for the SLN1-YPD1-SKN7 regulation branch related to the HOG pathway is shaded in green, as well as tyrosine residue (T437) fundamental for interaction with Yap1 is shaded in blue [93,94]. Asterisks represent conserved residues (*), and colons (:) indicate semi-conserved residues. Figure S5. Sequence conservation of Sko1 protein in S. cerevisiae, D. hansenii, and C. albicans. The amino acid sequences of Sko1 from S. cerevisiae (ScSKO1, ID: NP_014232.1), D. hansenii (DhSKO1, ID: XP_458864.2), and C. albicans (CaSKO1, ID: XP_019330633.1) were aligned using the EMBL-EBI Clustal Omega on 9 July 2024 [50]. The S. cerevisiae Hog1 phosphorylation site (yellow), with conserved/semi-conserved residues in underlying blue; the PKA phosphorylation site (pink), with conserved residues in boldface; and the DNA-binding domain (blue), with conserved leucine zipper residues in red [56]. Repression-mediating domains (green) show conserved hydrophobic amino acids in purple [95]. Asterisks represent conserved residues (*), and colons (:) indicate semi-conserved residues. Figure S6. Sequence conservation of the Yap1 protein in S. cerevisiae, D. hansenii, and C. albicans. The amino acid sequences of Yap1 from S. cerevisiae (ScYAP1, ID: KZV08838.1), D. hansenii (DhYAP1, ID:XP_461648.2), and C. albicans (CaCAP1, ID: KAL1577880.1) were aligned using the EMBL-EBI Clustal Omega on 9 July 2024 [50]. In the S. cerevisiae sequence, the basic leucine zipper domain (bZIP) is highlighted in yellow. Within this domain, the basic region residues that directly interact with base pairs (N74, A77, Q78, F81, and R82) are marked in green, and Yap1-specific residues (Q73, Q78, A80, and F81) are underlined. In the leucine zipper region, the typically hydrophobic residues at positions of the coiled-coil are shown in blue, and conserved leucine residues are marked in red [96,97,98]. The nuclear localization signal (NLS) and nuclear exportation signal (NES) are indicated with black and red boxes, respectively. The two cysteine-rich domains, nCRD and cCRD, are underlined in blue and gray, with conserved cysteine residues highlighted in purple (C303, C310, and C315; C598, C620, and C629, respectively) [99,100,101,102,103]. Asterisks (*) indicate fully conserved residues; colons (:) indicate semi-conserved residues. Figure S7. Growth curves of D. hansenii WT and Dhhog1Δ mutant without and with NaCl. Cells of WT and Dhhog1Δ mutants were cultured in rich medium YPD without NaCl (–NaCl) or YPD with NaCl (+0.6 M NaCl). Growth curves were followed for 72 hours. n = 3, and data are the mean ± standard deviation (SD). Table S1. Total percentage identity of each D. hansenii protein to their homologs in S. cerevisiae and C. albicans. Table S2. Deoxyoligonucleotides used for nucleosome scanning assays in DhCTA locus. Table S3. Deoxyoligonucleotides used for nucleosome scanning assays in DhCTT locus.

Author Contributions

Conceptualization, C.S.-K. and J.G.; Data curation, I.d.l.F.-C., J.G., N.S.S., D.O.-G., V.E.-S. and C.S.-K.; Formal analysis, I.d.l.F.-C., J.G., N.S.S., D.O.-G., V.E.-S. and C.S.-K.; Methodology, I.d.l.F.-C., J.G., V.E.-S. and C.S.-K.; Supervision, J.G. and C.S-K; Writing—original draft, I.d.l.F.-C., J.G. and C.S.-K.; Writing—review and editing, I.d.l.F.-C., J.G., N.S.S., D.O.-G., V.E.-S. and C.S.-K. All authors have read and agreed to the published version of the manuscript.

Funding

The authors declare that financial support was received for the research, authorship, and/or publication of this article. This project was supported by Dirección General de Asuntos del Personal Académico (DGAPA) Grant/Award Number: IN225320 and IA204923 granted financing. Additionally, we extend our gratitude to the Administration of the Facultad de Ciencias UNAM and the Grupos Interdisciplinarios de Investigación (GII-UNAM) for the support provided within the framework of the project “Intensificación de los procesos para la obtención de biocompuestos a partir de aguas residuales”—Project: GII3307, Instituto de Ingeniería UNAM.

Institutional Review Board Statement

Not applicable.

Informed Consent Statement

Not applicable.

Data Availability Statement

The original contributions presented in the study are included in the article/Supplementary Materials, further inquiries can be directed to the corresponding author.

Acknowledgments

The authors thank Jose Carlos Campero Basaldua from IFC, UNAM, for his technical support in NuSA experiments. We also thank Francisco Padilla Garfias and Natalia Chiquete Felix from IFC, UNAM, for their technical support. We thank the Posgrado en Ciencias Biológicas UNAM and the Consejo Nacional de Humanidades, Ciencias y Tecnologías de México (CONAHCyT) for support of this research through a graduate scholarship to Ileana de la Fuente Colmenares (CVU 620472).

Conflicts of Interest

The authors declare no conflict of interest.

References

  1. Dolz-Edo, L.; Rienzo, A.; Poveda-Huertes, D.; Pascual-Ahuir, A.; Proft, M. Deciphering dynamic dose responses of natural promoters and single cis elements upon osmotic and oxidative stress in yeast. Mol. Cell. Biol. 2013, 33, 2228–2240. [Google Scholar] [CrossRef] [PubMed]
  2. Davies, J.M.S.; Lowry, C.V.; Davies, K.J.A. Transient adaptation to oxidative stress in yeast. Arch. Biochem. Biophys. 1995, 317, 1–6. [Google Scholar] [CrossRef]
  3. Izawa, S.; Inoue, Y.; Kimura, A. Importance of catalase in the adaptive response to hydrogen peroxide: Analysis of acatalasaemic Saccharomyces cerevisiae. Biochem. J. 1996, 320 Pt 1, 61–67. [Google Scholar] [CrossRef] [PubMed]
  4. Yale, J.; Bohnert, H.J. Transcript expression in Saccharomyces cerevisiae at high salinity. J. Biol. Chem. 2001, 276, 15996–16007. [Google Scholar] [CrossRef] [PubMed]
  5. Parrou, J.L.; Teste, M.-A.; François, J. Effects of various types of stress on the metabolism of reserve carbohydrates in Saccharomyces cerevisiae: Genetic evidence for a stress-induced recycling of glycogen and trehalose. Microbiol. 1997, 143, 1891–1900. [Google Scholar] [CrossRef] [PubMed]
  6. Taymaz-Nikerel, H.; Cankorur-Cetinkaya, A.; Kirdar, B. Genome-wide transcriptional response of Saccharomyces cerevisiae to stress-induced perturbations. Front. Bioeng. Biotechnol. 2016, 4, 17. [Google Scholar] [CrossRef]
  7. Jamieson, D.J. Oxidative stress responses of the yeast Saccharomyces cerevisiae. Yeast 1998, 14, 1511–1527. [Google Scholar] [CrossRef]
  8. Morano, K.A.; Grant, C.M.; Moye-Rowley, W.S. The response to heat shock and oxidative stress in Saccharomyces cerevisiae. Genetics 2012, 190, 1157–1195. [Google Scholar] [CrossRef]
  9. Farrugia, G.; Balzan, R. Oxidative stress and programmed cell death in yeast. Front. Oncol. 2012, 2, 64. [Google Scholar] [CrossRef]
  10. Perrone, G.G.; Tan, S.-X.; Dawes, I.W. Reactive oxygen species and yeast apoptosis. BBA Mol. Cell Res. 2008, 1783, 1354–1368. [Google Scholar] [CrossRef]
  11. González, J.; Castillo, R.; García-Campos, M.A.; Noriega-Samaniego, D.; Escobar-Sánchez, V.; Romero-Aguilar, L.; Alba-Lois, L.; Segal-Kischinevzky, C. Tolerance to oxidative stress in budding yeast by heterologous expression of catalases A and T from Debaryomyces hansenii. Curr. Microbiol. 2020, 77, 4000–4015. [Google Scholar] [CrossRef] [PubMed]
  12. Ramos-Moreno, L.; Ramos, J.; Michán, C. Overlapping responses between salt and oxidative stress in Debaryomyces hansenii. World J. Microbiol. Biotechnol. 2019, 35, 170. [Google Scholar] [CrossRef] [PubMed]
  13. Sadeh, A.; Movshovich, N.; Volokh, M.; Gheber, L.; Aharoni, A. Fine-tuning of the Msn2/4–mediated yeast stress responses as revealed by systematic deletion of Msn2/4 partners. MBoC 2011, 22, 3127–3138. [Google Scholar] [CrossRef] [PubMed]
  14. Ikner, A.; Shiozaki, K. Yeast signaling pathways in the oxidative stress response. MR/Fundam. Mol. Mech. Mutagen. 2005, 569, 13–27. [Google Scholar] [CrossRef] [PubMed]
  15. Auesukaree, C. Molecular mechanisms of the yeast adaptive response and tolerance to stresses encountered during ethanol fermentation. J. Bioscien. Bioengin. 2017, 124, 133–142. [Google Scholar] [CrossRef]
  16. Vázquez, J.; González, B.; Sempere, V.; Mas, A.; Torija, M.J.; Beltran, G. Melatonin reduces oxidative stress damage induced by hydrogen peroxide in Saccharomyces cerevisiae. Front. Microbiol. 2017, 8, 66. [Google Scholar] [CrossRef]
  17. Gościńska, K.; Shahmoradi Ghahe, S.; Domogała, S.; Topf, U. Eukaryotic elongation factor 3 protects Saccharomyces cerevisiae yeast from oxidative stress. Genes. 2020, 11, 1432. [Google Scholar] [CrossRef]
  18. Martins, D.; English, A.M. Catalase activity is stimulated by H2O2 in rich culture medium and is required for H2O2 resistance and adaptation in yeast. Redox Biol. 2014, 2, 308–313. [Google Scholar] [CrossRef]
  19. Qi, Y.; Qin, Q.; Liao, G.; Tong, L.; Jin, C.; Wang, B.; Fang, W. Unveiling the super tolerance of Candida nivariensis to oxidative stress: Insights into the involvement of a catalase. Microbiol. Spectr. 2024, 12, e03169-23. [Google Scholar] [CrossRef]
  20. Yaakoub, H.; Mina, S.; Calenda, A.; Bouchara, J.-P.; Papon, N. Oxidative stress response pathways in fungi. Cell. Mol. Life Sci. 2022, 79, 333. [Google Scholar] [CrossRef]
  21. Godon, C.; Lagniel, G.; Lee, J.; Buhler, J.M.; Kieffer, S.; Perrot, M.; Boucherie, H.; Toledano, M.B.; Labarre, J. The H2O2 stimulon in Saccharomyces cerevisiae. J. Biol. Chem. 1998, 273, 22480–22489. [Google Scholar] [CrossRef] [PubMed]
  22. Klopf, E.; Schmidt, H.A.; Clauder-Münster, S.; Steinmetz, L.M.; Schüller, C. INO80 represses osmostress induced gene expression by resetting promoter proximal nucleosomes. Nucl. Acids Res. 2017, 45, 3752–3766. [Google Scholar] [CrossRef] [PubMed]
  23. Salas-Delgado, G.; Ongay-Larios, L.; Kawasaki-Watanabe, L.; López-Villaseñor, I.; Coria, R. The yeasts phosphorelay Ssystems: A comparative view. World J. Microbiol. Biotechnol. 2017, 33, 111. [Google Scholar] [CrossRef] [PubMed]
  24. Shi, K.; Gao, Z.; Shi, T.-Q.; Song, P.; Ren, L.-J.; Huang, H.; Ji, X.-J. Reactive oxygen species-mediated cellular stress response and lipid accumulation in oleaginous microorganisms: The state of the art and future perspectives. Front. Microbiol. 2017, 8, 793. [Google Scholar] [CrossRef]
  25. de Nadal, E.; Alepuz, P.M.; Posas, F. Dealing with osmostress through MAP kinase activation. EMBO Rep. 2002, 3, 735–740. [Google Scholar] [CrossRef]
  26. Saito, H.; Posas, F. Response to hyperosmotic stress. Genetics 2012, 192, 289–318. [Google Scholar] [CrossRef]
  27. Hohmann, S. An integrated view on a eukaryotic osmoregulation system. Curr. Genet. 2015, 61, 373–382. [Google Scholar] [CrossRef]
  28. Gonzalez, R.; Morales, P.; Tronchoni, J.; Cordero-Bueso, G.; Vaudano, E.; Quirós, M.; Novo, M.; Torres-Pérez, R.; Valero, E. New genes involved in osmotic stress tolerance in Saccharomyces cerevisiae. Front. Microbiol. 2016, 7, 1545. [Google Scholar] [CrossRef]
  29. Ruiz-Roig, C.; Noriega, N.; Duch, A.; Posas, F.; de Nadal, E. The Hog1 SAPK controls the Rtg1/Rtg3 transcriptional complex activity by multiple regulatory mechanisms. MBoC 2012, 23, 4286–4296. [Google Scholar] [CrossRef]
  30. Pascual-Ahuir, A.; Proft, M. The Sch9 kinase is a chromatin-associated transcriptional activator of osmostress-responsive genes. EMBO J. 2007, 26, 3098–3108. [Google Scholar] [CrossRef]
  31. Prista, C.; Loureiro-Dias, M.C.; Montiel, V.; García, R.; Ramos, J. Mechanisms underlying the halotolerant way of Debaryomyces hansenii. FEMS Yeast Res. 2005, 5, 693–701. [Google Scholar] [CrossRef] [PubMed]
  32. Gunde-Cimerman, N.; Ramos, J.; Plemenitaš, A. Halotolerant and halophilic fungi. Mycol. Res. 2009, 113, 1231–1241. [Google Scholar] [CrossRef] [PubMed]
  33. Michán, C.; Martínez, J.L.; Alvarez, M.C.; Turk, M.; Sychrova, H.; Ramos, J. Salt and oxidative stress tolerance in Debaryomyces hansenii and Debaryomyces fabryi. FEMS Yeast Res. 2013, 13, 180–188. [Google Scholar] [CrossRef] [PubMed]
  34. Sharma, P.; Meena, N.; Aggarwal, M.; Mondal, A.K. Debaryomyces hansenii, a highly osmo-tolerant and halo-tolerant yeast, maintains activated Dhog1p in the cytoplasm during its growth under severe osmotic stress. Curr. Genet. 2005, 48, 162–170. [Google Scholar] [CrossRef] [PubMed]
  35. Sánchez, N.S.; Calahorra, M.; González, J.; Defosse, T.; Papon, N.; Peña, A.; Coria, R. Contribution of the mitogen-activated protein kinase Hog1 to the halotolerance of the marine yeast Debaryomyces hansenii. Curr. Genet. 2020, 66, 1135–1153. [Google Scholar] [CrossRef]
  36. Hohmann, S. Osmotic stress signaling and osmoadaptation in yeasts. Microbiol. Mol. Biol. Rev. 2002, 66, 300–372. [Google Scholar] [CrossRef]
  37. Segal-Kischinevzky, C.; Rodarte-Murguía, B.; Valdés-López, V.; Mendoza-Hernández, G.; González, A.; Alba-Lois, L. The euryhaline yeast Debaryomyces hansenii has two catalase genes encoding enzymes with differential activity profile. Curr. Microbiol. 2011, 62, 933–943. [Google Scholar] [CrossRef]
  38. Gostinčar, C.; Gunde-Cimerman, N. Overview of oxidative stress response genes in selected halophilic fungi. Genes 2018, 9, 143. [Google Scholar] [CrossRef]
  39. Komalapriya, C.; Kaloriti, D.; Tillmann, A.T.; Yin, Z.; Herrero-de-Dios, C.; Jacobsen, M.D.; Belmonte, R.C.; Cameron, G.; Haynes, K.; Grebogi, C.; et al. Integrative model of oxidative stress adaptation in the fungal pathogen Candida albicans. PLoS ONE 2015, 10, e0137750. [Google Scholar] [CrossRef]
  40. Cuéllar-Cruz, M.; Briones-Martin-del-Campo, M.; Cañas-Villamar, I.; Montalvo-Arredondo, J.; Riego-Ruiz, L.; Castaño, I.; De Las Peñas, A. High resistance to oxidative stress in the fungal pathogen Candida glabrata is mediated by a single catalase, Cta1p, and is controlled by the transcription factors Yap1p, Skn7p, Msn2p, and Msn4p. Eukaryot. Cell 2008, 7, 814–825. [Google Scholar] [CrossRef]
  41. Aebi, H. [13] Catalase in vitro. In Methods in Enzymology; Oxygen Radicals in Biological Systems; Academic Press: Cambridge, MA, USA, 1984; Volume 105, pp. 121–126. [Google Scholar] [CrossRef]
  42. Schmitt, M.E.; Brown, T.A.; Trumpower, B.L. A rapid and simple method for preparation of RNA from Saccharomyces cerevisiae. Nucl. Acids Res. 1990, 18, 3091–3092. [Google Scholar] [CrossRef] [PubMed]
  43. Ochoa-Gutiérrez, D.; Reyes-Torres, A.M.; de la Fuente-Colmenares, I.; Escobar-Sánchez, V.; González, J.; Ortiz-Hernández, R.; Torres-Ramírez, N.; Segal-Kischinevzky, C. Alternative CUG codon usage in the halotolerant yeast Debaryomyces hansenii: Gene expression profiles provide new insights into ambiguous translation. JoF 2022, 8, 970. [Google Scholar] [CrossRef] [PubMed]
  44. González, J.; López, G.; Argueta, S.; Escalera-Fanjul, X.; el Hafidi, M.; Campero-Basaldua, C.; Strauss, J.; Riego-Ruiz, L.; González, A. Diversification of transcriptional regulation determines subfunctionalization of paralogous branched chain aminotransferases in the yeast Saccharomyces cerevisiae. Genetics 2017, 207, 975–991. [Google Scholar] [CrossRef] [PubMed]
  45. González, J.; Quezada, H.; Campero-Basaldua, J.C.; Ramirez-González, É.; Riego-Ruiz, L.; González, A. Transcriptional regulation of the genes encoding branched-chain aminotransferases in Kluyveromyces lactis and Lachancea kluyveri is independent of chromatin remodeling. Microbiol. Res. 2024, 15, 1225–1238. [Google Scholar] [CrossRef]
  46. Infante, J.J.; Law, G.L.; Young, E.T. Analysis of nucleosome positioning using a nucleosome-scanning assay. In Chromatin Remodeling: Methods and Protocols; Morse, R.H., Ed.; Humana Press: Totowa, NJ, USA, 2012; pp. 63–87. [Google Scholar] [CrossRef]
  47. Santana-Garcia, W.; Castro-Mondragon, J.A.; Padilla-Gálvez, M.; Nguyen, N.T.T.; Elizondo-Salas, A.; Ksouri, N.; Gerbes, F.; Thieffry, D.; Vincens, P.; Contreras-Moreira, B.; et al. RSAT 2022: Regulatory sequence analysis tools. Nucl. Acids Res. 2022, 50, W670–W676. [Google Scholar] [CrossRef]
  48. Maguire, S.L.; ÓhÉigeartaigh, S.S.; Byrne, K.P.; Schröder, M.S.; O’Gaora, P.; Wolfe, K.H.; Butler, G. Comparative genome analysis and gene finding in Candida species using CGOB. Mol. Biol. Evol. 2013, 30, 1281–1291. [Google Scholar] [CrossRef]
  49. Nikolaou, E.; Agrafioti, I.; Stumpf, M.; Quinn, J.; Stansfield, I.; Brown, A.J. Phylogenetic diversity of stress signalling pathways in fungi. BMC Evol. Biol. 2009, 9, 44. [Google Scholar] [CrossRef]
  50. Madeira, F.; Madhusoodanan, N.; Lee, J.; Eusebi, A.; Niewielska, A.; Tivey, A.R.N.; Lopez, R.; Butcher, S. The EMBL-EBI job dispatcher sequence analysis tools framework in 2024. Nucl. Acids Res. 2024, 52, W521–W525. [Google Scholar] [CrossRef]
  51. Waterhouse, A.M.; Procter, J.B.; Martin, D.M.A.; Clamp, M.; Barton, G.J. Jalview version 2--a multiple sequence alignment editor and analysis workbench. Bioinformatics 2009, 25, 1189–1191. [Google Scholar] [CrossRef]
  52. González-Hernández, J.C.; Peña, A. [Adaptation strategies of halophilic microorganisms and Debaryomyces hansenii (halophilic yeast)]. Rev. Latinoam. Microbiol. 2002, 44, 137–156. [Google Scholar]
  53. Pascual-Ahuir, A.; González-Cantó, E.; Juyoux, P.; Pable, J.; Poveda-Huertes, D.; Saiz-Balbastre, S.; Squeo, S.; Ureña-Marco, A.; Vanacloig-Pedros, E.; Zaragoza-Infante, L.; et al. Dose dependent gene expression is dynamically modulated by the history, physiology and age of yeast cells. BBA Gene Regul. Mech. 2019, 1862, 457–471. [Google Scholar] [CrossRef] [PubMed]
  54. Navarrete, C.; Sánchez, B.J.; Savickas, S.; Martínez, J.L. DebaryOmics: An integrative –omics study to understand the halophilic behaviour of Debaryomyces hansenii. Microb. Biotechnol. 2022, 15, 1133–1151. [Google Scholar] [CrossRef] [PubMed]
  55. Capaldi, A.P.; Kaplan, T.; Liu, Y.; Habib, N.; Regev, A.; Friedman, N.; O’Shea, E.K. Structure and function of a transcriptional network activated by the MAPK Hog1. Nat. Genet. 2008, 40, 1300–1306. [Google Scholar] [CrossRef] [PubMed]
  56. Proft, M.; Pascual-Ahuir, A.; de Nadal, E.; Ariño, J.; Serrano, R.; Posas, F. Regulation of the Sko1 transcriptional repressor by the Hog1 MAP kinase in response to osmotic stress. EMBO J. 2001, 20, 1123–1133. [Google Scholar] [CrossRef] [PubMed]
  57. Rep, M.; Proft, M.; Remize, F.; Tamás, M.; Serrano, R.; Thevelein, J.M.; Hohmann, S. The Saccharomyces cerevisiae Sko1p transcription factor mediates HOG pathway-dependent osmotic regulation of a set of genes encoding enzymes implicated in protection from oxidative damage. Mol. Microbiol. 2001, 40, 1067–1083. [Google Scholar] [CrossRef]
  58. Buzzini, P.; Turchetti, B.; Yurkov, A. Extremophilic yeasts: The toughest yeast around? Yeast 2018, 35, 487–497. [Google Scholar] [CrossRef]
  59. Segal-Kischinevzky, C.; Romero-Aguilar, L.; Alcaraz, L.D.; López-Ortiz, G.; Martínez-Castillo, B.; Torres-Ramírez, N.; Sandoval, G.; González, J. Yeasts inhabiting extreme environments and their biotechnological applications. Microorganisms 2022, 10, 794. [Google Scholar] [CrossRef]
  60. Lin, N.-X.; He, R.-Z.; Xu, Y.; Yu, X.-W. Augmented peroxisomal ROS buffering capacity renders oxidative and thermal stress cross-tolerance in yeast. Microb. Cell Fact. 2021, 20, 131. [Google Scholar] [CrossRef]
  61. Thines, L.; Morsomme, P. Manganese superoxide dismutase activity assay in the yeast Saccharomyces cerevisiae. Bio Protoc. 2020, 10, e3542. [Google Scholar] [CrossRef]
  62. Toledano, M.B.; Delaunay-Moisan, A.; Outten, C.E.; Igbaria, A. Functions and cellular compartmentation of the thioredoxin and glutathione pathways in yeast. Antioxid. Redox Sign. 2013, 18, 1699–1711. [Google Scholar] [CrossRef]
  63. Jones, E.B.G.; Ramakrishna, S.; Vikineswary, S.; Das, D.; Bahkali, A.H.; Guo, S.-Y.; Pang, K.-L. How do fungi survive in the sea and respond to climate change? JoF 2022, 8, 291. [Google Scholar] [CrossRef] [PubMed]
  64. Gunde-Cimerman, N.; Butinar, L.; Sonjak, S.; Turk, M.; Uršič, V.; Zalar, P.; Plemenitaš, A. Halotolerant and halophilic fungi from coastal environments in the Arctics. In Adaptation to Life at High Salt Concentrations in Archaea, Bacteria, and Eukarya (Cellular Origin, Life in Extreme Habitats and Astrobiology); Gunde-Cimerman, N., Oren, A., Plemenitaš, A., Eds.; Springer: Dordrecht, The Netherlands, 2005; pp. 397–423. [Google Scholar]
  65. Butinar, L.; Zalar, P.; Frisvad, J.C.; Gunde-Cimerman, N. The genus Eurotium– members of indigenous fungal community in hypersaline waters of salterns. FEMS Microbiol. Ecol. 2005, 51, 155–166. [Google Scholar] [CrossRef] [PubMed]
  66. Plemenitaš, A.; Lenassi, M.; Konte, T.; Kejžar, A.; Zajc, J.; Gostinčar, C.; Gunde-Cimerman, N. Adaptation to high salt concentrations in halotolerant/halophilic fungi: A molecular perspective. Front. Microbiol. 2014, 5, 199. [Google Scholar] [CrossRef] [PubMed]
  67. Prista, C.; Michán, C.; Miranda, I.M.; Ramos, J. The halotolerant Debaryomyces hansenii, the cinderella of non-conventional yeasts. Yeast 2016, 33, 523–533. [Google Scholar] [CrossRef] [PubMed]
  68. Navarrete, C.; Siles, A.; Martínez, J.L.; Calero, F.; Ramos, J. Oxidative stress sensitivity in Debaryomyces hansenii. FEMS Yeast Res. 2009, 9, 582–590. [Google Scholar] [CrossRef]
  69. Marchler, G.; Schüller, C.; Adam, G.; Ruis, H. A Saccharomyces cerevisiae UAS element controlled by protein kinase A activates transcription in response to a variety of stress conditions. EMBO J. 1993, 12, 1997–2003. [Google Scholar] [CrossRef]
  70. Rep, M.; Reiser, V.; Gartner, U.; Thevelein, J.M.; Hohmann, S.; Ammerer, G.; Ruis, H. Osmotic stress-induced gene expression in Saccharomyces cerevisiae requires Msn1p and the novel nuclear factor Hot1p. Mol. Cell. Biol. 1999, 19, 5474–5485. [Google Scholar] [CrossRef]
  71. Kathiresan, M.; Martins, D.; English, A.M. Respiration triggers heme transfer from cytochrome c peroxidase to catalase in yeast mitochondria. Proc. Natl. Acad. Sci. USA 2014, 111, 17468–17473. [Google Scholar] [CrossRef]
  72. Strucko, T.; Andersen, N.L.; Mahler, M.R.; Martínez, J.L.; Mortensen, U.H. A CRISPR/Cas9 method facilitates efficient oligo-mediated gene editing in Debaryomyces hansenii. Synth. Biol. 2021, 6, ysab031. [Google Scholar] [CrossRef]
  73. Spasskaya, D.S.; Kotlov, M.I.; Lekanov, D.S.; Tutyaeva, V.V.; Snezhkina, A.V.; Kudryavtseva, A.V.; Karpov, V.L.; Karpov, D.S. CRISPR/Cas9-mediated genome engineering reveals the contribution of the 26S proteasome to the extremophilic nature of the yeast Debaryomyces hansenii. ACS Synth. Biol. 2021, 10, 297–308. [Google Scholar] [CrossRef]
  74. Mendoza-Téllez, B.; Zamora-Bello, A.; Rosas-Paz, M.; Villarreal-Huerta, D.; de la Fuente, I.; Segal-Kischinevzky, C.; González, J. Introducción a los sistemas CRISPR y sus aplicaciones en levaduras. TIP Rev. Espec. Cienc. Quím-Biol. 2022, 25, 1–21. [Google Scholar] [CrossRef]
  75. Scacchetti, A.; Becker, P.B. Variation on a theme: Evolutionary strategies for H2A.Z exchange by SWR1-type remodelers. Curr. Opin. Cell Biol. 2021, 70, 1–9. [Google Scholar] [CrossRef] [PubMed]
  76. Wong, L.H.; Tremethick, D.J. Multifunctional histone variants in genome function. Nat. Rev. Genet. 2024, 1–23. [Google Scholar] [CrossRef] [PubMed]
  77. Jansen, A.; Verstrepen, K.J. Nucleosome positioning in Saccharomyces cerevisiae. Microbiol. Mol. Biol. Rev. 2011, 75, 301–320. [Google Scholar] [CrossRef] [PubMed]
  78. Campero-Basaldua, C.; Quezada, H.; Riego-Ruíz, L.; Márquez, D.; Rojas, E.; González, J.; El-Hafidi, M.; González, A. Diversification of the kinetic properties of yeast NADP-glutamate-dehydrogenase isozymes proceeds independently of their evolutionary origin. Microbiol. Open 2017, 6, e00419. [Google Scholar] [CrossRef]
  79. Escalera-Fanjul, X.; Campero-Basaldua, C.; Colón, M.; González, J.; Márquez, D.; González, A. Evolutionary diversification of alanine transaminases in yeast: Catabolic specialization and biosynthetic redundancy. Front. Microbiol. 2017, 8, 1150. [Google Scholar] [CrossRef]
  80. Bernstein, B.E.; Liu, C.L.; Humphrey, E.L.; Perlstein, E.O.; Schreiber, S.L. Global nucleosome occupancy in yeast. Genome Biol. 2004, 5, R62. [Google Scholar] [CrossRef]
  81. Boeger, H.; Griesenbeck, J.; Strattan, J.S.; Kornberg, R.D. Nucleosomes unfold completely at a transcriptionally active promoter. Mol. Cell 2003, 11, 1587–1598. [Google Scholar] [CrossRef]
  82. Reinke, H.; Hörz, W. Histones are first hyperacetylated and then lose contact with the activated PHO5 promoter. Mol. Cell 2003, 11, 1599–1607. [Google Scholar] [CrossRef]
  83. Proft, M.; Struhl, K. Hog1 kinase converts the Sko1-Cyc8-Tup1 repressor complex into an activator that recruits SAGA and SWI/SNF in response to osmotic stress. Mol. Cell 2002, 9, 1307–1317. [Google Scholar] [CrossRef]
  84. Hasan, R.; Leroy, C.; Isnard, A.-D.; Labarre, J.; Boy-Marcotte, E.; Toledano, M.B. The control of the yeast H2O2 response by the Msn2/4 transcription factors. Mol. Microbiol. 2002, 45, 233–241. [Google Scholar] [CrossRef] [PubMed]
  85. Mat Nanyan, N.S.; Takagi, H. Proline homeostasis in Saccharomyces cerevisiae: How does the stress-responsive transcription factor Msn2 play a role? Front. Genet. 2020, 11, 534672. [Google Scholar] [CrossRef] [PubMed]
  86. Alepuz, P.M.; Jovanovic, A.; Reiser, V.; Ammerer, G. Stress-induced MAP kinase Hog1 is part of transcription activation complexes. Mol. Cell 2001, 7, 767–777. [Google Scholar] [CrossRef] [PubMed]
  87. Schüller, C.; Brewster, J.L.; Alexander, M.R.; Gustin, M.C.; Ruis, H. The HOG pathway controls osmotic regulation of transcription via the Stress Response Element (STRE) of the Saccharomyces cerevisiae CTT1 gene. EMBO J. 1994, 13, 4382–4389. [Google Scholar] [CrossRef] [PubMed]
  88. Alonso-Monge, R.; Navarro-García, F.; Román, E.; Negredo, A.I.; Eisman, B.; Nombela, C.; Pla, J. The Hog1 mitogen-activated protein kinase is essential in the oxidative stress response and chlamydospore formation in Candida albicans. Eukaryot. Cell 2003, 2, 351–361. [Google Scholar] [CrossRef]
  89. Smith, D.A.; Nicholls, S.; Morgan, B.A.; Brown, A.J.P.; Quinn, J. A conserved stress-activated protein kinase regulates a core stress response in the human pathogen Candida albicans. MBoC 2004, 15, 4179–4190. [Google Scholar] [CrossRef]
  90. Sadeh, A.; Volokh, M.; Aharoni, A. Conserved motifs in the Msn2-activating domain are important for Msn2-mediated yeast stress response. J. Cell Sci. 2012, 125, 3333–3342. [Google Scholar] [CrossRef]
  91. Brown, J.L.; Bussey, H.; Stewart, R.C. Yeast Skn7p functions in a eukaryotic two-component regulatory pathway. EMBO J. 1994, 13, 5186–5194. [Google Scholar] [CrossRef]
  92. Ketela, T.; Brown, J.L.; Stewart, R.C.; Bussey, H. Yeast Skn7p activity is modulated by the Sln1p-Ypd1p osmosensor and contributes to regulation of the HOG pathway. Mol. Gen. Genet. 1998, 259, 372–378. [Google Scholar] [CrossRef]
  93. Fassler, J.S.; West, A.H. Fungal Skn7 stress responses and their relationship to virulence. Eukaryot. Cell 2011, 10, 156–167. [Google Scholar] [CrossRef]
  94. Alberts, A.S.; Bouquin, N.; Johnston, L.H. Analysis of RhoA-binding proteins reveals an interaction domain conserved in heterotrimeric G protein β subunits and the yeast response regulator protein Skn7. J. Biol. Chem. 1998, 273, 8616–8622. [Google Scholar] [CrossRef] [PubMed]
  95. Lettow, J.; Kliewe, F.; Aref, R.; Schüller, H.-J. Functional characterization and comparative analysis of gene repression-mediating domains interacting with yeast pleiotropic corepressors Sin3, Cyc8 and Tup1. Curr. Genet. 2023, 69, 127–139. [Google Scholar] [CrossRef] [PubMed]
  96. Moye-Rowley, W.S.; Harshman, K.D.; Parker, C.S. Yeast YAP1 encodes a novel form of the Jun family of transcriptional activator proteins. Genes Dev. 1989, 3, 283–292. [Google Scholar] [CrossRef] [PubMed]
  97. Fernandes, L.; Rodrigues-Pousada, C.; Struhl, K. Yap, a novel family of eight bZIP proteins in Saccharomyces cerevisiae with distinct biological functions. Mol. Cell Biol. 1997, 17, 6982–6993. [Google Scholar] [CrossRef]
  98. Rodrigues-Pousada, C.; Devaux, F.; Caetano, S.M.; Pimentel, C.; da Silva, S.; Cordeiro, A.C.; Amaral, C. Yeast AP-1 like transcription factors (Yap) and stress response: A current overview. Microb. Cell 2019, 6, 267–285. [Google Scholar] [CrossRef]
  99. Harshman, K.D.; Moye-Rowley, W.S.; Parker, C.S. Transcriptional activation by the SV40 AP-1 recognition element in yeast is mediated by a factor similar to AP-1 that is distinct from GCN4. Cell 1988, 53, 321–330. [Google Scholar] [CrossRef]
  100. Kuge, S.; Jones, N.; Nomoto, A. Regulation of yAP-1 nuclear localization in response to oxidative stress. EMBO J. 1997, 16, 1710–1720. [Google Scholar] [CrossRef]
  101. Yan, L.; Lee, L.H.; Davis, L.I. Crm1p mediates regulated nuclear export of a yeast AP-1-like transcription factor. EMBO J. 1998, 17, 7416–7429. [Google Scholar] [CrossRef]
  102. Azevedo, D.; Tacnet, F.; Delaunay, A.; Rodrigues-Pousada, C.; Toledano, M.B. Two redox centers within Yap1 for H2O2 and thiol-reactive chemicals signaling. Free Rad. Biol. Med. 2003, 35, 889–900. [Google Scholar] [CrossRef]
  103. Mendoza-Martínez, A.E.; Cano-Domínguez, N.; Aguirre, J. Yap1 homologs mediate more than the redox regulation of the antioxidant response in filamentous fungi. Fungal Biol. 2020, 124, 253–262. [Google Scholar] [CrossRef]
Figure 2. Time course response to hydrogen peroxide exposure, measuring cellular viability, DhCTA and DhCTT expression, and catalase-specific enzyme activity. (A) Cells were grown in YPD with 0.6 M NaCl to the mid-log phase, as described in the Materials and Methods section. (B) Assessment of cell survival following H2O2 shock (30 mM) at different time intervals (0, 15, 30, 60, 120, and 180 min) with shaking, followed by tenfold serial dilutions (10−2, 10−3, 10−4). A 10-μL aliquot of each dilution was spotted onto YPD agar plates and incubated for 3 days at 28 °C. (C) Relative expression (fold change) of the DhCTA (dark bars) and DhCTT (light bars) genes. Total RNA was extracted from cells at different intervals and analyzed by RT-qPCR. Transcript data were normalized against the expression level of the ribosomal protein S3 gene (DhRPS3). (D) Catalase activity in cell-free yeast extracts was measured at different intervals (μmol H2O2 oxidized min−1 mg of protein−1). Values are presented as the mean of at least six independent measurements ± (SD). Significant differences: p-value ≤ 0.05 (*), ≤0.01 (**), ≤0.0001 (****).
Jof 10 00740 g002
Figure 3. Nucleosome scanning assay indicates that DhCTA and DhCTT expression induction is independent of chromatin, which remains accessible under NaCl conditions or NaCl plus H2O2 shock conditions. (A,B) Relative MNase protection of DhCTA and DhCTT genes was calculated as the ratio of template present in MNase-digested DNA to the amount of MNase protection observed for the DhVCX1 locus, which was used as control. NFR stands for Nucleosome-Free Regions. (C,D) Diagrams of each locus indicate the positions of nucleosomes (circles) extrapolated from the MNase protection data. The thickness of the arrows indicates transcript levels under each condition. Colored boxes correspond to the binding sites of MSN2/4, SKN7, SKO1, and YAP1 in each promoter (PDhCTA and PDhCTT).
Jof 10 00740 g003
Figure 4. Predicted stress-related TF binding sites in DhCTA, DhCTT, DhSOD1, DhENA1, DhSTL1, and DhGPD1 promoter regions. (A) Sequence logos defining MSN2/4, SKN7, SKO1, and YAP1 are shown as provided by the Jaspar database http://jaspar.genereg.net/ accessed on 11 November 2023. (B,C) Sequences from −620 bp upstream to +1 ATG are shown; the predicted motifs are highlighted for MSN2/4 (pink), SKN7 (yellow), SKO1 (green), and YAP1 (blue). (B) For DhCTA, (C) For DhCTT. (D) Oxidative and saline stress-related genes (dark blue outlines), osmotic-stress response genes (red outlines). (E) Number of TF binding sites identified in each promoter.
Jof 10 00740 g004
Figure 5. The DhHog1 MAP kinase is crucial for cellular viability in D. hansenii under saline-stress conditions. Cells were grown in rich medium YPD during the mid-log phase, followed by 10-fold serial dilutions (10−1, 10−2, 10−3, 10−4, 10−5, 10−6). A 10 μL aliquot of each dilution was spotted onto YPD agar medium plates without or with NaCl (+0.6 M, +1 M, or +2 M) and incubated at 28 °C. (A) YPD plates without NaCl, with 0.6 M NaCl, or with 1 M NaCl were incubated for 3 days. (B) YPD plates with 2 M NaCl incubated for 3, 7, and 15 days. Representative images from three independent experiments are shown.
Jof 10 00740 g005
Figure 6. The DhHog1 MAP kinase regulates the induction of catalase activity corresponding to DhCTA expression under NaCl conditions. (A) Catalase activity in cell-free yeast extracts was measured from the WT and Dhhog1Δ mutant in YPD without (−) or with 0.6 M NaCl (+) at different intervals (0, 14, and 24 h). Bars represent catalase-specific activity (μmol H2O2 oxidized min−1 mg of protein−1). (B) Total RNA was extracted from WT and Dhhog1Δ mutant in YPD without (−) or with 0.6 M NaCl (+) at 14 h and analyzed by RT-qPCR. Bars represent relative expression of the DhCTA, DhCTT, and DhSTL1 genes, respectively. Transcript data were normalized against the expression level of the actin gene (DhACT1). Values are presented as the mean of at least six independent measurements ± (SD). Significant differences: p-value ≤ 0.001 (***), ≤0.0001 (****).
Jof 10 00740 g006
Figure 7. H2O2 sensitivity and DhCTA and DhCTT gene expression in WT and Dhhog1Δ strains. (A) Cells were cultured in YPD without or with NaCl (-NaCl or +0.6 M NaCl). Sensitivity assays with different concentrations of H2O2 (0, 2.5, 5, 10, 20, and 30 mM) were shocked, followed by 10-fold serial dilutions (10−1, 10−2, 10−3, 10−4). A 10 μL aliquot of each dilution was spotted onto YPD agar plates and incubated for 3 days at 28 °C. (B) Gene expression analysis of DhCTA and DhCTT under YPD with a 30 mM H2O2 shock in WT and Dhhog1Δ strains. Total RNA was extracted from WT and Dhhog1Δ mutant subjected to YPD with 30 mM H2O2 shock for 60 min and analyzed by RT-qPCR. Bars represent the relative expression of the DhCTA and DhCTT genes. Transcript data were normalized against the expression level of the actin gene (DhACT1). (C) Catalase activity in cell-free yeast extracts was measured from the WT and Dhhog1Δ mutant in YPD without (−) or with 30 mM H2O2 (+) after 60 min. Bars represent catalase-specific activity (μmol H2O2 oxidized min−1 mg of protein−1). Values are presented as the mean of at least six independent measurements ± SD. Significant differences: p-value ≤ 0.01 (**), ≤0.0001 (****).
Jof 10 00740 g007
Figure 8. Illustration depicting the positive regulation of DhHog1 in catalase activity in D. hansenii under NaCl and/or H2O2 conditions. DhHog1 positively regulates DhCTA in both conditions. Binding motifs for stress-related transcription factors Msn2/4, Sko1, Skn7, or Yap1 are located in the promoters of DhCTA and DhCTT genes. Under oxidative stress, the induction of both genes has an additive effect on catalase transcription and activity to cope with H2O2 accumulation. Transcriptional factor binding sites are color-coded. Created using BioRender.com with the publication license number TN27DNAJLH.
Jof 10 00740 g008
Figure 9. Schematic representation of the regulation of catalase genes DhCTA and DhCTT in D. hansenii during adaptation to oxidative stress induced by H2O2 shock under saline conditions. (A) The timeline of cellular homeostasis (green) and oxidative stress (red) shows the treatment start and peaks in transcription and enzyme activity. (B) Promoters of DhCTA and DhCTT exhibit an open chromatin configuration exhibiting nucleosome-free regions (NFR). (C) DhCTA expression depends on DhHog1 under both saline and oxidative conditions, whereas DhCTT expression is induced independently of DhHog1 during oxidative stress. Transcription factor binding motifs related to osmotic or oxidative stress are located in both promoters. (D) Catalase activity temporarily increases to handle H2O2 accumulation. (E) Activity returns to basal levels after 180 min of the initial stimulus. Purple arrows indicate positive feedback regulation; gray dashed lines represent unknown interactions; gray-ended lines denote negative feedback regulation; red arrows indicate transcription, and blue arrows indicate translation. Created using BioRender.com with the publication license number QV27DNANS1.
Jof 10 00740 g009
Table 1. Deoxyoligonucleotides used for qPCR analysis.
GenePrimerSequence (5′–3′)Amplicon Size (bp)
DhCTADhCTAFwAAGGTCTTGCCACATAAGG145
DhCTARvGATCAGCAGAAGCTTCCATG
DhCTTDhCTTFwATGAAAGAATTGCTGCTGG150
DhCTTRvGGCCAAACTTTCTTAATGGG
DhSTL1DhSTL1FwTGGGAATGGCTGACACTTATG118
DhSTL1RvGCTCTTCTACCCAACCTATCAATC
DhRPS3DhS3FwAAGGACCCAGCAACCAACAA148
DhS3RvAAGCGGAAGCTTCAACTGGT
DhACT1DhACT1FwCCCAGAAGAACACCCAGTTT125
DhACT1RvCGGCTTGGATAGAAACGTAGAA
Table 2. Percentage identity of protein domains in D. hansenii compared with S. cerevisiae and C. albicans. The columns display each domain’s position relative to the first amino acid in D. hansenii, the type of domain, and the percentage identity compared to S. cerevisiae or C. albicans.
Protein in D. hanseniiPositionDomain% Identity
S. cerevisiaeC. albicans
DhMsn2/4368–419C2H2 Zinc Finger757989
DhSkn726–131HSF-type6185
397–513Response Regulator 7395
DhSko174–97Hog1-interaction domain5258
226–372Repression domain1425
233–243Hydrophobic patch6382
413–430PKA interaction region3324
466–487bZIP8291
491–514bZIP23375
DhYap139–99bZIP6280
41–48NLS100100
243–281nCRD4469
417–462cCRD6691
439–457NES63100
HSF = heat shock factor; bZIP = basic leucine zipper; NLS = nuclear localization signal; nCRD = N-terminal cysteine-rich domain; cCRD = C-terminal cysteine-rich domain; NES = nuclear export signal.
Disclaimer/Publisher’s Note: The statements, opinions and data contained in all publications are solely those of the individual author(s) and contributor(s) and not of MDPI and/or the editor(s). MDPI and/or the editor(s) disclaim responsibility for any injury to people or property resulting from any ideas, methods, instructions or products referred to in the content.