Article

Candida albicans Genes Modulating Echinocandin Susceptibility of Caspofungin-Adapted Mutants Are Constitutively Expressed in Clinical Isolates with Intermediate or Full Resistance to Echinocandins

1
Department of Biochemistry and Biophysics, University of Rochester Medical Center, Rochester, NY 14642, USA
2
Hackensack Meridian School of Medicine, Center for Discovery and Innovation, Nutley, NJ 07110, USA
*
Author to whom correspondence should be addressed.
These authors contributed equally to this work.
J. Fungi 2024, 10(3), 224; https://doi.org/10.3390/jof10030224
Submission received: 7 February 2024 / Revised: 11 March 2024 / Accepted: 15 March 2024 / Published: 19 March 2024
(This article belongs to the Section Fungal Pathogenesis and Disease Control)

Abstract

:
The opportunistic fungus Candida albicans is the leading cause of invasive candidiasis in immune-compromised individuals. Drugs from the echinocandin (ECN) class, including caspofungin, are used as a first line of therapy against invasive candidiasis. The only known mechanism of clinical resistance to ECNs is point mutations in the FKS1 gene, which encodes the drug target. However, many clinical isolates developed decreased ECN susceptibilities in the absence of resistance-associated FKS1 mutations. We have identified 15 C. albicans genes that contribute to decreased drug susceptibility. We explored the expression of these 15 genes in clinical isolates with different levels of ECN susceptibility. We found that these 15 genes are expressed in clinical isolates with or without FKS1 mutations, including those strains that are less susceptible to ECNs. In addition, FKS1 expression was increased in such less susceptible isolates compared to highly susceptible isolates. Similarities of gene expression patterns between isolates with decreased ECN susceptibilities in the absence of FKS1 mutations and clinically resistant isolates with mutations in FKS1 suggest that clinical isolates with decreased ECN susceptibilities may be a precursor to development of resistance.

1. Introduction

Invasive fungal diseases, including those caused by Candida species, are rising overall, particularly among immunocompromised individuals. Indeed, C. albicans, a predominant fungal pathogen of humans, is the most common cause of systemic candidiasis. Along with infections by non-albicans species, C. albicans increasingly displays resistance to antifungals [1,2,3,4,5,6].
Drugs from the echinocandin (ECN) class caspofungin, anidulafungin, micafungin, and rezafungin, are recommended as a first-line treatment for invasive candidiasis because of their low toxicity and high efficacy, especially against isolates that are resistant to azole drugs [7,8]. ECNs inhibit the fungal-specific target 1,3-β-glucan synthase, an enzyme complex required for the synthesis of glucan, the main structural skeleton of the cell wall to which all other components are cross-linked [9,10,11].
Currently, there is only one known mechanism of C. albicans clinical resistance to ECNs. This involves point mutations in the FKS1 (orf19.2929) gene, which encodes a catalytic subunit of the 1,3-β-glucan synthase complex, in various Candida species and in the FKS1 gene or in the orthologous FKS2 gene in C. glabrata [12,13]. These mutations decrease the sensitivity of glucan synthase to ECNs by several orders of magnitude, dramatically elevate minimum inhibitory concentrations (MICs), and confer reduced pharmacodynamic responses [12,14,15,16]. The genome of C. albicans also contains two orthologous FKS genes, FKS2 (orf19.3269) and FKS3 (orf19.2495), which are conserved in other Candida species and in other microbes. We have recently shown that these genes are negative regulators of FKS1 [17].
Importantly, work from our lab and others have established that C. albicans possesses mechanisms independent of FKS1 mutations that confer decreased susceptibility to ECNs, although these mechanisms do not confer clinical resistance [18]. Indeed, dozens of Candida clinical isolates have been identified that display a wide range of increased MIC values for ECNs, including some at or below the MIC breakpoints but lacking classical FKS1 resistance mutations [19,20,21]. Mechanisms that decrease drug susceptibility in the absence of FKS1 mutations are considered to be of critical importance as they allow transient survival in the presence of cidal ECNs and facilitate the evolution of classical clinical resistance [22,23].
We have previously used C. albicans caspofungin-adapted mutants modeling clinical isolates with decreased ECN susceptibility in the absence of FKS1 mutation to identify genes that are involved in the control of ECN susceptibility. We have identified a total of 15 genes, 10 of them on Ch5 and 5 of them on Ch2, that are simultaneously downregulated (Ch5 genes) or upregulated (Ch2 genes) in the mutants that adapted to growth in the presence of otherwise lethal amounts of ECN caspofungin [18]. These genes control the amounts of three major cell wall components—glucan, mannan, and chitin—as well as masking/unmasking of immunological epitope glucan [18]. Here, we set about to address the expression of these 15 genes in various clinical isolates that differ by their level of susceptibility to drugs from the ECN class.

2. Materials and Methods

2.1. Genes, Clinical Isolates, and Primers

C. albicans genes and clinical isolates studied here are presented in Table 1 and Table 2 correspondingly. Primers used here are presented in Table S1.

2.2. Maintenance and Growth of Strains and Media

Cells were maintained, stored, and grown using our standardized approach that prevents the induction of chromosome instability, as previously described [24]. This approach favors maintaining a population of cells that represents a major fraction of cells [25]. Cells were stored in a 25% (vol/vol) glycerol solution at −80 °C to interrupt metabolism and routinely grown at 37 °C. When needed, cells from a −80 °C stock were streaked for independent colonies onto yeast extract–peptone–dextrose (YPD) plates and incubated at 37 °C until young colonies with a size of approximately 1 × 10⁵ to 3 × 10⁵ cells/colony grew up. Young colonies were collected, a proper dilution in sterile water was prepared with the aid of a hemacytometer, approximately 3000 colony forming units (CFU) were plated onto each plate, and plates were incubated until young colonies appeared.
We used YPD medium (1% yeast extract, 2% peptone, and 2% dextrose) and RPMI 1640 medium (Sigma, St. Louis, MO, USA). To prepare solid medium, 2% (wt/vol) agar was added.

2.3. Broth Microdilution Assay to Determine MICs

We employed a broth microdilution assay in accordance with the CLSI document M27-A3 broth microdilution method for yeasts [26]. The assay was performed in triplicate. C. parapsilosis ATCC 22019 and C. krusei ATCC 6258 were used as quality control strains.

2.4. Determination of Gene Expression by qPCR

The clump of cells of the clinical isolate was removed from −80 °C frozen stock and suspended in a 50 mL culture tube containing 10 mL YPD medium (primary culture). The culture tube was incubated in a shaker at 37 °C for 16 h at 220 rotations per minute (rpm). A fresh 10 mL YPD medium in a 50 mL culture tube was inoculated with 2% saturated primary culture and incubated in a shaker at 37 °C for 4.5 h at 220 rpm. Cells were collected and washed twice with ice-cold water to remove any residual medium. The cells were suspended in 0.6 mL lysis buffer provided in an RNeasy kit (Qiagen, Germantown, MD, USA) and transferred in a 1.5 mL tube containing 200 µL of glass beads (0.5 mm). The cells were broken by 6 alternative cycles of 1 min for each vortex and sample incubation on ice. The cell lysate was centrifuged at 10,000 rpm for 3 min at 4 °C, the supernatant was collected in a new 1.5 mL tube, and total RNA was extracted according to RNeasy kit instruction. A total of 2 μg of total RNA was treated with DNase I (Thermo Fisher Scientific, Waltham, MA, USA) followed by cDNA preparation using multiscript reverse transcriptase (Applied Biosystems, Bedford, MA, USA) as per manufacturer’s instruction. The quantitative amplification of cDNA was monitored by incorporation of SYBR green in the StepOnePlus qPCR system (Applied Biosystems, MA, USA) using a PCR master mix from Applied Biosystems (MA, USA). The amplification curves were analyzed using StepOne software v2.2.2 (Applied Biosystems, Bedford, MA, USA).
We used the expression of the ACT1 (orf19.5007) gene to normalize the expression of genes of interest or target genes [27]. We used SC5314 (Candida Genome Database: http://www.candidagenome.org/cache/C_albicans_SC5314_genomeSnapshot.html, accessed on 9 October 2023) as a control strain. MICs for caspofungin, anidulafungin, or micafungin of SC5314 are, correspondingly, 0.06 mg/L, 0.06 mg/L, and 0.015 mg/L [28]. We used the ΔΔCt method for the relative quantification of mRNA of target genes [29]. Briefly, the expression ratio of clinical isolate/control strain = 2−∆∆Ct
where
∆∆Ct = [∆Ct clinical isolate − ∆Ct control strain];
∆Ct clinical isolate = Cttarget gene − CtACT1;
∆Ct control strain = Cttarget gene − CtACT1;
Ct = threshold cycle value.
The quantification and statistical analysis (Student’s t-test) was performed in Excel version 16.0 (Microsoft 365). Graphs were made using GraphPad Prism (9.5.0).

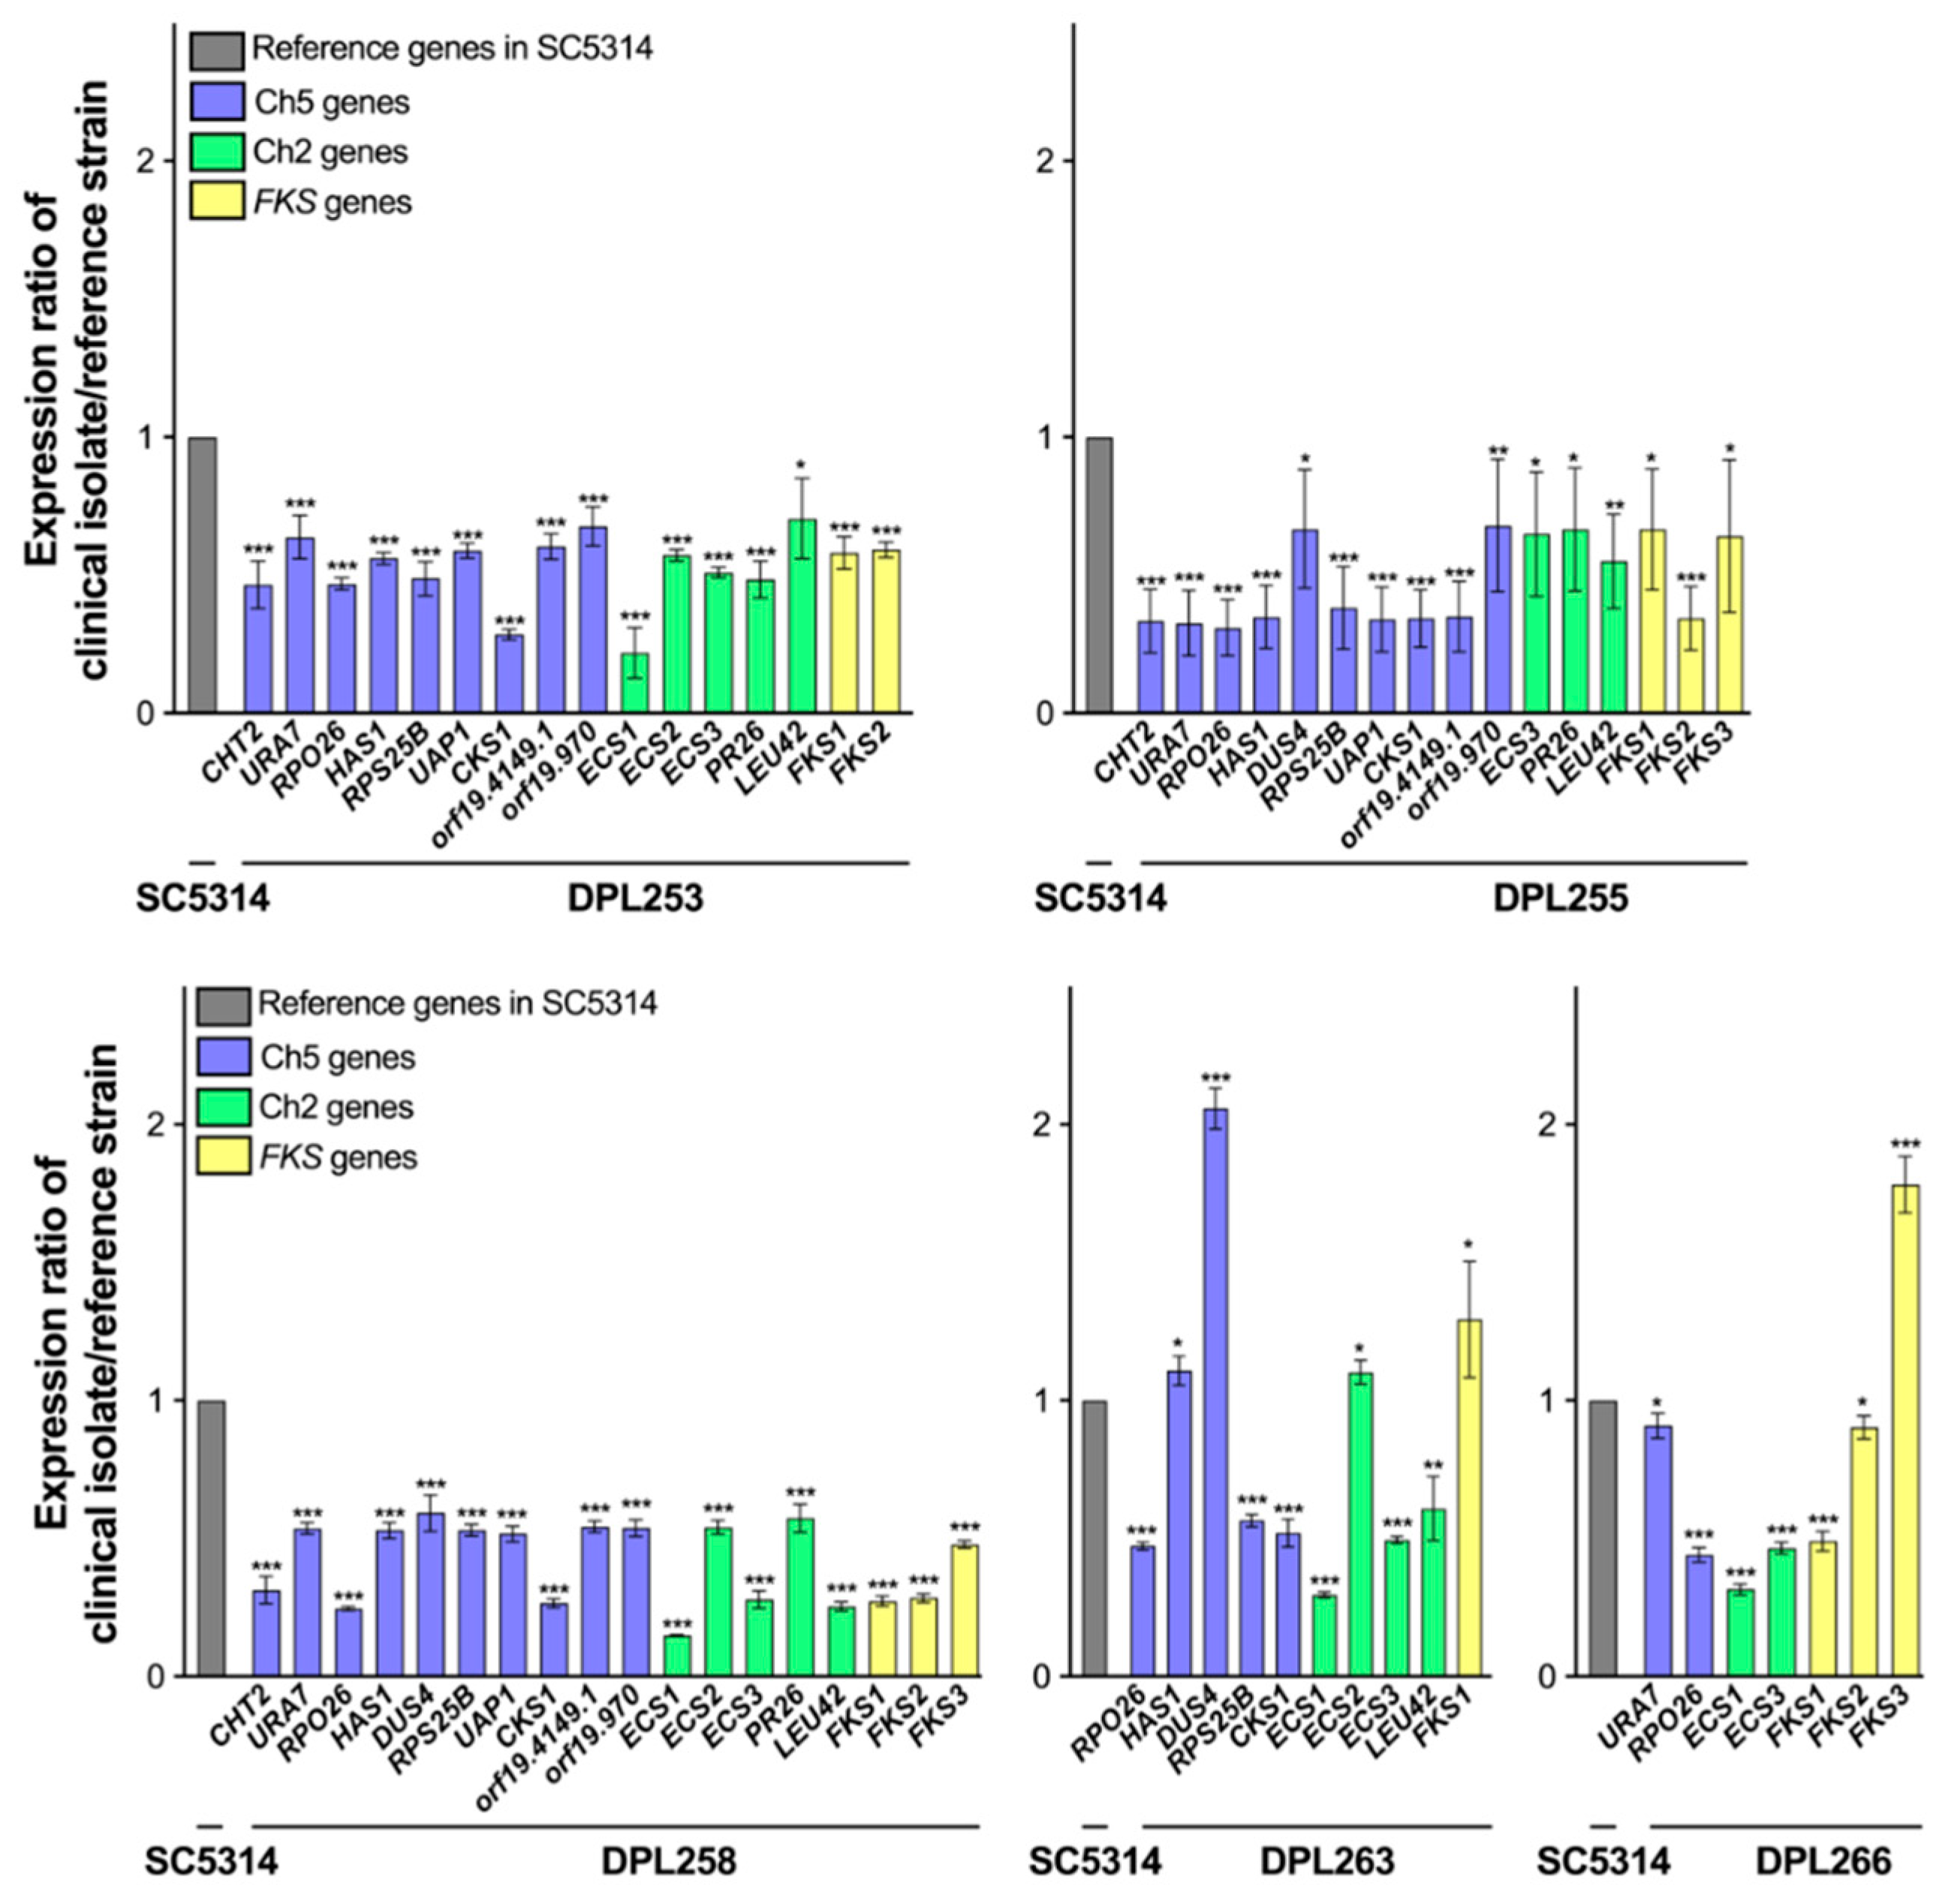
3. Results and Discussion

As presented in the Introduction, we employed model caspofungin-adapted mutants in which we identified 10 downregulated genes on Ch5 and 5 upregulated genes on Ch2 (Table 1) that act in concert to modulate drug-susceptibility. We set about to address how these 15 genes are expressed in clinical isolates. We used a qPCR approach (Section 2) to analyze the expression of the above genes in 11 C. albicans clinical isolates representing three levels of ECN MIC-based in vitro susceptibility. The levels corresponded to highly ECN-susceptible isolates, less susceptible isolates, and clinically resistant isolates (Table 2). Clinically resistant isolates possessed different FKS1 mutations to resistance in contrast to the other mutation-free isolates (Table 2). A total of five highly susceptible isolates, DPL253, DPL255, DPL258, DPL263, and DPL266, have MIC values for ECNs caspofungin, anidulafungin, or micafungin, ranging from 0.015 to 0.06 mg/L (Table 2). A total of three less susceptible isolates, DPL225, DPL291, and DPL1000, have MIC values ranging from 0.05 to 0.40 mg/L (Table 2). Finally, a total of three clinically resistant isolates, DPL15, DPL1009, and DPL1008, have relatively high MIC values ranging from 0.5 to 8.0 mg/L (Table 2).
In addition to 15 genes that control cell wall remodeling, we determined the expression of FKS genes that are responsible for the biosynthesis of cell wall constituents (Table 1, see Section 1). In earlier studies addressing the relation between expression of C. albicans FKS genes and susceptibility to ECNs, ref. [14] found changes in relative expression ratios of FKS1/FKS2 and FKS1/FKS3 in various clinical isolates, whereas [30] described expression changes in FKS genes in caspofungin-adapted model mutants vs. their drug-susceptible parentals. More recently, ref. [18] showed that 10 Ch5 genes that we are analyzing here control expression changes in FKS genes. By including FKS genes in this work, we addressed the question of how expressions of FKSs relate to the expression of 15 genes on Ch2 and Ch5 in clinical isolates.
In order to compare gene expressions from different isolates, we used a control C. albicans strain SC5314, which is the reference strain for sequencing (see Section 2). Caspofungin, anidulafungin, and micafungin MICs of SC5314 are, correspondingly, 0.06 mg/L, 0.06 mg/L, and 0.015 mg/L [28]. Each of the 15 Ch2 and Ch5 genes was compared to the corresponding genes in SC5314 (Section 2). In a comparison of expression changes across all isolates, we found that any Ch2 or Ch5 gene may vary. In several isolates, we observed changes in concert with either all 5 Ch2 genes or all 10 Ch5 genes.
Strikingly, we found that expression patterns of highly susceptible isolates (Figure 1) showed more similarity. Also, there was more similarity of expression patterns within two other groups: isolates with decreased susceptibility and clinical resistant isolates (Figure 2 and Figure 3). Relative gene expression in highly susceptible isolates, including clinically important FKS1, is predominantly decreased or, in few instances, the same or higher, as compared to corresponding genes in the control strain (Figure 1). In contrast, relative gene expression in less susceptible isolates and in clinically resistant isolates are either decreased or increased (Figure 2 and Figure 3). Most importantly, in contrast to highly susceptible isolates, these patterns have a prominent feature of upregulation of CHT2 (org19.3895) and FKS1. CHT2 encodes a GPI-anchored chitinase involved in the hydrolysis of cell wall chitin, and its protein acts as a negative regulator of ECN susceptibility [18]. Interestingly, CHT2 is also upregulated in C. albicans cells grown as biofilm in the presence of the bacterium Streptococcus mutans [31]. Also important to this study is that CHT2 is repressed in the core caspofungin response [32,33]. Clarification of the CHT2 role needs further study. Regarding FKS1, we believe that its upregulation contributes to cell wall remodeling and subsequently to decreased drug susceptibility [18]. Overall, two genes that control the amount of two major components of the cell wall, chitin (CHT2) and glucan (FKS1), are overexpressed in strains with less susceptible genetic backgrounds in striking contrast with highly susceptible isolates. Overall, the gene expression pattern of isolates that are less susceptible resembles the patterns observed with FKS-mediated resistant isolates (Figure 2 and Figure 3).
In conclusion, there is a substantial difference between the genetic backgrounds of highly ECN drug-susceptible isolates and isolates with decreased ECN susceptibility, as well as clinically resistant isolates. All 15 genes on Ch2 and Ch5 that contribute to modulating ECN drug susceptibility are actively regulated in isolates with less ECN susceptible background and in clinically resistant isolates. Our data further the narrative that isolates with less ECN susceptible background and no FKS1 mutation likely contribute to the evolution of clinically resistant isolates with mutation to resistance in FKS1. Finally, our data validate our caspofungin-adapted model mutants by showing that genes identified in the in vitro model system have relevance in clinical isolates.

Supplementary Materials

The following supporting information can be downloaded at: https://www.mdpi.com/2309-608X/10/3/224/s1. Table S1: List of primers used in qPCR. Figure S1: Patterns of relative gene expression in clinical isolates DPL253, DPL255, DPL258, DPL263 and DPL266 that are highly susceptible to echinocandins (see Table 2). Gene expressions were measured with qPCR, normalized against ACT1 and compared to the corresponding genes of the reference strain SC5314 in which expressions were considered 100%. Shown is the average of three independent experiments ± standard deviations. Note that FKS3 was not detected in DPL263. The asterisks indicate p value of <0.05 (*), <0.01 (**) or <0.001 (***), as determined using Student’s t test. The graph was prepared using GraphPad Prism (9.5.0). Figure S2: Patterns of relative gene expression in clinical isolates DPL225, DPL291 and DPL1000 that are less susceptible to echinocandins (see Table 2). The asterisks indicate p value of <0.05 (*), <0.01 (**) or <0.001 (***), as determined using Student’s t test. The graph was prepared using GraphPad Prism (9.5.0). For more details, see legend of Figure S1. Figure S3: Patterns of relative gene expression in clinically resistant isolates DPL15, DPL1009 and DPL1008 (see Table 2). The asterisks indicate p value of <0.05 (*), <0.01 (**) or <0.001 (***), as determined using Student’s t test. The graph was prepared using GraphPad Prism (9.5.0). For more details, see legend of Figure S1.

Author Contributions

Conceptualization, S.K.S., A.Y. and E.R. Methodology, S.K.S. and A.Y. Investigation, S.K.S., A.Y. and D.S.P. Visualization, A.Y. Funding acquisition, E.R. Supervision, E.R. Writing—original draft, S.K.S., A.Y. and E.R. Writing—review and editing, S.K.S., A.Y., E.R. and D.S.P. All authors have read and agreed to the published version of the manuscript.

Funding

This work was supported by the National Institutes of Health grant R01AI141884 to ER. DSP is partially supported by NIH grant R01AI109025.

Institutional Review Board Statement

Not applicable.

Informed Consent Statement

Not applicable.

Data Availability Statement

Data are contained within the article and Supplementary Materials.

Conflicts of Interest

The authors declare no conflict of interest.

Correction Statement

This article has been republished with a minor correction to resolve spelling and grammatical errors. This change does not affect the scientific content of the article.

References

  1. Whaley, S.G.; Berkow, E.L.; Rybak, J.M.; Nishimoto, A.T.; Barker, K.S.; Rogers, P.D. Azole antifungal resistance in Candida albicans and emerging non-albicans Candida species. Front. Microbiol. 2017, 7, 2173. [Google Scholar] [CrossRef]
  2. Heredia, M.Y.; Gunasekaran, D.; Ikeh, M.A.C.; Nobile, C.J.; Rauceo, J.M. Transcriptional regulation of the caspofungin-induced cell wall damage response in Candida albicans. Curr. Genet. 2020, 66, 1059–1068. [Google Scholar] [CrossRef]
  3. Robbins, N.; Cowen, L.E. Antifungal drug resistance: Deciphering the mechanisms governing multidrug resistance in the fungal pathogen Candida glabrata. Curr. Biol. 2021, 31, R1520–R1523. [Google Scholar] [CrossRef]
  4. Pristov, K.E.; Ghannoum, M.A. Resistance of Candida to azoles and echinocandins worldwide. Clin. Microbiol. Infect. 2019, 25, 792–798. [Google Scholar] [CrossRef]
  5. Lee, Y.; Puumala, E.; Robbins, N.; Cowen, L.E. Antifungal drug resistance: Molecular mechanisms in Candida albicans and Beyond. Chem. Rev. 2020, 121, 3390–3411. [Google Scholar] [CrossRef] [PubMed]
  6. Lee, Y.; Robbins, N.; Cowen, L.E. Molecular mechanisms governing antifungal drug resistance. NPJ Antimicrob. Resist. 2023, 1, 5. [Google Scholar] [CrossRef]
  7. Perlin, D.S. Echinocandin resistance, susceptibility testing and prophylaxis: Implications for patient management. Drugs 2014, 74, 1573–1585. [Google Scholar] [CrossRef] [PubMed]
  8. Thompson, G.R.; Soriano, A.; Honore, P.M.; Bassetti, M.; Cornely, O.A.; Kollef, M.; Kullberg, B.J.; Pullman, J.; Hites, M.; Fortún, J.; et al. Efficacy and safety of rezafungin and caspofungin in candidaemia and invasive candidiasis: Pooled data from two prospective randomised controlled trials. Lancet Infect. Dis. 2024, 24, 319–328. [Google Scholar] [CrossRef] [PubMed]
  9. Klis, F.M.; De Groot, P.; Hellingwerf, K. Molecular organization of the cell wall of Candida albicans. Med. Mycol. 2001, 39 (Suppl. 1), 1–8. [Google Scholar] [CrossRef] [PubMed]
  10. Onishi, J.; Meinz, M.; Thompson, J.; Curotto, J.; Dreikorn, S.; Rosenbach, M.; Douglas, C.; Abruzzo, G.; Flattery, A.; Kong, L.; et al. Discovery of novel antifungal (1,3)-beta-D-glucan synthase inhibitors. Antimicrob. Agents Chemother. 2000, 44, 368–377. [Google Scholar] [CrossRef] [PubMed]
  11. Szymański, M.; Chmielewska, S.; Czyżewska, U.; Malinowska, M.; Tylicki, A. Echinocandins—Structure, mechanism of action and use in antifungal therapy. J. Enzym. Inhib. Med. Chem. 2022, 37, 876–894. [Google Scholar] [CrossRef] [PubMed]
  12. Perlin, D.S. Mechanisms of echinocandin antifungal drug resistance. Ann. N. Y. Acad. Sci. 2015, 1354, 1–11. [Google Scholar] [CrossRef]
  13. Lackner, M.; Tscherner, M.; Schaller, M.; Kuchler, K.; Mair, C.; Sartori, B.; Istel, F.; Arendrup, M.C.; Lass-Flörl, C. Positions and numbers of FKS mutations in Candida albicans selectively influence in vitro and in vivo susceptibilities to echinocandin treatment. Antimicrob. Agents Chemother. 2014, 58, 3626–3635. [Google Scholar] [CrossRef]
  14. Garcia-Effron, G.; Park, S.; Perlin, D.S. Correlating echinocandin mic and kinetic inhibition of fks1 mutant glucan synthases for Candida albicans: Implications for interpretive breakpoints. Antimicrob. Agents Chemother. 2009, 53, 112–122. [Google Scholar] [CrossRef] [PubMed]
  15. Beyda, N.D.; Lewis, R.E.; Garey, K.W. Echinocandin resistance in Candida species: Mechanisms of reduced susceptibility and therapeutic approaches. Ann. Pharmacother. 2012, 46, 1086–1096. [Google Scholar] [CrossRef] [PubMed]
  16. Shapiro, R.S.; Robbins, N.; Cowen, L.E. Regulatory circuitry governing fungal development, drug resistance, and disease. Microbiol. Mol. Biol. Rev. 2011, 75, 213–267. [Google Scholar] [CrossRef] [PubMed]
  17. Suwunnakorn, S.; Wakabayashi, H.; Kordalewska, M.; Perlin, D.S.; Rustchenko, E. FKS2 and FKS3 genes of opportunistic human pathogen Candida albicans influence echinocandin susceptibility. Antimicrob. Agents Chemother. 2018, 62, e02299-17. [Google Scholar] [CrossRef]
  18. Sah, S.K.; Yadav, A.; Kruppa, M.D.; Rustchenko, E. Identification of 10 genes on Candida albicans chromosome 5 that control surface exposure of the immunogenic cell wall epitope β-glucan and cell wall remodeling in caspofungin-adapted mutants. Microbiol. Spectr. 2023, 11, e0329523. [Google Scholar] [CrossRef]
  19. Castanheira, M.; Woosley, L.N.; Diekema, D.J.; Messer, S.A.; Jones, R.N.; Pfaller, M.A. Low prevalence of fks1 hot spot 1 mutations in a worldwide collection of Candida strains. Antimicrob. Agents Chemother. 2010, 54, 2655–2659. [Google Scholar] [CrossRef]
  20. Desnos-Ollivier, M.; Bretagne, S.; Raoux, D.; Hoinard, D.; Dromer, F.; Dannaoui, E. Mutations in the fks1 gene in Candida albicans, C. tropicalis, and C. krusei correlate with elevated caspofungin MICs uncovered in AM3 medium using the method of the European Committee on Antibiotic Susceptibility Testing. Antimicrob. Agents Chemother. 2008, 52, 3092–3098. [Google Scholar] [CrossRef]
  21. Pham, C.D.; Iqbal, N.; Bolden, C.B.; Kuykendall, R.J.; Harrison, L.H.; Farley, M.M.; Schaffner, W.; Beldavs, Z.G.; Chiller, T.M.; Park, B.J.; et al. Role of FKS Mutations in Candida glabrata: MIC values, echinocandin resistance, and multidrug resistance. Antimicrob. Agents Chemother. 2014, 58, 4690–4696. [Google Scholar] [CrossRef] [PubMed]
  22. Singh-Babak, S.D.; Babak, T.; Diezmann, S.; Hill, J.A.; Xie, J.L.; Chen, Y.-L.; Poutanen, S.M.; Rennie, R.P.; Heitman, J.; Cowen, L.E. Global analysis of the evolution and mechanism of echinocandin resistance in Candida glabrata. PLoS Pathog. 2012, 8, e1002718. [Google Scholar] [CrossRef] [PubMed]
  23. Arastehfar, A.; Lass-Flörl, C.; Garcia-Rubio, R.; Daneshnia, F.F.; Ilkit, M.; Boekhout, T.; Gabaldon, T.; Perlin, D.S. The quiet and underappreciated rise of drug-resistant invasive fungal pathogens. J. Fungi 2020, 6, 138. [Google Scholar] [CrossRef] [PubMed]
  24. Rustchenko-Bulgac, E.P. Variations of Candida albicans electrophoretic karyotypes. J. Bacteriol. 1991, 173, 6586–6596. [Google Scholar] [CrossRef] [PubMed]
  25. Rustchenko, E. Chromosome instability in Candida albicans. FEMS Yeast Res. 2007, 7, 2–11. [Google Scholar] [CrossRef]
  26. Clinical and Laboratory Standards Institute. Reference Method for Broth Dilution Antifungal Susceptibility Testing of Yeasts, 4th ed.; CLSI Standard M27; Clinical and Laboratory Standards Institute: Wayne, PA, USA, 2017. [Google Scholar]
  27. Nailis, H.; Coenye, T.; Van Nieuwerburgh, F.; Deforce, D.; Nelis, H.J. Development and evaluation of different normalization strategies for gene expression studies in Candida albicans biofilms by real-time PCR. BMC Mol. Biol. 2006, 7, 25. [Google Scholar] [CrossRef]
  28. Husain, F.; Yadav, A.; Sah, S.K.; Hayes, J.J.; Rustchenko, E. Candida albicans strains adapted to caspofungin due to aneuploidy become highly tolerant under continued drug pressure. Microorganisms 2022, 11, 23. [Google Scholar] [CrossRef]
  29. Pfaffl, M.W. A new mathematical model for relative quantification in real-time RT-PCR. Nucleic Acids Res. 2001, 29, e45. [Google Scholar] [CrossRef]
  30. Yang, F.; Zhang, L.; Wakabayashi, H.; Myers, J.; Jiang, Y.; Cao, Y.; Jimenez-Ortigosa, C.; Perlin, D.S.; Rustchenko, E. Tolerance to caspofungin in Candida albicans is associated with at least three distinctive mechanisms that govern expression of FKS genes and cell wall remodeling. Antimicrob. Agents Chemother. 2017, 61, e00071-17. [Google Scholar] [CrossRef]
  31. Zeng, Y.; Rustchenko, E.; Huang, X.; Wu, T.T.; Falsetta, M.L.; Xiao, J. Dual transcriptome of Streptococcus mutans and Candida albicans interplay in biofilms. J. Oral Microbiol. 2022, 15, 2144047. [Google Scholar] [CrossRef]
  32. Liu, T.T.; Lee, R.E.B.; Barker, K.S.; Wei, L.; Homayouni, R.; Rogers, P.D. Genome-wide expression profiling of the response to azole, polyene, echinocandin, and pyrimidine antifungal agents in Candida albicans. Antimicrob. Agents Chemother. 2005, 49, 2226–2236. [Google Scholar] [CrossRef] [PubMed]
  33. Bruno, V.M.; Kalachikov, S.; Subaran, R.; Nobile, C.J.; Kyratsous, C.; Mitchell, A.P. Control of the C. albicans cell wall damage response by transcriptional regulator Cas5. PLoS Pathog. 2006, 2, e21. [Google Scholar] [CrossRef] [PubMed]
Figure 1. Patterns of relative gene expression in clinical isolates DPL253, DPL255, DPL258, DPL263, and DPL266 that are highly susceptible to echinocandins (see Table 2). Gene expressions were measured with qPCR, normalized against ACT1, and compared to the corresponding genes of the reference strain SC5314, in which expressions were considered 100%. Shown is the average of three independent experiments ± standard deviations. Only genes with significant changes are presented as bars. See Supplementary Materials for bar graphs, including both significant and nonsignificant data. The asterisks indicate a p value of <0.05 (*), <0.01 (**), or <0.001 (***), as determined using Student’s t-test. The graph was prepared using GraphPad Prism (9.5.0).
Jof 10 00224 g001
Figure 2. Patterns of relative gene expression in clinical isolates DPL225, DPL291, and DPL1000 that are less susceptible to echinocandins (see Table 2). The asterisks indicate a p value of <0.05 (*), <0.01 (**), or <0.001 (***), as determined using Student’s t-test. The graph was prepared using GraphPad Prism (9.5.0). For more details, see legend of Figure 1.
Jof 10 00224 g002
Figure 3. Patterns of relative gene expression in clinically resistant isolates DPL15, DPL1009, and DPL1008 (see Table 2). The asterisks indicate a p value of <0.05 (*), <0.01 (**), or <0.001 (***), as determined using Student’s t-test. The graph was prepared using GraphPad Prism (9.5.0). For more details, see legend of Figure 1.
Jof 10 00224 g003
Table 1. List of genes analyzed in this study *.
Standard Name Assembly 19/21 Identifier
Genes on chromosome 2
ECS1orf19.1766
ECS2orf19.6867
ECS3orf19.5833
PR26orf19.5793
LEU42orf19.1375
Genes on chromosome 5
CHT2orf19.3895
URA7orf19.3941
RPO26orf19.2643
HAS1orf19.3962
DUS4orf19.966
RPS25Borf19.6663
UAP1orf19.4265
CKS1orf19.1282
orf19.4149.1
orf19.970
FKS genes
FKS1orf19.2929
FKS2orf19.3269
FKS3orf19.2495
* For more information about Ch2 and Ch5 genes, see [18]. For more information about FKS genes, see [17].
Table 2. List of clinical isolates used in this study. Also shown are MIC values of three ECNs: caspofungin (CAS), micafungin (MFG), and anidulafungin (ANI).
StrainFKS1 Mutation to ResistanceMIC (mg/L)
CASMFGANI
Highly ECN susceptible isolates (low MIC values)
DPL253none<0.06<0.06<0.03
DPL255Same as above<0.03<0.03<0.03
DPL258Same as above0.030.0150.03
DPL263Same as above<0.06<0.06<0.03
DPL266Same as above0.0150.0150.015
Less ECN susceptible isolates (elevated MIC values)
DPL225Same as above0.120.120.12
DPL291Same as above0.10.10.08
DPL1000Same as above0.400.050.08
Clinically resistant isolates (high MIC values)
DPL15F641S4.00.51.0
DPL1009S645Y4.04.02.0
DPL1008S645P8.04.01.26
Disclaimer/Publisher’s Note: The statements, opinions and data contained in all publications are solely those of the individual author(s) and contributor(s) and not of MDPI and/or the editor(s). MDPI and/or the editor(s) disclaim responsibility for any injury to people or property resulting from any ideas, methods, instructions or products referred to in the content.

