Article

Role of Volatiles from the Endophytic Fungus Trichoderma asperelloides PSU-P1 in Biocontrol Potential and in Promoting the Plant Growth of Arabidopsis thaliana

1
Ratchaburi Campus, King Mongkut’s University of Technology Thonburi, Ratchaburi 70150, Thailand
2
Department of Biology, Faculty of Science, Chiang Mai University, Chiang Mai 50200, Thailand
3
Research Center of Microbial Diversity and Sustainable Utilization, Chiang Mai University, Chiang Mai 50200, Thailand
4
Department of Biological and Environmental Sciences, Graduate School of Science and Technology for Innovation, Yamaguchi University, Yamaguchi 753-8515, Japan
5
Research Center for Thermotolerant Microbial Resources (RCTMR), Yamaguchi University, Yamaguchi 753-8515, Japan
6
Department of Biological Chemistry, Graduate School of Science and Technology for Innovation, Yamaguchi University, Yamaguchi 753-8515, Japan
7
Department of Agronomy, Faculty of Agriculture at Kamphaeng Saen, Kasetsart University Kamphaeng Saen Campus, Nakhon Pathom 73140, Thailand
8
Agricultural Innovation and Management Division, Faculty of Natural Resources, Prince of Songkla University, Hatyai, Songkhla 90112, Thailand
*
Author to whom correspondence should be addressed.
J. Fungi 2020, 6(4), 341; https://doi.org/10.3390/jof6040341
Submission received: 16 November 2020 / Revised: 1 December 2020 / Accepted: 3 December 2020 / Published: 6 December 2020
(This article belongs to the Special Issue Exploiting Fungal Solutions for Today's Challenges)

Abstract

:
Fungal volatile organic compounds (VOCs) emitted by Trichoderma species interact with a plant host and display multifaceted mechanisms. In this study, we investigated the antifungal activity of VOCs emitted by Trichoderma asperelloides PSU-P1 against fungal pathogens, as well as the ability of VOCs to activate defense responses and to promote plant growth in Arabidopsis thaliana. The strain’s VOCs had remarkable antifungal activity against fungal pathogens, with an inhibition range of 15.92–84.95% in a volatile antifungal bioassay. The VOCs of T. asperelloides PSU-P1 promoted the plant growth of A. thaliana, thereby increasing the fresh weight, root length, and chlorophyll content in the VOC-treated A. thaliana relative to those of the control. High expression levels of the chitinase (CHI) and β-1,3-glucanase (GLU) genes were found in the VOC-treated A. thaliana by quantitative reverse transcription polymerase chain reaction (RT-PCR). The VOC-treated A. thaliana had higher defense-related enzyme (peroxidase (POD)) and cell wall-degrading enzyme (chitinase and β-1,3-glucanase) activity than in the control. The headspace VOCs produced by PSU-P1, trapped with solid phase microextraction, and tentatively identified by gas chromatography–mass spectrometry, included 2-methyl-1-butanol, 2-pentylfuran, acetic acid, and 6-pentyl-2H-pyran-2-one (6-PP). The results suggest that T. asperelloides PSU-P1 emits VOCs responsible for antifungal activity, for promoting plant growth, and for inducing defense responses in A. thaliana.

1. Introduction

Trichoderma species are widely considered potential biological control agents (BCAs) against several plant diseases due to their unique characteristics. For instance, they can produce bioactive secondary metabolites [1], compete for nutrients and space [2,3], induce plant defensive mechanisms [2,4,5], and promote plant growth [6]. They also feature mechanisms such as antibiosis by producing extracellular cell wall-degrading enzymes [3,7] and mycoparasitism [8]. Such abilities allow to use Trichoderma species as BCAs in agriculture for controlling plant diseases and for promoting plant growth [9].
Trichoderma species have been reported as endophytes due to their ability to colonize internal plant tissues. For instance, Trichoderma species have been shown to persist within a plant’s roots and in above-ground tissues through endophytic associations [10]. Endophytes are known as sources of novel biological benefits to their host plants [11]. The combination of antibiosis, a widespread mechanism used by Trichoderma species, and the endophytic relationship plays an important role in defense against several pathogens by releasing metabolites that act as antifungal compounds [1].
The metabolites known as volatile organic compounds (VOCs) released from endophytic Trichoderma species are of high interest, and may benefit the host plant by contributing additional defenses against pathogens [2,4,12]. The properties of VOCs include a low boiling point, a low molecular mass, and a high vapor pressure [13]. Such ability to produce VOCs is found in plants [14] and in microorganisms [15]. Recent publications have shown that the VOCs released by Trichoderma display antifungal activities [1,4,6] and promote plant growth [16].
Trichoderma asperelloides has been used as a biocontrol agent of Sclerotinia sclerotiorum [17]. However, the ability of the VOCs emitted by T. asperelloides PSU-P1 to contribute to antifungal activity and to promote plant growth has not yet been clarified. Therefore, this research aimed to demonstrate that the VOCs of T. asperelloides PSU-P1 are major factors in the antifungal activity against fungal disease pathogens and in the promotion of the growth of the plant model Arabidopsis thaliana.

2. Materials and Methods

2.1. Trichoderma Species and Pathogen Sources

The endophytic fungus T. asperelloides PSU-P1 [18] was used in this study. Fungal pathogens causing emerging diseases that have recently been reported in Thailand were obtained from the Culture Collection of Pest Management, Faculty of Natural Resources, Prince of Songkla University, Thailand. A list of the microorganisms used in this study is provided in Table 1. T. asperelloides PSU-P1 and the pathogens were cultured on potato dextrose agar (PDA) (HiMedia, Mumbai, India) for 3 days at 28 ± 2 °C before use in this study.

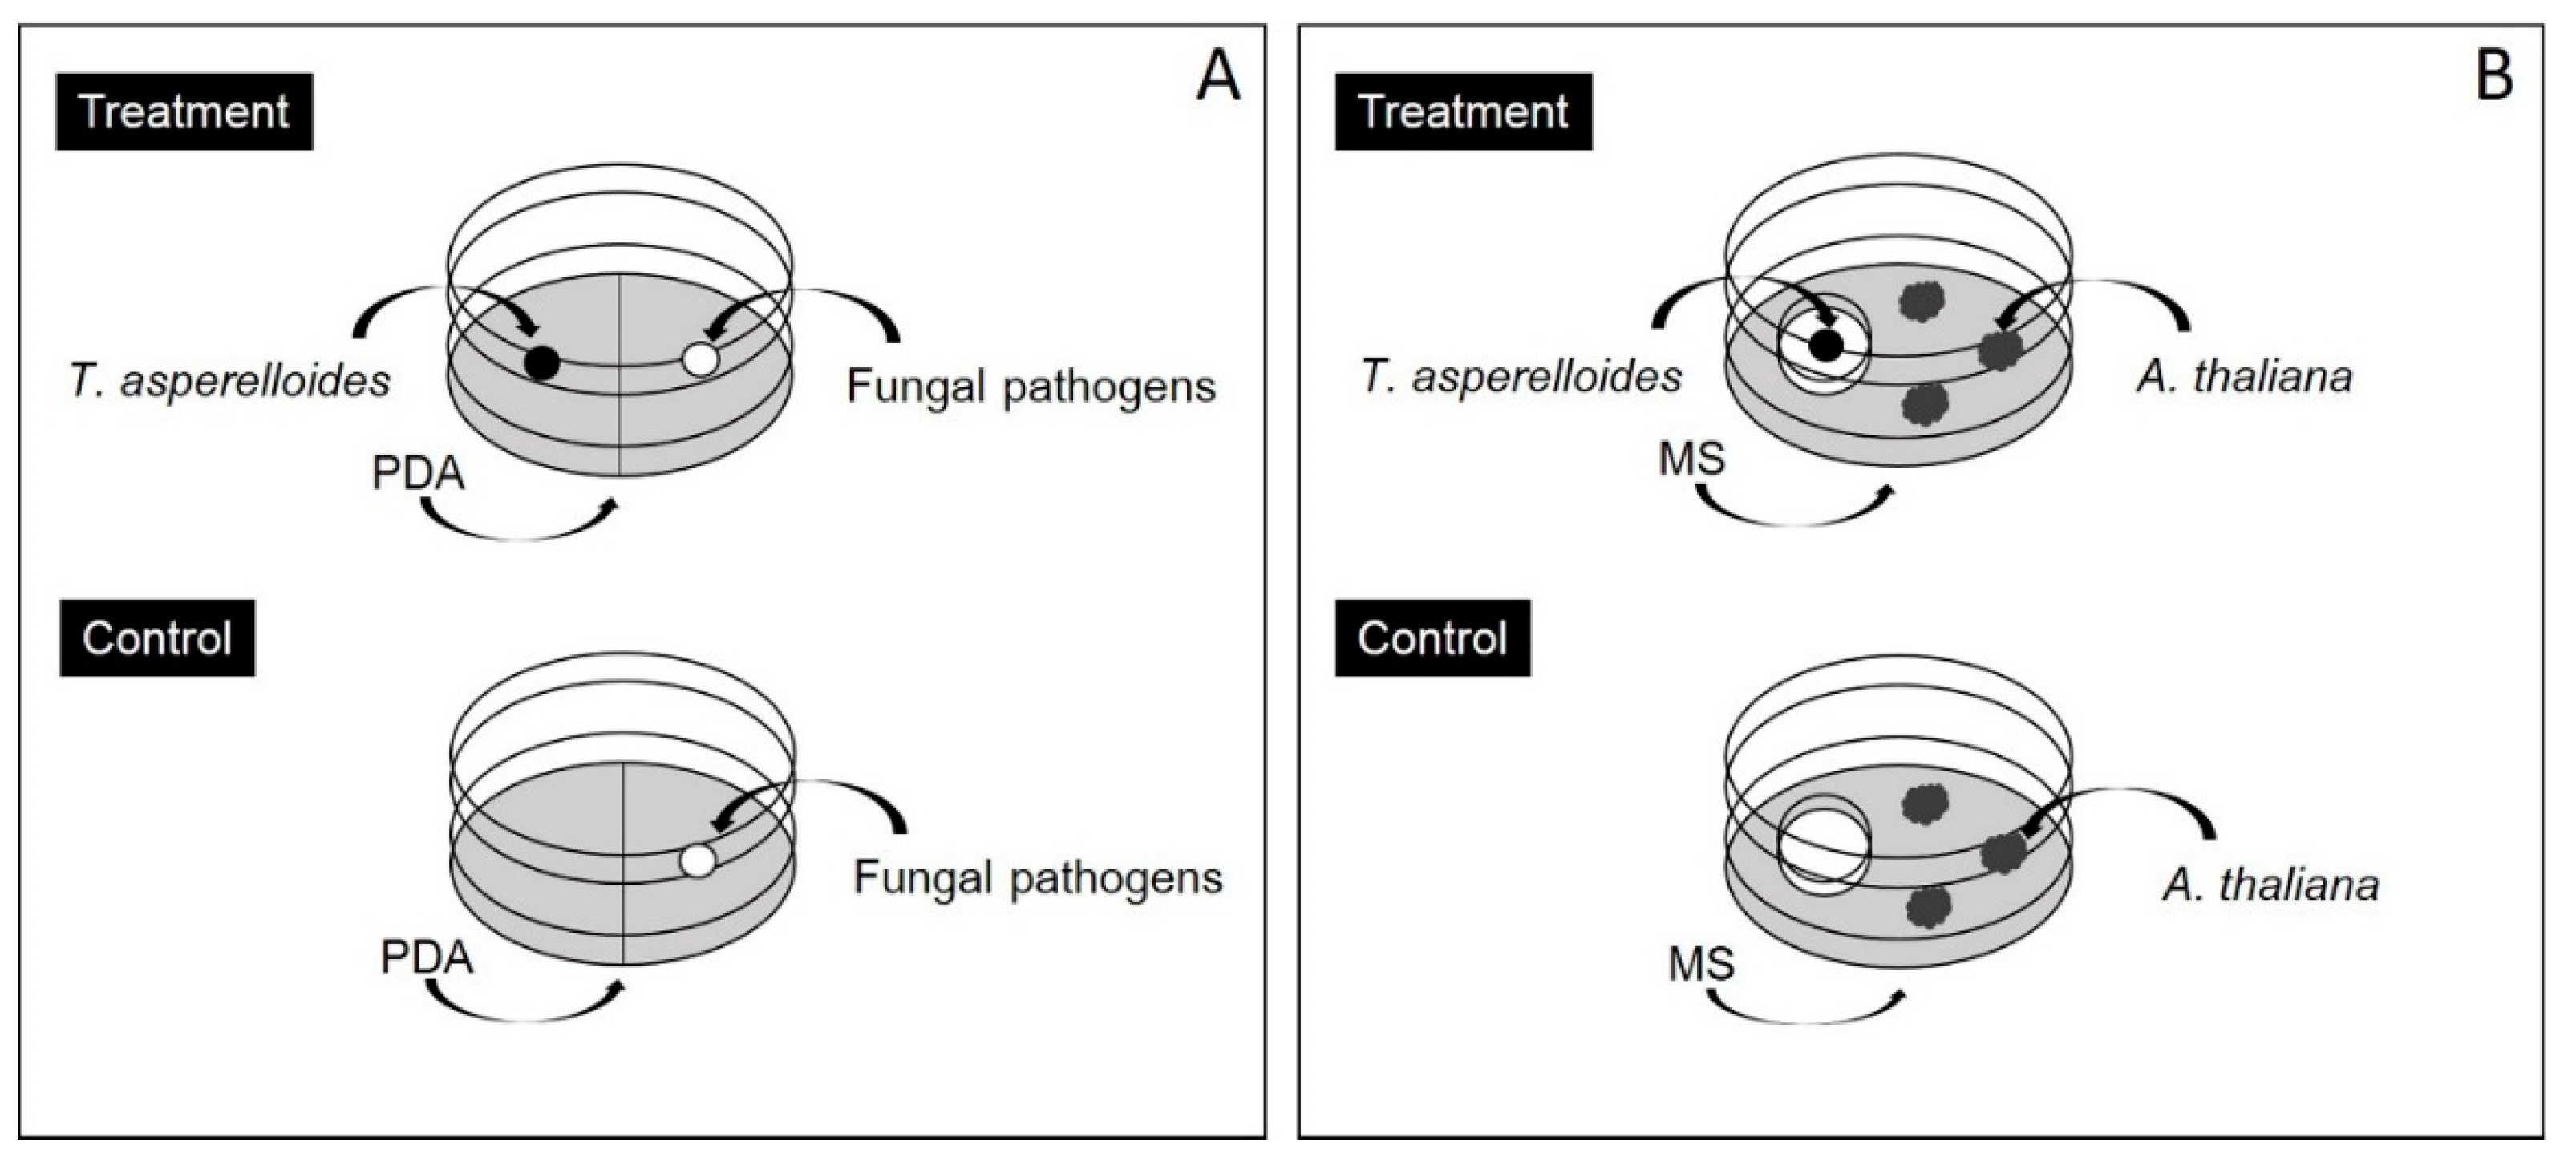
2.2. Volatile Antifungal Bioassay

The antifungal activity of the volatiles emitted by T. asperelloides PSU-P1 was assessed by using a volatile antifungal bioassay, as previously described by Dennis and Webster [25] with some modifications. T. asperelloides PSU-P1 and the pathogens were grown on PDA for 5 days. The study was performed in two-room plates, 9 cm in diameter (BIOMED, Bangkok, Thailand). The plates had agar plugs (0.5 cm in diameter) cut from stock cultures placed on one side of culture plate, whereas the other side had agar plugs of pathogens (Figure 1A). The plates were taped with parafilm and incubated at 28 ± 2 °C for 5 days. For the control cases, an agar plug of each pathogen was placed on PDA on one side of culture plate, while the other side contained PDA alone. The experiments were set up in triplicate and repeated twice. The fungal growth of tested fungi was measured as colony diameters and the percentage of inhibition was calculated by:
Percent   inhibition ( % ) = D c D t D c × 100 ,
where Dc is the colony diameter of the pathogen in the control and Dt is the colony diameter of the pathogen in the treatment [26].

2.3. Plant and Growth Conditions

A. thaliana ecotype Columbia seeds were surface-disinfected with 70% ethyl alcohol and 0.5% sodium hypochlorite (NaOCl). The seeds were rinsed with sterile distilled water (DW) to remove excess NaOCl and air-dried on sterile paper in a laminar air flow cabinet. A total of eight seeds were placed on Murashike and Skoog (MS) medium (HiMedia, Mumbai, India) [27] in a plastic 9 cm Petri dish. The cell culture plates were then incubated in a TOMY CLE-303 Cultivation Chamber (TOMY Seiko, Tokyo, Japan) maintained at 60 ± 2% relative humidity (RH) and 22 ± 2 °C with a light/dark photoperiod of 16:8 for 14 days.

2.4. Volatile Exposure Bioassay

To test the effect of Trichoderma VOCs on A. thaliana growth, an experiment was conducted using cell culture plates (BIOMED, Bangkok, Thailand), as shown in Figure 1B. The outside culture plate contained MS medium for culturing A. thaliana seeds (8 seeds), whereas the inside culture plate contained PDA for culturing T. asperelloides PSU-P1. Both the A. thaliana seeds and the T. asperelloides PSU-P1 were grown in a shared atmosphere on the culture plate and incubated in a growth chamber as described in Section 2.3. The wells without Trichoderma inoculation (PDA alone) served as the control. The experiments were set up in triplicate and repeated twice. At the end of the VOC exposure periods, the A. thaliana plants were removed from the exposure conditions and subjected to phenotypic characterization (fresh weight and root length) and to enzyme assays.

2.5. Plant Chlorophyll Measurements

Total chlorophyll (Chl) content was measured according to the method previously described by Moran [28] and Kaewsuksaeng et al. [29] with some modifications. Whole plant tissues of A. thaliana were subjected to total chlorophyll extraction. The shoots of A. thaliana (0.5 g) were submerged in N,N-dimethylformamide overnight at 4 °C. The total chlorophyll content in the extracts was determined using a UV-2000 Spectrophotometer (Hitachi, Tokyo, Japan). The total chlorophyll content was calculated as:
Chl a (µg mL−1) = 12.64 OD664 − 2.99 OD647,
Chl b (µg mL−1) = −5.60 OD664 + 23.26 A647,
Chl a (mg 100 g FW) = Chl a (µg mL−1) × 20.5 × 100/0.5 × 1/1000,
Chl b (mg 100 g FW) = Chl b (µg mL−1) × 20.5 × 100/0.5 × 1/1000,
where A664 is the absorbance at 664 nm and A647 is the absorbance at 647 nm.

2.6. RNA Extraction and Quantitative Reverse Transcription PCR Analysis

After 3 days of the VOC treatment, whole Arabidopsis from 20 plants were subjected to RNA extraction by Trizol reagent (ThermoFisher, Waltham, MA, USA) according to the manufacturer’s instructions. The total RNA was collected, air-dried, and dissolved in RNase-free DW Approximately 1 μg of total RNA was reverse-transcribed to single-strand cDNA and subjected to quantitative reverse transcription PCR (qRT-PCR) as previously described by Dumhai et al. [30]. The qRT-PCR reactions were performed using the iScript One-Step RT-PCR reagent with SYBR Green (Bio-Rad, Hercules, CA, USA) containing 1 ng of total RNA as the template. The actin gene (ACT) forward primer was used as an internal reference gene to normalize the variations of input total cDNA templates between the control and VOC-treated samples. The gene-specific primers of chitinase (CHI), β-1,3-glucanase (GLU), and peroxidase (POD) used in this study are shown in Table 2. The relative gene expression was analyzed by Bio-Rad CFX Manager analysis software (Bio-Rad, Hercules, CA, USA) to determine fold changes in expression relative to actin as a control.

2.7. Enzyme Assay

We hypothesized that plants exposed to fungal VOCs may have activated defense responses, so the enzyme activities of the VOC-treated A. thaliana were compared to those of the untreated plants (control). Crude protein extraction from the VOC-treated and untreated plants was conducted with potassium phosphate buffer (KPB) at pH 6.0 for peroxidase [3] and at pH 7.0 for chitinase and β-1,3-glucanase assays [31]. The extracted A. thaliana plants were then centrifuged at 14,000× g for 20 min at 4 °C, and the supernatants were then collected and used immediately for the enzyme assays.
The activity of peroxidase was determined following Vetter et al. [32] with some modifications. O-phenylenediamine (OPDA) at a concentration of 1% was used as the substrate in the peroxidase assay. After adding 0.1 mL of 0.3% H2O2 for 10 min, the increase in absorbance at 430 nm was measured with a UV/VIS spectrophotometer UV5300 (METASH, Shanghai, China) and the peroxidase activity is expressed as ΔA 430 U mL−1. The chitinase and β-1,3-glucanase activities were determined using the 3,5-dinitrosalicylic acid (DNS) method [33]. Reaction mixtures containing colloidal chitin or laminarin (Sigma Aldrich, Saint Louis, MO, USA) were used as the substrate in the chitinase or β-1,3-glucanase assay, respectively. The reducing sugar released in the test reaction mixtures was measured with the UV5300 UV/VIS spectrophotometer at 550 nm and at 575 nm for β-1,3-glucanase and chitinase, respectively. Each enzyme was assayed in three replicates from two repeats.

2.8. Gas Chromatography-Mass Spectrometryanalysis

T. asperelloides PSU-P1 was cultured on PDA incubated at 28 ± 2 °C for 5 days. Solid phase microextraction (SPME) was conducted to collect the VOCs produced by T. asperelloides PSU-P1 according to the method previously described by Suwannarach et al. [34]. SPME fiber was exposed to the vapor phase above T. asperelloides PSU-P1 for 45 min in a culture tube. Then, the adsorbent fiber was inserted into the injection port of the gas chromatograph GC 2010 (Shimadzu, Kyoto, Japan) equipped with a DB-Wax capillary column (0.25 mm × 30 m I.D., 0.25 µm in film thickness; Supelco, Sigma Aldrich, Saint Louis, MO, USA). The column temperature was programmed at an initial temperature of 40 °C for 2 min, and was then increased at a rate of 5 °C min−1 to a final temperature of 200 °C. Purified helium was used as the carrier gas at an initial column head pressure of 60 kPa. The fiber was desorbed at 250 °C for 57 min under a flow of helium gas prior to trapping the VOCs. A 30 s injection time was used to introduce the adsorbed VOCs into the gas chromatograph (GC) interfaced with a mass spectrometer, i.e., MS-QP2010 (Shimadzu, Kyoto, Japan). The mass spectrometer was operated at unit mass resolution. Data acquisition and data processing were conducted by the software system. The VOCs produced by T. asperelloides PSU-P1 were tentatively identified through computer searches of the National Institute of Standards and Technology (NIST, v17, 2014) Mass Spectral Library Search Chromatogram.

2.9. Effect of Commercial VOCs on the Antifungal Activity, Defense Responses, and Growth of A. thaliana

Each commercial volatile compound, namely, acetic acid, 2-methyl-1-butanol (Sigma Aldrich, Saint Louis, MO, USA), 2-pentylfuran (Sigma Aldrich, Saint Louis, MO, USA), and 6-pentyl-2H-pyran-2-one (6-PP) (Sigma Aldrich, Saint Louis, MO, USA), was used for the antifungal bioassay, enzyme assay, and phenotypic measurements. Each volatile compound was diluted as 10−3 (v/v or w/v) and 10 µL was applied in a sterile cotton pad [4,35] exposed to A. thaliana instead of culturing T. asperelloides PSU-P1, similar to the method in Section 2.4. The phenotypic characteristics were measured according to the method in Section 2.4. An enzyme assay was conducted to verify the enzyme activity between the control and treatment, as shown in Section 2.7.

2.10. Statistical Analysis

The results on the antifungal activity, chlorophyll content, enzyme activity, and plant growth were subjected to one-way analysis of variance (ANOVA). Tukey’s test and Student’s t-test were used to determine statistically significant differences between the treated samples and untreated control [36].

3. Results

3.1. VOCs Emitted by T. asperelloides PSU-P1 Inhibit Fungal Growth

After incubating the test plates of fungal pathogens (Figure 2) with the VOCs emitted from T. asperelloides PSU-P1 for four days, the colony diameters of all fungal growth in the test plates were significantly smaller than those of control plates (p < 0.05). The percent inhibition of the fungal pathogens ranged from 15.92% to 84.95% (Figure 2). The results show that the VOCs of T. asperelloides PSU-P1 inhibited the fungal growth of Ganoderma sp. with the highest percent inhibition (84.95%), whereas the lowest inhibition was found for S. rolfsii (15.92%).

3.2. VOCs Emitted by T. asperelloides PSU-P1 Increase Growth in A. thaliana

After seven days of exposure, the A. thaliana plants were collected for measurement of fresh weight, root length, and total chlorophyll content. In the presence of the VOCs from T. asperelloides PSU-P1, there were significant increases in fresh weight, root length, and total chlorophyll content (Figure 3 and Figure 4). The fresh weight of control and treated plants was 3.93 ± 1.01 mg and 5.05 ± 1.15 mg, respectively (Figure 3A). The root length of control and treated plants was 16.90 ± 2.33 mm and 20.80 ± 1.81 mm, respectively (Figure 3B,D). The VOCs of T. asperelloides PSU-P1 also increased the total chlorophyll content (Figure 4). Chlorophyll a was 13.24 ± 0.11 mg g−1 fresh weight (FW) for the control plants and 18.68 ± 0.06 mg g−1 FW for the treated plants. Chlorophyll b content was 3.61 ± 0.21 mg g−1 FW for the control plants and 5.33 ± 0.14 mg g−1 FW for the treated plants.

3.3. VOCs Induce Gene Expression of Defense-Related Genes

To examine the role of VOCs in inducing defense responses in A. thaliana, the expressions of defense-related genes (CHI, GLU, and POD) were analyzed by qRT-PCR (Figure 5). The expression levels of the VOC-inducible genes CHI, GLU, and POD were significantly higher in the VOC-treated A. thaliana than in the control (Figure 5). The expression levels of CHI were 1.9495 and 1.0546 for the VOC-treated A. thaliana and control, respectively. The expression levels of GLU were 0.0094 and 0.0080 for the VOC-treated A. thaliana and control, respectively. The expression of POD in the VOC-treated A. thaliana was 4.6449, also higher than that of the control (1.7750).

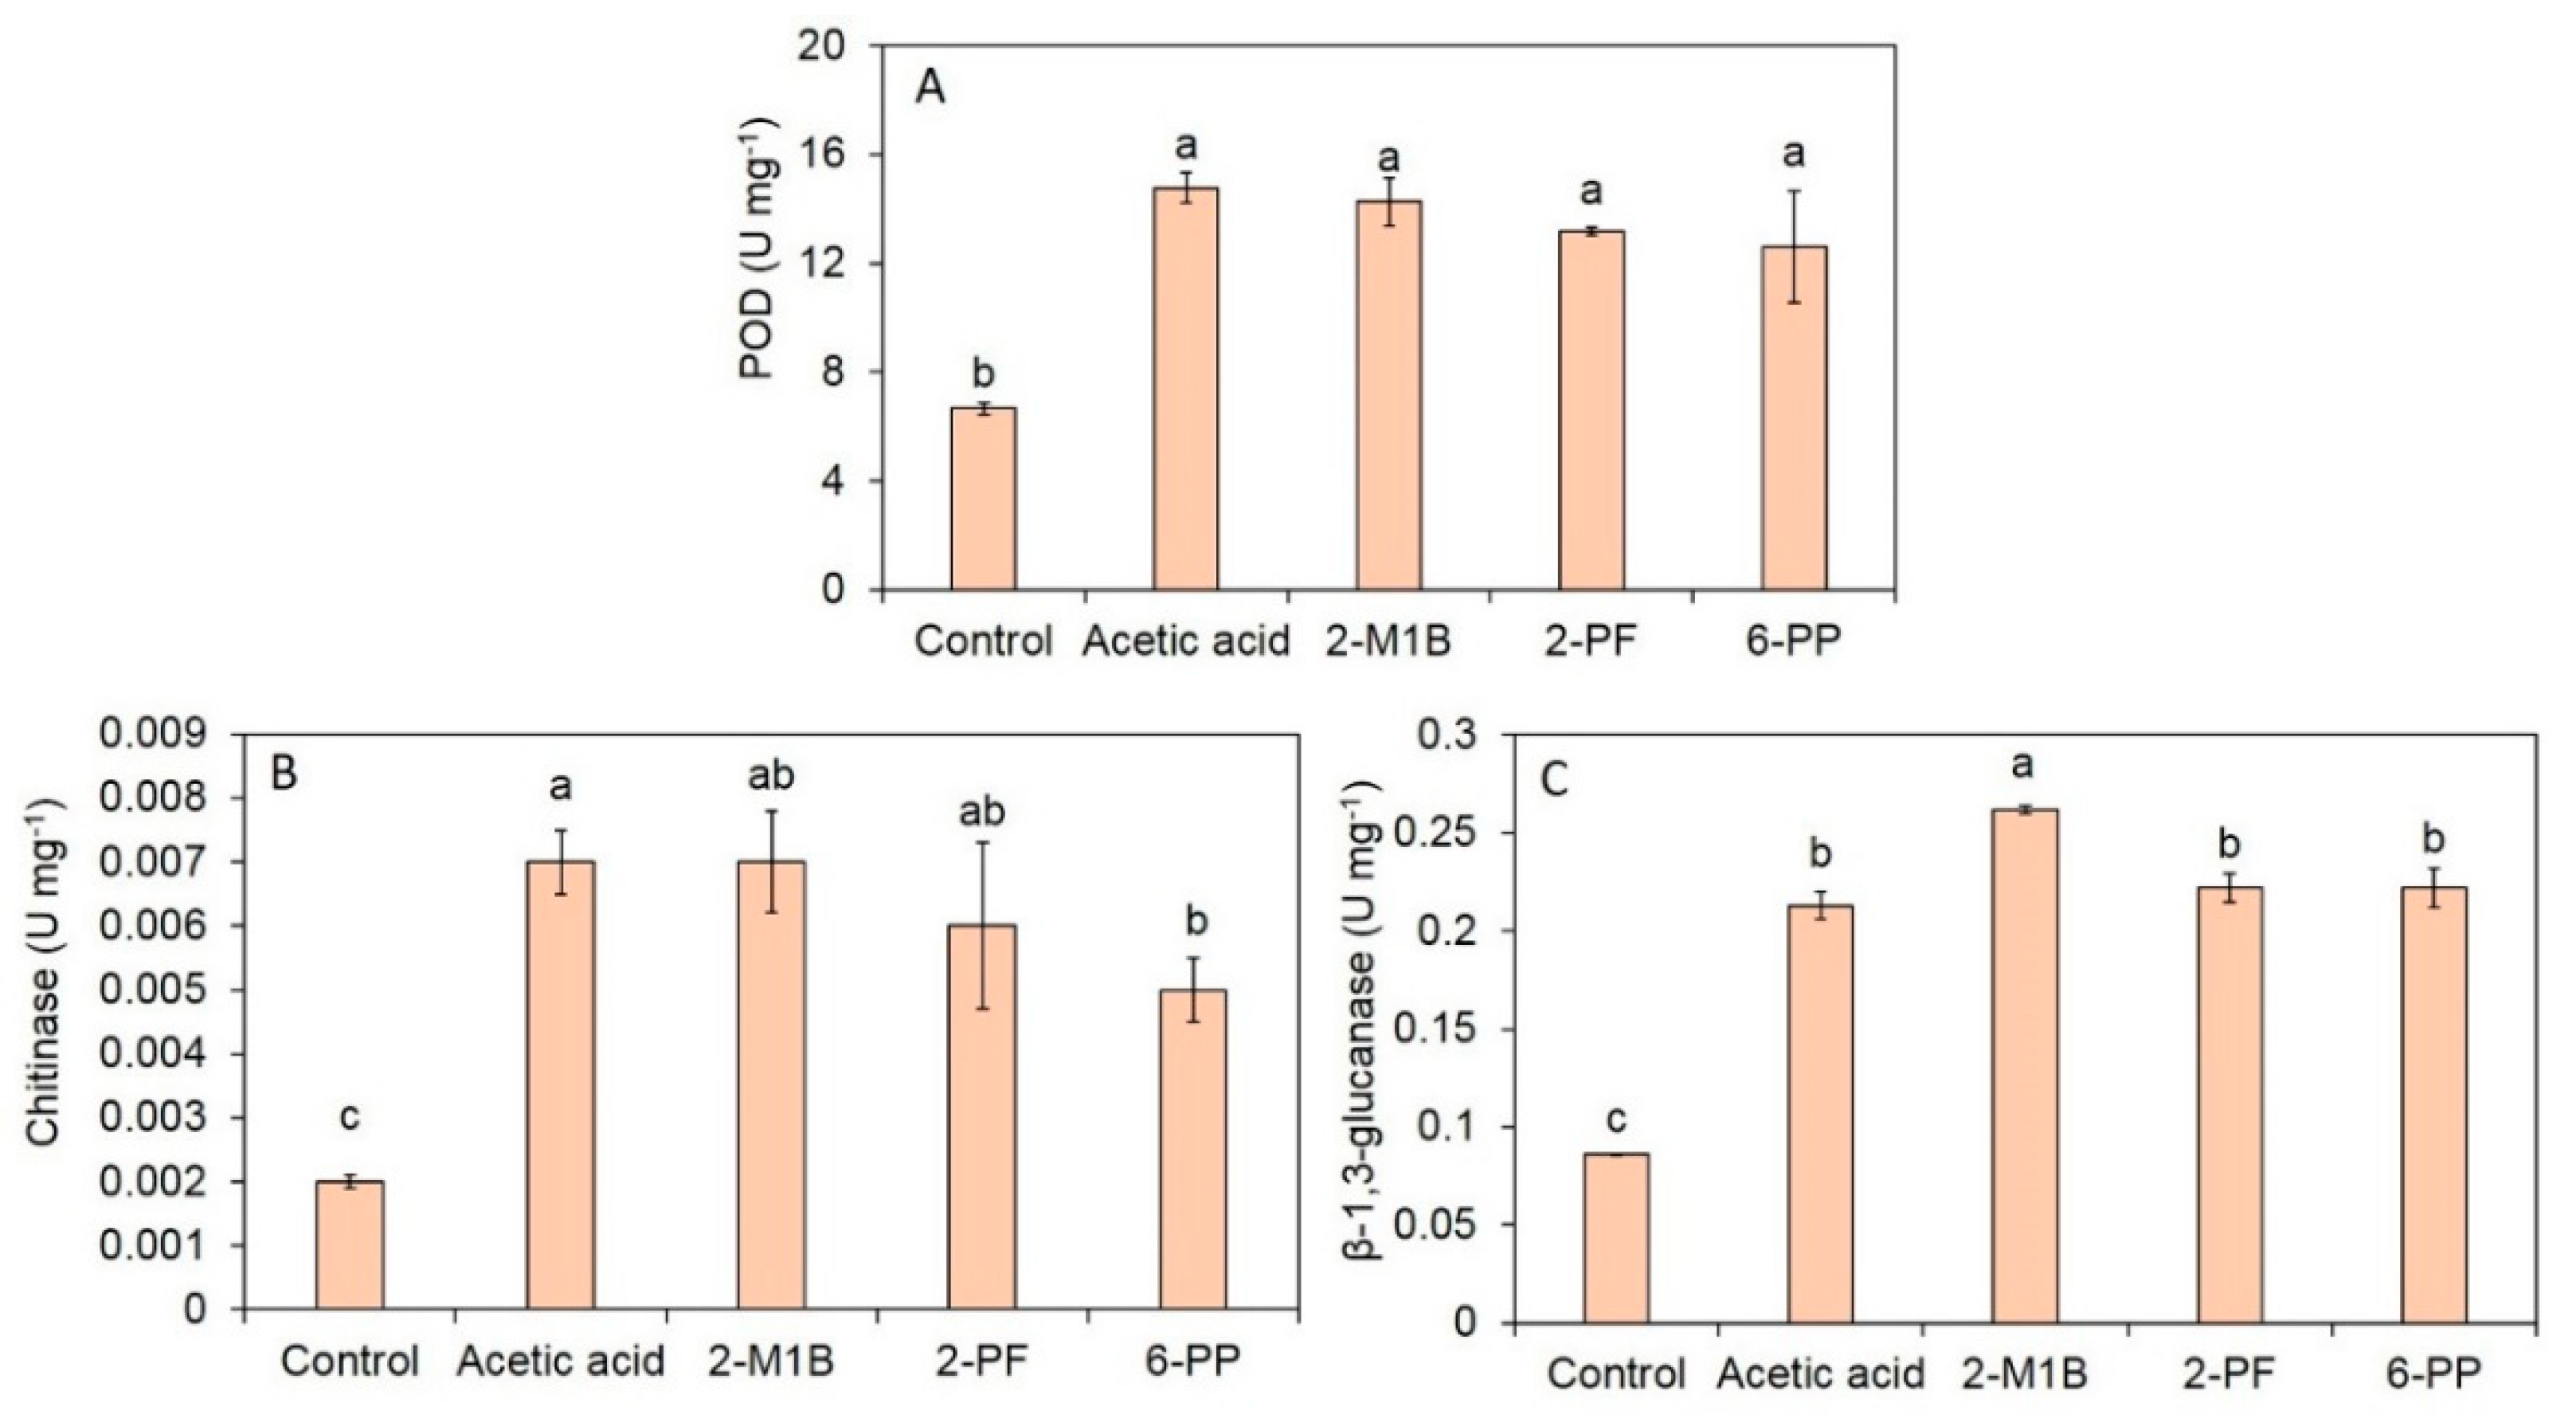
3.4. Induction of Defense-Related Enzymes and Enzyme Activities by Fungal VOCs

The enzymes assays showed that the fungal VOCs induced the activities of the defense-related enzymes (peroxidase) and cell wall-degrading enzymes (chitinase and β-1,3-glucanase) in the treated A. thaliana (Figure 6). The activity of POD was 6.67 ± 2.49 U mg−1 and 23.36 ± 1.82 U mg−1 for untreated and VOC-treated A. thaliana, respectively (Figure 6). The chitinase activity was 0.001 ± 0.00 U mg−1 and 0.42 ± 0.014 U mg−1 for the untreated and VOC-treated A. thaliana, respectively. Meanwhile, the β-1,3-glucanase activity was 0.131 ± 0.018 U mg−1 and 0.49 ± 0.007 U mg−1 for the untreated and VOC-treated A. thaliana, respectively (Figure 6).

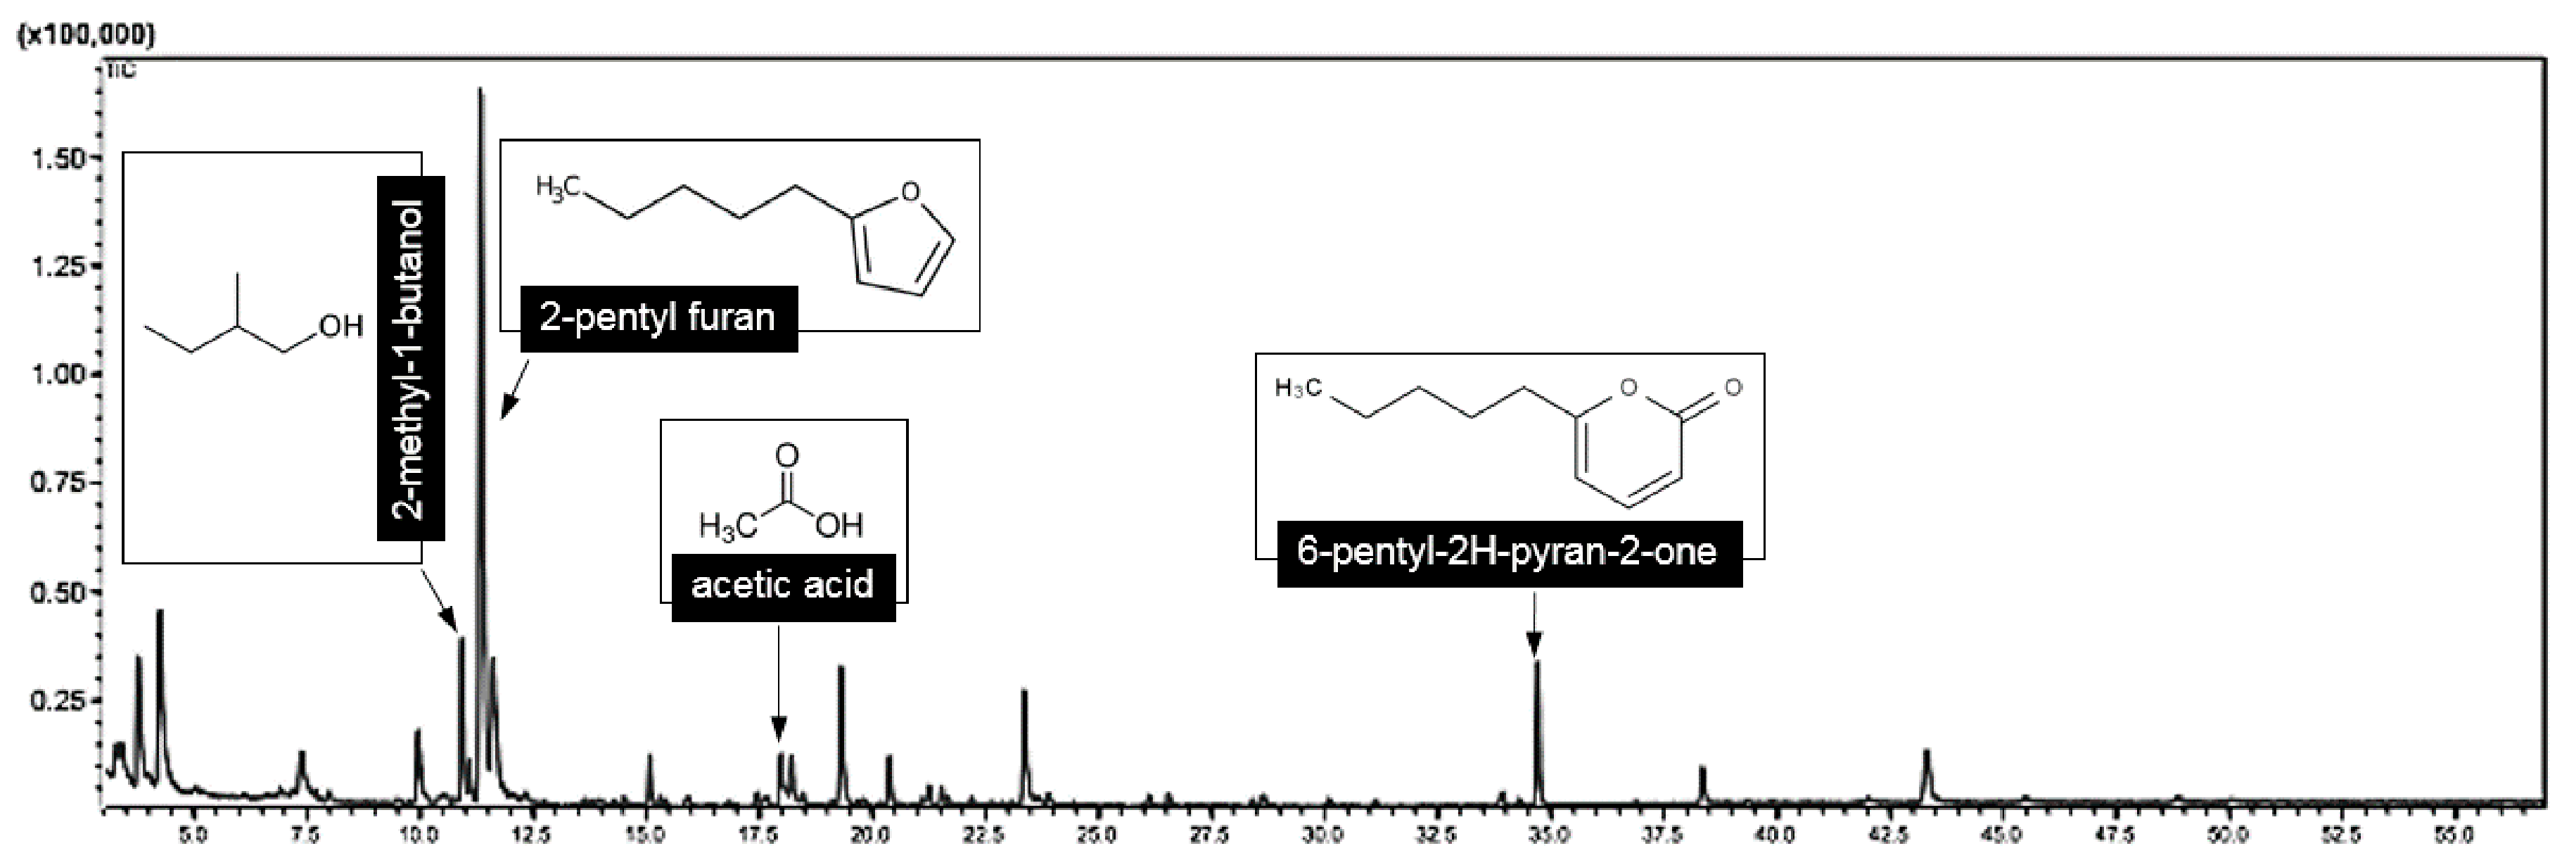
3.5. Identification of VOCs through SPME GC/MS

Based on the SPME GC/MS analysis, the VOCs emitted by T. asperelloides PSU-P1 were tentatively identified as four compounds based on similarities greater than 95%, namely, 2-methyl-1-butanol, 2-pentyl furan, acetic acid, and 6-pentyl-2H-pyran-2-one. The results are summarized in Table 3, representing the VOCs produced by T. asperelloides PSU-P1 that were responsible for inhibiting fungal growth and for promoting growth in A. thaliana. The carbon counts (C) of the compounds ranged from C2 (acetic acid) to C10 (6-pentyl-2H-pyran-2-one (6-PP)). The 2-pentyl furan was dominant, contributing 30.59%, followed by 2-methyl-1-butanol (6.96%) and 6-PP (5.45%). Figure 7 shows the mass spectrum of the four compounds produced by T. asperelloides PSU-P1.

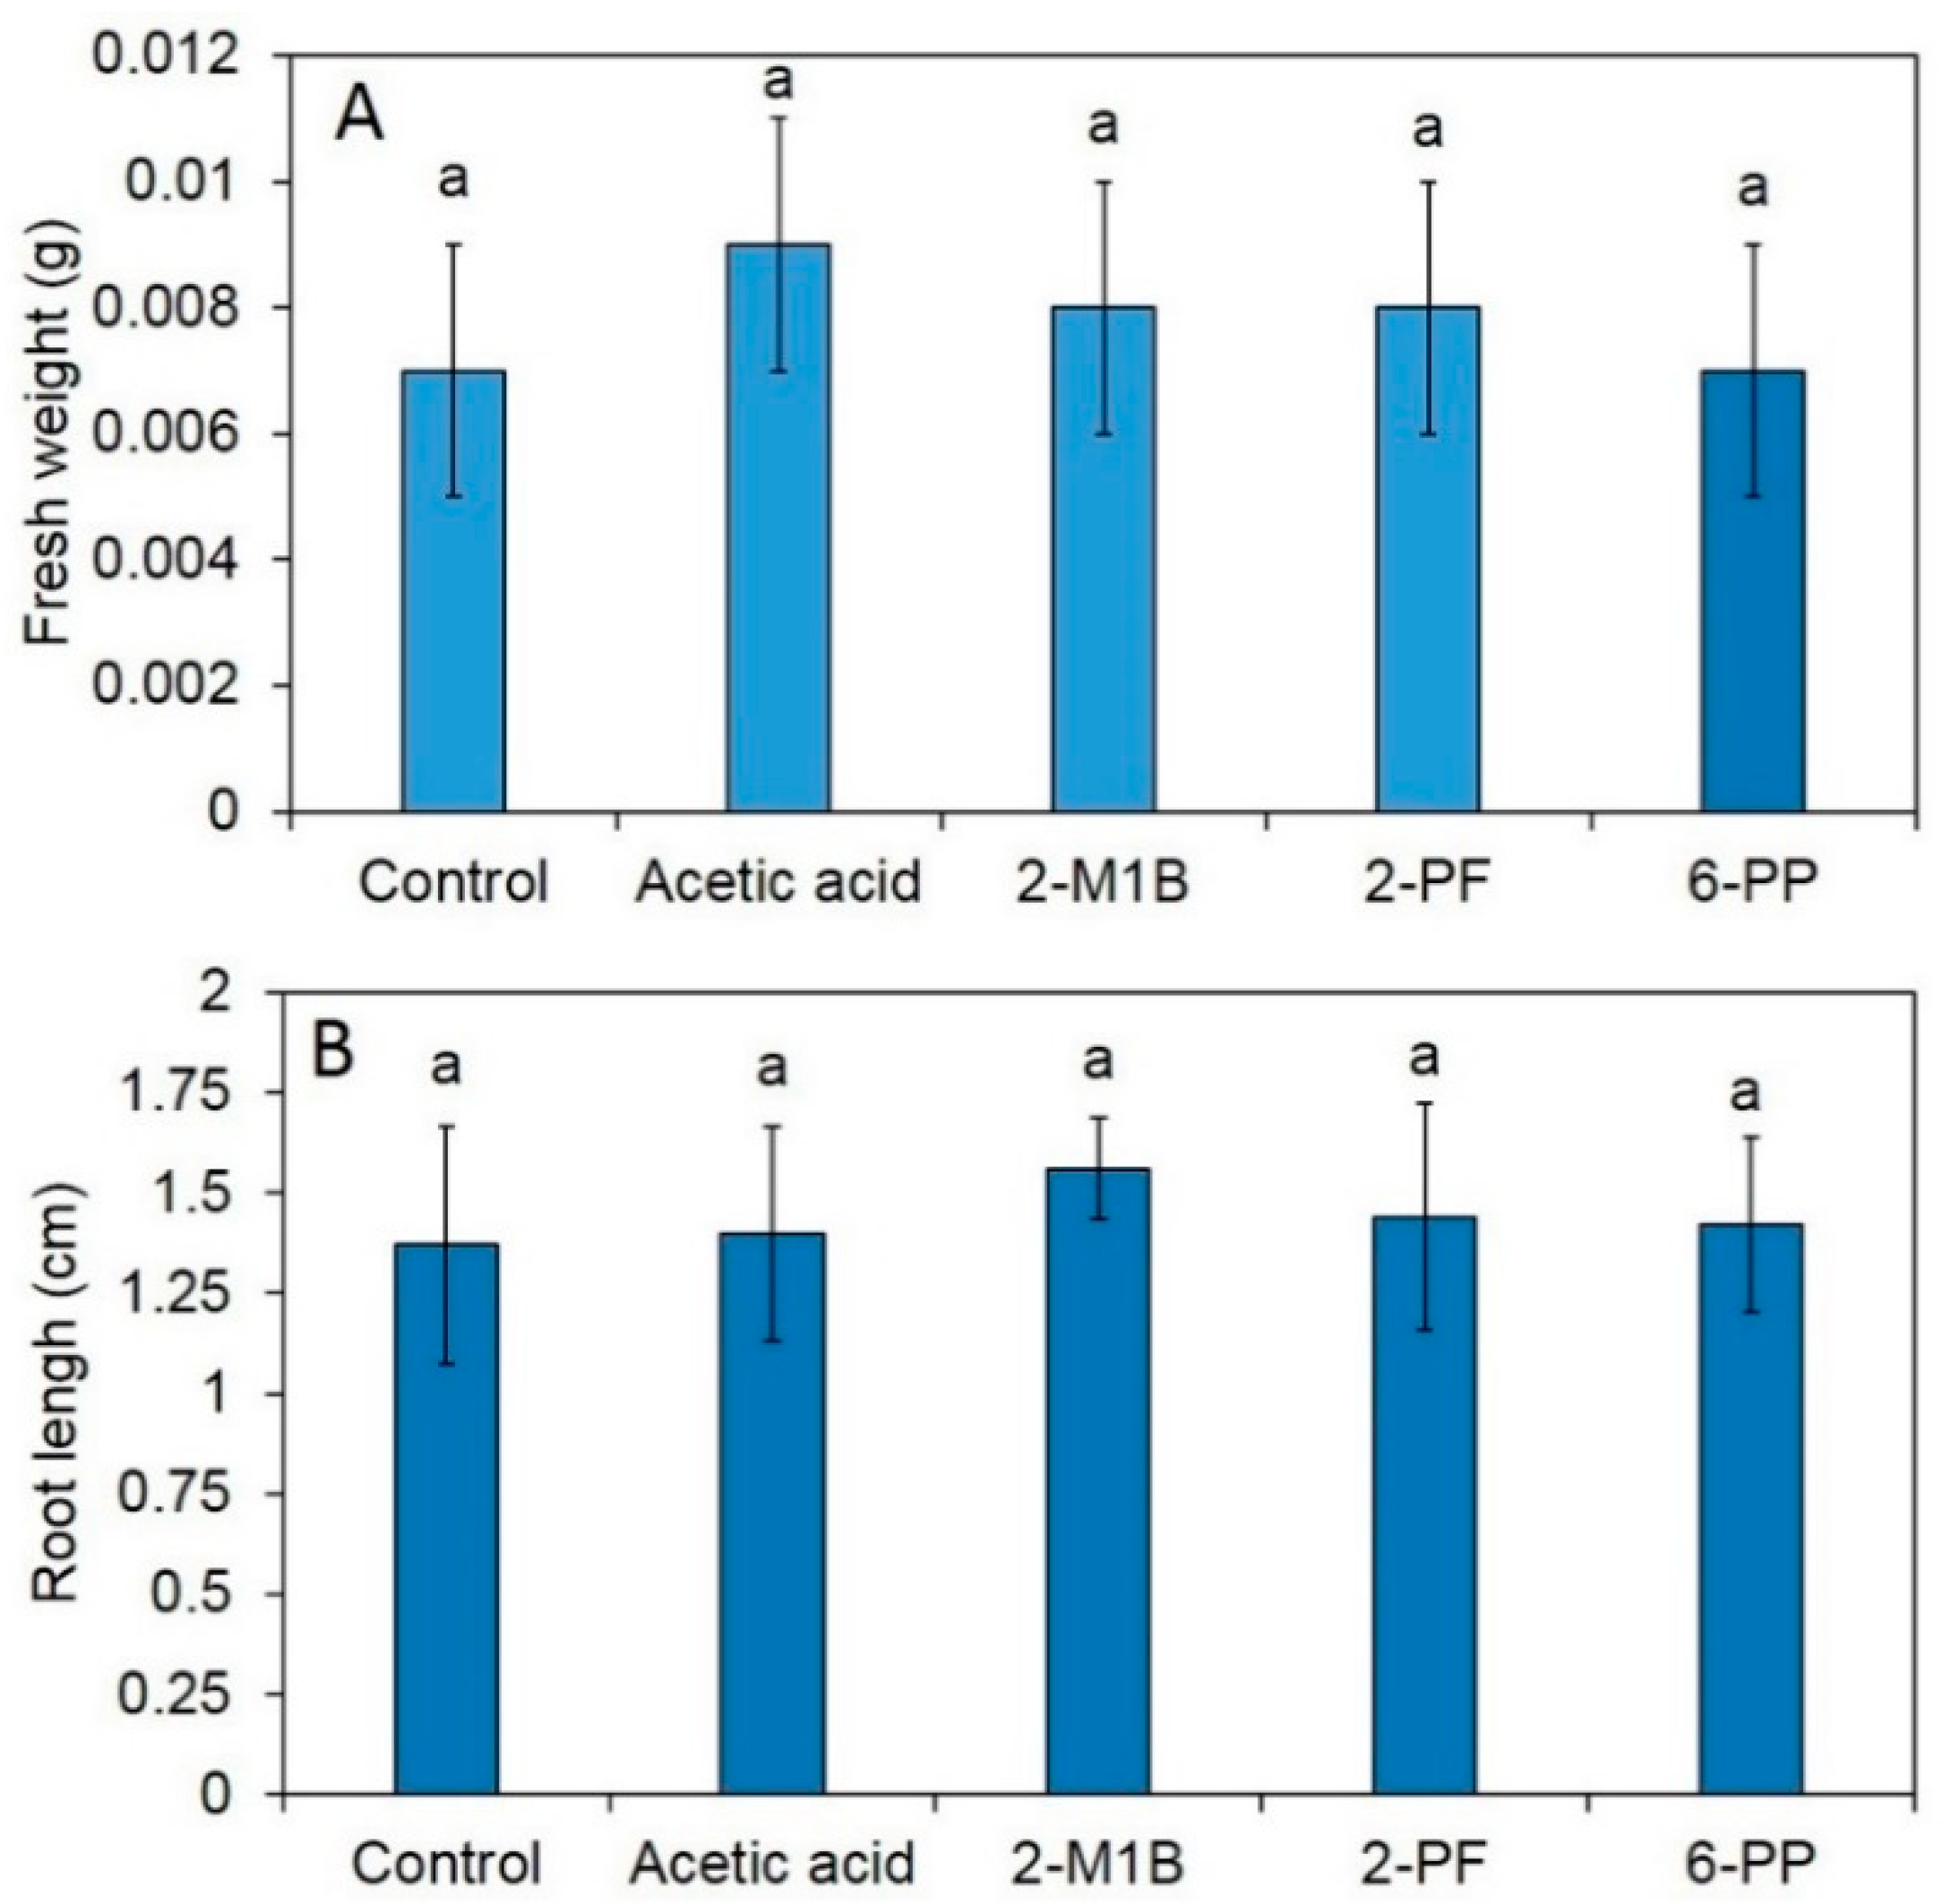
3.6. Effects of Commercial Volatile Compounds on Antifungal Activity, Induced Enzyme Activity, and Plant Phenotype

We tested the effects of each volatile compound on the fungal growth of plant pathogens, as shown in Table 4. Acetic acid could only inhibit the fungal growth of Ganoderma sp. The 2-pentylfuran and 2-methyl-1-butanol were found to inhibit the fungal growth of both Ganoderma sp. and Penicillium oxalicum. Moreover, 6-PP was found to show antifungal activity against Ganoderma sp., P. oxalicum, S. rolfsii, and Stagonosporopsis cucurbitacearum (Table 4).
The effects of each commercial volatile compound on the induced defense responses in A. thaliana were assessed using enzyme assays (Figure 8). The results show that the activity of POD of A. thaliana exposed to acetic acid, 2-methyl-1-butanol, 2-pentylfuran, and 6-PP was 14.76, 14.27, 13.19, and 12.62 U mL−1, respectively, significantly higher than in control (6.66 U mL−1). The chitinase activity of A. thaliana exposed to acetic acid, 2-methyl-1-butanol, 2-pentylfuran, and 6-PP was 0.007, 0.007, 0.006, and 0.005 U mL−1, respectively, significantly higher than the control (0.002 U mL−1). The β-1,3-glucanase activity found in A. thaliana after exposure to acetic acid, 2-methyl-1-butanol, 2-pentylfuran, and 6-PP was 0.213, 0.262, 0.222, and 0.222 U mL−1, respectively, significantly higher than in the control (0.086 U mL−1).
The effects of each commercial volatile compound on the plant phenotype (fresh weight and root length) in A. thaliana are shown in Figure 9. The results show no statistically significant differences among the treated and untreated samples (Figure 9).

4. Discussion

Several fungal volatiles emitted by Trichoderma species have recently been reported to limit fungal growth [1,4,37]. In the present study, T. asperelloides PSU-P1 produced and emitted a complex mix of VOCs to suppress fungal pathogens (Figure 2). The SPME trapped the VOCs from T. asperelloides PSU-P1 and GM/MS were tentatively identified as acetic acid, 2-pentyl furan, 2-methyl-1-butanol, and 6-PP (Figure 8). Among the four compounds found in this study, three have been reported to show antifungal activity against several fungal pathogens; namely, acetic acid [38], 2-methyl-1-butanol [39], and 6-PP [4,40]. We tested the antifungal abilities of commercial compounds on the fungal growth of plant pathogens (Table 4), and we found that 6-PP was the most effective volatile against the plant pathogens Ganoderma sp., P. oxalicum, S. rolfsii, and S. cucurbitacearum (Table 4).
Among the VOCs produced by Trichoderma species, 6-PP with a sweet coconut-like aroma was considered the most important produced by T. asperellum [4], T. viride [41], T. harzianum [42], T. koningii [43], and T. atroviride [44,45]. In this study we found T. asperelloides also produces 6-PP (Figure 8). 6-PP and its analogs have shown antifungal activity against plant pathogens [6,35]. However, herein, the antifungal ability of each commercial compound was lower than of the VOCs emitted by T. asperelloides PSU-P1. This phenomenon may be because some compounds might work together synergistically to inhibit the fungal growth of pathogens (Figure 2). It is presumed that in PDA cultures, Trichoderma produces other metabolites than those four compounds described in this study. Therefore, a different effect of the individual metabolites and their entire spectrum on plants may be observed.
It has been shown that VOCs from some Trichoderma species promote plant growth [4,46,47]. For instance, VOCs from T. pseudokoningii and T. viride have been shown to increase Arabidopsis growth and tomato plant biomass, respectively [47]. In addition, Jalali et al. [48] showed that VOCs from T. koningii induce growth promotion in A. thaliana. Furthermore, the VOCs of T. asperellum T1 have recently been shown to increase plant growth in lettuce [4]. In this study, T. asperelloides PSU-P1 emitted plant growth-promoting VOCs increasing fresh weigh, root length, and total chlorophyll content in A. thaliana (Figure 3 and Figure 4), in agreement with recent reports [4,48]. Among the found compounds found in this study, two have been reported to promote plant growth; namely, 2-pentylfuran [49] and 6-PP [4,48]. However, we tested the effects of commercial compounds on plant growth in A. thalaiana (Figure 8 and Figure 9), and the results showed no significant differences from the control. A VOC mixture could potentially have such effects, while each volatile alone does not affect plant growth in A. thaliana. To increase the plant biomass, several factors are involved in the closed atmosphere such as the presence of the fungal culture in the treatment plate can be responsible for a significant difference in relative humidity and CO2 exchange that, influencing the leaf metabolism could induce a higher growth of plant tissues respect to the control. However, we did not investigate this phenomenon due to the complicated experimental setup.
The role of VOCs on the activation of defense responses has been reported in several plants [16,50]. Naznin et al. [36] showed that the VOCs emitted by plant growth-promoting fungi induce a high expression of defense-related genes, i.e., SA-responsive gene PR1 and JA-responsive gene PDF1.2 in A. thaliana. The Trichoderma VOCs affected the gene expression involved in defense responses in A. thaliana [46]. The results from our study showed that the expression of CHI, GLU, and POD was significantly higher than in the control (Figure 5). This is in agreement with Kim et al. [51], who showed that VOCs from Bacillus sp. JS cause the upregulation of PR-2 encoding β-1,3-glucanase and of PR-3 encoding chitinase. Furthermore, Jain et al. [52] demonstrated that the microbial VOCs released by Bacillus sp. strain SJ-5 induce defense-related genes, lipoxygenase, phenylalanine ammonia-lyase 2, peroxidase, polyphenol oxidase, endo-1,3-beta-glucanase, catalase, defensin-like protein, vegetative storage protein, and chitinase class I in Glycine max. Therefore, the upregulation of CHI, GLU, and POD genes in A. thaliana may contribute to plant resistance by the production of defense-related enzymes against fungal pathogens.
Based on the results from our study, the VOCs from T. asperelloides PSU-P1 increased the activity of defense-related enzymes (POD) and cell wall-degrading enzymes (chitinase and β-1,3-glucanase), as shown in Figure 6. The application of 6-Pentyl-alpha-pyrone (6PAP), a volatile compound from T. harzianum, enhanced the activity of POD, polyphenol oxidase, and β-1,3-glucanase in maize against seedling blight caused by Fusarium moniliforme [50]. However, we investigated the effect of VOCs on the plants in this study, and the influence of pathogens was not observed in this study. The treatment with VOCs from T. asperellum T1 in lettuce induced high activity of chitinase and β-1,3-glucanase [4]. Furthermore, we tested the effects of each commercial volatile compound (i.e., acetic acid, 2-methyl-1-butanol, 2-pentylfuran, and 6-PP) on the induction of defense responses in A. thaliana (Figure 9). We found that all four compounds were able to induce the activity of POD, chitinase, and β-1,3-glucanase in treated A. thaliana. The application of 6-PP to induce defense responses in lettuce has been reported recently [4]. We, therefore, identified new inducers of defense responses from T. asperelloides PSU-P1 in A. thaliana.
Several reports have investigated the effect of VOCs emitted from Trichoderma species on plant metabolism. For instance, Kottb [53] showed that the VOCs from T. asperellum IsmT5 increase trichome numbers, accumulate defense-related compounds, and increase the expression of defense-related genes. Wonglom [5] demonstrated that the VOCs emitted by T. asperellum are involved in antifungal activity, defense responses, and promotion of plant growth in lettuce (Lactuca sativa). The results from this study demonstrated that the VOCs emitted from T. asperelloides PSU-P1 increased plant growth and the enzyme activity of defense-related enzymes and increased the expression of defense-related genes in agreement with Kottb [53]. However, an effect of VOCs on the change in plant physiology was not observed in this study.

5. Conclusions

Herein, we described the possible mechanisms of the VOCs emitted by T. asperelloides PSU-P1 involved in antifungal activity against fungal pathogens’ defense responses by upregulating CHI and GLU, enhanced cell wall-degrading enzyme activity, and increased growth of A. thaliana. However, the results obtained in this work highlight the effect of VOCs and some individual volatiles on plant growth and plant defense responses. In order to better understand the role of VOCs for bio-fumigant, the effect of VOCs on the suppression of fungal pathogens and their field application need to be conducted in the near future.

Author Contributions

Conceptualization, N.P. and A.S.; methodology, N.P., N.S., K.M., and S.-i.I.; software, K.M. and A.S.; validation, S.-i.I., K.M., S.A., and S.L.; formal analysis, A.S.; investigation, N.P.; resources, A.S.; data curation, A.S.; writing—original draft preparation, N.P. and A.S.; writing—review and editing, N.P., N.S., S.-i.I., S.L., and A.S.; visualization, A.S.; supervision, A.S.; project administration, A.S.; funding acquisition, A.S. All authors have read and agreed to the published version of the manuscript.

Funding

This research was funded by the National Research Council of Thailand (NRCT; NRCT5-RSA63022-01), the Prince of Songkla University, and the Center of Excellence in Agricultural and Natural Resources Biotechnology (CoE-ANRB) phase 3.

Acknowledgments

The helpful comments of Seppo Karrila are gratefully acknowledged.

Conflicts of Interest

The authors declare no conflict of interest.

References

  1. Shi, M.; Chen, L.; Wang, X.W.; Zhang, T.; Zhao, P.B.; Song, X.Y.; Sun, C.Y.; Chen, X.L.; Zhou, B.C.; Zhang, Y.Z. Antimicrobial peptaibols from Trichoderma pseudokoningii induce programmed cell death in plant fungal pathogens. Microbiology 2012, 158, 166–175. [Google Scholar] [CrossRef] [PubMed] [Green Version]
  2. Sunpapao, A.; Chairin, T.; Ito, S. The biocontrol by Streptomyces and Trichoderma of leaf spot disease caused by Curvularia oryzae in oil palm seedlings. Biol. Control 2018, 123, 36–42. [Google Scholar] [CrossRef]
  3. Wonglom, P.; Daengsuwan, W.; Ito, S.; Sunpapao, A. Biological control of Sclerotium fruit rot of snake fruit and stem rot of lettuce by Trichoderma sp. T76-12/2 and the mechanism involved. Physiol. Molec. Plant Pathol. 2019, 107, 1–7. [Google Scholar] [CrossRef]
  4. Baiyee, B.; Ito, S.; Sunapapo, A. Trichoderma asperellum T1 mediated antifungal activity and induced defense response against leaf spot fungi in lettuce (Lactuca sativa L.). Physiol. Molec. Plant Pathol. 2019, 106, 96–101. [Google Scholar] [CrossRef]
  5. Wonglom, P.; Ito, S.; Sunpapao, A. Volatile organic compounds emitted from endophytic fungus Trichoderma asperellum T1 mediate antifungal activity, defense response and promote plant growth in lettuce (Lactuca sativa). Fungal Ecol. 2020, 43, 100867. [Google Scholar] [CrossRef]
  6. Vinodkumar, S.; Indumathi, T.; Nakkeeran, S. Trichoderma asperellum (NVTA2) as a potential antagonist for the management of stem rot in carnation under protected cultivation. Biol. Control 2017, 113, 58–64. [Google Scholar] [CrossRef]
  7. Baiyee, B.; Pornsuriya, C.; Ito, S.; Sunapapo, A. Trichoderma spirale T76-1 displays biocontrol activity on lettuce (Lactuca sativa L.) caused by Corynespora cassiicola or Curvularia aeria. Biol. Control 2019, 129, 195–200. [Google Scholar] [CrossRef]
  8. Monteiro, V.; Silva, R.N.; Steindorff, A.; Costa, F.; Noronha, E.; Ricart, C.; de Sousa, M.; Vainstein, M.; Monteiro, V.; Ulhoa, C. New insight in; Trichoderma harzianum antagonism of fungal plant pathogens by secreted protein analysis. Curr. Microbiol. 2010, 61, 298–305. [Google Scholar] [CrossRef]
  9. Carreras-Villaseñor, N.; Sánchez-Arreguín, J.A.; Herrera-Estrella, A.H. Trichoderma: Sensing the environment for survival and dispersal. Microbiology 2012, 158, 3–16. [Google Scholar] [CrossRef]
  10. Evans, H.C.; Holmes, K.A.; Thomas, S.E. Endophytes and mycoparasites associated with an indigenous forest tree, Theobroma gileri, in Ecuador and a preliminary assessment of their potentials biocontrol agents of cocoa diseases. Mycol. Prog. 2003, 2, 149–160. [Google Scholar] [CrossRef]
  11. Brader, G.; Compant, S.; Mitter, B.; Trognitz, F.; Sessitsch, A. Metabolic potential of endophytic bacteria. Curr. Opin. Biotechnol. 2014, 27, 30–37. [Google Scholar] [CrossRef] [PubMed] [Green Version]
  12. Macías-Rubalcava, M.L.; Hernández-Bautista, B.E.; Oropeza, F.; Duarte, G.; González, M.C.; Glenn, A.E.; Hanlin, R.T.; Anaya, A.L. Allelochemical effects of volatile compounds and organic extracts from Muscodor yucatanensis, a tropical endophytic fungus from Bursera simaruta. J. Chem. Ecol. 2010, 36, 1122–1131. [Google Scholar] [CrossRef] [PubMed]
  13. Insam, H.; Seewald, S.A. Volatile organic compounds (VOCs) in soils. Biol. Fertil. Soils 2010, 46, 199–213. [Google Scholar] [CrossRef] [Green Version]
  14. Dudareva, N.; Negre, F.; Nagegowda, D.A.; Orlova, I. Plant volatiles: Recent advances and future perspectives. Crit. Rev. Plant Sci. 2006, 25, 417–440. [Google Scholar] [CrossRef]
  15. Campos, V.P.; Pinho, R.S.C.; Freire, E.S. Volatiles produced by interacting microorganisms potentially useful for the control of plant pathogens. Cienc. Agrotec. 2010, 34, 525–535. [Google Scholar] [CrossRef] [Green Version]
  16. Vinale, F.; Sivasithamparam, K.; Ghisalberti, E.L.; Marra, R.; Woo, S.L.; Lorito, M. Trichoderma-plant pathogens interactions. Soil Biol. Biochem. 2008, 40, 1–10. [Google Scholar] [CrossRef]
  17. Sumida, C.H.; Daniel, J.F.S.; Araujod, A.P.C.S.; Peitl, D.C.; Abreu, L.M.; Dekker, R.F.H.; Canteri, M.G. Trichoderma asperelloides antagonism to nine Sclerotinia sclerotiorum strains and biological control of white mold disease in soybean plants. Biocontrol Sci. Technol. 2018, 28, 142–156. [Google Scholar] [CrossRef]
  18. Ruangwong, O.; Wonglom, P.; Phoka, N.; Suwannarach, N.; Lumyong, S.; Ito, S.; Sunpapao, A. Biological control activity of Trichoderma asperelloides PSU-P1 against gummy stem blight in muskmelon plant (Cucumis melo). Physiol. Molec. Plant Pathol. under review.
  19. Chairin, T.; Pornsuriya, C.; Thaochan, N.; Sunpapao, A. Corynespora cassiicola causes leaf spot disease on lettuce (Lactuca sativa) cultivated in hydroponic systems in Thailand. Australas. Plant Dis. Notes 2017, 12, 1–3. [Google Scholar] [CrossRef]
  20. Pornsuriya, C.; Ito, S.; Sunpapao, A. First report of leaf spot on lettuce caused by Curvularia aeria. J. Gen. Plant Pathol. 2018, 84, 296–299. [Google Scholar] [CrossRef]
  21. Pornsuriya, C.; Chitphithak, J. Blue mold caused by Penicillium oxalicum on muskmelon (Cucumis melo) in Thailand. Australas. Plant. Dis. Notes 2018, 13, 46. [Google Scholar] [CrossRef] [Green Version]
  22. Daengsuwan, W.; Wonglom, P.; Arikit, S.; Sunpapao, A. Morphological and molecular identification of the Neopestalotiopsis clavispora associated with flower blight on Anthurium andraeanum in Thailand. Hort. Plant J. accepted for publication.
  23. Koike, S.T. Southern blight of Jerusalem artichoke caused by Sclerotium rolfsii in California. Plant Dis. 2004, 88, 769. [Google Scholar] [CrossRef] [PubMed]
  24. Aveskamp, M.M.; de Gruyter, J.; Woudenberg, J.H.C.; Verkleyand, G.J.M.; Crous, P.W. Highlights of the Didymellaceae: A polyphasic approach to characterize Phoma and related pleosporalean genera. Stud. Mycol. 2010, 65, 1–60. [Google Scholar] [CrossRef] [PubMed]
  25. Dennis, C.; Webster, J. Antagonistic properties of species-groups of Trichoderma, II. Production of volatile antibiotic. Trans. Br. Mycol. Soc. 1971, 57, 41–48. [Google Scholar] [CrossRef]
  26. Prapagdee, B.; Akrapikulchart, U.; Mongkolsuk, S. Potential of a soil-borne Streptomyces hygroscopicus for biocontrol of Anthracnose disease caused by Colletotrichum gloeosporioides in orchard. J. Biol. Sci. 2008, 8, 1187–1192. [Google Scholar] [CrossRef] [Green Version]
  27. Murashige, T.; Skoog, F. A revised medium for rapid growth and bio assay with tissue cultures. Physiol. Plant. 1962, 15, 473–497. [Google Scholar] [CrossRef]
  28. Moran, R. Formulae for determination of chlorophyllous pigments extracted with N,N-dimethylformamide. Plant Physiol. 1982, 69, 1376–1381. [Google Scholar] [CrossRef] [Green Version]
  29. Kaewsuksaeng, S.; Tatmala, N.; Shigyo, M.; Tanaka, S.; Yamauchi, N. Application of electrostatic atomized water particle suppress calyx discoloration in relation to postharvest quality of mangosteen (Garcinia mangostana L.). Sci. Hort. 2019, 250, 380–387. [Google Scholar] [CrossRef]
  30. Dumhai, R.; Wanchana, S.; Saensuk, C.; Choowongkomon, K.; Mahatheeranont, S.; Kraithong, T.; Toojinda, T.; Vanavichit, A.; Arikit, S. Discovery of a novel CnAMADH2 allele associated with higher levels of 2-acetyl-1-pyroline (2AP) in yellow dwarf coconut (Cocos nucifera L.). Sci. Hort. 2019, 243, 490–497. [Google Scholar] [CrossRef]
  31. Chairin, T.; Petcharat, V. Induction of defense responses in longkong fruit (Aglaia dookkoo Griff.) against fruit rot fungi by Metarhizium guizhouense. Biol. Control 2017, 111, 40–44. [Google Scholar] [CrossRef]
  32. Vetter, J.L.; Steinberg, M.P.; Nelson, A.I. Quantitative determination of peroxidase in sweet corn. J. Agric. Food Chem. 1958, 6, 39–41. [Google Scholar] [CrossRef]
  33. Miller, G.L. Use of dinitrosalicylic acid reagent for determination of reducing sugar. Annl. Biochem. 1959, 31, 426–428. [Google Scholar] [CrossRef]
  34. Suwannarach, N.; Kaewyana, C.; Yodmeeklin, A.; Kumla, J.; Lumyong, S. Evaluation of Muscodor cinnamomi as an egg biofumigant for the reduction of microorganisms on egg shell surfaces and its effect on egg quality. Int. J. Food Microbiol. 2017, 244, 52–61. [Google Scholar] [CrossRef] [PubMed]
  35. Parker, S.R.; Cutler, H.G.; Jacyno, J.M.; Hill, R.A. Biological activities of 6-pentyl-2H-pyran-2-one and its analogs. J. Agric. Food Chem. 1997, 45, 2774–2776. [Google Scholar] [CrossRef]
  36. Naznin, H.A.; Kiyohara, D.; Kimura, M.; Miyazawa, M.; Shimizu, M.; Hyakumachi, M. Systemic resisatnce induced by volatile organic compounds emitted by plant growth-promoting fungi in Arabidopsis thaliana. PLoS ONE 2014, 9, e86882. [Google Scholar] [CrossRef] [Green Version]
  37. Sunpapao, A. Antagonistic Microorganisms: Current Research and Innovations; Lambert Academic Publishing: Saarbrücken, Germany, 2020; p. 120. [Google Scholar]
  38. Rogawansmamy, S.; Gaskin, S.; Taylor, M.; Pisaniello, D. An evaluation of antifungal agents for the treatment of fungal contamination in indoor air environments. Int. J. Environ. Res. Public Health 2015, 12, 6319–6332. [Google Scholar] [CrossRef] [Green Version]
  39. Rezende, D.C.; Fialho, M.B.; Brand, S.C.; Blumer, S.; Pascholati, S.F. Antimicrobial activity of volatile organic compounds and their effect on lipid peroxidation and electrolyte loss in Colletotrichum gloeosporioides and Colletotrichum acutatum mycelia. Afr. J. Microbiol. Res. 2015, 9, 1527–1535. [Google Scholar]
  40. Andriamialisoa, Z.; Giraud, M.; Labia, R.; Valla, A. Chemical synthesis of 6-pentyl-2H-pyran-2-one: A natural antifungal biosynthesized by Trichoderma spp. Chem. Ecol. 2010, 20, 55–59. [Google Scholar] [CrossRef]
  41. Collins, R.P.; Halim, A.F. Characterization of the major aroma constituent of the fungus Trichoderma viride (Pers.). J. Agric. Food Chem. 1972, 20, 437–438. [Google Scholar] [CrossRef]
  42. Bonnarme, P.; Djian, A.; Latrasse, A.; Feron, G.; Ginies, C.; Durand, A.; Le Quéré, J.L. Production of 6-pentyl-a-pyrone by Trichoderma sp. from vegetable oils. J. Biotechnol. 1997, 156, 143–150. [Google Scholar] [CrossRef]
  43. Simon, A.; Dunlop, R.W.; Ghisalberti, E.L.; Sivasithamparam, K. Trichoderma koningii produces a pyrone compound with antibiotic properties. Soil Biol. Chem. 1988, 20, 263–264. [Google Scholar] [CrossRef]
  44. Reithner, B.; Brunner, K.; Schuhmacher, R.; Peissl, P.; Seidl, V.; Krska, R.; Zeilinger, S. The G protein α subunit Tga1 of Trichoderma atroviride is involved in chitinase formation and differential production of antifungal metabolites. Fungal Genet. Biol. 2005, 42, 749–760. [Google Scholar] [CrossRef] [PubMed]
  45. Reithner, B.; Schuhmacher, R.; Stoppacher, N.; Pucher, M.; Brunner, K.; Zeilinger, S. Signaling via the Trichoderma atroviride mitogen-activated protein kinase Tmk1 differentially affects mycoparasitism and plant protection. Fungal Genet. Biol. 2007, 44, 1123–1133. [Google Scholar] [CrossRef] [PubMed] [Green Version]
  46. Lee, S.; Behringer, G.; Hung, R.; Bennett, J. Effects of fungal volatile organic compounds on Arabidopsis thaliana growth and gene expression. Fungal Ecol. 2019, 37, 1–9. [Google Scholar] [CrossRef]
  47. Lee, S.; Yap, M.; Behringer, G.; Hung, R.; Bennett, J.W. Volatile organic compounds emitted by Trichoderma species mediate plant growth. Fungal Biol. Biotechnol. 2016, 3, 7. [Google Scholar] [CrossRef] [Green Version]
  48. Jalali, F.; Zafari, D.; Salari, H. Volatile organic compounds of some Trichoderma spp. increase growth and induce salt tolerance in Arabidopsis thaliana. Fungal Ecol. 2017, 29, 67–75. [Google Scholar] [CrossRef]
  49. Zou, C.; Li, Z.; Yu, D. Bacillus megaterium strain XTBG34 promotes plant growth by producing 2-pentylfuran. J. Microbiol. 2010, 48, 460–466. [Google Scholar] [CrossRef]
  50. El-Hassan, A.; Buchennauer, H. Action of 6-penthyl-alpha pyrone in controlling seedling blight incited by Fusarium moniliforme and inducing defense responses in maize. J. Phytopathol. 2009, 157, 697–707. [Google Scholar] [CrossRef]
  51. Kim, J.-S.; Lee, J.; Lee, C.-H.; Woo, S.Y.; Kang, H.; Seo, S.-G.; Kim, S.-H. Activation of pathogenesis-related genes by the rhizobacterium, Bacillus sp. JS, which induces systemic resistance in tobacco plants. Plant. Pathol. J. 2015, 31, 195–201. [Google Scholar] [CrossRef] [Green Version]
  52. Jain, S.; Vaishnav, A.; Varma, A.; Choudhary, D.W. Comparative expression analysis of defence-related genes in Bacillus-treated Glycine max upon challenge inoculation with selective fungal phytopathogens. Curr. Sci. 2018, 115, 1950–1956. [Google Scholar] [CrossRef]
  53. Kottb, M.; Gigolashvili, T.; Großkinsky, D.K.; Piechulla, B. Trichoderma volatiles effecting Arabidopsis: From inhibition to protection against phytopathogenic fungi. Front. Microbial. 2015, 6, 995. [Google Scholar] [CrossRef] [PubMed] [Green Version]
Figure 1. Overview of the experimental setup and the effect of volatile organic compounds (VOCs) on fungal growth, induced defense responses, and increased growth. A schematic overview of the plate-within-a-plate system for fungal growth (A) and for plant growth (B). PDA, potato dextrose agar; MS, Murashike and Skoog medium.
Jof 06 00341 g001
Figure 2. Colony diameter (A) and percent inhibition (B) by the VOCs emitted from T. asperelloides PSU-P1 against Colletotrichum sp. (1), C. cassiicola (2), C. lunata (3), Ganoderma sp. (4), P. oxalicum (5), N. clavispora (6), S. rolfsii (7), and S. cucurbitacearum (8). Different letters indicate statistically significant differences among treatments (p < 0.05) using the Tukey’s test.
Jof 06 00341 g002
Figure 3. Phenotypic characteristics of Arabidopsis thaliana: Fresh weight (A); root length (B); control A. thaliana exposed to plain PDA (C,E); A. thaliana exposed to T. asperelloides PSU-P1 VOCs (D,E). Asterisks indicate statistically significant differences (* p < 0.05) using the Student’s t-test.
Jof 06 00341 g003
Figure 4. Chlorophyll a and b contents of A. thaliana exposed to T. asperelloides PSU-P1 VOCs and without VOCs. Asterisks indicate statistically significant differences (* p < 0.05) using the Student’s t-test.
Jof 06 00341 g004
Figure 5. Relative gene expressions of chitinase (CHI), β-1,3-glucanase (GLU), and peroxidase (POD) in the VOC-treated A. thaliana and control. Asterisks indicate statistically significant differences (* p < 0.05) using the Student’s t-test.
Jof 06 00341 g005
Figure 6. Enzyme activities of chitinase (A), β-1,3-glucanase (B), and peroxidase (C) between the control and VOC-treated A. thaliana. Asterisks indicate statistically significant differences (* p < 0.05) using the Student’s t-test.
Jof 06 00341 g006
Figure 7. A chromatogram of the VOCs emitted by T. asperelloides PSU-P1 analyzed through SPME GC/MS.
Jof 06 00341 g007
Figure 8. Activities of the defense-related enzymes peroxidase (A) and cell wall-degrading enzymes chitinase (B) and β-1,3-glucanase (C) between the control and VOC-treated A. thaliana. Different letters indicate statistically significant differences among treatments (p < 0.05) using the Tukey’s test.
Jof 06 00341 g008
Figure 9. Effects of volatile organic compounds on the phenotypic characteristics of fresh weight (A) and root length (B) of A. thaliana. Different letters indicate statistically significant differences among treatments (p < 0.05) using the Tukey’s test.
Jof 06 00341 g009
Table 1. List of the microorganisms used in this study.
MicroorganismDiseaseReference
AntagonistFungal Pathogen
Trichoderma asperelloides
PSU-P1
[18]
Colletotrichum sp.Leaf blightCCPM
Corynespora cassiicolaLeaf spot[19]
Curvularia lunataLeaf spot[20]
Ganoderma sp.Basal stem rotCCPM
Penicillium oxalicumBlue mold[21]
Neopestalotiopsis clavisporaFlower blight[22]
Sclerotium rolfsiiSouthern blight[23]
Stagonosporopsis cucurbitacearumGummy stem blight[24]
CCPM, Culture Collection of Pest Management.
Table 2. Specific primer pairs for the gene expression determinations with quantitative real-time reverse transcription polymerase chain reaction (qRT-PCR).
GeneAccession NumberPrimerSequence (5′ → 3′)Product Size (bp)
ACTNM001036427ACT-FCTCCCATTCCCTTCTCCTTC247
ACT-RCGAGGACGACCCACAATACT
CHINM129919Chi-FTAGCTTCGGTGCTTCCATCT159
Chi-RGCACATGGGAACTCTGGTTT
GULNM115586Glu-FTGGTGTCAGATTCCGGTACA192
Glu-RTCATCCCTGAACCTTCCTTG
PODBT001238POD-FACCAACAGACCAGACCCAAG244
POD-RCGAACGTGTTGCTGCTGTAT
Table 3. International Union of Pure and Applied Chemistry (IUPAC) names of the volatile compounds produced by T. asperelloides PSU-P1 identified through SPME GC/MS analysis.
RT (min)Volatile Compoundm/zFormulaSimilarityTotal Area
10.932-methyl-1-butanol *88C5H12O956.96
11.342-pentyl furan138C9H14O9630.59
17.98Acetic acid60C2H4O2971.96
34.716-penthyl-2H-pyran-2-one108C10H14O2975.45
* The results from three replicates. SPME, solid phase microextraction; RT, retention time.
Table 4. Antifungal activities of commercial volatile compounds against fungal pathogens.
Fungal PathogenDiseaseAntifungal Ability 1
Acetic Acid2-PF2M1B6-PP
Colletotrichum sp.Leaf blight
C. cassiicolaLeaf spot
C. lunataLeaf spot
Ganoderma sp.Basal stem rot++++
P. oxalicumBlue mold+++
N. clavisporaflower blight
S. rolfsiiSouthern blight+
S. cucurbitacearumGummy stem blight+
1 The experiment was conducted by volatile antifungal bioassay in 9 cm Petri dish. 2PF, 2-pentyl furan; 2M1B, 2-methyl-1-butanol; 6-PP, 6-pentyl-2H-pyran-2-one. “+” antifungal activity of the VOCs inhibits fungal growth; “−” no antifungal activity of the VOCs.
Publisher’s Note: MDPI stays neutral with regard to jurisdictional claims in published maps and institutional affiliations.

