Abstract
Oxidative stress is the cause of numerous diseases in humans; therefore, there has been a continuous search for novel antioxidant molecules. Fungal chitosan is an attractive molecule that has several applications (antifungal, antibacterial, anticancer and antiparasitic action) owing to its unique characteristics; however, it exhibits low antioxidant activity. The aim of this study was to obtain fungal chitosan (Chit-F) from the fungus Rhizopus arrhizus and synthesize its derivative, fungal chitosan-gallic acid (Chit-FGal), as a novel antioxidant chitosan derivative for biomedical use. A low molecular weight Chi-F (~3.0 kDa) with a degree of deacetylation of 86% was obtained from this fungus. Chit-FGal (3.0 kDa) was synthesized by an efficient free radical-mediated method using hydrogen peroxide (H2O2) and ascorbic acid. Both Chit-F and Chit-FGal showed similar copper chelating activities; however, Chit-FGal was more efficient as an antioxidant, exhibiting twice the total antioxidant capacity than Chi-F (p < 0.05). Furthermore, H2O2 (0.06 M) promoted a 50% decrease in the viabilities of the 3T3 fibroblast cells. However, this effect was abolished in the presence of Chit-FGal (0.05–0.25 mg/mL), indicating that Chit-FGal protected the cells from oxidative damage. These results suggest that Chit-FGal may be a promising agent to combat oxidative stress.
1. Introduction
In the human body, an imbalance between the oxidant and antioxidant molecules promotes the formation of reactive species that give rise to a state known as “oxidative stress”, which favors oxidative damage in macromolecules and cells and can even cause cell death [1,2]. Among the reactive species, the main ones associated with oxidative stress are the reactive oxygen species (ROS) [3].
Living organisms have finely regulated systems to maintain low levels of ROS, that is, their production and elimination processes are well balanced, which results in the maintenance of steady levels of ROS in the body. However, this balance can be affected under certain circumstances. Several factors may result in an imbalance of ROS levels, such as the increase in the number of compounds that undergo auto-oxidation, and inactivation of antioxidant enzymes. The consequences of this increase in the number of compounds that undergo auto-oxidation differ depending on the levels of ROS, location of ROS generation, and efficiency of antioxidant systems as well as the cellular targets they interact with [4].
The imbalance in the regulation of ROS levels can cause several diseases, such as epilepsy [5,6], lung diseases [7], cancer [8], diabetes [9,10], Parkinson’s disease [11,12], and Alzheimer’s disease [13,14]. Therefore, there is a constant search for novel antioxidant molecules that can help to regulate this system. Among all the studied molecules, chitosan appears to be one of the most promising agents for the regulation of ROS levels [15,16,17].
Chitosan is a biopolymer formed by the deacetylation of some glucopyranose residues from chitin [18]. It is composed of 2-acetamido-2-deoxy-d-glucopyranose and 2-amino-2-deoxy-d-glucopyranose units. However, a molecule is only considered to be chitosan when more than 50% of the polymer residues are 2-amino-2-deoxy-d-glucopyranose units [19]. Chemical deacetylation of the chitin obtained from crustaceans is the best-known method to obtain chitosan [20]. Some species of fungi naturally synthesize chitosan, mainly the species belonging to the class Zygomycetes, and it can be extracted from their cell walls [21]. Therefore, the terms “fungal chitosan” and “animal chitosan” are used to differentiate the two sources of chitosan [22].
Animal chitosan is the most commercially used type of chitosan owing to the high yield obtained from its extraction process, which is approximately 2–3 times greater than that of the fungal chitosan. However, during the processing and purification of animal chitosan, large amounts of chemical reagents are used, which increase the production cost and lower the yield of the extracted chitosan [23,24]. In addition, animal chitosan depends on seasonal factors in the region from where the crustacean is obtained, which makes it difficult to standardize its implementation on an industrial scale [25]. The allergenicity of some proteins such as tropomyosin and arginine kinase, which accumulate residually in the chitosan molecule when it is not purified correctly, limit the use of these chitosan molecules in the food and medical industries [26,27,28]. The deproteinization processes of animal chitosan require the use of strong acids and bases, which increase the production cost and cause environmental damage owing to the generation of a large amount of industrial waste [29]. These types of problems are not reported during the extraction of fungal chitosan [24].
Fungal chitosan is already being produced and marketed by several companies in different countries, such as Belgium, Canada, and the United States, for medical and/or pharmaceutical applications [30]. Several studies have demonstrated the potential of fungal chitosan to act as an antifungal [31], antibacterial [32], antiparasitic [33,34], and anticancer agent [35]. However, despite the ecological advantages associated with its production as well as its non-allergenic nature, fungal chitosan is not used more widely than animal chitosan because of its lower yield. Therefore, efforts have been made to increase its consumption, discover novel species of chitosan-producing fungi, and increase the productivity, extraction, purification, and identification of novel types of fungal chitosan and their derivatives.
Within this context, one potential candidate is the fungus Rhizopus arrhizus. R. arrhizus produces significantly higher amounts of chitosan than other fungi, such as Aspergillus niger, Zygosaccharomyces rouxii, and Candida albicans [36]. In addition, chitosan from this fungus has a much smaller molecular mass (~5.2 kDa) [37] than that from other fungi, which suggests that it may exhibit differential activities from other chitosan molecules. The fungi from Zygomycetes (same class as R. arrhizus) are known for being easy-to-handle, fast-growing on different substrates, and resistant to extreme environmental conditions [38,39,40]. These unset characteristics make R. arrhizus chitosan a promising candidate for different types of studies.
However, the antioxidant activity of fungal chitosan has not yet been evaluated. Queiroz et al. (2019) demonstrated that it is possible to increase the antioxidant activity of animal chitosan by conjugating it with gallic acid (GA) [41]. Therefore, this study aimed to obtain fungal chitosan from R. arrhizus, conjugate it with GA, and evaluate the antioxidant activities of the native and modified chitosan molecules to understand their potential to combat oxidative stress.
2. Materials and Methods
2.1. Procuring the Fungal Strain and Production of Chitosan
Soil samples were collected from 10 different points in the Estação Ecológica do Sérido reserve, under the license number 36672-1 SISBIO/ICMBio. This reserve is in the southwest region of the state of Rio Grande do Norte, Brazil (06°35′ S and 06°40′ S; 37°20′ W and 37°39′ W). This conservation unit is in the caatinga biome, a region with high temperatures and low rainfall, with a total extension of 1123.59 hectares, exhibiting vast environmental diversity. The sampling areas were randomly selected and marked by the Global Positioning System (GPS). The isolation was performed using the Sabouraud agar medium (KASVI, São José dos Pinhais, PR, Brazil) and incubated in an oven at 28 °C, according to a previously described method [42]. Figure 1 shows several structures of the fungus R. arrhizus.

Figure 1.
Morphology of R. arrhizus. (A,B). Sporangiophore with sporangium and rhizoid. (C). Sporangiophore with sporangium. (D). Sporangiophore with columella. (E). Rhizoid. (F). Sporangiospores. Scale bars: (A,B) = 100 μm, (C–E) = 50 μm, (F) = 20 μm.
2.2. Molecular Identification
Genomic DNA was extracted from the mycelium growing on the potato dextrose agar (PDA) at 28 °C for 72 h using the cetyltrimethylammonium bromide (CTAB) DNA Extraction Protocol, as adapted from previously described methods [43]. The ribosomal DNA ITS1-5.8S-ITS2 and large subunit (LSU) regions were amplified by polymerase chain reaction (PCR) on a Peltier PTC100® Thermocycler (MJ Research, Inc., Hampton, NH, USA) in a total volume of 25 μL of the sample. The rDNA internal transcribed spacer (ITS) regions were amplified using the primers, ITS1 (5′-TCCGTAGGTGAACCTGCGG-3′) and ITS2 (3′-GCTGCGTTCTTCATGAGC-5′) [44]. The D1/D2 LSU region of the rDNA was sequenced using primers NL1 (5′-GCATATCAATAAGCGGAGGA-3′) and NL4 (5′-GGTCCGTGTTTCAAGACGGGTCG-3′). The amplicons were purified using the PureLink-PCR Purification Kit C/50rxn Columns (Invitrogen, Waltham, MA, USA) and sequenced by ACT Gene Molecular Analyses (Alvorada, RS, Brazil) [45]. The identified copies were then cataloged into the Culture Bank of the Federal University of Pernambuco, Recife, PE, Brazil and kept in solid PDA medium at pH 5.5 (N° URM 8111).
2.3. Chitosan Extraction
After isolating and identifying the strains, we performed the chitosan production test. R. arrhizus. The spores were collected and stored in 15 mL of sterile distilled water (standard solution). Approximately 105 spores/mL of the standard solution were then added to 400 mL of the yeast extract peptone dextrose (YPD) medium (Yeast Extract 10 g; Peptone 20 g; Dextrose 20 g per liter) and incubated at 28 °C for 96 h in a static mode. The biomass was filtered and lyophilized, and chitosan was extracted according to the previously described method [46], with some modifications [47]. The sample was named Chit-F.
2.4. Physicochemical Characterization of the Chitosan Molecule
2.4.1. Determination of Molecular Weight
The apparent molecular weight of samples was determined by HPLC (High-Performance Liquid Chromatography) Accela (Thermo scientific, Waltham, MA, USA) com coluna Waters ultragel 250 (EUA, Milford, MA, USA) acoplada. The samples were eluted with sodium nitrite 0.1 M, at a flow rate of 1 mL/min 30 °C for10 min. The column was calibrated using different dextrans (3; 6; 40; 70 and 100 kDa) purchased from Sigma (St. Louis, MO, USA).
2.4.2. Measurement of the Protein and Phenolic Compounds
The protein content was quantified using the Coomassie brilliant blue reagent and bovine serum albumin as previously described [48]. The content of the phenolic compounds was measured by the Folin–Ciocalteu reagent as previously described [49]. The Folin–Ciocalteu procedure was used to evaluate the GA fungal chitosan.
2.4.3. Conjugation of GA and Chit-F
First, 500 mg of Chit-F was dissolved into 10 mg/mL of acetic acid in water solution (2% v/v). Then, 1 mL of 1 M hydrogen peroxide (H2O2) and 0.054 g ascorbic acid were added to this solution. After 30 min, 1.4 mmol GA was introduced to the reaction and incubated for 24 h, at room temperature. The solution was then centrifuged using Amicon® Ultra-15 centrifugal filter (Millipore, Burlington, MA, USA) with 3 kDa cut-off until all unreacted GA was removed [41,50]. The GA conjugated Chit-F solution was named “Chit-FGal,” and it was frozen and lyophilized until future use.
2.4.4. Fourier Transformed Infrared Spectroscopy (FTIR) and Degree of Deacetylation (DD)
A Nexus 470 ESP FTIR spectrometer (Thermo Nicolet, Madison, WI, USA) was used to obtain the infrared spectra between 500 and 4000 cm−1 of a tablet containing potassium bromide (KBr) mixed with different samples (5 mg). Thirty-two scans at a resolution of 4 cm−1 were evaluated and referenced against air. DD was determined using Equation (1):
DD (%) = 100 − [(A1655/A3450) × 115]
2.4.5. Nuclear Magnetic Resonance (NMR) Spectroscopy
The samples (50 mg) were dissolved in 800 µL of acidified deuterium oxide (D2O). NMR spectra (1H) were obtained in a Bruker Avance III HD 600 MHz spectrometer (Bruker BioSpin Corporation, Billerica, MA, USA) equipped with a 5 mm inverse quadruple resonance probe (QXI) at 70 °C. The chemical shifts were expressed in δ relative to trimethylsilylpropanoic acid (TMSP) at δ = 0.00, in accordance with the International Union of Pure and Applied Chemistry (IUPAC) recommendations.
2.4.6. Scanning Electron Microscopy (SEM) Analysis
The chitosan samples were processed and analyzed by SEM (Shimadzu Electron microscope, model SSX550; Shimadzu Corp., Kyoto, Japan). Briefly, 20 μL of each chitosan (0.5 mg/mL) sample was loaded onto a carbon-coated copper grid without gold coating and air-dried for 10 min under vacuum. The grid chamber was then placed in the SEM room and incubated in the dark at 10–20 °C for 2 h. Representative images of each of the three independent experiments are shown.
2.5. Antioxidant Activity
2.5.1. Copper Chelation
The copper chelation test was performed as described previously [51]. Briefly, 96-well microplates with a reaction mixture containing different concentrations of samples (0.1–2 mg/mL), pyrocatechol violet (4 mM) and copper II sulfate pentahydrate (50 mg/mL) were homogenized with the aid of a micropipette, and the absorbance of the solution was measured at 632 nm using a microplate reader (SpectraMax® M2/M2e, Molecular Devices, São José, CA, USA).
2.5.2. Determination of Total Antioxidant Capacity
The determination of the total antioxidant capacity assay was carried out as described previously [52]. It is based on the reduction of molybdenum (Mo) (VI) to Mo (V) by the sample and the subsequent formation of a phosphate green complex/Mo (V) at an acidic pH. Tubes containing the chitosan and reagent solution (0.6 M sulfuric acid, 28 mM sodium phosphate, and 4 mM ammonium molybdate) were incubated at 95 °C for 90 min. After the mixture had cooled to room temperature, the absorbance of each solution was measured at 695 nm using a microplate reader (SpectraMax® M2/M2e, Molecular Devices, São José, CA, USA). Total antioxidant capacity was expressed as the ascorbic acid equivalent.
2.6. Cell Culture Experiments
2.6.1. Cytotoxicity Assay
The cytotoxicity assay was performed using the 3-(4,5-dimethylthiazol-2-yl)-2,5-diphenyltetrazolium bromide (MTT) method as previously described [53]. The fibroblast cells (3T3 ATCC CCL-92) were cultured in culture flasks in the Dulbecco’s modified Eagle medium (DMEM) medium with 10% (v/v) fetal bovine serum (FBS), 100 μg/mL streptomycin, and 100 IU/mL penicillin (Sigma, St. Louis, MO, USA). The cells were cultured in sterile 96-well plates at a density of 5 × 10³ cells/well and incubated at 37 °C and 5% carbon dioxide (CO2) for 24 h. After this period, the medium was exchanged with serum-free DMEM to synchronize the cells in the G0 phase (active cells do not enter into any cell cycle stage). The cells were kept in this medium for 24 h. Afterward, the medium was removed and another medium containing 10% FBS and different concentrations of the samples (50, 100, 250, and 500 μg/mL) were added. After 24 h of incubation, the cell traces were removed by washing the cells with phosphate-buffered saline (PBS). Then, a serum-free culture medium containing 12 mM MTT (Sigma, St. Louis, MO, USA) was added to the samples to determine the ability of the cells to reduce MTT. The cells were then incubated at 37 °C and 5% CO2 for 4 h. To solubilize the reduced MTT product, 100 µL of ethyl alcohol was added to each well and thoroughly mixed using a multichannel pipettor. After 15 min of the addition of alcohol, the absorbance at 570 nm was read using a microplate reader (Thermo Labsystems, Franklin, MA, USA).
2.6.2. Induced Oxidative Stress Assay
The 3T3 fibroblast cells (1 × 10⁶ cells/mL) were plated in 6-well plates in the presence of DMEM supplemented with 10% FBS. After 24 h, these plates were washed with PBS (Phosphate-Buffered Saline) and the DMEM medium supplemented with FBS (10%) containing Chit-F and Chit-FGal (50, 100, and 250 μg/mL) was added. Then, 0.06 mM H2O2 was added to the wells to induce oxidative stress. The plates were kept under growth-inducive conditions (37 °C, 5% CO2, protected from light) for 6 h. Then, the medium was replaced with the DMEM medium with 10% FBS. After 24 h, the cells were evaluated by the MTT assay as previously described [54].
2.6.3. Nuclear Morphology
The 3T3 cells were subjected to the same experimental conditions as described in Section 2.4.2. After, the cells were washed with PBS and fixed with 4% paraformaldehyde in PBS for 30 min at room temperature. After washing twice with PBS, cells were maintained in PBS containing 0.1% Triton X-100 at room temperature for 30 min. Fixed cells were washed with PBS and stained with DAPI (4′,6-diamidino-2-phenylindole) (1 μg/mL) solution for 30 min at room temperature. Nuclear morphology of cells nuclei was examined under a fluorescent microscope (TE-Eclipse 300, Nikon, Melville, NY, USA). Data presented are representative of those obtained in at least three independent experiments carried out.
DAPI staining was also used to quantify cell nuclei (normal/condensed/fragmented). Images were captured from ten different fields and about 100 cells were counted for each field on UV microscopy and analyzed using the NIS-Elements AR analysis software version 4.00.03 (Nikon Instruments Inc., Melville, NY, USA, 2011). Counting was carried out in three independent experiments for each sample.
2.7. Statistical Analysis
At least three independent experiments were performed for each test. All data are presented as the mean ± standard deviation (n = 3). The analysis of variance (ANOVA) test was performed to check the difference between the results. The Student–Newman–Keuls test (p < 0.05) was used to determine the similarities found by ANOVA. All the tests were performed using the GraphPad Prism 5 software (GraphPad Softwares, San Diego, CA, USA).
3. Results and Discussion
3.1. Obtaining Fungal Chitosan and Determining Its Yield
The yield of chitosan obtained from the dry biomass of R. arrhizus was 22.53 mg of chitosan/g of fungus. This value is similar to the yield (26 mg/g) of chitosan obtained from the dry masses of the fungi, Syncephalastrum racemosum [55] and Pleurotus ostreatus (24 mg/g) [56], but lower than the yield (37.7 mg/g) obtained from the fungus, Agaricus bisporus [56].
However, it is possible to increase the amount of chitosan obtained from a specific fungal species by changing the composition of its growth medium. Berger et al. (2020) cultivated two species of fungi, Cunninghamella elegans UCP 1306 and Cunninghamella phaeospora UCP 1303, in different media containing different percentages of cashew apple juice (CAJ) and cheese whey (CW) [57]. After the extraction of chitosan, they observed that the two fungi produced a greater amount of chitosan in the presence of higher levels of CAJ and CW. C. elegans UCP 1306 was more efficient as the yield of chitosan obtained from it ranged from 6.9 mg/g (in a medium without any additives) to 64.4 mg/g (in the presence of 40% (v/v) of CAJ and 30% (v/v) of CW).
There was only one other study that determined the yield of chitosan extracted from R. arrhizus [24]. In that study, the authors obtained a chitosan yield of 29.3 mg/g, which is slightly higher than the yield obtained in our study. However, in this study, the fungi grew in a medium enriched with steep liquor and honey. These data indicate that R. arrhizus can produce greater amounts of chitosan depending on the composition of the medium in which it is grown. Therefore, future studies can evaluate the yield of chitosan obtained from this fungus when cultivated in different media.
3.2. Chitosan Characterization
3.2.1. Degree of Deacetylation (DD)
The DD% is a crucial property of chitosan, which indicates the number of amine groups in the molecule, especially on the second carbon. The greater the amount of amine, the greater the range of applications and the possibility of chemical modifications that can be performed in chitosan [58,59]. The DD found in the chitosan extracted from R. arrhizus was 85.66% ± 0.57, which classifies this molecule as a chitosan suitable for biomedical use, as the chitosan with DD ranging from 75–85% is considered to be good for medical applications [60]. The R. arrhizus chitosan DD value described here was higher than that presented by [57] for the chitosan obtained from the same fungus, in which case the DD was equal to 70.5%. This difference in both studies was probably due to the cultivation of fungi in different media. The DD described here is similar to the values described for the chitosan extracted from other fungi of the genus Rhizopus, including the DD of 85.2% of the chitosan extracted from Rhizopus stolonifer [61] and DD of 86.2% of the chitosan extracted from the fungus Rhizopus oryzae [62]. This indicates that chitosan from fungi of the Rhizopus genus has a DD that gives them the potential to be used for biomedical applications. However, further studies with chitosan from other fungal species of the genus Rhizopus need to be performed to confirm this observation.
3.2.2. Quantification of Proteins, Phenolic Compounds, Apparent Molecular Weights, and Yield of Chemically Modified Chitosan with GA
The data presented above and the infrared and NMR analysis (Section 3.2.3 and Section 3.2.4, respectively) confirmed that the compound obtained from R. arrhizus was chitosan. Then, this chitosan was conjugated with GA as described in the methods section.
Figure 2 shows the main steps in the synthesis of Chit-FGal. In aqueous media, ascorbic acid is oxidized by peroxide, forming ascorbate and hydroxyl radical. The last one starts attacking Chit-F leading to the formation of macroradicals, which are chitosan molecules that have regions with unpaired electrons (therefore, they are also reactive species) that act as entry points for GA [50]. The second step is the addition of GA in the reaction. In this step, a carboxyl group present in GA reacts with the entry points in the macroradicals, leading to the formation of a covalent bond and synthesis of Chit-FGal.

Figure 2.
Scheme of the conjugation process of gallic acid (GA) and fungal chitosan (Chit-F). Step 1 is the addition of the redox pair and the formation of macroradicals. The red circle shows the radical. Step 2 is the addition of GA to the solution and the formation of the conjugated molecule. The blue circle shows the position of linked gallic acid. R—GA or hydrogen.
The conjugation of phenolic compounds to polysaccharides was first reported by Domnina et al. [63]. However, a simple, efficient, and environment-friendly method to perform this type of conjugation was only developed in 2009 [50]. This method is very efficient and environmentally friendly as it does not induce the generation of any toxic waste, only producing ascorbic acid, H2O2, and GA. Furthermore, this method only has a few steps, making it a feasible alternative to other polysaccharide modification methods [50]. Therefore, it was the method chosen in this study for the conjugation of Chit-F with GA.
After the conjugation with GA, the fungal chitosan was called Chit-F, and the chitosan conjugated with GA was called Chit-FGal. We analyzed the two molecules for their content of phenolic compounds and proteins (See Table 1).

Table 1.
Quantification of total proteins and phenolic compounds and determination of their apparent molecular weights.
The presence of proteins was not detected in any of the two evaluated samples (Chit-F and Chit-FGal), which shows that chitosans are free of this contaminant. Phenolic compounds were not detected in Chit-F, but approximately 4% was found in Chit-FGal, which is four times more than that in Chit-F, thereby indicating the success of the conjugation process with GA.
The apparent molecular mass of the two samples was also determined (Table 1). Chit-F had an apparent molecular mass of 3 kDa. This value resembles that of the R. arrhizus chitosan (5.2 kDa) described by [37]. No other articles were found that evaluated the molecular mass of chitosan from fungi of Rhizopus, except for Rhizopus oryzae. However, the chitosan of this fungus is much larger than that of R. arrhizus. Different authors reported molecular mass values greater than 100 kDa [64,65], 200 kDa [66], and 300 kDa [62] for the chitosan from R. oryzae. This small molecular mass of chitosan from R. arrhizus is considered a positive characteristic as it allows it to be used in applications different from those with a high molecular mass, thereby preventing any possible market competition with high molecular mass chitosan.
The Chit-FGal sample had an apparent molecular mass of 3.6 kDa, representing a yield rate of 200 mg of GA/g of the sample. This increase in mass after the conjugation process with GA was approximately 50% higher than those obtained by [67,68], which used high molecular weight animal chitosan to obtain a conjugation yield with GA of 118 mg of GA/g and 128 mg GA/g, respectively. This greater conjugation of GA molecules with Chit-FGal may be related to their molecular masses. According to Liu et al. (2013), high molecular mass chitosan tends to give more viscous solutions, which makes it difficult for the H2O2 to attack chitosan and inhibits the formation of binding points for GA [68]. Therefore, the larger the chitosan, the less efficient this process is and vice versa.
3.2.3. FTIR Spectrum of Chit-F and Chit-FGal
The infrared spectra of native chitosan (Chit-F) and gallic acid conjugated chitosan (Chit-FGal) are shown in Figure 3.

Figure 3.
Fourier transformed infrared spectroscopy (FTIR). Chit-F (black) and fungal chitosan-gallic acid (Chit-FGal) (red) spectra. These spectra are representative of three independently performed analyses.
The infrared spectrum of both Chit-F and Chit-FGal presented bands found in chitosan [69,70]. The bands in the regions 642 cm−1 and 651 cm−1 indicate the presence of NH2 groups, whereas those in 1016 cm−1 and 1083 cm−1 represent the stretches of the CO bonding, and those between 1400 cm−1 and 1404 cm−1 represents the folding of CH2. The bands observed in 3167 cm−1, 3280 cm−1, and 3444 cm−1 represent NH and OH stretching and intramolecular hydrogen bonds of the water molecules of the solvation layer and bands described in other papers [71,72,73,74].
Chit-FGal presented two different bands, which indicate the covalent binding of GA to the native chitosan molecule. In the 1556 cm−1 region, there is a band indicating the presence of a C=O group of the amide formed when GA binds to the NH2 region. In the region between 1637 cm−1 e 1691 cm−1, the bands indicate the stretching of the C=O of the secondary amide formed when GA was covalently bound to the amino group. These bands appear only in the Chit-FGal spectrum, showing that there was a modification of the chitosan sample due to its covalent bond with GA. These bands that indicate the presence of GA were also described by other authors who promoted the conjugation of GA with animal chitosan [41] and beta-glucan [75], which confirms the conjugation of GA with fungal chitosan.
3.2.4. NMR Analysis
The samples were subjected to NMR analysis, and the 1H-NMR spectra of Chit-F and Chit-FGal are shown in Figure 4.

Figure 4.
Proton-nuclear magnetic resonance (1H-NMR) spectra of Chit-F and Chit-FGal. (A) Chit-F spectra (B) Chit-FGal spectra (C) 7.57 Chit-FGal sign highlighted indicates regions where aromatic compounds are found. These spectra are representative of three independently performed analyses.
Both samples show typical signs of chitosan [41,76,77,78]. In the region ranged from 3.90 to 4.45 ppm, the signals referring to the hydrogens 2, 3, 4, 5, and 6 of the aldohexoses overlap, and therefore it was impossible to identify them separately. On the other hand, the signals of the two anomeric hydrogens of 2-amino-2-deoxy-D-glucopyranose (glucosamine) and 2-acetamido-2-deoxy-D-glucopyranose (N-acetyl-glucosamine) at 5.25 and 5.01 ppm, respectively, are clearly identified. In addition, the signal at 3.56 ppm corresponds to glucosamine H2 (D), and at 2.45 ppm, there is a signal from methyl group of N-acetyl-glucosamine (H-AC).
The 7.57 signal was found only in the Chit-FGal spectrum. According to Queiroz et al. [41], signals between 7.00 and 9.00 ppm indicate regions where aromatic compounds are found, which indicates a covalent bond between chitosan and GA. This signal has also been described in other polysaccharides that have been conjugated to GA, such as animal chitosan [41,68,79] and glucans [75].
3.2.5. SEM Analysis
The SEM images of the chitosans are shown in Figure 5. It is possible to observe that the Chit-F structure is less dense and compact, with an accentuated presence of pores and flake aggregates. Chit-FGal, on the other hand, presented a denser and more compact structure, a result similar to that found by Berger et al. [37] when performing SEM on chitosan extracted from Cunninghamella elegans.
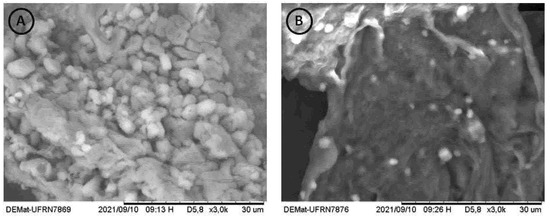
Figure 5.
Microbiological biopolymers from R. arrizhus URM 8111—SEM electromicrographies of (A) Chit-F at 3000× magnification, (B) Chit-FGal at 3000× magnification. The measurement bar = 30 µm. Each short section corresponds to 3 µm.
As already reported in the literature, fungal chitosans did not show the microfibrillar structure in SEM, thus differentiating itself from chitin [80]. Both Chit-F and Chit-FGal did not show microfibrillar structure, confirming once more that it is chitosan and that modification occurred.
3.3. In Vitro Antioxidant Activity
3.3.1. Copper Chelating Activity
Figure 6 shows the result of the copper chelating capacity of Chit-F and Chit-FGal. Both Chit-F and Chit-FGal (0.5 mg/mL) demonstrated low copper chelating capacity, approximately 20%, which shows that the conjugation did not enhance the chelating activity of the fungal chitosan. In fact, at the concentration of 0.25 mg/mL, the presence of GA caused the chelating activity of Chit-FGal to be significantly lower than that of Chit-F. This behavior has already been reported [41]. When animal chitosan was conjugated with GA, we observed significantly lower copper chelating activity, at low concentrations (from 0.015 to 0.25 mg/mL), than unconjugated chitosan. However, at higher concentrations (from 0.5 mg/mL), there was no significant difference between the activities of the two chitosan [41]. Previous data indicate an affinity of copper with chitosan due to the amine and hydroxyl (OH) grouping of carbon 3 [81,82,83]. As these two groups are entry points for GA (Figure 1), they are in less quantity in Chit-FGal, which justifies their lower chelating activity. However, when there was an increase in Chit-FGal, these deficiencies are overcome, and Chit-FGal showed activity similar to that of Chit-F.
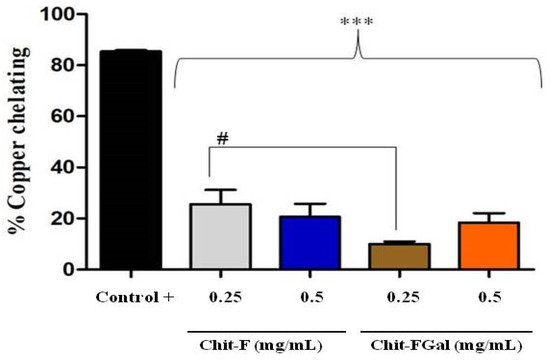
Figure 6.
Chit-F and Chit-FGal copper chelation. The copper chelation tests were performed with GA at a concentration of 0.5 mg/mL, which did not show copper chelation activity under the evaluated conditions. *** indicates the significant difference between the controls and samples (p < 0.05). # indicates the significant difference between the same concentrations of different samples (p < 0.05).
3.3.2. Total Antioxidant Capacity (TAC)
The TAC test assesses the ability of the sample to donate electrons to a reactive species. The greater this capacity, the greater is the probability of the sample to combat oxidative damage caused by reactive species. As shown in Figure 5, Chit-F had total antioxidant activity equivalent to 50 mg of ascorbic acid (AA)/g of sample, which means that 1 g of native Chit-F has the same activity as 50 mg of AA, the standard test substance. When conjugated with gallic acid (Chit-FGal sample), the total antioxidant capacity of chitosan increased approximately 3-fold to 125 mg AA/g sample (Figure 7).
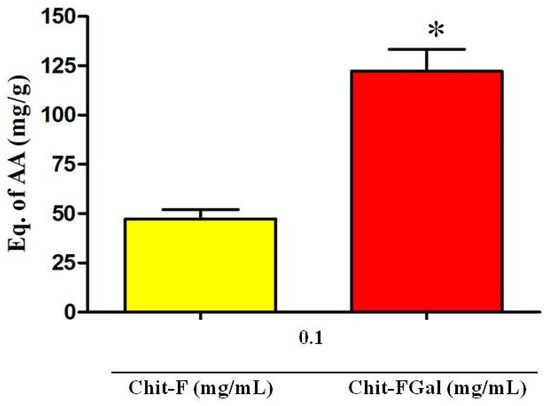
Figure 7.
Total antioxidant capacity (TAC) test of Chit-F and Chit-FGal. * indicates significant difference between the samples (p < 0.05).
This increase in Chit-FGal activity appears to be related to the amount of GA inserted into the molecule. This idea corroborates the finding that the GA-conjugated animal chitosan synthesized by [50], which had 7 mg GA per g of Chit, showed TAC of 5 mg AA/g. However, additional data referring to other GA-conjugated chitosan may confirm this observation.
3.4. Evaluation of Chit-FGal Antioxidant Activity under Different Cell Culture Conditions
As observed in the TAC assay, Chit-FGal had higher antioxidant activity than Quit-F. To confirm whether this activity was also observed in more complex conditions, we choose a model of culture of cells under stress conditions. Stress conditions can be introduced in the culture by the addition of various reagents, such as iron sulfate, copper sulfate [51], and H2O2 [54]. As Quit-FGal was much more effective in the test that assesses the electron-donating capacity (TAC) than the iron chelation test, we chose to induce cell stress with H2O2 and evaluate the cytoprotective capacity of Chit-FGal against this stressful condition.
Initially, to exclude any toxic effect of Chit-FGal, the cells were incubated with different concentrations of this chitosan for 24 h. In Figure 8, it is possible to observe that the cytoprotective capacity of the 3T3 cells treated with Chit-FGal was not affected in any of the conditions evaluated. This result indicates that Chit-FGal has no cytotoxic action.
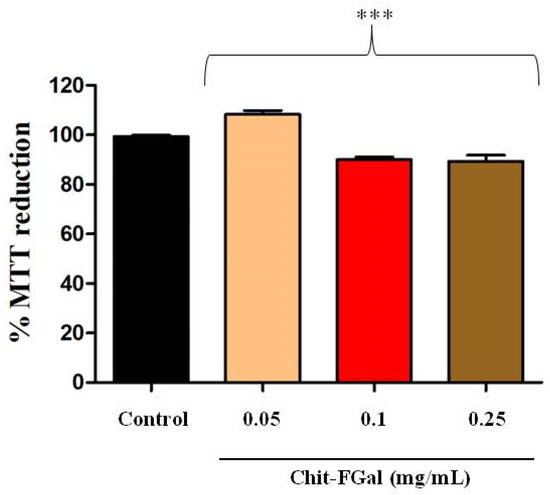
Figure 8.
3-(4,5-Dimethylthiazol-2-yl)-2,5-diphenyltetrazolium bromide (MTT) reducing activity of the 3T3 fibroblast cells incubated with Chit-FGal for 24 h. Values are expressed as the mean ± standard deviation at concentrations of 0.05, 0.1, and 0.25 mg/mL. *** indicates the significant difference between the control and samples (p < 0.05).
As Chit-FGal did not show any cytotoxicity, we evaluated its ability to protect cells from oxidative damage caused by H2O2 (See Figure 9). We found that H2O2 (0.06 M) promoted a 50% decrease in the abilities of these cells to reduce MTT, which indicates cytotoxicity. However, the cells exposed to Chit-FGal, regardless of concentration, reduced MTT significantly more than the cells that were not exposed to peroxide. This result indicates that Chit-FGal protected the cells from oxidative damage.
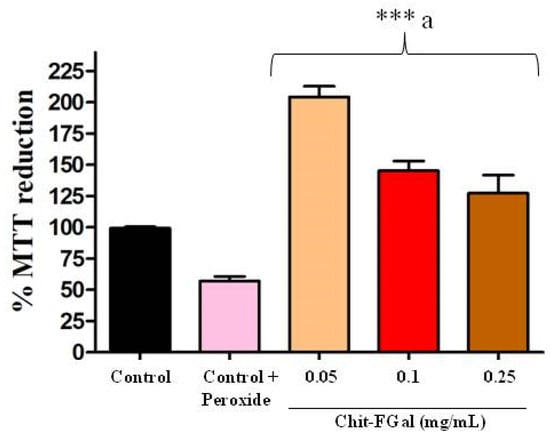
Figure 9.
MTT reducing activity of the 3T3 fibroblast cells incubated with Chit-FGal and hydrogen peroxide (H2O2) for 6 h. Values are expressed as the mean ± standard deviation at concentrations of 0.05, 0.1, and 0.25 mg/mL. *** indicates the significant difference between the control and samples (p < 0.05). a indicates significant difference between the control + peroxide and the tested samples (p < 0.05).
When cells were exposed to Chit-FGal (0.05 mg/mL), their ability to reduce MTT was twice more than that observed in the control group. Chit-FGal (0.05 mg/mL) also promoted a greater reduction in MTT (See Figure 9). The data suggest that a low concentration of Chit-FGal activates the intracellular oxide reductase enzymes and/or stimulates the proliferation of cells. However, this needs to be assessed further in future studies.
To confirm the effect of Chit-FGal in the MTT tests, 3T3 cells were exposed to stress conditions in the presence of Chit-FGal, and nuclear DAPI staining was performed. As shown in Figure 10, nuclei with condensed chromatin of different sizes containing well-preserved but compacted cytoplasmic organelles and/or nuclear fragments were observed in H2O2 treated 3T3 cells, whereas the cells treated with different amounts of Chit-FGal did not show these morphological alterations. The cells were counted and the percentage of cells with chromatin condensation or nuclear fragmentation in each image (see the Experimental Section) was used to produce Figure 10F. The findings showed that Chit-FGal protects cell nuclei from damage caused by hydrogen peroxide.
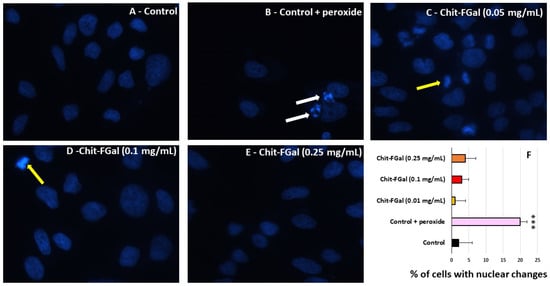
Figure 10.
Morphological changes of 3T3 cells incubated with Chit-FGal and hydrogen peroxide (H2O2) for 6 h followed by DAPI staining. (A) Fluorescence microscope photographs of untreated cells; (B) cells treated with H2O2; (C) cells treated with 0.05 mg/mL Chit-FGal + H2O2; (D) cells treated with 0.1 mg/mL Chit-FGal + H2O2; (E) cells treated with 0.25 mg/mL Chit-FGal + H2O2; (F) DAPI staining quantification—Images were captured from ten different fields and about 100 cells were counted for each field. White arrows indicate nuclear fragmentation and/or chromatin condensation. Yellow arrows indicate cell division. Magnification ×400. *** indicates the significant difference between the control and samples (p < 0.05).
According to Gutteridge and Halliwell 2010, the events of ROS generation via the Fenton and Haber–Weiss reactions start with the accumulation of superoxide and H2O2, resulting in a chemical imbalance and leading to the formation of more products. The interaction of peroxide with Fe2+ (mainly) or Cu+ leads to the formation of the hydroxyl radical (OH−) [84], which can cause significant damage to organisms, eventually resulting in various diseases such as cancer, diabetes, and Parkinson’s disease as well as aging. Therefore, by exhibiting copper chelating activity and TAC, in addition to protecting cells against stress caused by H2O2, Chit-FGal shows potential in decreasing the generation of ROS, thereby preventing excessive damage, and decreasing the risk of various diseases.
4. Conclusions
In the present study, we successfully isolated chitosan (Chit-F) from the fungus, R. arrhizus. The isolated Chit-F possessed a low molecular weight and a high degree of deacetylation and was free of phenolic compounds and proteins. We also demonstrated the possibility of chemically modifying this fungal chitosan molecule via a redox system with H2O2 and ascorbic acid to form Chit-FGal. This novel chitosan molecule (Chit-FGal) exhibited an antioxidant activity (ability to donate electrons) that was twice as high as that of the unmodified chitosan. Furthermore, Chit-FGal was able to protect 3T3 fibroblast cells from oxidative stress caused by H2O2. In summary, the results of our study indicate that Chit-FGal may be a promising molecule to combat oxidative stress.
We intend in the future to make a better structural characterization of Chit-FGal, including indicating the places where the gallic acid is covalently linked to the molecule. In addition, we intend to evaluate Chit-FGal as an antioxidant agent using different in vivo models, as well as to identify its antioxidant action mechanism.
Author Contributions
Conceptualization, W.S.P. and H.A.O.R.; Formal analysis, W.S.P., M.F.Q., D.A.S., A.C.L.B. and H.A.O.R.; Funding acquisition, G.L.S., A.C.L.B. and H.A.O.R.; Investigation, W.S.P., M.F.Q., D.A.S. and A.L.C.M.A.S.; Methodology, D.A.S.; Project administration, H.A.O.R.; Resources, G.L.S., A.C.L.B. and H.A.O.R.; Writing—original draft, W.S.P.; Writing—review & editing, W.S.P. and H.A.O.R. All authors have read and agreed to the published version of the manuscript.
Funding
This research was funded by CAPES, grant number CIMAR 2014 and the APC was funded by Federal University of Rio Grande do Norte.
Institutional Review Board Statement
Not applicable.
Informed Consent Statement
Not applicable.
Acknowledgments
The authors wish to thank Coordenação de Aperfeiçoamento Pessoal de Nível Superior-CAPES and Ministério de Ciência, Tecnologia, Informação e Comércio—MCTIC for the financial support. Hugo Rocha and Guilherme Sassaki are CNPq fellowship honored researchers. Weslley Paiva a Ph.D. scholarship from CAPES, D. Sabry received an Ms.C. and Ph.D. scholarship from CNPq and currently has a post-doctoral fellowship from PNPD-CAPES, and Moacir Queiroz had a Ph.D. scholarship from CAPES. The authors would like to thank the Department of Biochemistry at Federal University of Rio Grande do Norte for letting us to use the cell culture room. We also thank to Federal University of Rio Grande do Norte and to Federal University of Paraiba (UFPB), Bananeiras, Paraiba, for being of great importance for the execution of the research.
Conflicts of Interest
The authors declare no conflict of interest.
References
- Mehdipour, M.; Taghavi Zenouz, A.; Bahramian, A.; Gholizadeh, N.; Boorghani, M. Evaluation of serum nitric oxide level in patients with oral lichen planus. J. Dent. 2014, 15, 48–51. [Google Scholar]
- Hashemy, S.I.; Gharaei, S.; Vasigh, S.; Kargozar, S.; Alirezaei, B.; Keyhani, F.J.; Amirchaghmaghi, M. Oxidative stress factors and C-reactive protein in patientswith oral lichen planus before and 2 weeks after treatment. J. Oral Pathol. Med. 2016, 45, 35–40. [Google Scholar] [CrossRef] [PubMed]
- Birben, E.; Sahiner, U.M.; Sackesen, C.; Erzurum, S.; Kalayci, O. Oxidative stress and antioxidant defense. World Allergy Organ. J. 2012, 5, 9–19. [Google Scholar] [CrossRef]
- Lushchak, V.I. Free radicals, reactive oxygen species, oxidative stress and its classification. Chem. Biol. Interact. 2015, 87, 11–18. [Google Scholar] [CrossRef] [PubMed]
- Vezzani, A.; Dingledine, R.; Rossetti, A.O. Immunity and inflammation in status epilepticus and its sequelae: Possibilities for therapeutic application. Expert Rev. Neurother. 2015, 15, 1081–1092. [Google Scholar] [CrossRef] [PubMed]
- Pauletti, A.; Terrone, G.; Shekh-Ahmad, T.; Salamone, A.; Ravizza, T.; Rizzi, M.; Pastore, A.; Pascente, R.; Liang, L.P.; Villa, B.R.; et al. Targeting oxidative stress improves disease outcomes in a rat model of acquired epilepsy. Brain 2017, 1, 1885–1899. [Google Scholar] [CrossRef] [PubMed]
- Perez, M.; Robbins, M.E.; Revhaug, C.; Saugstad, O.D. Oxygen radical disease in the newborn, revisited: Oxidative stress and disease in the newborn period. Free Radic. Biol. Med. 2019, 142, 61–72. [Google Scholar] [CrossRef]
- El-Azem, N.; Pulido-Moran, M.; Ramirez-Tortosa, C.L.; Quiles, J.L.; Cara, F.E.; Sanchez-Rovira, P.; Granados-Principal, S.; Ramirez-Tortosa, M. Modulation by hydroxytyrosol of oxidative stress and antitumor activities of paclitaxel in breast cancer. Eur. J. Nutr. 2019, 58, 1203–1211. [Google Scholar] [CrossRef]
- Nakhjavani, M.; Morteza, A.; Khajeali, L.; Esteghamati, A.; Khalilzadeh, O.; Asgarani, F.; Outeiro, T.F. Increased serum HSP70 levels are associated with the duration of diabetes. Cell Stress Chaperones 2010, 15, 959–964. [Google Scholar] [CrossRef]
- Rosa, E.C.C.C.; Santos, R.C.C.; Gris, E.F.; Ferreira, E.A.; Neves, F.A.R.; Coelho, M.S.; Amato, A.A. Avaliação do Estresse oxidativo e Lipoperoxidação (LPO) em pacientes com diabetes mellitus tipo 2 (DM2) tratados no Hospital Universitário de Brasília (HUB). Braz. J. Health Rev. 2019, 2, 4236–4256. [Google Scholar] [CrossRef]
- Blesa, J.; Trigo-Damas, I.; Quiroga-Varela, A.; Jackson-Lewis, V.R. Oxidative stress and Parkinson’s disease. Front. Neuroanat. 2015, 9, 1–9. [Google Scholar] [CrossRef]
- Bose, A.; Beal, M.F. Mitochondrial dysfunction and oxidative stress in induced pluripotent stem cell models of Parkinson’s disease. Eur. J. Neurosci. 2019, 49, 525–532. [Google Scholar] [CrossRef]
- Zhao, Y.; Zhao, B. Oxidative stress and the pathogenesis of Alzheimer’s disease. Oxid Med. Cell Longev. 2013, 2013, 316523. [Google Scholar] [CrossRef]
- Halliwell, B.; Gutteridge, J.M.C. Free Radicals in Biology and Medicine, 5th ed.; Oxford University Press: London, UK, 2015; 845p. [Google Scholar] [CrossRef]
- Zailani, M.Z.; Ismail, A.F.; Goh, P.S.; Kadir, S.H.S.A.; Othman, M.H.D.; Hasbullah, H.; Abdullah, M.S.; Ng, B.C.; Kamal, F. Antioxidant and antithrombotic study of novel chitosan-diallyl disulfide inclusion complexes nanoparticles for hemodialysis applications. React. Funct. Polym. 2021, 163, 104894. [Google Scholar] [CrossRef]
- Costa-Fernandez, S.; Matos, J.K.R.; Scheunemann, G.S.; Salata, G.C.; Chorilli, M.; Watanabe, I.; Araujo, G.L.B.; Santos, M.F.; Ishida, K.; Lopes, L.B. Nanostructured lipid carriers containing chitosan or sodium alginate for co-encapsulation of antioxidants and an antimicrobial agent for potential application in wound healing. Int. J. Biol. Macromol. 2021, 183, 668–680. [Google Scholar] [CrossRef] [PubMed]
- Affes, S.; Aranaz, I.; Acosta, N.; Heras, Á.; Nasri, M.; Maalej, H. Chitosan derivatives-based films as pH-sensitive drug delivery systems with enhanced antioxidant and antibacterial properties. Int. J. Biol. Macromol. 2021, 182, 730–742. [Google Scholar] [CrossRef]
- Annu, S.A.; Ahmed, S.; Ikram, S. Chitin and chitosan: History, composition and properties. In Chitosan: Derivatives, Composites and Applications; Ahmed, S., Ikram, S., Beverly, M., Eds.; Scrivener Publishing: Hoboken, NJ, USA; Wiley: Hoboken, NJ, USA, 2017. [Google Scholar]
- Anwar, M.; Anggraeni, A.S.; Al Amin, M.H. Comparison of green method for chitin deacetylation. AIP Conf. Proc. 2017, 1823, 020071. [Google Scholar] [CrossRef]
- KUMAR, M.N.V.R. A review of chitin and chitosan applications. React. Funct. Polym. 2000, 46, 1–27. [Google Scholar] [CrossRef]
- Paiva, W.S.; Souza Neto, F.E.; Batista, A.C.L. Characterization of Polymeric Biomaterial Chitosan Extracted from Rhizopus stolonifer. J. Polym. Mater. 2017, 34, 115–121. Available online: https://www.researchgate.net/publication/318796158_Characterization_of_Polymeric_Biomaterial_Chitosan_Extracted_from_Rhizopus_stolonifer (accessed on 23 September 2021).
- Paiva, W.S.; Souza Neto, F.E.; Batista, A.C.L. Fungal chitosan as membranous material modified by atmospheric plasma. Res. Soc. Dev. 2021, 10, e9210111543. [Google Scholar] [CrossRef]
- Bento, A.R.; Stamford, T.L.M.; Stamford, T.C.M.; Andrade, S.A.C.; Souza, E.L. Sensory evaluation and inhibition of Listeria monocytogenes in bovine pâté added of chitosan from Mucor rouxii. LWT-Food Sci. Technol. 2011, 44, 588–591. [Google Scholar] [CrossRef]
- Cardoso, A.; Lins, C.I.; Santos, E.R.; Freitas Silva, M.C.; Campos-Takaki, C.M. Microbial Enhance of Chitosan Production by Rhizopus arrhizus Using Agroindustrial Substrates. Molecules 2012, 17, 4904–4914. [Google Scholar] [CrossRef]
- Mati-baouche, N.; Elchinger, P.; Baynast, H.; Pierre, G.; Delattre, C.; Michaud, P. Chitosan as an adhesive. Eur. Polym. J. 2014, 60, 198–212. [Google Scholar] [CrossRef]
- Stamford, T.C.M.; Stamford, T.L.M.; Stamford, N.P.; Barros Neto, B.; Campos-Takaki, G.M. Growth of Cunninghamella elegans UCP 542 and production of chitin and chitosan using yam bean medium. Electron. J. Biotechnol. 2007, 10, 1–6. [Google Scholar]
- Pascal, M.; Grishina, G.; Yang, A.C.; Sánchez-García, S.; Lin, J.; Towle, D.; Ibañez, M.D.; Sastre, J.; Sampson, H.A.; Ayuso, R. Molecular Diagnosis of Shrimp Allergy: Efficiency of Several Allergens to Predict Clinical Reactivity. J. Allergy. Clin. Immunol. Pract. 2015, 3, 521–529. [Google Scholar] [CrossRef] [PubMed]
- Faber, M.A.; Pascal, M.; El Kharbouchi, O.; Sabato, V.; Hagendorens, M.M.; Decuyper, I.I.; Bridts, C.H.; Ebo, D.G. Shellfish allergens: Tropomyosin and beyond. Allergy 2017, 72, 842–848. [Google Scholar] [CrossRef] [PubMed]
- Ghormade, V.; Pathan, E.K.; Deshpande, M.V. Can fungi compete with marine sources for chitosan production? Int. J. Biol. Macromol. 2017, 104, 1415–1421. [Google Scholar] [CrossRef]
- Batista, A.C.L.; Souza Neto, F.E.; Paiva, W.S. Review of fungal chitosan: Past, present and perspectives in Brazil. Polímeros 2018, 28, 275–283. [Google Scholar] [CrossRef]
- El Rabey, H.A.; Almutairi, F.M.; Alalawy, A.I.; Al-Duais, M.A.; Sakran, M.I.; Zidan, N.S.; Tayel, A.A. Augmented control of drug-resistant Candida spp. via fluconazole loading into fungal chitosan nanoparticles. Int. J. Biol. Macromol. 2019, 141, 511–516. [Google Scholar] [CrossRef]
- Sathiyaseelan, A.; Saravanakumar, K.; Mariadoss, A.V.A.; Wang, M.H. Biocompatible fungal chitosan encapsulated phytogenic silver nanoparticles enhanced antidiabetic, antioxidant and antibacterial activity. Int. J. Biol. Macromol. 2020, 153, 63–71. [Google Scholar] [CrossRef]
- Fakhar, M.; Chabra, A.; Rahimi-Esboei, B.; Rezaei, F. In vitro protoscolicidal effects of fungal chitosan isolated from Penicillium waksmanii and Penicillium citrinum. J. Parasit. Dis. 2015, 39, 162–167. [Google Scholar] [CrossRef]
- Souza Neto, F.E.; Silva, H.C.A.; Paiva, W.S.; Torres, T.M.; Rocha, A.C.P.; Bezerra, A.C.D.S.; Batista, A.C.L. Quitosana fúngica sobre larvas de nematoides gastrintestinais de caprinos. Arq. Inst. Biol. 2017, 84, 1–5. [Google Scholar] [CrossRef][Green Version]
- Alalawy, A.I.; El Rabey, H.A.; Almutairi, F.M.; Tayel, A.A.; Al-Duais, M.A.; Zidan, N.S.; Sakran, M.I. Effectual anticancer potentiality of loaded bee venom onto fungal chitosan nanoparticles. Int. J. Polym. Sci. 2020, 2020, 2785304. [Google Scholar] [CrossRef]
- Pochanavanich, P.; Suntornsuk, W. Fungal chitosan production and its characterization. Lett. Appl. Microbiol. 2002, 35, 17–21. [Google Scholar] [CrossRef]
- Berger, L.R.R.; Stamford, T.C.M.; Stamford-Arnaud, T.M.; Alcantara, S.R.; Silva, A.C.; Silva, A.M.; Nascimento, A.E.; Campos-Takaki, G.M. Green conversion of agroindustrial wastes into chitin and chitosan by Rhizopus arrhizus and Cunninghamella elegans strains. Int. J. Mol. Sci. 2014, 15, 9082–9102. [Google Scholar] [CrossRef] [PubMed]
- Amorim, R.V.S.; Souza, W.; Fukushima, K.; Campos-Takaki, G.M. Faster chitosan production by Mucorelean strains in submerged culture. Braz. J. Microbiol. 2001, 32, 20–23. [Google Scholar] [CrossRef]
- Amorim, R.V.S.; Ledingham, W.M.; Fukushima, K.; Campos-Takaki, G.M. Screening of chitin deacetylase from Mucoralean strains (Zygomycetes) and its relationship to cell growth rate. J. Ind. Microbiol Biotechnol. 2005, 32, 19–23. [Google Scholar] [CrossRef] [PubMed]
- Batista, A.C.L.; Villanueva, E.R.; Amorim, R.V.S.; Tavares, M.T.; Campos-Takaki, G.M. Chromium (VI) Ion Adsorption Features of Chitosan Film and Its Chitosan/Zeolite Conjugate 13X Film. Molecules 2011, 16, 3569–3579. [Google Scholar] [CrossRef]
- Queiroz, M.F.; Melo, K.; Sabry, D.A.; Sassaki, G.L.; Rocha, H.A.O.; Costa, L.S. Gallic Acid-Chitosan Conjugate Inhibits the Formation of Calcium Oxalate Crystals. Molecules 2019, 24, 2074. [Google Scholar] [CrossRef] [PubMed]
- Cavalcanti, M.A.Q.; Oliveira, L.G.; Fernandes, M.J.; Lima, D.M. Fungos filamentosos isolados do solo em municípios na região Xingó, Brasil. Acta Bot. Bras. 2006, 20, 831–837. [Google Scholar] [CrossRef]
- Doyle, J. DNA Protocols for Plants. In Molecular Techniques in Taxonomy; Hewitt, G.M., Johnston, A.W.B., Young, J.P.W., Eds.; Springer: Berlin/Heidelberg, Germany, 1991; pp. 283–293. [Google Scholar] [CrossRef]
- White, T.J.; Bruns, T.; Lee, S.; Taylor, J. Amplification and direct sequencing of fungal ribosomal RNA genes for phylogenetics. BT-PCR Protoc. 1990, 1, 315–322. Available online: https://www.researchgate.net/publication/262687766_Amplification_and_Direct_Sequencing_of_Fungal_Ribosomal_RNA_Genes_for_Phylogenetics (accessed on 22 May 2021).
- Pele, M.A.; Montero-Rodriguez, D.; Rubio-Ribeaux, D.; Souza, A.F.; Luna, M.A.C.; Santiago, M.F.; Andrade, R.F.S.; Silva, T.A.L.; Santiago, A.L.C.M.A.; Campos-Takaki, G.M. Development and improved selected markers to biosurfactant and bioemulsifier production by Rhizopus strains isolated from Caatinga soil. Afr. J. Biotechnol. 2018, 17, 150–157. [Google Scholar] [CrossRef]
- Hu, K.J.; Yeung, K.W.; Ho, K.P.; Hu, K. Rapid extraction of high-quality chitosan from mycelia of Absidia glauca. J. Food Biochem. 1999, 23, 187–196. [Google Scholar] [CrossRef]
- Paiva, W.S.; Souza Neto, F.E.; Batista, A.C.L. Avaliação da atividade antibacteriana da quitosana fúngica. Biológicas Saúde 2014, 13, 37–43. [Google Scholar] [CrossRef]
- Bradford, M.M. A rapid and sensitive method for the quantitation of microgram quantities of protein utilizing the principle of protein-dye binding. Anal. Biochem. 1976, 72, 248–254. [Google Scholar] [CrossRef]
- Athukorala, Y.; Kim, K.N.; Jeon, Y.J. Antiproliferative and antioxidant properties of an enzymatic hydrolysate from brown alga, Ecklonia cava. Food Chem. Toxicol. 2006, 44, 1065–1074. [Google Scholar] [CrossRef]
- Curcio, M.; Puoci, F.; Iemma, F.; Parisi, O.I.; Cirillo, G.; Spizzirri, U.G.; Picci, N. Covalent Insertion of Antioxidant Molecules on Chitosan by a Free Radical Grafting Procedure. J. Agric. Food Chem. 2009, 57, 5933–5938. [Google Scholar] [CrossRef]
- Presa, F.; Marques, M.; Viana, R.; Nobre, L.; Costa, L.; Rocha, H. The Protective Role of Sulfated Polysaccharides from Green Seaweed Udotea flabellum in Cells Exposed to Oxidative Damage. Mar. Drugs 2018, 16, 135. [Google Scholar] [CrossRef]
- Silva, J.M.C.; Dantas-Santos, N.; Gomes, D.L.; Costa, L.S.; Cordeiro, S.L.; Costa, M.S.S.P.; Silva, N.B.; Freitas, M.L.; Scortecci, K.C.; Leite, E.L.; et al. Biological activities of the sulfated polysaccharide from the vascular plant Halodule wrightii. Rev. Bras. Farmacogn. 2012, 22, 94–101. [Google Scholar] [CrossRef]
- Mosmann, T. Rapid colorimetric assay for cellular growth and survival: Application to proliferation and cytotoxicity assays. J. Immunol. Methods 1983, 65, 55–63. [Google Scholar] [CrossRef]
- Fidelis, G.P.; Silva, C.H.F.; Nobre, L.T.D.B.; Medeiros, V.P.; Rocha, H.A.O.; Costa, L.S. Antioxidant Fucoidans Obtained from Tropical Seaweed Protect Pre-Osteoblastic Cells from Hydrogen Peroxide-Induced Damage. Mar. Drugs 2019, 17, 506. [Google Scholar] [CrossRef]
- Batista, A.C.L.; Melo, T.B.L.; Paiva, W.S.; Souza, F.S.; Campos-Takaki, G.M. Economic microbiological conversion of agroindustrial wastes to fungi chitosan. Acad. Bras. Ciênc. 2020, 92, 1–13. [Google Scholar] [CrossRef] [PubMed]
- Ban, Z.; Horev, B.; Rutenberg, R.; Danay, O.; Bilbao, C.; McHugh, T.; Rodov, V.; Poverenov, E. Efficient production of fungal chitosan utilizing an advanced freeze-thawing method; quality and activity studies. Food Hydrocoll. 2018, 81, 380–388. [Google Scholar] [CrossRef]
- Berger, L.R.R.; Araújo, M.B.; Costa, D.P.; Lima, M.A.B.; Almeida, J.W.L.; Medeiros, E.V. Agroindustrial waste as ecofriendly and low-cost alternative to production of chitosan from Mucorales fungi and antagonist effect against Fusarium solani (Mart.) Sacco and Scytalidium lignicola Pesante. Int. J. Biol. Macromol. 2020, 161, 101–108. [Google Scholar] [CrossRef] [PubMed]
- Rinaudo, M. Chitin and chitosan: Properties and applications. Prog. Polym. Sci. 2006, 31, 603–632. [Google Scholar] [CrossRef]
- Zhang, H.; Yun, S.; Song, L.; Zhang, Y.; Zhao, Y. The preparation and characterization of chitin and chitosan under large-scale submerged fermentation level using shrimp by-products as substrate. Int. J. Biol. Macromol. 2017, 96, 334–339. [Google Scholar] [CrossRef] [PubMed]
- Freier, T.; Koh, H.S.; Kazazian, K.; Shoichet, M.S. Controlling cell adhesion and degradation of chitosan films by N-acetylation. Biomaterials. 2005, 26, 5872. [Google Scholar] [CrossRef]
- Darwesh, O.M.; Sultan, Y.Y.; Seif, M.M.; Marrez, D.A. Bio-evaluation of crustacean and fungal nano-chitosan for applying as food ingredient. Toxicol. Rep. 2018, 5, 348–356. [Google Scholar] [CrossRef]
- Chatterjee, S.; Guha, A.K.; Chatterjee, B.P. Evaluation of quantity and quality of chitosan produce from Rhizopus oryzae by utilizing food product processing waste whey and molasses. J. Environ. Manag. 2019, 251, 109565. [Google Scholar] [CrossRef]
- Domnina, N.; Aref’ev, D.; Komarova, E.; Bilibin, A. Dextran as antioxidant’s activity carrier. Macromol. Symp. 1999, 144, 339–350. [Google Scholar] [CrossRef]
- Chatterjee, S.; Chatterjee, S.; Chatterjee, B.P.; Guha, A.K. Enhancement of growth and chitosan production by Rhizopus oryzae in whey medium by plant growth hormones. Int. J. Biol. Macromol. 2008, 42, 120–126. [Google Scholar] [CrossRef]
- Sebastian, J.; Rouissi, T.; Brar, S.K.; Hegde, K.; Verma, M. Microwave-assisted extraction of chitosan from Rhizopus oryzae NRRL 1526 biomass. Carbohydr. Polym. 2019, 219, 431–440. [Google Scholar] [CrossRef] [PubMed]
- Chatterjee, S.; Guha, A.K. A study on biochemical changes during cultivation of Rhizopus oryzae in deproteinized whey medium in relation to chitosan production. Lett. Appl. Microbiol. 2014, 59, 155–160. [Google Scholar] [CrossRef]
- Cho, Y.S.; Kim, S.K.; Ahn, C.B.; Je, J.Y. Preparation, characterization, and antioxidant properties of gallic acid-grafted-chitosans. Carbohydr. Polym. 2011, 83, 1617–1622. [Google Scholar] [CrossRef]
- Liu, J.; Lu, J.F.; Kan, J.; Jin, C.H. Synthesis of chitosan-gallic acid conjugate: Structure characterization and in vitro anti-diabetic potential. Int. J. Biol. Macromol. 2013, 62, 321–329. [Google Scholar] [CrossRef] [PubMed]
- Almutairi, F.M.; El Rabey, H.A.; Tayel, A.A.; Alalawy, A.I.; Al-Duais, M.A.; Sakran, M.I.; Zidan, N.S. Augmented anticancer activity of curcumin loaded fungal chitosan nanoparticles. Int. J. Biol. Macromol. 2020, 155, 861–867. [Google Scholar] [CrossRef] [PubMed]
- Oberemko, A.; Salaberria, A.M.; Saule, R.; Saulis, G.; Kaya, M.; Labidi, J.; Baublys, V. Physicochemical and in vitro cytotoxic properties of chitosan from mushroom species (Boletus bovinus and Laccaria laccata). Carbohydr. Polym. 2019, 221, 1–9. [Google Scholar] [CrossRef] [PubMed]
- Anbazhagan, S.; Thangavelu, K.P. Application of tetracycline hydrochloride loaded-fungal chitosan and Aloe vera extract based composite sponges for wound dressing. J. Adv. Res. 2018, 14, 63–71. [Google Scholar] [CrossRef] [PubMed]
- Castelo Branco Melo, N.F.; Soares, B.L.M.; Diniz, K.M.; Leal, C.F.; Canto, D.; Flores, M.A.P.; Tavares-Filho, J.H.C.; Galembeck, A.; Stamford, T.L.M.; Stamford-Arnaud, T.M.; et al. Effects of fungal chitosan nanoparticles as eco-friendly edible coatings on the quality of postharvest table grapes. Postharvest Biol. Technol. 2018, 139, 56–66. [Google Scholar] [CrossRef]
- Lin, C.-H.; Wang, P.-H.; Wen, T.-C. Chitosan production from Paecilomyces saturatus using three monosaccharides via mixture design. Int. J. Biol. Macromol. 2019, 141, 307–312. [Google Scholar] [CrossRef] [PubMed]
- Cabrera-Barjas, G.; Gallardo, F.; Nesic, A.; Taboada, E.; Marican, A.; Mirabal-Gallardo, Y.; Avila-Salas, F.; Delgado, N.; Armas-Ricard, M.; Valdes, O. Utilization of industrial by-product fungal biomass from Aspergillus niger and Fusarium culmorum to obtain biosorbents for removal of pesticide and metal ions from aqueous solutions. J. Environ. Chem. Eng. 2020, 8, 104355. [Google Scholar] [CrossRef]
- Fernandes-Negreiros, M.M.; Batista, L.A.N.C.; Viana, R.L.S.; Sabry, D.A.; Paiva, A.A.O.; Paiva, W.S.; Machado, R.I.A.; Sousa Junior, F.L.; Lima, D.L.; Vitoriano, J.O.; et al. Gallic Acid-Laminarin Conjugate Is a Better Antioxidant than Sulfated or Carboxylated Laminarin. Antioxidants 2020, 9, 1192. [Google Scholar] [CrossRef] [PubMed]
- Lavertu, M.; Xia, Z.; Serreqi, A.N.; Berrada, M.; Rodrigues, A.; Wang, D.; Buschmann, M.D.; Gupta, A. A validated 1H-NMR method for the determination of the degree of deacetylation of chitosan. J. Pharm. Biomed. Anal. 2003, 32, 1149–1158. [Google Scholar] [CrossRef]
- Czechowska-biskup, R.; Jarosińska, D.; Rokita, B.; Ulański, P.; Rosiak, J.M. Determination of degree of deacetylation of chitosan—Comparaison of methods. Prog. Chem. Appl. Chitin Its Deriv. 2012, 17, 5–20. Available online: https://www.researchgate.net/publication/288104933_Determination_of_degree_of_deacetylation_of_chitosan_-_Comparision_of_methods (accessed on 7 June 2021).
- Karthik, R.; Manigandan, V.; Saravanan, R.; Rajesh, R.P.; Chandrika, B. Structural characterization and in vitro biomedical activities of sulfated chitosan from Sepia pharaonis. Int. J. Biol. Macromol. 2016, 84, 319–328. [Google Scholar] [CrossRef] [PubMed]
- Lim, S.H.; Hudson, S.M. Synthesis and antimicrobial activity of a water-soluble chitosan derivative with a fiber-reactive group. Carbohydr. Res. 2004, 339, 313–319. [Google Scholar] [CrossRef]
- Ming-Tsung, Y.; Jeng-Leun, M. Physico-chemical characterization of fungal chitosan from shiitake stipes. LWT Food Sci. Technol. 2007, 40, 472–479. [Google Scholar] [CrossRef]
- Peter, M.G. Applications and Environmental Aspects of Chitin and Chitosan. J. Macromol. Sci. A 1995, 32, 629–640. [Google Scholar] [CrossRef]
- Ishii, H.; Minegishi, M.; Lavitpichayawong, B.; Mitani, T. Synthesis of chitosan-amino acid conjugates and their use in heavy metal uptake. Int. J. Biol. Macromol. 1995, 1, 21–23. [Google Scholar] [CrossRef]
- Piron, E.; Accominotti, M.; Domard, A. Interaction between Chitosan and Uranyl Ions. Role of Physical and Physicochemical Parameters on the Kinetics of Sorption. Lamgmuir 1997, 13, 1653–1658. [Google Scholar] [CrossRef]
- Gutteridge, J.M.C.; Halliwell, B. Antioxidants: Molecules, medicines, and myths. Biochem. Biophys. Res. Commun. 2010, 393, 561–564. Available online: http://www.ncbi.nlm.nih.gov/pubmed/20171167 (accessed on 23 September 2021). [CrossRef] [PubMed]


Publisher’s Note: MDPI stays neutral with regard to jurisdictional claims in published maps and institutional affiliations. |
© 2021 by the authors. Licensee MDPI, Basel, Switzerland. This article is an open access article distributed under the terms and conditions of the Creative Commons Attribution (CC BY) license (https://creativecommons.org/licenses/by/4.0/).