
Untargeted and Targeted LC-MS/MS Based Metabolomics Study on In Vitro Culture of Phaeoacremonium Species

 , , , , , , , and
Abstract
:1. Introduction
2. Materials and Methods
2.1. Phaeoacremonium Species and Culture Conditions
2.2. Extraction Procedure
2.3. Phytotoxic Bioassays
2.4. Reference Standards
2.5. Untargeted and Targeted LC-MS/MS Analysis
2.6. Data Analysis
3. Results
3.1. Extraction of Phaeoacremonium Culture Filtrates
3.2. Phytotoxic Bioassays
3.3. Dereplication of Scytalone (1) and Isosclerone (2)
3.4. Quantification of Scytalone (1) and Isosclerone (2)
3.5. Statistical Analysis Using MetaboAnalyst
3.6. Selection of Phaeoacremonium Isolates for Further Investigation
4. Discussion
5. Conclusions
Supplementary Materials
Author Contributions
Funding
Institutional Review Board Statement
Informed Consent Statement
Data Availability Statement
Conflicts of Interest
References
- Hallenn, F.; Fourie, P.H.; Crous, P.W. A review of black foot disease of grapevine. Phytopathol. Mediterr. 2006, 45, 55–67. [Google Scholar]
- Urbez-Torres, J.R.; Peduto, F.; Striegler, R.; Urrea-Romero, K.; Rupe, J.; Cartwright, R.; Gubler, W. Characterization of fungal pathogens associated with grapevine trunk diseases in Arkansas and Missouri. Fungal Divers. 2012, 52, 169–189. [Google Scholar] [CrossRef]
- Mondello, V.; Songy, A.; Battiston, E.; Pinto, C.; Coppin, C.; Trotel-Aziz, P.; Clément, C.; Mugnai, L.; Fontaine, F. Grapevine Trunk Diseases: A review of fifteen years of trials for their control with chemicals and biocontrol agents. Plant Dis. 2018, 102, 1189–1217. [Google Scholar] [CrossRef] [PubMed] [Green Version]
- Fontaine, F.; Gramaje, D.; Armengol, J.; Smart, R.; Nagy, Z.A.; Borgo, M.; Rego, C.; Corio-Costet, M.-F. Grapevine Trunk Diseases. A Review; OIV Publications: Paris, France, 2016; 24p. [Google Scholar]
- Songy, A.; Fernandez, O.; Clément, C.; Larignon, P.; Fontaine, F. Grapevine trunk diseases under thermal and water stresses. Planta 2019, 249, 1655–1679. [Google Scholar] [CrossRef]
- Claverie, M.; Notaro, M.; Fontaine, F.; Wéry, J. Current knowledge on Grapevine Trunk Diseases with complex etiology: A systemic approach. Phytopathol. Mediterr. 2020, 59, 29–53. [Google Scholar] [CrossRef]
- Carlucci, A.; Lops, F.; Cibelli, F.; Raimondo, M.L. Phaeoacremonium species associated with olive wilt and decline in southern Italy. Eur. J. Plant Pathol. 2015, 141, 717–729. [Google Scholar] [CrossRef] [Green Version]
- Carlucci, A.; Lops, F.; Mostert, L.; Halleen, F.; Raimondo, M.L. Occurrence fungi causing black foot on young grapevines and nursery rootstock plants in Italy. Phytopathol. Mediterr. 2017, 56, 10–39. [Google Scholar]
- Agustí-Brisach, C.; López-Moral, A.; Raya-Ortega, M.C.; Franco, R.; Roca-Castillo, L.F.; Trapero, A. Occurrence of grapevine trunk diseases affecting the native cultivar Pedro Ximénez in southern Spain. Eur. J. Plant Pathol. 2019, 153, 599–625. [Google Scholar] [CrossRef]
- Mugnai, L.; Graniti, A.; Surico, G. Esca (black measles) and brown wood-streaking: Two old and elusive diseases of grapevines. Plant Dis. 1999, 83, 404–418. [Google Scholar] [CrossRef] [PubMed] [Green Version]
- Mostert, L.; Groenewald, J.Z.; Summerbell, R.C.; Robert, V.; Sutton, D.A.; Padhye, A.A.; Crous, P.W. Species of Phaeoacremonium associated with infections in humans and environmental reservoirs in infected woody plants. J. Clin. Microbiol. 2005, 43, 1752–1767. [Google Scholar] [CrossRef] [Green Version]
- Mostert, L.; Groenewald, J.Z.; Summerbell, R.C.; Gams, W.; Crous, P.W. Taxonomy and pathology of Togninia (Diaporthales) and its Phaeoacremonium anamorphs. Stud. Mycol. 2006, 54, 1–113. [Google Scholar] [CrossRef] [Green Version]
- Crous, P.W.; Gams, W.; Wingfield, M.J.; Van Wyk, P. Phaeoacremonium gen. nov. associated with wilt and decline diseases of woody hosts and human infections. Mycologia 1996, 88, 786–796. [Google Scholar] [CrossRef] [Green Version]
- Ariyawansa, H.A.; Hyde, K.D.; Jayasiri, S.C.; Buyck, B.; Chethana, K.T.; Dai, D.Q.; Dai, Y.C.; Daranagama, D.A.; Jayawardena, R.S.; Luecking, R. Fungal diversity notes 111–252—taxonomic and phylogenetic contributions to fungal taxa. Fungal Divers. 2015, 75, 27–274. [Google Scholar] [CrossRef]
- Barreto, R.; Alves, J.; Lisboa, D.; Lisboa, W.; Crous, P.; Wingfield, M.; Burgess, T.; Hardy, G.S.J.; Crane, C.; Barrett, S. Fungal Planet description sheets: 469–557. Pers. Mol. Phylogeny Evol. Fungi 2016, 37, 218–403. [Google Scholar]
- Da Silva, M.A.; Correia, K.C.; Barbosa, M.A.G.; Câmara, M.P.S.; Gramaje, D.; Michereff, S.J. Characterization of Phaeoacremonium isolates associated with Petri disease of table grape in Northeastern Brazil, with description of Phaeoacremonium nordesticola sp. nov. Eur. J. Plant Pathol. 2017, 149, 695–709. [Google Scholar] [CrossRef]
- Spies, C.; Moyo, P.; Halleen, F.; Mostert, L. Phaeoacremonium species diversity on woody hosts in the Western Cape Province of South Africa. Pers. Mol. Phylogeny Evol. Fungi 2018, 40, 26. [Google Scholar] [CrossRef] [Green Version]
- Calabon, M.S.; Jones, E.; Boonmee, S.; Doilom, M.; Lumyong, S.; Hyde, K.D. Five Novel Freshwater Ascomycetes Indicate High Undiscovered Diversity in Lotic Habitats in Thailand. J. Fungi 2021, 7, 117. [Google Scholar] [CrossRef] [PubMed]
- Essakhi, S.; Mugnai, L.; Crous, P.; Groenewald, J.; Surico, G. Molecular and phenotypic characterisation of novel Phaeoacremonium species isolated from esca diseased grapevines. Pers. Mol. Phylogeny Evol. Fungi 2008, 21, 119. [Google Scholar] [CrossRef] [Green Version]
- Gramaje, D.; Armengol, J.; Colino, M.; Santiago, R.; Moralejo, E.; Olmo, D.; Luque, J.; Mostert, L. First report of Phaeoacremonium inflatipes, P. iranianum, and P. sicilianum causing Petri disease of grapevine in Spain. Plant Dis. 2009, 93, 964. [Google Scholar] [CrossRef] [PubMed]
- Gramaje, D.; Armengol, J.; Mohammadi, H.; Banihashemi, Z.; Mostert, L. Novel Phaeoacremonium species associated with Petri disease and esca of grapevine in Iran and Spain. Mycologia 2009, 101, 920–929. [Google Scholar] [CrossRef]
- White, C.-L.; Halleen, F.; Fischer, M.; Mostert, L. Characterisation of the fungi associated with esca diseased grapevines in South Africa. Phytopathol. Mediterr. 2011, 50, S204–S223. [Google Scholar]
- Raimondo, M.L.; Lops, F.; Carlucci, A. Phaeoacremonium italicum sp. nov., associated with esca of grapevine in southern Italy. Mycologia 2014, 106, 1119–1126. [Google Scholar] [CrossRef]
- Marin-Felix, Y.; Hernández-Restrepo, M.; Iturrieta-González, I.; García, D.; Gené, J.; Groenewald, J.; Cai, L.; Chen, Q.; Quaedvlieg, W.; Schumacher, R. Genera of phytopathogenic fungi: GOPHY 3. Stud. Mycol. 2019, 94, 1–124. [Google Scholar] [CrossRef]
- Chini, A.; Cimmino, A.; Masi, M.; Reveglia, P.; Nocera, P.; Solano, R.; Evidente, A. The fungal phytotoxin lasiojasmonate A activates the plant jasmonic acid pathway. J. Exp. Bot. 2018, 69, 3095–3102. [Google Scholar] [CrossRef] [Green Version]
- Kusari, S.; Pandey, S.P.; Spiteller, M. Untapped mutualistic paradigms linking host plant and endophytic fungal production of similar bioactive secondary metabolites. Phytochemistry 2013, 91, 81–87. [Google Scholar] [CrossRef]
- Pusztahelyi, T.; Holb, I.J.; Pócsi, I. Secondary metabolites in fungus-plant interactions. Front. Plant Sci. 2015, 6, 573. [Google Scholar] [CrossRef] [PubMed] [Green Version]
- Masi, M.; Cimmino, A.; Reveglia, P.; Mugnai, L.; Surico, G.; Evidente, A. Advances on fungal phytotoxins and their role in grapevine trunk diseases. J. Agric. Food Chem. 2018, 66, 5948–5958. [Google Scholar] [CrossRef] [PubMed]
- Evidente, A.; Bruno, G.; Andolfi, A.; Sparapano, L. Two Naphthalenone Pentakides from Liquid Cultures of Phaeoacremonium aleophilum, a Fungus Associated with Esca of Grapevine. Phytopathol. Mediterr. 2000, 39, 162–168. [Google Scholar]
- Tabacchi, R.; Fkyerat, A.; Poliart, C.; Dubin, G. Phytotoxins from fungi of esca grapevine [Vitis vinifera L.]. Phytopathol. Mediterr. 2000, 39, 156–161. [Google Scholar]
- Martos, S.; Andolfi, A.; Luque, J.; Mugnai, L.; Surico, G.; Evidente, A. Production of phytotoxic metabolites by five species of Botryosphaeriaceae causing decline on grapevines, with special interest in the species Neofusicoccum luteum and N. parvum. Eur. J. Plant Pathol. 2008, 121, 451–461. [Google Scholar] [CrossRef]
- Reveglia, P.; Savocchia, S.; Billones-Baaijens, R.; Masi, M.; Cimmino, A.; Evidente, A. Phytotoxic metabolites by nine species of Botryosphaeriaceae involved in grapevine dieback in Australia and identification of those produced by Diplodia mutila, Diplodia seriata, Neofusicoccum australe and Neofusicoccum luteum. Nat. Prod. Res. 2019, 33, 2223–2229. [Google Scholar] [CrossRef]
- Fiehn, O. Metabolomics—the link between genotypes and phenotypes. In Functional Genomics; Springer: Dordrecht, The Netherlands, 2002; pp. 155–171. [Google Scholar]
- Vasilev, N.; Boccard, J.; Lang, G.; Grömping, U.; Fischer, R.; Goepfert, S.; Rudaz, S.; Schillberg, S. Structured plant metabolomics for the simultaneous exploration of multiple factors. Sci. Rep. 2016, 6, 37390. [Google Scholar] [CrossRef] [Green Version]
- Tugizimana, F.; Mhlongo, M.; Piater, L.; Dubery, I. Metabolomics in plant priming research: The way forward? Int. J. Mol. Sci. 2018, 19, 1759. [Google Scholar] [CrossRef] [Green Version]
- Almeida, F.; Rodrigues, M.L.; Coelho, C. The still underestimated problem of fungal diseases worldwide. Front. Microbiol. 2019, 10, 214. [Google Scholar] [CrossRef] [PubMed] [Green Version]
- Fisher, M.C.; Henk, D.A.; Briggs, C.J.; Brownstein, J.S.; Madoff, L.C.; McCraw, S.L.; Gurr, S.J. Emerging fungal threats to animal, plant and ecosystem health. Nature 2012, 484, 186–194. [Google Scholar] [CrossRef] [PubMed]
- Liu, W.; Song, Q.; Cao, Y.; Zhao, Y.; Huo, H.; Wang, Y.; Song, Y.; Li, J.; Tu, P. Advanced liquid chromatography-mass spectrometry enables merging widely targeted metabolomics and proteomics. Anal. Chim. Acta 2019, 1069, 89–97. [Google Scholar] [CrossRef]
- Zhang, X.; Quinn, K.; Cruickshank-Quinn, C.; Reisdorph, R.; Reisdorph, N. The application of ion mobility mass spectrometry to metabolomics. Curr. Opin. Chem. Biol. 2018, 42, 60–66. [Google Scholar] [CrossRef] [PubMed]
- Santiago, K.A.A.; Edrada-Ebel, R.; Cheow, Y.L.; Ting, A.S.Y. Biodiscovery of potential antibacterial diagnostic metabolites from the endolichenic fungus Xylaria venustula using LC–MS-based metabolomics. Biology 2021, 10, 191. [Google Scholar] [CrossRef]
- Tawfike, A.F.; Viegelmann, C.; Edrada-Ebel, R. Metabolomics and dereplication strategies in natural products. In Metabolomics Tools for Natural Product Discovery: Methods and Protocols; Humana Press: Totowa, NJ, USA, 2013; pp. 227–244. [Google Scholar]
- Hubert, J.; Nuzillard, J.-M.; Renault, J.-H. Dereplication strategies in natural product research: How many tools and methodologies behind the same concept? Phytochem. Rev. 2017, 16, 55–95. [Google Scholar] [CrossRef]
- Laidani, M.; Raimondo, M.L.; D’Onghia, A.M.; Carlucci, A. Structure analysis of the ribosomial intergenic spacer region of Phaeoacremonium italicum as a study model. Phytophatol. Mediterr. 2021, 60, 553–573. [Google Scholar]
- Evidente, A.; Punzo, B.; Andolfi, A.; Cimmino, A.; Melck, D.; Luque, J. Lipophilic phytotoxins produced by Neofusicoccum parvum, a grapevine canker agent. Phytopathol. Mediterr. 2010, 49, 74–79. [Google Scholar]
- Mani, D.R.; Abbatiello, S.E.; Carr, S.A. Statistical characterization of multiple-reaction monitoring mass spectrometry (MRM-MS) assays for quantitative proteomics. BMC Bioinform. 2012, 13, 1–18. [Google Scholar] [CrossRef] [Green Version]
- Kessner, D.; Chambers, M.; Burke, R.; Agus, D.; Mallick, P. ProteoWizard: Open-source software for rapid proteomics tools development. Bioinformatics 2008, 24, 2534–2536. [Google Scholar] [CrossRef] [PubMed]
- Pluskal, T.; Castillo, S.; Villar-Briones, A.; Orešič, M. MZmine 2: Modular framework for processing, visualizing, and analyzing mass spectrometry-based molecular profile data. BMC Bioinform. 2010, 11, 395. [Google Scholar] [CrossRef] [Green Version]
- Myers, O.D.; Sumner, S.J.; Li, S.; Barnes, S.; Du, X. One step forward for reducing false positive and false negative compound identifications from mass spectrometry metabolomics data: New algorithms for constructing extracted ion chromatograms and detecting chromatographic peaks. Anal. Chem. 2017, 89, 8696–8703. [Google Scholar] [CrossRef]
- Chong, J.; Wishart, D.S.; Xia, J. Using metaboanalyst 4.0 for comprehensive and integrative metabolomics data analysis. Curr. Protoc. Bioinform. 2019, 68, e86. [Google Scholar] [CrossRef]
- Pang, Z.; Chong, J.; Zhou, G.; de Lima Morais, D.A.; Chang, L.; Barrette, M.; Gauthier, C.; Jacques, P.-É.; Li, S.; Xia, J. MetaboAnalyst 5.0: Narrowing the gap between raw spectra and functional insights. Nucleic Acids Res. 2021, 49, W388–W396. [Google Scholar] [CrossRef] [PubMed]
- Smith, C.A.; O’Maille, G.; Want, E.J.; Qin, C.; Trauger, S.A.; Brandon, T.R.; Custodio, D.E.; Abagyan, R.; Siuzdak, G. METLIN: A metabolite mass spectral database. Ther. Drug Monit. 2005, 27, 747–751. [Google Scholar] [CrossRef]
- Van Santen, J.A.; Jacob, G.; Leen Singh, A.; Aniebok, V.; Balunas, M.J.; Bunsko, D.; Carnevale Neto, F.; Castaño-Espriu, L.; Chang, C.; Clark, T.N.; et al. The Natural Products Atlas: An Open Access Knowledge Base for Microbial Natural Products Discovery. ACS Cent. Sci. 2019, 5, 1824–1833. [Google Scholar] [CrossRef] [PubMed] [Green Version]
- m/z Cloud. Advanced Mass Spectral Database. Available online: https://www.mzcloud.org/home.aspx (accessed on 15 October 2021).
- Mushtaq, M.Y.; Choi, Y.H.; Verpoorte, R.; Wilson, E.G. Extraction for metabolomics: Access to the metabolome. Phytochem. Anal. 2014, 25, 291–306. [Google Scholar] [CrossRef]
- Kang, J.; David, L.; Li, Y.; Cang, J.; Chen, S. Three-in-one simultaneous extraction of proteins, metabolites and lipids for multi-omics. Front. Genet. 2021, 12, 635971. [Google Scholar] [CrossRef]
- Caesar, L.K.; Cech, N.B. Synergy and antagonism in natural product extracts: When 1 + 1 does not equal 2. Nat. Prod. Rep. 2019, 36, 869–888. [Google Scholar] [CrossRef] [PubMed] [Green Version]
- Andolfi, A.; Cimmino, A.; Evidente, A.; Iannaccone, M.; Capparelli, R.; Mugnai, L.; Surico, G. A new flow cytometry technique to identify Phaeomoniella chlamydospora exopolysaccharides and study mechanisms of esca grapevine foliar symptoms. Plant Dis. 2009, 93, 680–684. [Google Scholar] [CrossRef] [Green Version]
- Luini, E.; Fleurat-Lessard, P.; Rousseau, L.; Roblin, G.; Berjeaud, J.-M. Inhibitory effects of polypeptides secreted by the grapevine pathogens Phaeomoniella chlamydospora and Phaeoacremonium aleophilum on plant cell activities. Physiol. Mol. Plant Pathol. 2010, 74, 403–411. [Google Scholar] [CrossRef]
- El-Elimat, T.; Figueroa, M.; Ehrmann, B.M.; Cech, N.B.; Pearce, C.J.; Oberlies, N.H. High-resolution MS, MS/MS, and UV database of fungal secondary metabolites as a dereplication protocol for bioactive natural products. J. Nat. Prod. 2013, 76, 1709–1716. [Google Scholar] [CrossRef] [Green Version]
- Oberlies, N.H.; Knowles, S.L.; Amrine, C.S.M.; Kao, D.; Kertesz, V.; Raja, H.A. Droplet probe: Coupling chromatography to the in situ evaluation of the chemistry of nature. Nat. Prod. Rep. 2019, 36, 944–959. [Google Scholar] [CrossRef] [Green Version]
- Ramos, A.E.F.; Evanno, L.; Poupon, E.; Champy, P.; Beniddir, M.A. Natural products targeting strategies involving molecular networking: Different manners, one goal. Nat. Prod. Rep. 2019, 36, 960–980. [Google Scholar] [CrossRef]
- Li, S.; Mou, H.; Jiang, N. Application of high performance liquid chromatography-quadruple/linear ion trap mass spectrometry in food analysis. J. Food Saf. Qual. 2019, 10, 1948–1954. [Google Scholar]
- Di Marco, S.; Osti, F.; Mugnai, L. First studies on the potential of a copper formulation for the control of leaf stripe disease within Esca complex in grapevine. Phytopathol. Mediterr. 2011, 50, S300–S309. [Google Scholar]
- Blaženović, I.; Kind, T.; Ji, J.; Fiehn, O. Software tools and approaches for compound identification of lc-ms/ms data in metabolomics. Metabolites 2018, 8, 31. [Google Scholar] [CrossRef] [PubMed] [Green Version]
- Tian, X.; Ding, H.; Ke, W.; Wang, L. Quorum sensing in fungal species. Annu. Rev. Microbiol. 2021, 75, 449–469. [Google Scholar] [CrossRef] [PubMed]
- Reveglia, P.; Billones-Baaijens, R.; Niem, J.M.; Masi, M.; Cimmino, A.; Evidente, A.; Savocchia, S. Production of phytotoxic metabolites by Botryosphaeriaceae in naturally infected and artificially inoculated grapevines. Plants 2021, 10, 802. [Google Scholar] [CrossRef] [PubMed]
- Labois, C.; Wilhelm, K.; Laloue, H.; Tarnus, C.; Bertsch, C.; Goddard, M.-L.; Chong, J. Wood metabolomic responses of wild and cultivated grapevine to infection with Neofusicoccum parvum, a trunk disease pathogen. Metabolites 2020, 10, 232. [Google Scholar] [CrossRef] [PubMed]
- Li, Y.; Gai, Z.; Wang, C.; Li, P.; Li, B. Identification of mellein as a pathogenic substance of Botryosphaeria dothidea by UPLC-MS/MS analysis and phytotoxic bioassay. J. Agric. Food Chem. 2021, 69, 8471–8481. [Google Scholar] [CrossRef]
- Ball, B.; Langille, M.; Geddes-McAlister, J. Fun(gi)omics: Advanced and diverse technologies to explore emerging fungal pathogens and define mechanisms of antifungal resistance. mBio 2020, 11, e01020-20. [Google Scholar] [CrossRef] [PubMed]
- Bonilla-Aldana, D.K.; Dhama, K.; Rodriguez-Morales, A.J. Revisiting the one health approach in the context of COVID-19: A look into the ecology of this emerging disease. Adv. Anim. Vet. Sci. 2020, 8, 234–237. [Google Scholar] [CrossRef] [Green Version]


| Compounds | Precursor Ion (m/z) | Product Ion (m/z) | RT 1 a (min) | Qtrap Parameter | RT 2 (min) | ||
|---|---|---|---|---|---|---|---|
| DP b | CE c | CXP d | |||||
scytalone (1)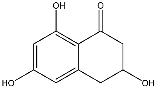 | 193.0491 [M − H]− | 151.0382 (Quantifier) 123.0426 (Qualifier) | 4.60 | −70 −70 | −30 −32 | −15 −13 | 4.35 |
isosclerone (2)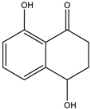 | 177.0541 [M − H]− | 159.0427 (Quantifier) 149.0582 (Qualifier) | 4.68 | −75 −75 | −23 −21 | −14 −11 | 5.28 |
2-hydroxy-1,4-naphtoquinone (3)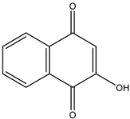 | 173.0234 [M − H]− | 145.0272 | 5.85 | −55 | −23 | −11 | 5.58 |
| Fungal Species | ID Isolate | pH Culture Filtrates | Extract UpH a (mg) | Extract pH 2 (mg) |
|---|---|---|---|---|
| P. italicum | CBS 137763 | 8.5 | 4.88 | 7.13 |
| Pm50M | 8.4 | 8.90 | 8.01 | |
| Pm45 | 8.2 | 4.18 | 8.26 | |
| Pm59 | 6.1 | 15.99 | 28.15 | |
| P. alvesii | CBS 113590 | 8.8 | 7.11 | 8.55 |
| CBS 729.97 | 6.3 | 7.23 | 16.57 | |
| CBS 408.78 | 8.8 | 4.41 | 6.16 | |
| P. rubrigenum | CBS 112046 | 4.4 | 4.8 | 8.70 |
| CBS 498.94 | 7.9 | 10.92 | 9.56 | |
| Culture medium (Czapek) | 6.2 | 2.60 | 3.50 |
| Symptoms Observed on Cotyledons after 8 Days | ||||||||||||
|---|---|---|---|---|---|---|---|---|---|---|---|---|
| Necrotic Areas | Discoloured Areas | Chlorotic Ring | Necrotic Spots | Toxicity Severity (TS) | ||||||||
| Organic Extract Concentrations | 3 mg/mL | 1.5 mg/mL | 3 mg/mL | 1.5 mg/mL | 3 mg/mL | 1.5 mg/mL | 3 mg/mL | 1.5 mg/mL | 3 mg/mL | 1.5 mg/mL | ||
| Fungal Species | ID Isolates | pH Values | ||||||||||
| P. italicum | CBS 137763 | UpH a | + | + | − | − | − | − | + | + | 1.25 | 1.13 |
| pH 2 | + | + | − | − | − | − | + | + | 1.25 | 1.25 | ||
| Pm50M | UpH | + | + | + | − | − | − | + | + | 1.25 | 1.25 | |
| pH 2 | − | − | − | − | − | − | + | + | 1.00 | 1.25 | ||
| Pm59 | UpH | + | + | + | − | − | − | + | + | 1.50 | 1.38 | |
| pH 2 | + | − | + | − | − | − | + | + | 1.13 | 1.13 | ||
| Pm45 | UpH | − | − | + | + | − | − | + | + | 1.63 | 1.13 | |
| pH 2 | + | + | + | − | − | − | + | + | 1.13 | 1.00 | ||
| P. alvesii | CBS 408.78 | UpH | + | − | + | − | + | − | + | + | 1.38 | 1.00 |
| pH 2 | + | + | + | + | + | − | + | + | 1.38 | 1.13 | ||
| CBS 729.97 | UpH | + | + | + | − | + | − | + | + | 1.38 | 1.25 | |
| pH 2 | − | − | − | − | − | − | + | + | 1.50 | 1.00 | ||
| CBS 113590 | UpH | + | + | + | + | − | − | + | + | 2.13 | 1.25 | |
| pH 2 | + | + | + | + | + | + | + | + | 1.63 | 1.25 | ||
| P. rubrigenum | CBS 112046 | UpH | + | + | + | − | − | − | + | + | 1.38 | 1.25 |
| pH 2 | + | + | + | − | − | − | + | + | 1.25 | 1.13 | ||
| CBS 498.94 | UpH | − | − | + | − | − | − | + | + | 1.38 | 1.13 | |
| pH 2 | + | + | + | + | − | − | + | + | 2.00 | 1.13 | ||
| Control | Czapek | UpH | − | − | − | − | − | − | − | − | 0.00 | 0.00 |
| pH 2 | − | − | − | − | − | − | − | − | 0.00 | 0.00 | ||
| Fungal Species | Isolate | pH | Orbitrap | Qtrap | ||
|---|---|---|---|---|---|---|
| Scytalone | Isosclerone | Scytalone (μg/mL ± SD) | Isosclerone (μg/mL ± SD) | |||
| Phaeoacremonium italicum | Pm50M | UpH a | - | - | <LOD c | <LOD |
| pH 2 b | - | - | <LOD | <LOD | ||
| Pm45 | UpH | + | + | 11.90 ± 1.05 | 65.82 ± 3.86 | |
| pH 2 | - | <LOD | <LOD | |||
| Pm59 | UpH | + | - | <LOD | <LOD | |
| pH 2 | - | - | <LOD | <LOD | ||
| CBS 137763 | UpH | + | + | 5.67 ± 0.50 | 86.67 ± 5.8 | |
| pH 2 | + | + | 3.64 ± 0.28 | <LOQ d | ||
| P. alvesii | CBS 729.97 | UpH | + | - | 10.43 ± 0.98 | <LOQ |
| pH 2 | + | - | 4.07 ± 0.32 | <LOD | ||
| CBS 408.78 | UpH | + | + | 8.52 ± 1.02 | <LOQ | |
| pH 2 | + | - | 3.62 ± 0.12 | <LOD | ||
| CBS 113590 | UpH | - | - | <LOD | <LOD | |
| pH 2 | - | - | <LOD | <LOD | ||
| P. rubrigenum | CBS 112046 | UpH | + | - | 1.00 | <LOD |
| pH 2 | - | - | <LOD | <LOD | ||
| CBS 498.94 | UpH | - | + | <LOD | <LOQ | |
| pH 2 | - | - | <LOD | <LOD | ||
| Culture medium (Czapek) | UpH | - | - | - | - | |
| pH 2 | - | - | - | - | ||
Publisher’s Note: MDPI stays neutral with regard to jurisdictional claims in published maps and institutional affiliations. |
© 2022 by the authors. Licensee MDPI, Basel, Switzerland. This article is an open access article distributed under the terms and conditions of the Creative Commons Attribution (CC BY) license (https://creativecommons.org/licenses/by/4.0/).
Share and Cite
Reveglia, P.; Raimondo, M.L.; Masi, M.; Cimmino, A.; Nuzzo, G.; Corso, G.; Fontana, A.; Carlucci, A.; Evidente, A. Untargeted and Targeted LC-MS/MS Based Metabolomics Study on In Vitro Culture of Phaeoacremonium Species. J. Fungi 2022, 8, 55. https://doi.org/10.3390/jof8010055
Reveglia P, Raimondo ML, Masi M, Cimmino A, Nuzzo G, Corso G, Fontana A, Carlucci A, Evidente A. Untargeted and Targeted LC-MS/MS Based Metabolomics Study on In Vitro Culture of Phaeoacremonium Species. Journal of Fungi. 2022; 8(1):55. https://doi.org/10.3390/jof8010055
Chicago/Turabian StyleReveglia, Pierluigi, Maria Luisa Raimondo, Marco Masi, Alessio Cimmino, Genoveffa Nuzzo, Gaetano Corso, Angelo Fontana, Antonia Carlucci, and Antonio Evidente. 2022. "Untargeted and Targeted LC-MS/MS Based Metabolomics Study on In Vitro Culture of Phaeoacremonium Species" Journal of Fungi 8, no. 1: 55. https://doi.org/10.3390/jof8010055