Article

Torulaspora delbrueckii Phenotypic and Metabolic Profiling towards Its Biotechnological Exploitation

by
Flávia Silva-Sousa
1,2,
Ticiana Fernandes
1,2,
Fábio Pereira
1,2,
Diana Rodrigues
1,2,
Teresa Rito
1,2,
Carole Camarasa
3,
Ricardo Franco-Duarte
1,2,* and
Maria João Sousa
1,2,*
1
CBMA (Centre of Molecular and Environmental Biology), Department of Biology, University of Minho, 4710-057 Braga, Portugal
2
Institute of Science and Innovation for Bio-Sustainability (IB-S), University of Minho, 4710-057 Braga, Portugal
3
SPO, University Montpellier, INRAE, Institut Agro, 34060 Montpellier, France
*
Authors to whom correspondence should be addressed.
J. Fungi 2022, 8(6), 569; https://doi.org/10.3390/jof8060569
Submission received: 6 May 2022 / Revised: 25 May 2022 / Accepted: 25 May 2022 / Published: 26 May 2022
(This article belongs to the Special Issue New Trends in Yeast Genomics)

Abstract

:
Wine is a particularly complex beverage resulting from the combination of several factors, with yeasts being highlighted due to their fundamental role in its development. For many years, non-Saccharomyces yeasts were believed to be sources of spoilage and contamination, but this idea was challenged, and many of these yeasts are starting to be explored for their beneficial input to wine character. Among this group, Torulaspora delbrueckii is gaining relevance within the wine industry, owing to its low volatile acidity production, increased release of aromatic compounds and enhanced color intensity. In addition, this yeast was also attracting interest in other biotechnological areas, such as bread and beer fermentation. In this work, a set of 40 T. delbrueckii strains, of varied geographical and technological origins, was gathered in order to characterize the phenotypic behavior of this species, focusing on different parameters of biotechnological interest. The fermentative performance of the strains was also evaluated through individual fermentations in synthetic grape must with the isolates’ metabolic profile being assessed by HPLC. Data analysis revealed that T. delbrueckii growth is significantly affected by high temperature (37 °C) and ethanol concentrations (up to 18%), alongside 1.5 mM SO2, showing variable fermentative power and yields. Our computation models suggest that the technological origin of the strains seems to prevail over the geographical origin as regards the influence on yeast properties. The inter-strain variability and profile of the products through the fermentative processes reinforce the potential of T. delbrueckii from a biotechnological point of view.

1. Introduction

Torulaspora delbrueckii was, for a long time, associated with winemaking [1], standing out, today, as one of the most interesting non-Saccharomyces yeast species [2,3]. Its use in wine introduces diversity and multiplicity to the standard wine market, which is almost exclusively dominated by S. cerevisiae, the yeast par excellence for grape must. In fact, in wine fermentation, either spontaneous or inoculated, the initial steps of the processes are dominated by non-Saccharomyces yeasts, leading to the production of higher levels of alcohols derived from the Ehrlich pathway, also to the production of ethyl and acetate esters, in greater yields than those achieved by Saccharomyces cerevisiae. Afterwards, these yeasts are gradually replaced by S. cerevisiae, which possesses a higher tolerance to ethanol [4,5,6]. Non-Saccharomyces yeasts present at the beginning of fermentation were originally considered as the causes of spoilage, due to the association with high levels of unpleasant flavors, but more recent studies revealed that, actually, a great number of those species considerably enhance the sensory profile of wines [7].
At the winemaking industrial level, T. delbrueckii attracted attention due to a set of relevant characteristics that brought benefits to the final products, namely, improvements in the aroma profiles correlated with the production of specific fruity esters, terpenes, thiols, higher alcohols and glycerol, together with low acetaldehyde and acetic acid levels [8,9]. In addition, the diversified mouthfeel properties caused by the release of mannoproteins or polysaccharides are an advantage when using this yeast to perform must fermentation, enhancing the sensory perception of the wine [2]. Concerning other industrial uses, T. delbrueckii also gathers important biotechnological properties: (a) high production of lactic and succinic acids [10,11], enhancing the applications in the food and beverages’ markets, to produce biodegradable polymers and to potentially replace maleic anhydride [12]; (b) great tolerance to freezing and freeze-thawing, making it suitable for commercial applications in frozen dough formulations [13,14,15]; (c) high osmotic and sulfur dioxide resistance [11,16,17]; (d) in beer fermentation, T. delbrueckii influences the aromatic profiles in the brewing process, transforming hip aroma terpenoids and increasing the levels of ethyl hexanoate and ethyl octanoate [18,19]; (e) in mezcal fermenting process, the use of this species showed increased levels of phenyl acetate and of β-fructofuranosidase enzymes with fructosyltransferase activity [20,21]; (f) in other fermented products, T. delbrueckii allowed the obtaining of a balanced aromatic and fermentative profile, producing a more diversified array of volatile compounds than the ones obtained with S. cerevisiae strains, in particular for the production of cocoa [22], tequila [23], cider [24], mead [25] and cheese [26].
In addition, T. delbrueckii has genomic features that justifies its advantageous use in industrial applications. Recently, we improved the genome annotation of this species [27], annotating for the first time 32 new proteins in the type strain CBS1146, and revealing particular differences compared to S. cerevisiae, connected with metabolism and other functional categories allied with fermentative performance. Furthermore, the recent analysis of the pangenome of this species, achieved using 62 T. delbrueckii genomes [28], revealed the existence of five major phylogenetic clades associated with the ecology and geography of the strains. These studies helped to understand the existence of genomic changes associated with the different origins, even though the full phenotypic features associated with them were still lagging behind in terms of characterization and scrutiny.
The phenotypic diversity of large strain collections of S. cerevisiae was explored for decades, allowing the choice of promisor strains to enhance the wine’s sensorial attributes [5,29]. The most relevant physiological and phenotypic characteristics of this species, for a commercial use, are high fermentation rates, optimum fermentation temperature, stress resistance (ethanol, osmotic and acidic), killer phenotype, sulfur dioxide (SO2) tolerance, hydrogen sulfide (H2S) production, glycerol and acetic acid production, synthesis of higher alcohols (e.g., isoamyl alcohol, n-propanol and isobutanol), β-galactosidase and proteolytic enzyme activity, copper resistance, foam production and flocculation [30,31]. On the contrary, the phenotypic diversity of T. delbrueckii was not yet extensively investigated, despite its increasing interest for industrial applications. Existent studies focused only on a small subset of strains, or on only a few physiological parameters. Ciani and Maccarelli [10] studied the fermentation properties of several non-Saccharomyces species, including 90 strains of T. delbrueckii, but giving attention to only a small number of the phenotypic traits (fermentation rate, production of ethanol and seven fermentation by-products). In 2009, Renault et al. [32] evaluated the oenological properties of 21 T. delbrueckii strains, expanding the current knowledge to the evaluation of major volatile compounds. The authors drew conclusions about the high fermentation capacity associated with this species, combined with the low levels of undesirable volatile compounds produced (in particular, hydrogen sulfide and volatile phenols), low volatile acidity and low glycerol production, in opposition to other non-Saccharomyces species. More recently, Escribano et al. [33] evaluated the physico-chemical parameters of the wines fermented with several non-Saccharomyces species, and drew conclusions about the abundance of aromatic compounds at the end of the fermentation. Even though this study included the evaluation of a large number of phenotypic traits, only eight strains of T. delbrueckii were screened. To the best of our knowledge, no study addressing a large set of T. delbrueckii strains and the diversified array of phenotypic and metabolic traits was yet available. This type of screening is mandatory to evaluate the T. delbrueckii intra-strain differences and lay the foundations for commercial strain selection programs. The aim of this study was to assess the phenotypic and metabolic technological-relevant features of a large collection of T. delbrueckii strains, evaluating their potential, especially for the wine- and bread-making industries.

2. Materials and Methods

2.1. Strain Collection

A T. delbrueckii strain collection was constituted, comprising 40 isolates with diverse geographical origins and belonging to seven technological/ecological groups: wine (11 isolates, 1 of which is a commercial strain); other beverages (2 isolates); bread (4 isolates); food (5 isolates); arboreal/soil (11 isolates); water (3 isolates); clinical (1 isolate) and 3 isolates of an unknown origin (Supplementary Materials, Table S1). All strains were stored at −80 °C in cryotubes containing 1 mL of glycerol (30%, v/v). Before use, the yeasts were inoculated in YPD plates (yeast extract 1% (w/v), peptone 2% (w/v), glucose 2% (w/v), agar 2% (w/v)), cultured for 48 h at 30 °C, unless otherwise stated in the text. The genome of all of the strains was already sequenced in our previous work [28], confirming the identification of all of the isolates at the species level.

2.2. Phenotypic Characterization

Phenotypic characterization of the T. delbrueckii strain collection was performed for a wide range of physiological traits, relevant to the wine and bread-making industries. Two sets of phenotypic tests were performed, the first one based on liquid cultures, and the second one based on solid media. In the first set of phenotypic tests, strains were inoculated into replicate wells of 96-well microplates, following an adaptation of Mendes et al. [30]. Prior to each experiment, the isolates were grown overnight at 30 °C in liquid YPD medium (yeast extract 0.5% (w/v), peptone 1% (w/v), glucose 2% (w/v)). After washing with PBS 1×, the cells were inoculated at a final optical density of 0.1 (OD640nm = 0.1), in quadruplicate, into 96-well microplates containing MS medium [34] supplemented with the appropriate compound requirements to satisfy the different test conditions, as explained further below. The yeast growth was measured considering the values of optical density achieved after 46 h of incubation. This first screening included the following tests: growth at different temperatures (15, 25, 30 and 37 °C) and using different carbon sources (glucose, fructose, maltose, sucrose); ethanol resistance (5, 10, 14 and 18% (v/v)); tolerance to osmotic, salt and oxidative stresses (1.5 M NaCl, 1 M KCl and 2 mM H2O2). Growth was also evaluated in the presence of copper sulphate (5 mM CuSO4) and the fungicides, fluconazole, myclobutanil, metalaxyl and tebuconazole (0.5 mg/mL).
In a second set of phenotypic tests, β-glucosidase activity, hydrogen sulfide (H2S) production, ethanol (12% (v/v)) plus sulfur dioxide (SO2) resistance and killer activity were also assessed. All of these tests were performed in solid media, using 5 μL of cell suspensions (OD640nm = 1.0), and subsequently incubating the plates at 30 °C. Although cell suspensions for the β-glucosidase activity and killer activity tests were prepared from 48 h-old cultures grown on YEPDA medium, for the other assays they were prepared from an overnight pre-culture in YEPD medium. The β-glucosidase activity was tested using two different solid media containing arbutin or esculin as sole carbon sources. The arbutin medium was prepared according to Rosi et al. [35], while the esculin medium was prepared according to the Bile Esculin agar’s manufacturer’s instructions (Merck®, Kenilworth, NJ, USA). The cells’ ability to grow and the consequent appearance of a brown color in the colonies, or the appearance of a brown-blackish halo around them, was associated with the production of β-glucosidase. The color alteration or the halo formation (halo size) was examined after 2, 4, 6 and 8 days in arbutin plates, or after 2 days in esculin plates. The yeast S. cerevisiae (BY4741) and an uninoculated plate were used as negative controls [36].
H2S production was evaluated using a bismuth glucose glycine yeast agar medium (BiGGY agar—Fluka®, St. Louis, MO, USA; [37]), followed by incubation at 30 °C for 2 days. The color of the colony allowed for the estimation of high (dark brown color), intermediate or low (no color change) producers of H2S. Resistance to SO2 was evaluated on modified Malt Extract Agar—VegitOne medium (MEA—Millipore®, Burlington, MA, USA)—supplemented with 12% (v/v) of ethanol, and increasing concentrations of SO2 (0.25, 0.5, 1.0 and 1.5 mM). Susceptibility phenotypes were registered after incubation at 30 °C for 5 days. Killer activity was measured using the medium described by Buzzini and Martini [38], with some modifications. YEPDA medium containing 0.0015% (w/v) of methylene blue (MB) and 0.5% (w/v) of NaCl was adjusted to pH 4.2, with sodium citrate/phosphate buffer. Previously characterized sensitive, killer and neutral S. cerevisiae strains were used as the controls. Cell suspension of each strain and the respective controls were plated in two sets of plates (YEPDA-MB), seeded with a sensitive or a killer strain, and the consequent phenotype was registered. The phenotype was considered as sensitive if a blue-colored killing zone appeared in the spot, and it was considered as killer if a blue-colored zone with an inhibition halo appeared around the cells. A negative reaction indicated that the tested cells had a neutral phenotype.
To complete the phenotypic characterization of the T. delbrueckii strain collection, the freezing resistance was also assessed, using the protocol described by Alves-Araújo et al. [15]. Briefly, yeast cells were grown on liquid YPS medium (yeast extract 0.2% (w/v), peptone 2% (w/v), sucrose, 4% (w/v), 0.2% (w/v) KH2PO4 and 0.1% (w/v) MgSO4.7H2O), at 30 °C, until reaching the initial stationary phase (2.4–2.7 × 10⁸ cells/mL). After being harvested, washed and suspended in sterile water to a OD640nm of 12–20, cells were suspended in LF liquid storage medium [39], formulated to simulate bread dough. Samples were frozen at −20 °C for different time periods (15, 30, 80 and 120 days). Afterwards, at each time point a sample was thawed, and serial diluted, spotted onto the YEPDA plates, and the colony-forming units (CFU) were counted after 48 h of growth at 30 °C.
All phenotypic results were assigned to a class between 0 and 3, to facilitate the mathematical data comparison between different experimental datasets, as previously described [30]. In detail, the growth was scored in the following way, both in liquid and solid media: score 0 represents no growth (DO640 = 0.1) or no visible growth on solid media; score 3 represents at least 1.5-fold increase of DO640, and extensive growth on solid media; scores 1 and 2 indicate intermediate values. For the change of color in arbutin and BiGGY media: score 0 corresponds to no visual growth after 2 or 8 days; score 3 corresponds to dark brown or brown color colonies, and scores 1 and 2 to color colonies ranging from white to brown. The halo size obtained in the esculin medium was categorized in the following way: score 0 was attributed to colonies that did not show a halo; score 3 to colonies with a halo size higher than 0.6 cm, and scores 1 and 2 to halo sizes below or equal to 0.4 cm (S. cerevisiae control) or to a halo size between 0.4 and 0.6 cm, respectively. Cell viability after freezing, in a similar way, was categorized using the following scores: score 0 stands for cell viability < 50% after 15 days; score 3: cell viability > 50% after 120 days; scores 1 and 2: cell viability < 50% after 30 days, or <50% after 80 and 120 days. Finally, for the killer activity assessment, binary attribution was used, scoring 1 in the case of the existence of a killer or sensitive phenotype, and 0 when its absence is noticed (neutral strains).

2.3. Individual Fermentations and Metabolites Quantification

Each T. delbrueckii strain was subjected to individual fermentations, in triplicate, using MS medium (ratio of 1:2 of medium to void volume), at 18 °C, according to Franco-Duarte et al. [5]. Fermentation samples were collected after 196 h, and treated with perchloric acid (2% (v/v)) on ice for 30 min, for deproteinization. After centrifugation at 12,000× g for 10 min, supernatant samples were filtered through a 0.22 μm pore filter, and used for further analysis.
The fermentative profile of T. delbrueckii strains was evaluated using a high-performance liquid chromatography (HPLC) apparatus, equipped with carbohydrate H+ 9 μm HyperRez XP column (Thermo Scientific™, Waltham, MA, USA), in order to quantify the ethanol, sugar (glucose), glycerol and organic acids (acetic, citric, formic, succinic acids). The column’s temperature was 40 °C and the flow rate was 0.5 mL/min, constant during the race time of 30 min. The metabolites were identified through their relative retention times, compared with the respective standards. To determine the concentration of the detected compounds, arabinose (20 g/L) was used as the internal standard. Chromeleon 7.2.9 software was used for data collection.

2.4. Data Analysis Using Statistical and Data Mining Methods

The phenotypic and metabolic inter-strain variability of T. delbrueckii was evaluated by principal component analysis (PCA), available in the Orange data mining suite software v. 3.25.0 [40]. A set of standard predictive data-mining methods were used for the inference of prediction models. Data analysis was performed in the Orange software, and validated in python, using the scikit learn package. In particular, naïve Bayes, decision tress, support vector machines (SVM), k-nearest-neighbor (kNN) classifier, random forest, stochastic gradient descent (SGD), CN2 rule inducer and neural networks were used to predict the technological groups of the 40 T. delbrueckii strains, using both phenotypic and metabolic datasets. After 10-fold cross validation of the training data, performance scores were assessed, in particular the area under the receiver operating characteristics (ROC) curve (AUC) [41], that estimates the probability that the predictive model would correctly differentiate between distinct technological applications, given the associated pairs of strains. Based on the performance scores, neural networks were selected as the best classifiers, and used to build a confusion matrix comparing the predicted groups with the real ones.

3. Results and Discussion

3.1. T. delbrueckii Intra-Strain Phenotypic Heterogeneity

Our set of T. delbrueckii strains included 40 isolates from different geographical and technological applications (Supplementary Materials, Table S1). Strains were categorized into seven different technological/ecological groups, according to their origins: wine (1 commercial wine strain and 10 isolates obtained from winemaking environments); other beverages (2 isolates); bread (4 isolates); food (5 isolates from vegetables, fruit and dairy products); arboreal/soil (11 isolates from vascular plants, leaves and soil); water (3 isolates from river and sea waters); clinical (1 isolate) and 3 isolates with unknown origin. Phenotypic screening of this entire collection was performed to evaluate the strain-specific patterns, using a battery of phenotypic tests with potential biotechnological interest, especially for the wine and bread-making industries. As presented in Table 1, the phenotypic results revealed a substantial phenotypic variation among the entire T. delbrueckii strain collection. This is, to the best of our knowledge, the largest phenotypic characterization of a T. delbrueckii strain subset.
The response of the T. delbrueckii strains to different conditions was first assessed by monitoring their growth in 96-well microplates using liquid MS medium, simulating grape must, as previously described by Mendes et al. [30]. The phenotypic tests included growth at a vast range of temperatures and in different carbon sources, as well as in the presence of fungicides, ethanol, and under osmotic, salt and oxidative stresses. According to the results (expressed by growth performance, graded from 0 to 3), a large number of the yeasts displayed an absence of growth at 37 °C, (class 0), showing that this temperature is already extreme for T. delbrueckii. On the other hand, the temperature range between 25–30 °C appears to be the optimum range for the growth of T. delbrueckii, since a large number of strains were labelled in class 3 under these conditions. According to the literature, the optimum growth temperature for S. cerevisiae is within the range of 30–35 °C [42]. The ideal temperature for T. delbrueckii, according to the results obtained in this work, and in agreement with what was found for one T. delbrueckii strain in another study, appeared to be between 25 and 30 °C. In this way, the optimum temperature for T. delbrueckii seems to be slightly lower than the one reported for S. cerevisiae [43]. Nonetheless, the ability to grow under lower temperatures can be an advantageous feature for the manufacture of specific wines, such as rosé and white wines, whose conditions contribute to an increase in the production of volatile compounds, alongside a fresh character during yeast fermentation [44]. As shown in Table 1, some strains exhibited good growth capacity at 15 °C (eight strains achieved class 3—DO640nm > 1.0, and 65% were categorized in class 2), which could be applied in the aforementioned wine styles. This finding suggests a phenotypic adaptation, similar to that reported for S. cerevisiae, which synthesizes the proteins involved in the response to low temperatures [45].
As expected, cell growth decreased drastically with increasing concentrations of ethanol, except for the concentration of 5% (v/v), in which 36 strains (90% of the screened collection) were attributed to class 3 (Table 1), which indicate that above this concentration cell growth was severely affected. T. delbrueckii strains evidenced metabolic flexibility, being able to process all of the tested carbon sources, a relevant feature both in the wine- and bread-making industries. However, while all of the strains were able to metabolize glucose, fructose and sucrose (100% of the strains reached at least class 2, >95% of the strains in class 3), the results regarding the cells’ ability to process maltose demonstrated greater heterogeneity, as only 80% of the strains were categorized in classes 2 or 3. The T. delbrueckii strains appeared to have less preference for maltose, in comparison with the other tested carbon sources. This differential preference was revealed to be statistically significant (Supplementary Materials, Figure S1), leading to the conclusion of a similar phenotypic behavior between T. delbrueckii and reports on S. cerevisiae [46], as both grew in the presence of glucose, fructose, sucrose and maltose, but revealed less preference for maltose degradation. However, all of the T. delbrueckii strains showed at least residual growth (duplication of the initial optical density; class 1) in maltose, which indicates that this carbon source could be metabolized by all of the T. delbrueckii strains tested. This is of particular importance since maltose is a compound found in some wines [47] and is a major substrate in bread dough fermentation [48]. When comparing our results with the assimilation tests described by Kurtzman et al. [49] for the physiological description of the species T. delbrueckii, we confirmed slow/weak growth at 37 °C as a particular feature of this species, and also a strong capacity to assimilate glucose.
Particular differences were, however, observed, regarding some of the tests. First, the assimilation of sucrose revealed that 100% of the strains were able to assimilate this carbon source, even though Kurtzman et al. reported a variable pattern. Capacity to grow in the presence of NaCl was reported as positive by Kurtzman et al., but our strains showed a variable pattern, which could be justified by a difference in the concentrations tested in both works. The ability to assimilate maltose as a carbon source was classified as variable by Kurtzman et al., even though in our work all of the strains were able to use it for growth, however, with different rates.
Despite presenting different structures, glucose and fructose share the same empirical formula (C6H12O6), and were previously shown to be transported by T. delbrueckii, across the cell membrane through common carriers, enabling the yeast to use both fermentable sugars in the wine must [50,51]. When available simultaneously in the media, glucose is usually used at a faster rate than fructose, due to the higher affinity of the transporters for glucose [52]. When used as sole carbon sources, however, comparison of growth was not significantly different with fructose or glucose (Supplementary Materials, Figure S1 and Table 1). Sucrose, a disaccharide, can be hydrolyzed by S. cerevisiae into one molecule of glucose and another of fructose, through an extracellular invertase present in this yeast, which enables the separation into these monosaccharides [53]. T. delbrueckii invertase activity was also described in a baker’s yeast strain [54], and seems to be generalized to this species, enabling growth in MS medium supplemented with sucrose.
Strains’ growth when exposed to stressful conditions revealed a wide heterogeneity associated with this yeast species. In the presence of NaCl (1.5 M), an osmotic stress inducer, strains were distributed throughout all of the classes, with the majority centered at class 2 (and only 5% of the strains unable to grow), while under saline stress mimicked by the presence of KCl (1 M), almost all of the cells reached class 3 of growth. Overall, our results on T. delbrueckii revealed a good ability to grow in the presence of NaCl and KCl, which is in agreement with Hernandez, Prieto & Randez-Gil [14], hypothesizing this capacity as a strain-dependent feature. It was noteworthy that the NaCl test contributed greater strain heterogeneity than KCl, which was corroborated by the same authors, who highlighted a more toxic effect of NaCl than KCl, in equivalent concentrations. In the presence of other stress-inducing compounds, such as hydrogen peroxide (2 mM) and copper (5 mM), the yeasts revealed a high variability, with some being completely inhibited by these compounds (32.5% and 47.5% of strains, respectively, categorized in class 0). Yeasts exposed to stressful factors undergo modifications at distinct levels, from metabolic and gene expression alterations, to morphological and behavioral changes, which can interfere with the fermentation process [55,56]. Nonetheless, these adaptations can lead to strain diversity, as some species, namely S. cerevisiae, develop specific control mechanisms that trigger responses, as, for example, the activation of the HOG pathway, in order to survive. In this context, a balance is required by the cell once the overactivation of the aforesaid pathway could be lethal, while the lack of its activation turns the cells osmo-sensitive [57]. In this context, the adaptation process may be associated to common defense mechanisms in these strains, in contrast to those with growth difficulties. Regarding other stress-inducing compounds such as copper (CuSO4) and H2O2 (oxidative stress), a large behavioral diversity of the T. delbrueckii strains was observed. Scarce information is available regarding the adaptation of T. delbrueckii to these chemicals. However, the works of Budroni et al. [58] and Capece et al. [59] on S. cerevisiae flor yeasts, revealed that their ability to create films on the surface of wine is related to their resistance to copper, to oxidative stress and even to ethanol resistance. Thus, the observed T. delbrueckii specific adaptation, when subjected to these factors, deserves additional work.
Additionally, most strains revealed the ability to grow in the presence of the fungicides myclobutanil, metalaxyl, tebuconazole and fluconazole; all were tested at a concentration of 0.5 mg/mL, although with differentiated growth performance. In detail, metalaxyl revealed to be completely innocuous to T. delbrueckii at the concentration tested (100% of strains categorized in class 3), while myclobutanil was the one with less strains achieving higher growth categories. These results about fungicides’ resistance are of great importance since the control of undesirable microorganisms and diseases, through the application of fungicides and pesticides, is one of the major goals to protect wine production nowadays [60]. In addition, chemical fungicides which are usually not specific for pests can lead to the presence of organic residues in the vineyards, which remain in the must, affecting the biological function of other microorganisms, including those used in the fermentation of food and beverages [61]. However, their effect on the growth of T. delbrueckii was until now unknown, at least in great detail. As reported in the literature, metalaxyl is one of the fungicides that display an inhibitory effect on the growth of fungi [62]. However, our results showed no effect of this fungicide on the growth or viability of T. delbrueckii at the concentration of 0.5 mg/L, a value, in fact, higher than the one tested by Wang et al. [62], which could represent a low sensitivity of this species to this particular fungicide.
The maximum residue level limit for metalaxyl present in wine grapes is currently set by the European Union at 1 mg/L, and Russo et al. [61] report T. delbrueckii as having a higher resistance than strains of S. cerevisiae, when inoculated in medium supplemented with a mixture of metalaxyl and folpet. Fluconazole, myclobutanil and tebuconazole induced inhibition of T. delbrueckii cell growth (Table 1), which is in accordance with the reports by François et al. [63]. However, since only one concentration (0.5 mg/L) was tested for all four of the fungicides, we cannot exclude that metalaxyl could have an effect for higher concentrations, at least for some strains.
The second set of tests included in the phenotypic screening was performed in solid culture media and consisted of the evaluation of β-glucosidase activity, hydrogen sulfide (H2S) production, sulfur dioxide (SO2) resistance and killer activity (Table 1). The β-glucosidase production, translated into the potential ability to improve wine aroma profiles [64], was assessed by growing the cells in two different solid media, containing arbutin and esculin as sole carbon sources. Results showed high heterogeneity in both media, since the strains were distributed across all of the classes, even though most strains were assigned to classes 1 (48% for arbutin and 30% for esculin media) and 2 (45% for arbutin and 60% for esculin media). T. delbrueckii is not commonly known as a β-galactosidase producer, even though some reports have already described that some strains demonstrate efficiency in fermenting lactose, concluding about the presence of β-galactosidase [65,66].
Evaluation of hydrogen sulfide (H2S) production, an undesirable metabolite associated with off-flavors [67], demonstrated that most T. delbrueckii isolates appeared to produce intermediate (class 2–25% of the strains), to high amounts (class 3–60% of the strains) of H2S. This production was evaluated using BiGGY agar medium, containing bismuth sulfite, which reacts with H2S to form a brown precipitate, which allows a distinction to be made between colonies using their color: the higher the H2S production, the darker their colonies appear. This variation in color also reflects differences in sulfite reductase activity, as shown by Jiranek et al. [37]. The T. delbrueckii strains tested in the present work showed a high capacity to produce H2S, with 60% of the strain collection achieving the higher phenotypic category. These results are opposed to what was known so far regarding this species, since in the work of Renault et al. [32], no strain achieved the higher level of production, with almost all of the strains categorized as average producers. However, since the strains used as controls were not the same, the results could not be properly compared.
Additionally, the phenotypic results regarding the resistance to sulfur dioxide (SO2), an agent widely applied in the wine industry [68], evidenced a marked distribution between all of the phenotypic classes. This compound is used as a preservative in oenology, serving as an antioxidant, antimicrobial and anti-oxidasic [69]. As expected, there was a direct correlation between the increasing SO2 concentrations and the growth inhibition of the yeast, but even despite the observed susceptibility, some strains were able to grow at the higher concentration of SO2 (1.5 mM). Since this test combines double resistance to SO2 and ethanol at 12% (v/v), we should analyze that some differences were observed regarding the strains’ resistance to ethanol, when comparing with results obtained using a liquid synthetic medium. We hypothesize that some ethanol evaporation could help to justify the differences observed in the tests, even though we believe the influence should be the same for all of the strains when comparing the same batch of tests. The high resistance of T. delbrueckii strains to sulfur dioxide, detected in the present study, is shared with other species (S. cerevisiae, Saccharomycodes ludwigii, Hanseniaspora sp., Zygosaccharomyces bailii), even though others are more sensitive (Kloeckera apiculate and Hansenula anomala) [68]. These results highlight the importance of using T. delbrueckii to ferment musts with higher presence of SO2, thus preventing the growth of spoiler species such as Brettanomyces spp.
The results presented in Table 1, indicate that only one strain in the T. delbrueckii entire collection had a killer activity against previously characterized S. cerevisiae strains, used as controls. In contrast, four strains presented a sensitive phenotype against the killer S. cerevisiae strain. The finding of one T. delbrueckii killer yeast could represent an important result for the winemaking industries, since this isolate could kill the omnipresent Saccharomyces yeasts, during fermentation, improving the quality of wine by bringing the advantages associated with T. delbrueckii fermentations. Isolation of the T. delbrueckii killer strains was already reported before [70], although not in the depth usually found for S. cerevisiae. In addition, the results of Velásquez et al. [71] and Ramírez et al. [72] show the isolation of new T. delbrueckii killer strains, that dominated and completed the must fermentation, obtaining values above 11% of ethanol, in opposition to the non-killer strains.
Tolerance to freezing stress conditions, perceived by the preservation of cell viability over 120 days at −20 °C, also revealed great phenotypic variability. Nevertheless, only seven strains did not demonstrate any resistance to freezing. Our results are in accordance with the ones obtained by Alves-Araújo [15] showing that the T. delbrueckii strain PYCC5323 did not lose cell viability for at least 120 days at −20 °C. However, in the mentioned work, S. cerevisiae baker’s yeast lost 80% of its viability in these conditions, after 15 days. Our baker’s strains, on the contrary, showed no loss of viability in the assay, with results showing more than 50% of cell viability after the 120 days of freezing (class 3 of growth) for these strains. Furthermore, the resistance to freezing seems to be a more generalized phenotype in this species, as most stains (67.5%) were graded in class 2 or 3 for this feature.

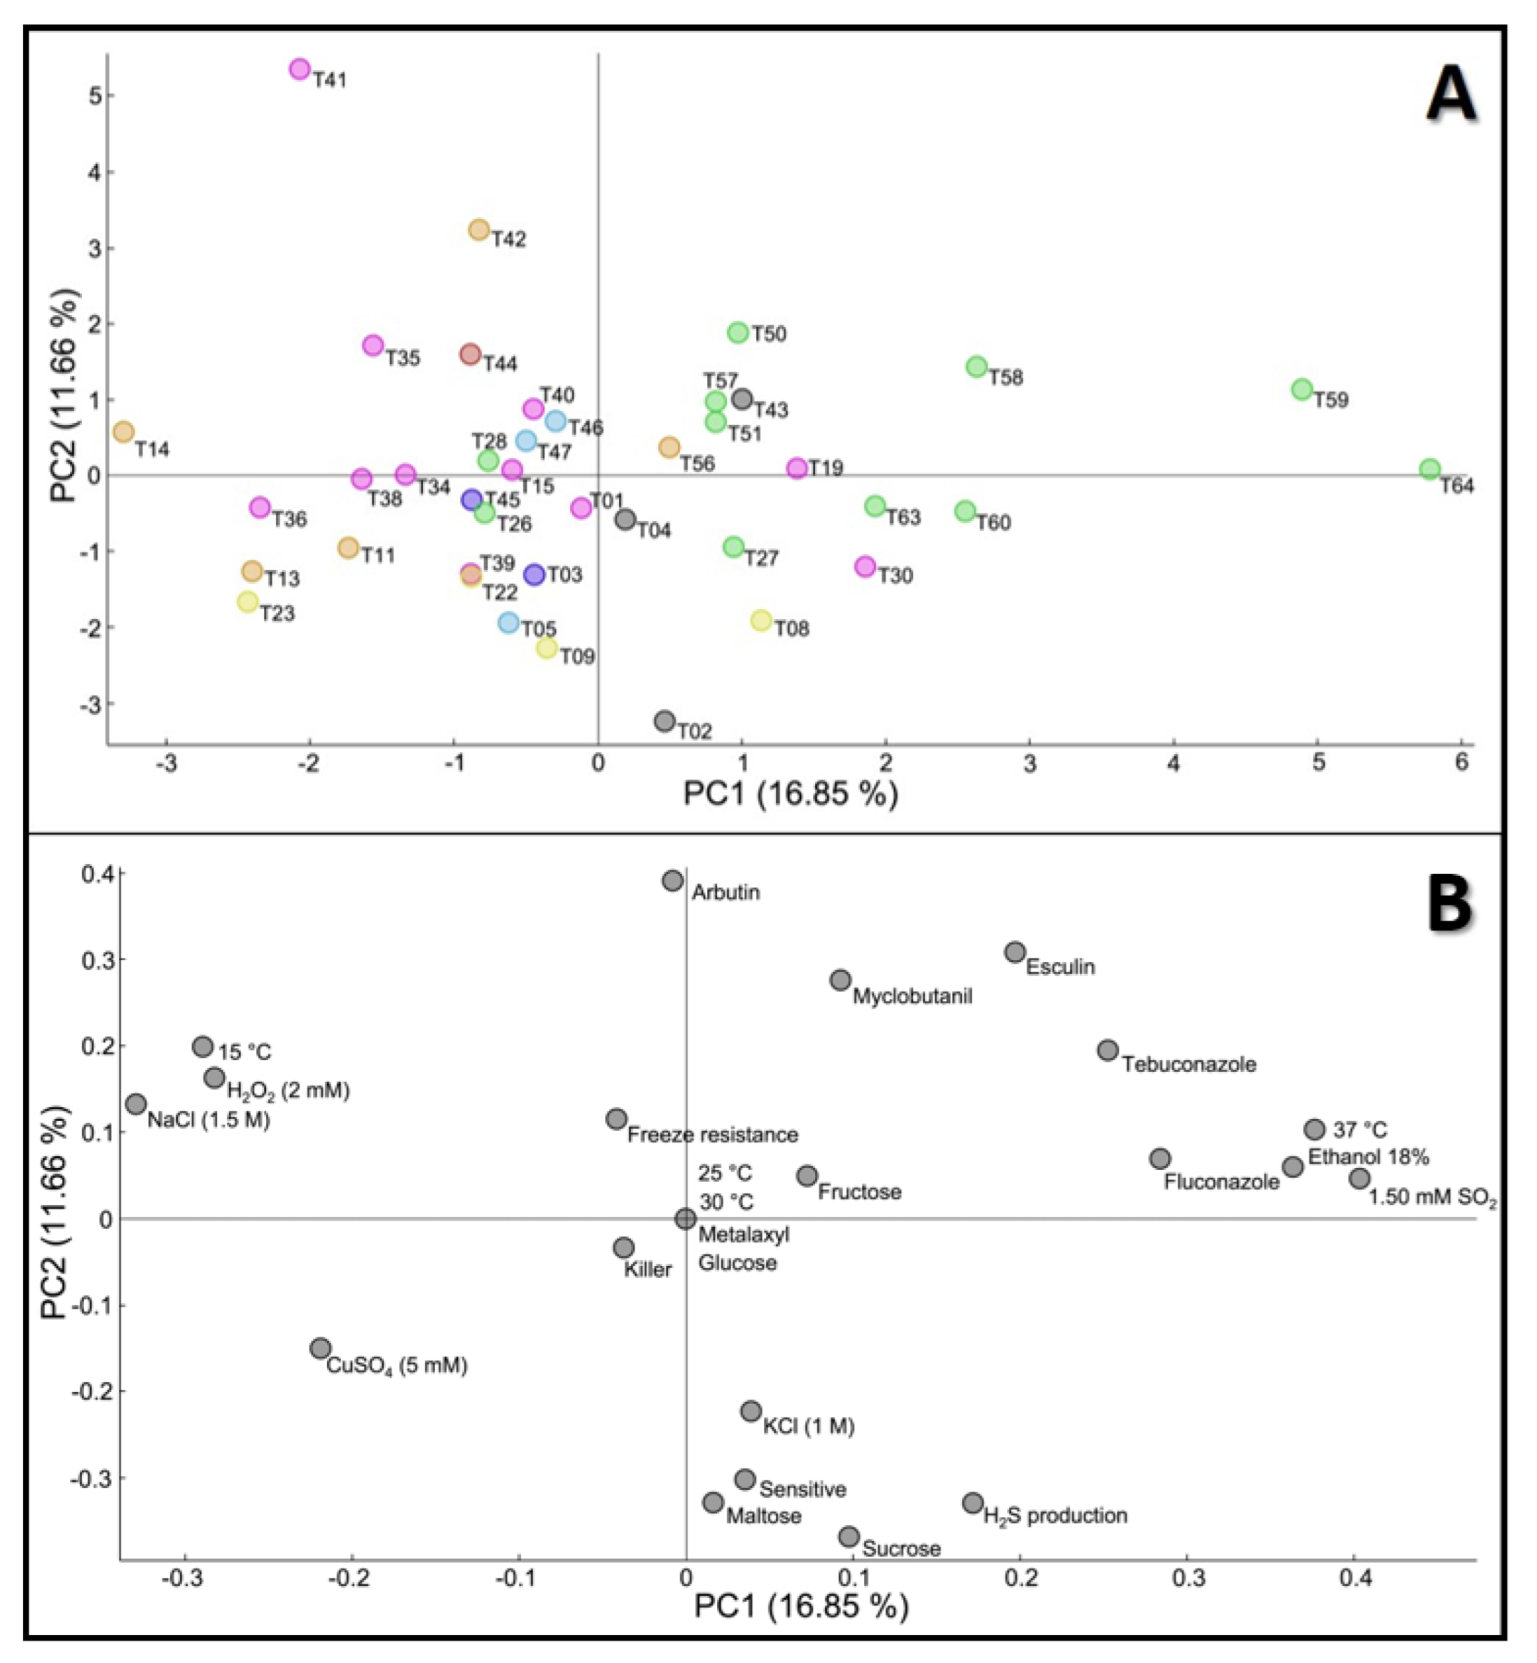
3.2. Principal Component Analysis Evaluation of Phenotypic Variation

The global profile of intra-strain phenotypic variation was evaluated using principal component analysis (PCA) of the data generated in the screening approach, carried out considering 31 phenotypic tests from a set of 40 strains. From the totality of the 31 phenotypic tests performed, in order to avoid overfeeding of the statistical models, only a single concentration of ethanol and of SO2 were considered in the PCA. In particular, a preliminary test was performed to evaluate the contribution of each test for the global PCA heterogeneity, and only the ones with higher relevance were considered. However, identical results would be obtained with the remaining ethanol and SO2 concentrations. In this way, a total of 24 of the most relevant tests were considered in the PCA analysis.
PCA results showed the segregation of all of the isolates (Figure 1A—scores) and the phenotypic variables (Figure 1B—loadings), in the first two PCA components. Strain variability is explained by the first two principal components, up to a total of 28.6% (PC1—16.9% and PC2—11.7%). The visualization using PC1 and PC3 is presented in the Supplementary Materials, Figure S2, and explains a total of 27.5% of strain variability (PC1—16.9% and PC3—10.6%). Each strain was categorized according to their technologic group, in order to relate them to their phenotypic behavior. Although all of the variables contributed to the diversity of the species, the phenotypes responsible for the highest diversity observed between the strains appear to be related to the presence of SO2, in the presence of high ethanol concentration (18% (v/v)), and the use of high temperatures (37 °C), all discriminated by the first component (the one explaining the higher percentage of variability). The second component (PC2, highlighting 11.7% of variability), showed a marked influence mainly by the β-galactosidase activity evaluated on the arbutin medium, the capacity to assimilate sucrose and maltose, and also by the capacity to produce H2S and the sensitive phenotype in the killer test (Figure 1B).
As displayed in Figure 1A, PCA allowed the visualization of some clear patterns between strains sharing the same origin. A separation, not total but representative, of arboreal/soil isolates () was obtained within the first component (PC1), with these strains accumulating mainly in the right part of the PCA. These results indicate a marked influence of these strains by the presence of high ethanol concentrations and SO2 in the media (higher resistance), by the growth at 37 °C (higher resistance) and by the effect, although to a lesser extent, of NaCl, H2O2 and 15 °C (lower resistance). The opposite was observed for the yeasts from the other groups, in particular for the strains from food (); bread (); water (); clinical (); other beverages () and unknown origins (●), that were mostly concentrated in the left quadrants of the PCA.
The same type of separation, mainly between arboreal/soil and winemaking strains, was also validated by the heatmap clustering, as shown in the Supplementary Materials, Figure S3. The group of wine strains () showed a slight dispersion throughout all of the quadrants of the PCA, even though they accumulated mainly in the left part of the PCA. The largest exception was strain T30, the only commercial strain in the collection, which stood out from almost all of the remaining ones, locating near the arboreal/soil isolates, under the influence of PC1 (Figure 1A). The positioning of this commercial strain, apart from the remaining natural wine strains, points to particular phenotypic features of this isolate, highlighting their ethanol and SO2 resistance, together with a higher capacity to grow at 37 °C, characteristics that are important for its commercial use. Strains isolated from water (), other beverages () and unknown (●) groups, also show particular clusters in the left part of the PCA. However, a higher number of the strains from these groups should be studied, to establish more robust correlations. In a similar way, the only clinical isolate considered in this study, (), was located in the upper central part of the PCA, but due to the unrepresentative number of strains from this group, further analysis will be needed before drawing any conclusions.

3.3. Metabolic Characterization

The metabolic profile of T. delbrueckii was evaluated by HPLC quantification of supernatants collected after 192 h of individual fermentations, performed in MS medium at 18 °C. Inter-strain differences were observed regarding the production and consumption of different compounds, such as glucose, ethanol, organic acids (citric, succinic, acetic and formic) and glycerol (Supplementary Materials, Figure S4). PCA visualization of metabolic data (Figure 2), obtained after HPLC analysis of samples from the end of fermentation, explained approximately 62% of strain variability in the first two components (PC1—33.53% and PC2—26.78%; PC1 versus PC3 represented in the Supplementary Materials, Figure S5). This analysis showed that strain variance was mainly influenced by glucose and acetic acid concentrations at the end of the fermentative process, but also by the quantification of ethanol and citric and succinic acids (Figure 2B). Formic acid, due to its almost residual production by T. delbrueckii strains, was placed in a neutral position in the center of the PCA, without any contribution to explain the strain variability.
Overall, even though HPLC analysis revealed that the inter-strain variability at 192 h of fermentation was higher than the inter-group differences, partial strain stratification was observed in the PCA, in accordance with their technological group (Figure 2A); the majority of wine () and arboreal/soil isolates () showed a tendency to be located on the left part of the figure, under the influence of the first component, explained by low levels of glucose and high production of ethanol, at the end of the fermentation. This segregation highlights a greater fermentative capacity of these isolates, in particular for strains T28, T63, T26, T35, T51 and T30, the latter being the commercial wine strain. From these sub-group of strains, only strains T30 and T35 belong to the wine category. Our hypothesis is that the remaining strains from this sub-group could have gained adaptation mechanisms, under the influence of particular environmental constraints, that increased their potential to be used in winemaking. Similar scenarios were already observed in other yeast species [73,74,75].
On the contrary, strains originating from food (), bread () and other beverages () are mostly spread in the lower part of the PCA, under the influence of PC2, this being justified by a possible increased production of acetic acid and lower fermentative power (less ethanol produced and high levels of residual glucose at the end of the fermentation), together also with a low production of citric acid. Strains from unknown origin (●) did not group in a well-defined cluster, being dispersed throughout the PCA, as expected, since they could have multiple origins. The T. delbrueckii type strain (T04) appeared detached from the other strains mainly due to low glucose consumption and ethanol production, which translated into poor fermentative power. A similar scenario was obtained before with S. cerevisiae, in which the laboratorial type strain showed reduced fermentative potential and lower production of aromatic and volatile compounds [31].
In fact, for almost all of the T. delbrueckii strains tested, a correlation between glucose consumption and ethanol production was observed at 192 h of fermentation, as strains with the greatest residual glucose contents (designated as reduced fermentative capacity) translated in lower levels of ethanol production, while those with higher fermentative power released superior concentrations of ethanol, as validated by the extreme positioning of these two variables in the PCA of Figure 2. The strain T11 (located at the far right of Figure 2A) showed the lowest fermentation yield, which could be correlated with its origin from food.
Our results are corroborated by the ones obtained by Alves-Araújo et al. [54], that showed a similar fermentative behavior between T. delbrueckii and S. cerevisiae, with regard to sugar utilization and regulatory patterns, and slightly lower ethanol yields. The T. delbrueckii species is usually defined as a low ethanol producer [2,25,76], however in the work of Escribano et al. [33], T. delbrueckii was also one of the highest ethanol producers, among the non-Saccharomyces species tested. Additionally, Canonico et al. [77] reported ethanol production in values higher than 12% (v/v) by T. delbrueckii strains, and Catrileo et al. [78], using adaptive laboratory evolution, were able to obtain a strain capable of producing ethanol levels of 11.5% (v/v). In this way, we concluded that this characteristic is strain-dependent, and should not be attributed as a feature associated to the species.
Concentration of organic acids (acetic, succinic and citric) explained a considerable part of the strain variability observed in this study at 192 h of fermentation (Figure 2 and Supplementary Materials, Figure S4). Strains T11 (obtained from food), T04 (the type strain), strains T57, T58 and T59 (the arboreal strains) revealed variable patterns in terms of the final concentration of these acids at the end of fermentation, not related to the average behavior within their technological group. The importance of these results is justified by the fact that the complexity of wines frequently arises due to the presence of these acids, as they have a direct influence not only on the color, taste and balance of the final product but also on the protection from bacteria that may exist in the environment.
Citric acid contributes to the wine aroma profile with a pleasant citrus-like taste [79]. Liu et al. [80] carried out individual fermentations for S. cerevisiae and T. delbrueckii and found similarities between both species regarding citric acid yields, as S. cerevisiae reached concentrations of 2.23 g/L and the two T. delbrueckii strains ranged from 2.18 to 2.36 g/L of citric acid produced. In the present work, no association between the strains’ origin and their citric acid production could be drawn.
Regarding succinic acid, our results evidenced a great heterogeneity of production at 192 h of fermentation, with concentrations ranging from 0.05 to 1.12 g/L, with the highest value being achieved, surprisingly, by the type strain. Our results are in agreement with the literature and with the ones obtained for S. cerevisiae. In fact, Franco-Duarte et al. [81], using natural isolates of S. cerevisiae, attained a maximum concentration of 1.13 g/L of succinic acid, a value equivalent to the one obtained in this study with T. delbrueckii. Puertas et al. [82] also reported T. delbrueckii to be a higher succinic acid producer, with measured concentrations ranging between 0.84 and 1.11 g/L, in comparison with S. cerevisiae that only reached maximum values of 0.65 g/L in the same study. Findings by Contreras et al. [83] and Liu et al. [80] reinforced this statement, by describing values greater than 1 g/L of succinic for T. delbrueckii, depending on the availability of oxygen during the fermentation process.
HPLC analysis emphasized a reverse contribution of succinic and acetic acid, which is in agreement with the reported effects on the fermentation yields for S. cerevisiae [81,84,85]. Acetic acid, a relevant end-product of fermentation, represents a key signature in the volatile acidity of wines and, therefore, in its aroma profile. However, excessive concentrations of this chemical are highly detrimental to the quality of the wine. S. cerevisiae’s ability to produce acetic acid is described as strain-dependent [86], with values ranging between 0.25–0.50 g/L, under specific fermentative conditions, but it may be greater in response to high-sugar levels, reaching up to 1.8 g/L or even higher [87]. On the other hand, T. delbrueckii is reported in the literature as a lower acetic acid producer [3,33,88], in comparison with S. cerevisiae. Our results show a great variability in what regards acetic acid production, as the lowest value of acetic acid detected at the end of T. delbrueckii fermentations was 0.01 g/L, associated with a strain from arboreal/soil origin, but the highest concentration achieved was 4.64 g/L, obtained by a strain from food ecology, which is far from the values reported for this species.
One final assessment regarding T. delbrueckii’s ability to produce acids concerns formic acid. Only three strains were able to produce this compound at the final stage of fermentation, in contents ranging from 0.13 to 0.22 g/L, revealing a poor or almost non-existent capacity of this species to release formic acid. Due to the limited information on the production by T. delbrueckii of this acid, to the best of our knowledge, no studies were found for this non-Saccharomyces species, and further evaluations should be used in the future to clarify it.

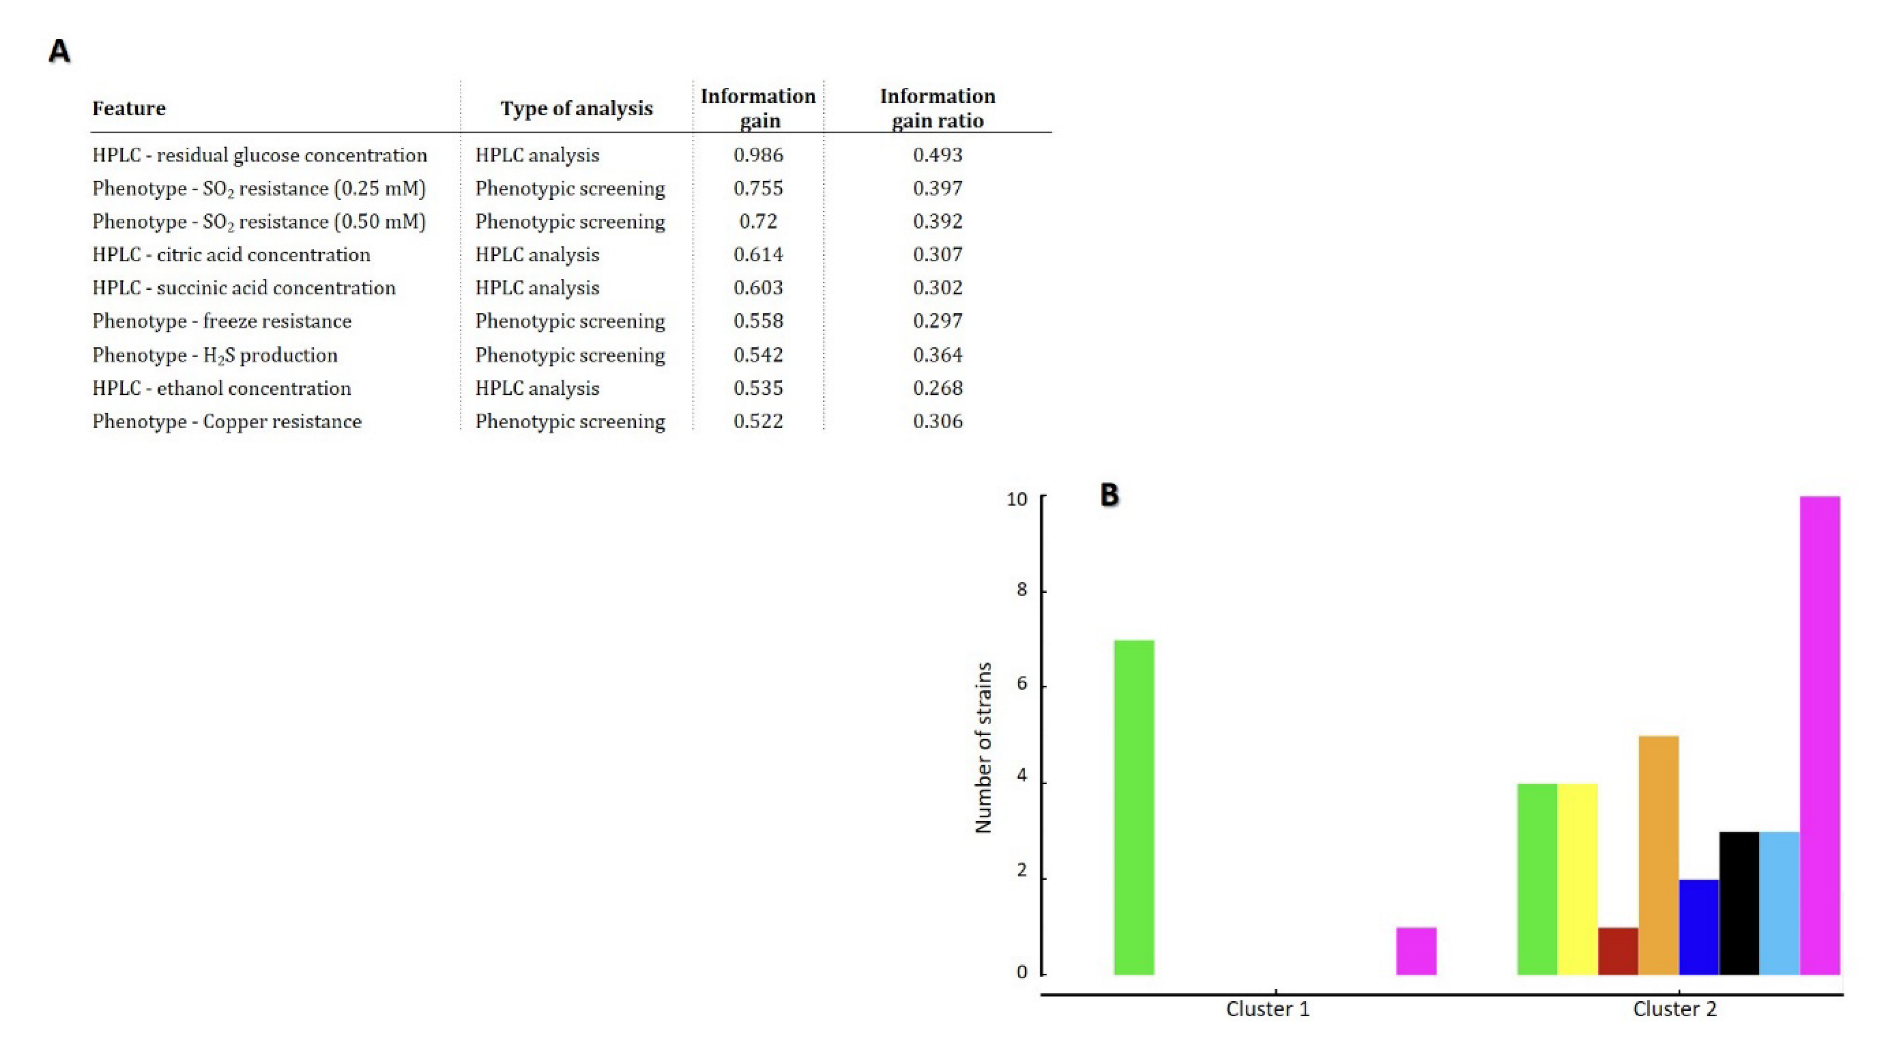
3.4. Bioinformatic Prediction of T. delbrueckii Biotechnological Potential

To correlate phenotypic and metabolic data, understanding their differential contribution to the strain heterogeneity of T. delbrueckii, the established dataset was analyzed through the k-means clustering algorithm [89]. Using silhouette score [90], the algorithm identified 2 significantly distinct clusters (Figure 3B), composed of 8 and 32 strains, respectively. The contribution of all of the metabolic and phenotypic features to the establishment of the two distinct groups was evaluated and weighted (Figure 3A).
Results show an equal contribution of both experimental methodologies (HPLC metabolites quantification and phenotypic screening), revealing that the final concentrations of glucose, ethanol and citric and succinic acids, together with the resistance to SO2, copper and to the freezing process, were the features most relevant to explain this differentiation. Interestingly, cluster 1 was composed almost entirely by arboreal/soil strains, with the exception of the commercial wine strain T30, that once again showed different patterns from the remaining wine strains. Cluster 2 incorporated the remaining strains, that showed characteristics shared by the remaining wine strains.
Our next goal was to construct a computation model robust enough to predict the T. delbrueckii biotechnological potential, based on its phenotypic and metabolic profiles. Eleven predictive models were used, and their performance was evaluated in terms of AUC, classification accuracy, F1 score, precision and recall (Supplementary Materials, Table S2). Neural networks were revealed as the classifier with the best performance metrics, and were selected for further analysis. Table 2 shows the confusion matrix obtained using the neural networks’ classification of the dataset, after 10-fold cross validation. The AUC score of the obtained predictions was 0.718, which is considered as moderately high [41], and well above that of an arbitrary classification (AUC = 0.5; the AUC score of a perfect classifier is 1.0). The confusion matrix obtained from cross-validation classifications shows that the majority of the strains from the larger groups were correctly assigned to the respective technological group (highlighted in red in Table 2), even though some incorrect classifications were obtained between the groups of arboreal/soil and wine groups, which are in line with the shared features observed before in other analyses. Poor results were obtained for the remaining groups, which is due to the corresponding small number of isolates.
These results demonstrate the potential of these models to classify yeasts based on their phenotypic and metabolic data, together with the capacity to predict strains capable of being used in winemaking or in applications related to the environmental/ecological field, using only the proposed experimental tests described in Figure 3A. Similar results were obtained by us before, using the same type of models, to successfully predict the biotechnological potential of S. cerevisiae [30,91].

4. Conclusions

In conclusion, the present work represents the first detailed and extended phenotypic and metabolic characterization of a large collection of T. delbrueckii strains, comprising physiological tests and analytical determinations, mainly focusing on tests with biotechnological potential for winemaking and bread production. Our results demonstrate also the usefulness of computational approaches to describe relevant features among groups of T. delbrueckii strains that might occur as adaptive mechanisms in specific environments, mainly directed to winemaking or ecological applications, once the two large groups of strains analyzed in this study were obtained in these environments. Our computational models failed to correlate phenotypic features with the geographical locations from where the strains were obtained, detailing, however, the strong correlation between the phenotypic heterogeneity and the strains’ technological group, which is in accordance with what was observed for other yeast species [30]. With the knowledge arising from this work, together with the models proposed, predictions about the biotechnological potential of T. delbrueckii can be drawn based on the experimental data, and, in this way, can facilitate the selection of candidate strains to be used commercially.

Supplementary Materials

The following supporting information can be downloaded at: https://www.mdpi.com/article/10.3390/jof8060569/s1, Table S1: Technological and geographical origins of the 40 Torulaspora delbrueckii strains used in this study; Table S2: Performance scores of the predictive classification algorithms after 10-fold cross validation, using the Orange data mining software for T. delbrueckii technological groups classification; Figure S1: Phenotypic data obtained after characterization of the 40 Torulaspora delbrueckii strains; Figure S2: Principal component analysis of phenotypic data of 40 T. delbrueckii strains, showing PC1 versus PC3; Figure S3: Heatmap of phenotypic data, after the characterization of the 40 Torulaspora delbrueckii strains; Figure S4: HPLC analysis of 40 T. delbrueckii strains after 192 h of fermentation; Figure S5: Principal component analysis of metabolic data of 40 T. delbrueckii strains, showing PC1 versus PC3.

Author Contributions

Conceptualization, C.C., R.F.-D. and M.J.S.; methodology, F.S.-S., T.F., F.P., D.R. and R.F.-D.; software, T.R. and R.F.-D.; validation, R.F.-D. and M.J.S.; investigation, F.S.-S., T.F., F.P., D.R., R.F.-D. and M.J.S.; writing—original draft preparation, F.S.-S., T.F., F.P., R.F.-D. and M.J.S.; writing—review and editing, C.C., R.F.-D. and M.J.S.; project administration, C.C. and M.J.S.; funding acquisition, M.J.S. All authors have read and agreed to the published version of the manuscript.

Funding

This work was supported by the UID/BIA/04050/2013 (POCI-01-0145-FEDER-007569) and UID/BIA/04050/2019 strategic programs and by the project PTDC/BIA-MIC/32059/2017, which is funded by national funds through the FCT-Fundação para a Ciência e Tecnologia and by the ERDF- European Regional Development Fund through the COMPETE2020–Programa Operacional Competitividade e Internacionalização (POCI) and Sistema de Apoio à Investigação Científica e Tecnológica (SAICT). FS-S and TF were supported by Fellowships (UI/BD/150873/2021 and 2021.04595.BD, respectively) from Fundação para a Ciência e Tecnologia, Portugal.

Informed Consent Statement

Not applicable.

Data Availability Statement

Not applicable.

Conflicts of Interest

The authors declare no conflict of interest.

References

  1. Castelli, T. Les Agents de la Fermentation Vinaire. Arch. Mikrobiol. 1954, 20, 323–342. [Google Scholar] [CrossRef] [PubMed]
  2. Benito, S. The impact of Torulaspora delbrueckii yeast in winemaking. Appl. Microbiol. Biotechnol. 2018, 102, 3081–3094. [Google Scholar] [CrossRef] [PubMed]
  3. Fernandes, T.; Silva-Sousa, F.; Pereira, F.; Rito, T.; Soares, P.; Franco-Duarte, R.; Sousa, M.J. Biotechnological Importance of Torulaspora delbrueckii: From the Obscurity to the Spotlight. J. Fungi 2021, 7, 712. [Google Scholar] [CrossRef] [PubMed]
  4. Pretorius, I.S.; Høj, P.B. Grape and wine biotechnology: Challenges, opportunities and potential benefits. Aust. J. Grape Wine Res. 2005, 11, 83–108. [Google Scholar] [CrossRef]
  5. Franco-Duarte, R.; Umek, L.; Mendes, I.; Castro, C.; Fonseca, N.; Martins, R.; Ferreira, A.C.S.; Sampaio, P.; Pais, C.; Schuller, D. New integrative computational approaches unveil the Saccharomyces cerevisiae pheno-metabolomic fermentative profile and allow strain selection for winemaking. Food Chem. 2016, 211, 509–520. [Google Scholar] [CrossRef] [Green Version]
  6. Rainieri, S.; Pretorius, I.S. Selection and improvement of wine yeasts. Ann. Microbiol. 2000, 50, 15–31. [Google Scholar]
  7. Drumonde-Neves, J.; Fernandes, T.; Lima, T.; Pais, C.; Franco-Duarte, R. Learning from 80 years of studies: A comprehensive catalogue of non-Saccharomyces yeasts associated with viticulture and winemaking. FEMS Yeast Res. 2021, 21, foab017. [Google Scholar] [CrossRef]
  8. Ciani, M.; Beco, L.; Comitini, F. Fermentation behaviour and metabolic interactions of multistarter wine yeast fermentations. Int. J. Food Microbiol. 2006, 108, 239–245. [Google Scholar] [CrossRef]
  9. Pacheco, A.; Santos, J.; Chaves, S.; Almeida, J.; Leão, C.; Sousa, M.J. The Emerging Role of the Yeast Torulaspora delbrueckii in Bread and Wine Production: Using Genetic Manipulation to Study Molecular Basis of Physiological Responses. In Structure and Function of Food Engineering; Eissa, A.A., Ed.; IntechOpen: London, UK, 2012; Chapter 13; pp. 339–370. [Google Scholar]
  10. Ciani, M.; Maccarelli, F. Oenological properties of non-Saccharomyces yeasts associated with wine-making. World J. Microbiol. Biotechnol. 1998, 14, 199–203. [Google Scholar] [CrossRef]
  11. Loira, I.; Vejarano, R.; Bañuelos, M.; Morata, A.; Tesfaye, W.; Uthurry, C.; Villa, A.; Cintora, I.; Suárez-Lepe, J. Influence of sequential fermentation with Torulaspora delbrueckii and Saccharomyces cerevisiae on wine quality. LWT Food Sci. Technol. 2014, 59, 915–922. [Google Scholar] [CrossRef] [Green Version]
  12. Sauer, M.; Porro, D.; Mattanovich, D.; Branduardi, P. Microbial production of organic acids: Expanding the markets. Trends Biotechnol. 2008, 26, 100–108. [Google Scholar] [CrossRef]
  13. Almeida, M.J.; Pais, C. Leavening ability and freeze tolerance of yeasts isolated from traditional corn and rye bread doughs. Appl. Environ. Microbiol. 1996, 62, 4401–4404. [Google Scholar] [CrossRef] [Green Version]
  14. Hernandez-Lopez, M.; Prieto, J.; Randez-Gil, F. Osmotolerance and leavening ability in sweet and frozen sweet dough. Comparative analysis between Torulaspora delbrueckii and Saccharomyces cerevisiae baker’s yeast strains. Antonie Leeuwenhoek 2003, 84, 125–134. [Google Scholar] [CrossRef]
  15. Alves-Araújo, C.; Almeida, M.J.; Sousa, M.J.; Leão, C. Freeze tolerance of the yeast Torulaspora delbrueckii: Cellular and biochemical basis. FEMS Microbiol. Lett. 2004, 240, 7–14. [Google Scholar] [CrossRef] [Green Version]
  16. Belda, I.; Navascués, E.; Marquina, D.; Santos, A.; Calderon, F.; Benito, S. Dynamic analysis of physiological properties of Torulaspora delbrueckii in wine fermentations and its incidence on wine quality. Appl. Microbiol. Biotechnol. 2014, 99, 1911–1922. [Google Scholar] [CrossRef]
  17. Ciani, M.; Picciotti, G. The growth kinetics and fermentation behaviour of some non-Saccharomyces yeasts associated with wine-making. Biotechnol. Lett. 1995, 17, 1247–1250. [Google Scholar] [CrossRef]
  18. King, A.J.; Dickinson, J.R. Biotransformation of hop aroma terpenoids by ale and lager yeasts. FEMS Yeast Res. 2003, 3, 53–62. [Google Scholar] [CrossRef]
  19. Canonico, L.; Agarbati, A.; Comitini, F.; Ciani, M. Torulaspora delbrueckii in the brewing process: A new approach to enhance bioflavour and to reduce ethanol content. Food Microbiol. 2016, 56, 45–51. [Google Scholar] [CrossRef]
  20. Arrizon, J.; Morel, S.; Gschaedler, A.; Monsan, P. Fructanase and fructosyltransferase activity of non-Saccharomyces yeasts isolated from fermenting musts of Mezcal. Bioresour. Technol. 2012, 110, 560–565. [Google Scholar] [CrossRef]
  21. De La Torre-González, F.J.; Narváez-Zapata, J.A.; Taillandier, P.; Larralde-Corona, C.P. Mezcal as a Novel Source of Mixed Yeasts Inocula for Wine Fermentation. Processes 2020, 8, 1296. [Google Scholar] [CrossRef]
  22. Visintin, S.; Ramos, C.; Batista, N.; Dolci, P.; Schwan, F.; Cocolin, L. Impact of Saccharomyces cerevisiae and Torulaspora delbrueckii starter cultures on cocoa beans fermentation. Int. J. Food Microbiol. 2017, 257, 31–40. [Google Scholar] [CrossRef]
  23. Lachance, M.-A. Yeast communities in a natural tequila fermentation. Antonie Leeuwenhoek 1995, 68, 151–160. [Google Scholar] [CrossRef] [PubMed]
  24. Wei, J.; Wang, S.; Zhang, Y.; Yuan, Y.; Yue, T. Characterization and screening of non-Saccharomyces yeasts used to produce fragrant cider. LWT 2019, 107, 191–198. [Google Scholar] [CrossRef]
  25. Barry, J.P.; Metz, M.S.; Hughey, J.; Quirk, A.; Bochman, M.L. Two Novel Strains of Torulaspora delbrueckii Isolated from the Honey Bee Microbiome and Their Use in Honey Fermentation. Fermentation 2018, 4, 22. [Google Scholar] [CrossRef] [Green Version]
  26. Welthagen, J. Yeast profile in Gouda cheese during processing and ripening. Int. J. Food Microbiol. 1998, 41, 185–194. [Google Scholar] [CrossRef]
  27. Santiago, C.; Rito, T.; Vieira, D.; Fernandes, T.; Pais, C.; Sousa, M.; Soares, P.; Franco-Duarte, R. Improvement of Torulaspora delbrueckii Genome Annotation: Towards the Exploitation of Genomic Features of a Biotechnologically Relevant Yeast. J. Fungi 2021, 7, 287. [Google Scholar] [CrossRef] [PubMed]
  28. Silva, M.; Pontes, A.; Franco-Duarte, R.; Soares, P.; Sampaio, J.P.; Sousa, M.J.; Brito, P.H. A glimpse at an early stage of microbe domestication revealed in the variable genome of Torulaspora delbrueckii, an emergent industrial yeast. Mol. Ecol. 2022. online ahead of print. [Google Scholar] [CrossRef] [PubMed]
  29. Barbosa, C.; Lage, P.; Vilela, A.; Mendes-Faia, A.; Mendes-Ferreira, A. Phenotypic and metabolic traits of commercial Saccharomyces cerevisiae yeasts. AMB Express 2014, 4, 39. [Google Scholar] [CrossRef] [Green Version]
  30. Mendes, I.; Franco-Duarte, R.; Umek, L.; Fonseca, E.; Drumonde-Neves, J.; Dequin, S.; Zupan, B.; Schuller, D. Computational Models for Prediction of Yeast Strain Potential for Winemaking from Phenotypic Profiles. PLoS ONE 2013, 8, e66523. [Google Scholar] [CrossRef] [Green Version]
  31. Mendes, I.; Sanchez, I.; Franco-Duarte, R.; Camarasa, C.; Schuller, D.; Dequin, S.; Sousa, M.J. Integrating transcriptomics and metabolomics for the analysis of the aroma profiles of Saccharomyces cerevisiae strains from diverse origins. BMC Genomics 2017, 18, 455. [Google Scholar] [CrossRef] [Green Version]
  32. Renault, P.; Miot-Sertier, C.; Marullo, P.; Hernández-Orte, P.; Lagarrigue, L.; Lonvaud-Funel, A.; Bely, M. Genetic characterization and phenotypic variability in Torulaspora delbrueckii species: Potential applications in the wine industry. Int. J. Food Microbiol. 2009, 134, 201–210. [Google Scholar] [CrossRef]
  33. Escribano, R.; González-Arenzana, L.; Portu, J.; Garijo, P.; López-Alfaro, I.; López, R.; Santamaría, P.; Gutiérrez, A. Wine aromatic compound production and fermentative behaviour within different non-Saccharomyces species and clones. J. Appl. Microbiol. 2018, 124, 1521–1531. [Google Scholar] [CrossRef]
  34. Bely, M.; Sablayrolles, J.M.; Barre, P. Description of alcoholic fermentation kinetics: Its variability and significance. Am. J. Enol. Vitic. 1990, 41, 319–324. [Google Scholar]
  35. Rosi, I.; Vinella, M.; Domizio, P. Characterization of β-glucosidase activity in yeasts of oenological origin. J. Appl. Bacteriol. 1994, 77, 519–527. [Google Scholar] [CrossRef]
  36. Bonciani, T.; De Vero, L.; Giannuzzi, E.; Verspohl, A.; Giudici, P. Qualitative and quantitative screening of the β -glucosidase activity in Saccharomyces cerevisiae and Saccharomyces uvarum strains isolated from refrigerated must. Lett. Appl. Microbiol. 2018, 67, 72–78. [Google Scholar] [CrossRef]
  37. Jiranek, V.; Langridge, P.; Henschke, P.A. Validation of bismuth-containing indicator media for predicting H2S-producing potential of Saccharomyces cerevisiae wine yeasts under enological conditions. Am. J. Enol. Vitic. 1995, 46, 269–273. [Google Scholar]
  38. Buzzini, P.; Martini, A. Large-scale screening of selected Candida maltosa, Debaryomyces hansenii and Pichia anomala killer toxin activity against pathogenic yeasts. Med. Mycol. 2001, 39, 479–482. [Google Scholar] [CrossRef] [Green Version]
  39. Hino, A.; Mihara, K.; Nakashima, K.; Takano, H. Trehalose levels and survival ratio of freeze-tolerant versus freeze-sensitive yeasts. Appl. Environ. Microbiol. 1990, 56, 1386–1391. [Google Scholar] [CrossRef] [Green Version]
  40. Demšar, J.; Zupan, B.; Leban, G.; Curk, T. Orange: From experimental machine learning to interactive data mining. In Proceedings of the European Conference on Principles of Data Mining and Knowledge Discovery, Pisa, Italy, 20–24 September 2004; pp. 537–539. [Google Scholar]
  41. Hanley, J.A.; McNeil, B.J. The meaning and use of the area under a receiver operating characteristic (ROC) curve. Radiology 1982, 143, 29–36. [Google Scholar] [CrossRef] [Green Version]
  42. Walsh, R.M.; Martin, P.A. Growth Of Saccharomyces Cerevisiae And Saccharomyces Uvarum In A Temperature Gradient Incubator. J. Inst. Brew. 1977, 83, 169–172. [Google Scholar] [CrossRef]
  43. Salvadó, Z.; Arroyo-López, F.N.; Guillamón, J.M.; Salazar, G.; Querol, A.; Barrio, E. Temperature Adaptation Markedly Determines Evolution within the Genus Saccharomyces. Appl. Environ. Microbiol. 2011, 77, 2292–2302. [Google Scholar] [CrossRef] [Green Version]
  44. García-Ríos, E.; Ramos-Alonso, L.; Guillamón, J.M. Correlation between Low Temperature Adaptation and Oxidative Stress in Saccharomyces cerevisiae. Front. Microbiol. 2016, 7, 1199. [Google Scholar] [CrossRef] [PubMed] [Green Version]
  45. Rodriguez-Vargas, S.; Estruch, F.; Randez-Gil, F. Gene Expression Analysis of Cold and Freeze Stress in Baker’s Yeast. Appl. Environ. Microbiol. 2002, 68, 3024–3030. [Google Scholar] [CrossRef] [PubMed] [Green Version]
  46. Franco-Duarte, R.; Umek, L.; Zupan, B.; Schuller, D. Computational approaches for the genetic and phenotypic characterization of a Saccharomyces cerevisiaewine yeast collection. Yeast 2009, 26, 675–692. [Google Scholar] [CrossRef] [PubMed] [Green Version]
  47. Batistote, M.; da Cruz, S.H.; Ernandes, J.R. Altered Patterns of Maltose and Glucose Fermentation by Brewing and Wine Yeasts Influenced by the Complexity of Nitrogen Source. J. Inst. Brew. 2006, 112, 84–91. [Google Scholar] [CrossRef]
  48. Hackenberg, S.; Leitner, T.; Jekle, M.; Becker, T. Maltose formation in wheat dough depending on mechanical starch modification and dough hydration. Carbohydr. Polym. 2018, 185, 153–158. [Google Scholar] [CrossRef] [PubMed]
  49. Kurtzman, C.P.; Fell, J.W.; Boekhout, T. The Yeasts a Taxonomic Study; Elsevier: Amsterdam, The Netherlands, 2011. [Google Scholar]
  50. Alves-Araújo, C.; Hernandez-Lopez, M.J.; Prieto, J.A.; Randez-Gil, F.; Sousa, M.J. Isolation and characterization of the LGT1 gene encoding a low-affinity glucose transporter from Torulaspora delbrueckii. Yeast 2005, 22, 165–175. [Google Scholar] [CrossRef] [PubMed]
  51. Pacheco, A.; Donzella, L.; Hernandez-Lopez, M.J.; Almeida, M.J.; Prieto, J.A.; Randez-Gil, F.; Morrissey, J.P.; Sousa, M.J. Hexose transport in Torulaspora delbrueckii: Identification of Igt1, a new dual-affinity transporter. FEMS Yeast Res. 2020, 20, foaa004. [Google Scholar] [CrossRef]
  52. Tronchoni, J.; Gamero, A.; Arroyo-López, F.N.; Barrio, E.; Querol, A. Differences in the glucose and fructose consumption profiles in diverse Saccharomyces wine species and their hybrids during grape juice fermentation. Int. J. Food Microbiol. 2009, 134, 237–243. [Google Scholar] [CrossRef] [Green Version]
  53. Marques, W.L.; Raghavendran, V.; Stambuk, B.U.; Gombert, A.K. Sucrose and Saccharomyces cerevisiae: A relationship most sweet. FEMS Yeast Res. 2015, 16, fov107. [Google Scholar] [CrossRef] [Green Version]
  54. Alves-Araújo, C.; Pacheco, A.; Almeida, M.J.; Spencer-Martins, I.; Leão, C.; Sousa, M.J. Sugar utilization patterns and respiro-fermentative metabolism in the baker’s yeast Torulaspora delbrueckii. Microbiology 2007, 153, 898–904. [Google Scholar] [CrossRef] [Green Version]
  55. Diezmann, S.; Dietrich, F.S. Saccharomyces cerevisiae: Population Divergence and Resistance to Oxidative Stress in Clinical, Domesticated and Wild Isolates. PLoS ONE 2009, 4, e5317. [Google Scholar] [CrossRef] [Green Version]
  56. Kvitek, D.J.; Will, J.L.; Gasch, A.P. Variations in Stress Sensitivity and Genomic Expression in Diverse S. cerevisiae Isolates. PLoS Genet. 2008, 4, e1000223. [Google Scholar] [CrossRef] [Green Version]
  57. Gibson, B.R.; Lawrence, S.; LeClaire, J.P.R.; Powell, C.; Smart, K.A. Yeast responses to stresses associated with industrial brewery handling. FEMS Microbiol. Rev. 2007, 31, 535–569. [Google Scholar] [CrossRef] [Green Version]
  58. Budroni, M.; Zara, S.; Zara, G.; Pirino, G.; Mannazzu, I. Peculiarities of flor strains adapted to Sardinian sherry-like wine ageing conditions. FEMS Yeast Res. 2005, 5, 951–958. [Google Scholar] [CrossRef] [Green Version]
  59. Capece, A.; Siesto, G.; Poeta, C.; Pietrafesa, R.; Romano, P. Indigenous yeast population from Georgian aged wines produced by traditional “Kakhetian” method. Food Microbiol. 2013, 36, 447–455. [Google Scholar] [CrossRef]
  60. Calhelha, R.C.; Andrade, J.V.; Ferreira, I.C.; Estevinho, L.M. Toxicity effects of fungicide residues on the wine-producing process. Food Microbiol. 2006, 23, 393–398. [Google Scholar] [CrossRef]
  61. Russo, P.; Berbegal, C.; De Ceglie, C.; Grieco, F.; Spano, G.; Capozzi, V. Pesticide Residues and Stuck Fermentation in Wine: New Evidences Indicate the Urgent Need of Tailored Regulations. Fermentation 2019, 5, 23. [Google Scholar] [CrossRef] [Green Version]
  62. Wang, F.; Zhou, T.; Zhu, L.; Wang, X.; Wang, J.; Wang, J.; Du, Z.; Li, B. Effects of successive metalaxyl application on soil microorganisms and the residue dynamics. Ecol. Indic. 2019, 103, 194–201. [Google Scholar] [CrossRef]
  63. Francois, I.; Cammue, B.; Borgers, M.; Ausma, J.; Dispersyn, G.; Thevissen, K. Azoles: Mode of Antifungal Action and Resistance Development. Effect of Miconazole on Endogenous Reactive Oxygen Species Production in Candida albicans. Anti Infect. Agents Med. Chem. 2006, 5, 3–13. [Google Scholar] [CrossRef]
  64. Claus, H.; Mojsov, K. Enzymes for Wine Fermentation: Current and Perspective Applications. Fermentation 2018, 4, 52. [Google Scholar] [CrossRef] [Green Version]
  65. Andrade, R.P.; Oliveira, D.R.; Lopes, A.C.A.; de Abreu, L.R.; Duarte, W.F. Survival of Kluyveromyces lactis and Torulaspora delbrueckii to simulated gastrointestinal conditions and their use as single and mixed inoculum for cheese production. Food Res. Int. 2019, 125, 108620. [Google Scholar] [CrossRef] [PubMed]
  66. Borelli, B.M.; Ferreira, E.G.; Lacerda, I.C.; Franco, G.R.; Rosa, C.A. Yeast populations associated with the artisanal cheese produced in the region of Serra da Canastra, Brazil. World J. Microbiol. Biotechnol. 2006, 22, 1115–1119. [Google Scholar] [CrossRef]
  67. Huang, C.-W.; Walker, M.E.; Fedrizzi, B.; Gardner, R.C.; Jiranek, V. Hydrogen sulfide and its roles in Saccharomyces cerevisiae in a winemaking context. FEMS Yeast Res. 2017, 17, fox058. [Google Scholar] [CrossRef] [PubMed] [Green Version]
  68. Divol, B.; du Toit, M.; Duckitt, E. Surviving in the presence of sulphur dioxide: Strategies developed by wine yeasts. Appl. Microbiol. Biotechnol. 2012, 95, 601–613. [Google Scholar] [CrossRef] [PubMed]
  69. Simonin, S.; Alexandre, H.; Nikolantonaki, M.; Coelho, C.; Tourdot-Maréchal, R. Inoculation of Torulaspora delbrueckii as a bio-protection agent in winemaking. Food Res. Int. 2018, 107, 451–461. [Google Scholar] [CrossRef] [PubMed]
  70. Sangorrín, M.P.; Lopes, C.A.; Giraudo, M.R.; Caballero, A.C. Diversity and killer behaviour of indigenous yeasts isolated from the fermentation vat surfaces in four Patagonian wineries. Int. J. Food Microbiol. 2007, 119, 351–357. [Google Scholar] [CrossRef] [PubMed]
  71. Velázquez, R.; Zamora, E.; Álvarez, M.L.; Hernández, L.M.; Ramírez, M. Effects of new Torulaspora delbrueckii killer yeasts on the must fermentation kinetics and aroma compounds of white table wine. Front. Microbiol. 2015, 6, 1222. [Google Scholar] [CrossRef] [Green Version]
  72. Ramírez, M.; Velázquez, R.; Maqueda, M.; López-Piñeiro, A.; Ribas, J.C. A new wine Torulaspora delbrueckii killer strain with broad antifungal activity and its toxin-encoding double-stranded RNA virus. Front. Microbiol. 2015, 6, 983. [Google Scholar] [CrossRef] [Green Version]
  73. Franco-Duarte, R.; Bigey, F.; Carreto, L.; Mendes, I.; Dequin, S.; Santos, M.A.; Pais, C.; Schuller, D. Intrastrain genomic and phenotypic variability of the commercial Saccharomyces cerevisiae strain Zymaflore VL1 reveals microevolutionary adaptation to vineyard environments. FEMS Yeast Res. 2015, 15, fov063. [Google Scholar] [CrossRef] [Green Version]
  74. González, M.L.; Valero, E.; Chimeno, S.V.; Garrido-Fernández, A.; Rodríguez-Gómez, F.; Rojo, M.C.; Paolinelli, M.; Arroyo-López, F.N.; Combina, M.; Mercado, L.A. Growth response of Saccharomyces cerevisiae strains to stressors associated to the vine cycle. LWT 2022, 158, 113157. [Google Scholar] [CrossRef]
  75. Drumonde-Neves, J.; Franco-Duarte, R.; Vieira, E.; Mendes, I.; Lima, T.; Schuller, D.; Pais, C. Differentiation of Saccharomyces cerevisiae populations from vineyards of the Azores Archipelago: Geography vs Ecology. Food Microbiol. 2018, 74, 151–162. [Google Scholar] [CrossRef]
  76. Ramírez, M.; Velázquez, R. The Yeast Torulaspora delbrueckii: An Interesting But Difficult-To-Use Tool for Winemaking. Fermentation 2018, 4, 94. [Google Scholar] [CrossRef] [Green Version]
  77. Canonico, L.; Comitini, F.; Ciani, M. Torulaspora delbrueckii for secondary fermentation in sparkling wine production. Food Microbiol. 2018, 74, 100–106. [Google Scholar] [CrossRef]
  78. Catrileo, D.; Acuña-Fontecilla, A.; Godoy, L. Adaptive Laboratory Evolution of Native Torulaspora delbrueckii YCPUC10 With Enhanced Ethanol Resistance and Evaluation in Co-inoculated Fermentation. Front. Microbiol. 2020, 11, 3318. [Google Scholar] [CrossRef]
  79. Mores, S.; Vandenberghe, L.P.D.S.; Júnior, A.I.M.; de Carvalho, J.C.; de Mello, A.F.M.; Pandey, A.; Soccol, C.R. Citric acid bioproduction and downstream processing: Status, opportunities, and challenges. Bioresour. Technol. 2020, 320, 124426. [Google Scholar] [CrossRef]
  80. Liu, S.; Laaksonen, O.; Kortesniemi, M.; Kalpio, M.; Yang, B. Chemical composition of bilberry wine fermented with non-Saccharomyces yeasts (Torulaspora delbrueckii and Schizosaccharomyces pombe) and Saccharomyces cerevisiae in pure, sequential and mixed fermentations. Food Chem. 2018, 266, 262–274. [Google Scholar] [CrossRef]
  81. Franco-Duarte, R.; Bessa, D.; Gonçalves, F.; Martins, R.; Ferreira, A.C.S.; Schuller, D.; Sampaio, P.; Pais, C. Genomic and transcriptomic analysis of Saccharomyces cerevisiae isolates with focus in succinic acid production. FEMS Yeast Res. 2017, 17, fox057. [Google Scholar] [CrossRef] [Green Version]
  82. Puertas, B.; Jiménez, M.; Cantos-Villar, E.; Cantoral, J.; Rodríguez, M. Use of Torulaspora delbrueckii and Saccharomyces cerevisiaein semi-industrial sequential inoculation to improve quality of Palomino and Chardonnay wines in warm climates. J. Appl. Microbiol. 2017, 122, 733–746. [Google Scholar] [CrossRef]
  83. Contreras, A.; Hidalgo, C.; Henschke, P.A.; Chambers, P.J.; Curtin, C.; Varela, C. Evaluation of Non-Saccharomyces Yeasts for the Reduction of Alcohol Content in Wine. Appl. Environ. Microbiol. 2014, 80, 1670–1678. [Google Scholar] [CrossRef] [Green Version]
  84. Thomas, K.C.; Hynes, S.H.; Ingledew, W.M. Influence of medium buffering capacity on inhibition of Saccharomyces cerevisiae growth by acetic and lactic acids. Appl. Environ. Microbiol. 2002, 68, 1616–1623. [Google Scholar] [CrossRef] [PubMed] [Green Version]
  85. Pais, C.; Franco-Duarte, R.; Sampaio, P.; Wildner, J.; Carolas, A.; Figueira, D.; Ferreira, B. Production of Dicarboxylic Acid Platform Chemicals Using Yeasts: Focus on Succinic Acid. Biotransform. Agric. Waste By-Prod. 2016, 237–269. [Google Scholar] [CrossRef]
  86. Paraggio, M.; Fiore, C. Screening of Saccharomyces cerevisiae wine strains for the production of acetic acid. World J. Microbiol. Biotechnol. 2004, 20, 743–747. [Google Scholar] [CrossRef]
  87. Bely, M.; Stoeckle, P.; Masneuf-Pomarède, I.; Dubourdieu, D. Impact of mixed Torulaspora delbrueckiiSaccharomyces cerevisiae culture on high-sugar fermentation. Int. J. Food Microbiol. 2008, 122, 312–320. [Google Scholar] [CrossRef]
  88. Benito, Á.; Calderón, F.; Benito, S. The Influence of Non-Saccharomyces Species on Wine Fermentation Quality Parameters. Fermentation 2019, 5, 54. [Google Scholar] [CrossRef] [Green Version]
  89. Likas, A.; Vlassis, N.; Verbeek, J.J. The global k-means clustering algorithm. Pattern Recognit. 2003, 36, 451–461. [Google Scholar] [CrossRef] [Green Version]
  90. Rousseeuw, P.J. Silhouettes: A graphical aid to the interpretation and validation of cluster analysis. J. Comput. Appl. Math. 1987, 20, 53–65. [Google Scholar] [CrossRef] [Green Version]
  91. Franco-Duarte, R.; Mendes, I.; Umek, L.; Drumonde-Neves, J.; Zupan, B.; Schuller, D. Computational models reveal genotype-phenotype associations in Saccharomyces cerevisiae. Yeast 2014, 31, 265–277. [Google Scholar] [CrossRef] [Green Version]
Figure 1. Principal component analysis of phenotypic data of 40 T. delbrueckii strains. (A) Scores—40 strains distribution. Colors represent the technological application or origin of the strains: —winemaking; —arboreal/soil; —food; —bread; —water; —clinical; —other beverages; ●—unknown origin; (B) Loadings—24 phenotypic tests.
Jof 08 00569 g001
Figure 2. Principal component analysis of metabolic data of 40 T. delbrueckii strains. (A) Scores—40 strains distribution. Colors represent the technological application or origin of the strains: —winemaking; —arboreal/soil; —food; —bread; —water; —clinical; —other beverages; ●—unknown origin; (B) Loadings—concentration of seven metabolites obtained by HPLC analysis, after 192 h of fermentation.
Jof 08 00569 g002
Figure 3. k-means cluster analysis of T. delbrueckii strains’ characterization. (A) Features (phenotypic tests and metabolites quantified by HPLC) mostly contributing for the division of strains into two clusters, in terms of information gain and information gain ration; (B) Number of strains categorized in the two clusters defined with k-means algorithm, colored according with their technological application or origin: —winemaking; —arboreal/soil; —food; —bread; —water; —clinical; —other beverages; ●—unknown origin.
Jof 08 00569 g003
Table 1. Number of strains belonging to different phenotypic classes, as result of the screening comprising 31 tests, regarding values of optical density (Class 0: DO640 = 0.1; Class 1: 0.2 < DO640 < 0.4; Class 2: 0.5 < DO640 < 1.0; Class 3: DO640 > 1.0), killer phenotype (Class 0: neutral; Class 1: killer or sensitive phenotype), change of medium color (arbutin and BiGGY media), halo size (esculin medium) and cell viability after freezing.
Phenotypic TestType of MediumPhenotypic Classes
0123
15 °CLiquid (synthetic must)33268
25 °CLiquid (synthetic must)00040
30 °CLiquid (synthetic must)00040
37 °CLiquid (synthetic must)35122
Ethanol 5% (v/v)Liquid (synthetic must)11236
Ethanol 10% (v/v)Liquid (synthetic must)211153
Ethanol 14% (v/v)Liquid (synthetic must)37302
Ethanol 18% (v/v)Liquid (synthetic must)38200
Glucose (200 g/L) Liquid (synthetic must)00040
Fructose (200 g/L)Liquid (synthetic must)00238
Sucrose (200 g/L)Liquid (synthetic must)00139
Maltose (200 g/L)Liquid (synthetic must)08257
NaCl (1.5 M)Liquid (synthetic must)28264
KCl (1 M)Liquid (synthetic must)00139
H2O2 (2 mM)Liquid (synthetic must)130126
CuSO4 (5 mM)Liquid (synthetic must)191182
Fluconazole (0.5 mg/mL)Liquid (synthetic must)00931
Myclobutanil (0.5 mg/mL)Liquid (synthetic must)042610
Metalaxyl (0.5 mg/mL)Liquid (synthetic must)00040
Tebuconazole (0.5 mg/mL)Liquid (synthetic must)021919
β-glucosidase activitySolid (Arbutin Agar)019183
Solid (Bile Esculin Agar)212242
H2S productionSolid (BiGGY Agar)421024
Ethanol 12% (v/v)Solid (MEA)315139
Ethanol 12% (v/v) + 0.25 mM SO2Solid (MEA)151177
Ethanol 12% (v/v) + 0.5 mM SO2Solid (MEA)181057
Ethanol 12% (v/v) + 1.0 mM SO2Solid (MEA)23854
Ethanol 12% (v/v) + 1.5 mM SO2Solid (MEA)28363
Killer activity—killer phenotypeSolid (YPD-MB Agar)391--
Killer activity—sensitive phenotypeSolid (YPD-MB Agar)373--
Freeze resistanceLiquid (LF)761017
Table 2. Confusion matrix indicating the technological group of 40 T. delbrueckii strains versus the technological group predicted using neural networks (AUC = 0.718). Correct predictions are highlighted in red.
Predicted Technological Group
Arboreal/SoilBreadClinicalFoodOther
Beverages
UnknownWaterWineTotal
Real technological groupArboreal/Soil6000100411
Bread030000014
Clinical000000011
Food000110125
Other beverages010001002
Unknown110000103
Water000200013
Wine4000001611
Total115032131540
Publisher’s Note: MDPI stays neutral with regard to jurisdictional claims in published maps and institutional affiliations.

