Abstract
Soybean sudden death syndrome (SDS) is a destructive disease that causes substantial yield losses in South and North America. Whereas four Fusarium species were identified as the causal agents, F. virguliforme is the primary SDS-causing pathogen in North America and it also contributes substantially to SDS in Argentina. In this study, we comparatively analyzed genome assemblies of four F. virguliforme strains and identified 29 informative microsatellite markers. Sixteen of the 29 markers were used to investigate the genetic diversity and population structure of this pathogen in a collection of 90 strains from Argentina and the USA. A total of 37 multilocus genotypes (MLGs) were identified, including 10 MLGs in Argentina and 26 in the USA. Only MLG2, the most dominant MLG, was found in both countries. Analyses with three different approaches showed that these MLGs could be grouped into three clusters. Cluster IA consisting of four MLGs exclusively from the USA has much higher genetic diversity than the other two clusters, suggesting that it may be the ancestral cluster although additional data are necessary to support this hypothesis. Clusters IB and II consisted of 13 and 21 MLGs, respectively. MLGs belonging to these two clusters were present in all four sampled states in Argentina and all five sampled states in the USA.
1. Introduction
Sudden death syndrome (SDS) is a serious, growing threat to soybean production worldwide. In several countries including Argentina, Brazil, and the USA, this disease is one of the most limiting factor for soybean production [1,2]. In the last 10 years (2013 to 2022), SDS was estimated to have caused $3.35 billion yield loss in the USA, primarily in the northcentral states (Crop Protection Network, https://loss.cropprotectionnetwork.org (accessed on 22 September 2023). In Argentina, SDS can cause losses between 20 and 40%, reaching up to 90% of the soybean production [1].
Four species in the fungal genus Fusarium, F. virguliforme, F. tucumaniae, F. brasiliense and F. crassistipitatum, have been identified as the causal agents of SDS. In North America, SDS is primarily caused by F. virguliforme though F. brasiliense was recently reported in Michigan [3]. In South America, all four pathogens have been reported to cause SDS [4]. F. tucumaniae was found more often in South America than other species but a substantial portion of SDS-causing Fusarium strains from Argentina were identified as F. virguliforme [5,6]. F. virguliforme and F. brasiliense were reported to cause SDS in South Africa [7,8]. F. virguliforme was found in the soil in Malaysia [9], but the disease itself was not reported.
F. virguliforme is a soil-borne pathogen. It infects soybean roots and causes root rot. It can reach the lower stem but has never been found in the upper canopy. The pathogen produces phytotoxins [10,11,12] that cause leaf symptoms, including interveinal chlorosis, and premature defoliation with leaf petioles remaining intact on the stem.
To date, there are only limited and contradictory studies on the genetic diversity and population structures in F. virguliforme. Malvick and Bussey sequenced the internal transcribed space region and intergenic spacer region of nuclear rDNA as well as the translation elongation factor 1α (EF-1α) gene of F. virguliforme isolates from Minnesota, Illinois, Iowa and Missouri. They found little genetic diversity and concluded that these isolates were likely part of the same clonal population [13]. In another study, F. virguliforme isolates from Illinois, Iowa and Minnesota were divided into four subgroups based on analyses of four different molecular markers (Mitochondrial RFLP, mini- and micro-satellite PCR, (CAT)5 and (CAC)5 probes, and RAPD) [14]. Microsatellite markers were used to analyze 42 F. virguliforme isolates, mostly from Michigan [15]. Thirty-one multilocus genotypes (MLGs) were identified based on 12 microsatellite loci and these MLGs were grouped into three clusters that were not related to sampling sites.
Microsatellites, also called simple sequence repeats (SSR) or short tandem repeats (STRs), refer to tracts of repetitive, short (usually 1–6 bp) motifs in an organism’s genome. These regions are abundant and have higher rate of mutation [16], making microsatellites a robust and versatile tool in many biological fields, such as molecular-assisted breeding, population genetics, genealogy and genome mapping. Traditionally, there were two time- and resource-consuming bottlenecks in the development of microsatellite markers. The first bottleneck was to obtain microsatellite-containing sequences, which now can be carried out by mining raw or assembled genome sequences (e.g., [15,17]). The second bottleneck was that investigators had to experimentally screen a large number of microsatellite loci to obtain a small number of informative loci (the loci that showed genetic diversity in a species or population). With genome sequences of multiple individuals/isolates become available for many species, a comparative genomics approach has been developed to identify informative microsatellite markers without the need of experimental screening [17].
In this study, we aimed to use comparative genomics approach to identify informative microsatellite markers in F. virguliforme and use these markers to investigate genetic diversity and population structure of this pathogen in the United States and Argentina, two countries in which SDS has been causing substantial yield loss for soybean growers.
2. Materials and Methods
2.1. Bioinformatics Analysis
Informative microsatellite markers were identified following the previously published protocol [17]. Genome assemblies of four strains of F. virguliforme were downloaded from GenBank: Mont-1 (GenBank WGS No. AEYB01), NRRL34551 (MADZ01), LL0009 (MADY01) and Clinton-1B (MADX01). Microsatellite loci were identified in the genome of strain Mont-1 using the software package MISA version 2.1 [18] with the following parameters: for mononucleotide motifs, minimal 8 repeats; dinucleotide motifs, minimal 6 repeats; tri- to hexa- nucleotide motifs, minimal 5 repeats; and minimal distance between neighboring loci for identification of compound loci, 0 bp. Up to five primer pairs were designed for all loci with di- to hexa- nucleotide motifs using Primer3 version 2.5.0 [19] with the following requirements: product size 100–250 bp, primer length 18–25 bp (optimal 20 bp), primer melting temperature 57–63 °C (optimal 60 °C), primer GC ratio 30–70% (optimal 50%). All primers were required to be located within 200 bp in the flanking regions but with a minimal 3 bp away from the target locus. If there was another microsatellite locus within the 200 bp flanking regions of a target locus, the primers should not overlap with the neighboring locus.
In silico PCR was conducted using the software package isPcr version 3.3 [20] with default parameters in all four genome assemblies (Mont-1, LL0009, NRRL34551, and Clinton-1B) with the designed primer pairs. A custom PERL script was then used to process the in silico PCR results and select loci that fitted the following criteria: (1) only one PCR amplicon was generated from each strain; (2) the amplicons matched the primer sequences perfectly on each end; (3) the amplicons contained the same microsatellite motif but differ in number of repeats; (4) for loci with 2–3 bp motifs, the length of flanking regions were identical in all four strains; and (5) for loci with 4–6 bp motifs, 1 bp difference was allowed in the length of the flanking regions.
2.2. Fungal Strains, DNA Manipulation and Microsatellite Genotyping
A total of 90 strains of F. virguliforme were used in this study (Table 1). The 56 strains from the USA were obtained from Agricultural Research Service Culture Collection (NRRL–Northern Regional Research Laboratory, https://nrrl.ncaur.usda.gov/ (accessed on 20 October 2019)) as well as our own collection. The 34 Argentina isolates were provided by Dr. Mercedes Scandiani from Rosario National University, Argentina. The strains were cryopreserved in glycerol in liquid nitrogen and maintained on Potato Dextrose Agar (PDA). For DNA extraction, mycelium was harvested from seven-day-old cultures in potato dextrose broth grown at room temperature on benchtop. DNA was extracted from harvested mycelium using the Plant Dneasy Mini kit (Qiagen, Germantown, MD, USA) following the manufacturer’s instructions. A species-specific conventional PCR was conducted for all strains to confirm F. virguliforme identity following previously published protocol [21], with an initial denaturing cycle at 95 °C for 5 min, followed by 35 cycles of denaturing at 95 °C for 30 s, annealing at 65 °C for 30 s, extension at 72 °C for 30 s, and a final extension cycle at 72 °C for 5 min.

Table 1.
Fusarium virguliforme strains used in this study.
The primers for the microsatellite markers were first validated on the four strains whose genome sequences were used in the bioinformatic data mining described above (Mont-1, NRRL34551, LL0009, and Clinton-1B) before they were used to genotype all strains. For microsatellite genotyping, PCR reactions were performed with three primers: forward primer with a M13 sequence (TGTAAAACGACGGCCAGT) appended to its 5′ ends, reverse primer, and M13 primer labeled with 5′-FAM. PCR reactions were performed in duplicates in 15 μL containing 1× Amplitaq Gold Buffer (Applied Biosystems, Waltham, MA, USA), 2 mM MgCl2, 0.2 mM mixed dNTPs, 0.6 U Amplitaq Gold DNA Polymerase (Applied Biosystems, Waltham, MA, USA), 40 nM forward primer, 160 nM 5′FAM-labeled M13 primer and 160 nM reverse primer, and 10 ng template DNA. An initial denaturing cycle at 95 °C for 5 min was followed by 38 cycles of denaturing at 95 °C for 30 s, annealing for 45 s at 58 °C for the first 25 cycles and 54 °C for the remaining 13 cycles, and extension at 72 °C for 45 s, and a final extension cycle at 72 °C for 15 min. Two PCR reactions were performed for each strain. The sizes of PCR amplicons were resolved using an ABI 3730XL Genetic Analyzer together with GeneScan™ 600 LIZ™ dye Size Standard v2.0 (Applied Biosystems, Waltham, MA, USA). Allele sizes were determined with the aid of the software Peak Scanner version 2.0 (Applied Biosystems, Waltham, MA, USA). To determine the number of repeats, amplicon sizes in individual strains were compared to the amplicon size in Mont-1.
2.3. Data Analysis
Strains were assigned to MLGs based on the number of repeats in 16 microsatellite loci. Population structure was assessed by Bayesian clustering in Structure version 2.3.4 [22]. The parameters were an admixture model, at 100,000 burn-in followed by 100,000 Markov Chain Monte Carlo simulations with 10 replications for each K (ranging from K = 1 to K = 10). The online tool Structure Harvester (https://taylor0.biology.ucla.edu/structureHarvester/ (accessed on 23 June 2023)) was used to select the optimal K from the results obtained from Structure [23,24]. A dendrogram was constructed using a unweighted pair group method with arithmetic mean (UPGMA) method with Euclidian distance and 10,000 bootstrap in Past software version 4.03 [25]. A genetic distance was calculated for all MLG and used for principal coordinate analysis (PCoA) in GENALEX version 6.502 [26]. A genotype accumulation curve was constructed using the poppr package in R software version 4.1.2 [27]. This R package was also used to calculate Nei’s gene diversity [28]. Genetic variation between populations was tested with Analysis of MOlecular VAriance (AMOVA) implemented in Arlequin version 3.5.2.2 [29]. The network connection output data generated from Arlequin [29] was used in HapStar version 0.5 to create a minimum spanning tree [30].
3. Results
3.1. Microsatellite Loci in F. virguliforme
A total of 9620 microsatellite loci were identified in the genome assembly of Mont-1 (Table S1). The microsatellite density is 190.7 loci per Mb genome. Sixty-four loci are in compound formation (two or more loci immediately next to each other). The number of loci with mono- to hexa- nucleotide motifs are 5470, 1722, 2024, 307, 45, and 52, respectively. The most common mono- to hexa-nucleotide motifs are A/T (3759), AT/AT (809), AAT/ATT (774), AATT/AATT (148), ACGAG/CGTCT and ATCCC/ATGGG (4 each), and AACAGC/CTGTTG (4), respectively.
3.2. Identification of Informative Microsatellite Loci in F. virguliforme
Of the 4078 microsatellite loci with di- to hexa- motifs that are not in compound form, primer pairs were successfully designed for 2671 loci. Primer3 was able to design five primer pairs for 2664 loci, but only one and two primer pairs for one and six loci, respectively. No primer pairs could be designed for the remaining 1407 loci due to the lack of sufficient flanking sequences (too close to contig ends or to neighboring microsatellite loci), and/or low complexity of their flanking sequences.
Processing of in silico PCR results identified 2625 loci with one amplicon per genome assembly (including missing amplicon in one or more assemblies) but with identical repeat numbers, and 38 loci with different repeat numbers. Among those 38 loci, 9 loci were predicted to produce amplicons in which the flanking sequences had length differences exceeding the threshold among the four F. virguliforme strains. Hence, the comparative genomics approach identified 29 informative loci that met all of the requirements laid out in Section 2.1 “Bioinformatics analysis” and 133 primer pairs for these loci (Table 2). One primer pair was randomly chosen for each locus for population study below (Table S2). Eleven of the 29 loci had missing predicted amplicon in one or two strains based on in silico PCR due to fragmentation of genome assemblies. PCR successfully amplified an amplicon of expected size in all four strains (Figure S1).
Table 2.
Informative microsatellite loci identified through bioinformatic analysis of genome assemblies of four Fusarium virguliforme strains.
3.3. Population Structure
Species-specific PCR confirmed all strains as F. virguliforme with an amplicon of expected size (Figure S2 and not shown). For the 16 microsatellite markers used to investigate genetic diversity and population structure in these 90 strains, an allele was successfully amplified for each locus in each strain. Two to ten alleles were detected for each locus. Based on the number of repeats in the 16 loci, the 90 strains were assigned to 37 MLGs (Table 3). MLG2 was most dominant represented by 25 strains (15 from Argentina and 10 from the USA), followed by MLG3 (8 strains, all from Argentina) and MLG14 (8 strains, all from the USA). One to five strains were found in other MLGs including 26 MLGs represented by only a single strain. Of the 37 MLGs, 10 were only found in Argentina and 26 were only found in the USA. Other than MLG2, no other MLG was found in both countries (Table 1). Genotype accumulation curve showed that 15 loci were able to detect all 37 MLGs (Figure S3).
Table 3.
Multi-locus genotypes identified in Fusarium virguliforme using 16 microsatellite loci.
Bayesian analysis predicted that the 37 MLGs most likely belonged to two clusters (Figure S4). Grouping of the 37 MLGs into clusters I and II was shown in Figure 1A (right side). However, UPGMA dendrogram grouped the 37 MLGs into three clusters, IA, IB and II, with over 60% bootstrap support (Figure 1A, left side). The latter was supported by PCoA analysis (Figure 1B) and the minimal spanning tree (Figure 1C). Four MLGs, 13, 15, 18 and 28, all from the USA, formed cluster IA. Cluster IB consisted of nine MLGs (18 strains) from Argentina and four MLGs (11 strains) from the USA. Cluster II consisted of 19 MLGs (40 strains) from the USA and two MLGs (16 strains) from Argentina, including MLG2 that was found in both countries (Figure 1 and Table 1).
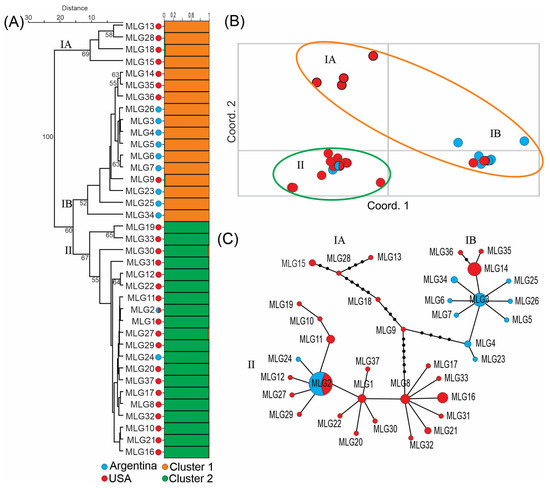
Figure 1.
Population structure of Fusarium virguliforme strains from Argentina and the USA. (A) Right side, Bayesian cluster analysis assigned the 37 MLGs into 2 clusters. The abundance of orange and green color on the horizontal bars indicates the likelihood of individual MLGs belonging to a particular cluster. Left side, UPGMA dendrogram grouped the 37 MLGs into 3 clusters. Numbers indicate bootstrap support in percentile. (B) Principal coordinate analysis (PCoA). (C) Minimum spanning tree. The areas of the circles are proportional to the number of strains in each MLG. Small black dots on the lines represent additional differences between neighboring MLGs.
The Argentina population was significantly different from the population from the USA based on AMOVA analysis. The differences between these two populations contributed to 17.20% of variance when analyzed by strains and 37.11% of variance when analyzed by MLGs (clone-correction), which is statistically significant (p < 0.05) for both analyses (Table 4). These two populations had similar genetic diversity based on Nei’s gene diversity index, with 0.31 for Argentina population and 0.33 for the population from the USA. Cluster IA had much higher diversity (0.30) than cluster IB (0.11) and cluster II (0.10) (Table 5).
Table 4.
Analysis of molecular variance (AMOVA) for Fusarium virguliforme populations from Argentina and the USA with or without clone-correction.
Table 5.
Genetic diversity in populations of Fusarium virguliforme.
4. Discussion
Advances in genomics removed the need of a tedious, and time- and resource-consuming bottleneck in the traditional method of developing microsatellite markers, namely obtaining microsatellite-containing sequences through construction and sequencing of microsatellite-enriched libraries [31,32,33]. However, investigators still faced another bottleneck, a large number of markers had to be experimentally screened to obtain a small number of informative markers. For example, in Anisogramma anomala, a fungus that causes eastern filbert blight on hazelnut trees, 236 loci were screened and 23 loci were found to be informative and suitable for future studies. In F. virguliforme, 12 informative loci were identified by screening of 92 loci [15]. Nine of the twelve loci were also identified in this study (Table S3).
Taken advantage of the availability of multiple genomes in many species, we previously developed a comparative genomics approach to identify informative microsatellite loci by bioinformatically mining genomes of multiple individuals in a species and applied it to Phytophthora sojae, an oomycete that causes Phytophthora root rot in soybean [17]. In silico PCR, a useful tool that allowed us to simulate experimental PCR based on genome assemblies, was essential for this approach. By comparing genome assemblies of 4 strains, a total of 157 informative microsatellite loci were identified in P. sojae. Experimental screening of 20 loci validated the results from data mining. In this study, we applied the same approach to F. virguliforme and identified 29 informative loci. Population study using 16 of the resulting loci supported the finding that the comparative genomics approach resolved the second bottleneck by eliminating the need to experimentally screening a large number of loci.
The quality of genome assemblies has a big impact on the informative microsatellite loci identification by the comparative genomics approach. The four assemblies used in this study had similar sizes (49.4–50.9 Mb) but they were all very fragmented. Whereas the assembly of strain Mont-1 consisted of 3098 contigs, the assemblies of the other three strains each consisted of over 20 thousand contigs. Mont-1 was sequenced using Roche 454 technology and assembled using PCAP.Rep.454 software version May-2010 and the other three strains were all sequenced using Illumina HiSeq technology and assembled using PCAP.Solexa software version Jan-2014. This fragmentation was the primary reason for the failure to design suitable primers for 1407 of 4078 loci. We found that 2625 of the 2671 loci had identical repeat numbers but many loci did not have a predicted amplicon in in silico PCR analysis with one or more strains, also mainly due to the fragmentation of the genome assemblies. Eleven of the 29 informative loci identified in this study had no predicted amplicon in one or two strains based on in silico PCR analysis but experimental PCR successfully amplified an allele in each strain. If the genome assemblies had been more continuous, we expect that primers could be designed for more loci. If we had predicted amplicon in all four strains for the 2625 which did not show polymorphism in in silico PCR, some loci might turn out to be informative.
Another factor that impacts the result of comparative genomics approach is the genetic diversity of the individuals used in the analysis. In our analysis, we had strains from both Argentina (NRRL34551) and the USA (Mont-1, LL0009 and Clinton-1B). They turned out to be in all three clusters, NRRL34551 (MLG34, cluster IB), Mont-1 (MLG14, cluster IB), LL0009 (MLG20, cluster II), and Clinton-1B (MLG15, cluster IA). If any one strain was excluded from the analysis, some loci would not be identified as informative (Table 2). We also detected more alleles for some loci in the population study than bioinformatic prediction (Table 2 and Table 3). For example, 8 and 10 alleles were detected for loci SSR20 and SSR23, respectively, in the population study, while only two and three alleles, respectively, were predicted by bioinformatic analysis. With more and better genomes being included in the bioinformatic analysis, more informative microsatellite loci will likely be identified.
We used 16 microsatellite loci to investigate a large collection of strains from Argentina and the USA. UPGMA dendrogram, PCoA analysis and minimal spanning tree all supported the grouping of these strains into three clusters. The four MLGs in cluster IA, all from the USA, had much higher genetic diversity than the other two clusters (Table 5). These MLGs differed from the two major clusters (IB and II) in multiple loci and differed from each other in multiple loci (Figure 1C and Table 3). Based on UPGMA dendrogram, cluster IA was basal to cluster IB and II (Figure 1A, left side). These data suggested that cluster IA represented the ancestral genetic diversity in F. virguliforme from where two major lineages, cluster IB and cluster II, evolved. O’Donnell et al. theorized that SDS-causing Fusarium pathogens originated from South or Mesoamerica based on the fact that soybean was introduced into South America earlier than North America and that more SDS-causing Fusarium species were found in South America than in North America [6]. Our results do not support this contention in the case of F. virguliforme. More studies are required to resolve this issue.
Cluster IB consisted primarily of MLGs from Argentina. The Argentina MLGs in this cluster seemed to be evolved around MLG3. Other Argentina MLGs differed from MLG3 by one or two loci (Figure 1C and Table 3). It’s interesting to note that MLG3 and MLG14, with eight strains each (second only to MLG2), were in cluster IB and differed from each other in only one locus (SSR17), but they were found exclusively in Argentina and the USA, respectively.
Cluster 2 consisted primarily of MLGs from the USA. MLG2, the most dominant MLG and the only MLG that was found in both countries, belong to this cluster. The MLGs from the USA in this cluster were diverse but the two MLGs from Argentina in this cluster differed from each other by only one locus (MLG2 and MLG24, SSR23). The facts that clusters IB and II mainly consist of MLGs from Argentina and the USA, respectively, and only one MLG is common in both countries, suggested that there is only limited genetic exchange between F. virguliforme isolates from South and North America due to geographic isolation. An alternative explanation is that environmental factors in Argentina may favor cluster IB while cluster II is more adapted to the environments of the USA. However, at the strain level, more strains in cluster II (18 strains) were found in Argentina than strains in cluster IB (16 strains).
At the state level, MLGs in cluster IB and cluster II were found in all four states in Argentina and all five states in the USA. MLG2, the most dominant MLG in both countries, were found in three states in Argentina (Santa Fe, Entre Rios and Buenos Aires) and two states in the USA (Indiana and Iowa). In Argentina, about half of the strains originated from those three states belonged to MLG2. Indiana was the most sampled state in both countries, with 29 strains belonging to 17 MLGs. Strains and MLGs in cluster II dominated the Indiana collection, and to a lesser extent, the Iowa collection. MLGs in cluster IA were found only in Indiana and Iowa (Figure 2).
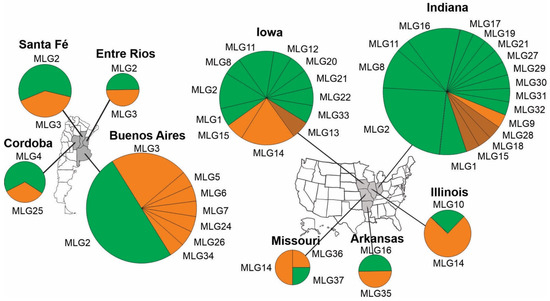
Figure 2.
Geographic distribution of multilocus genotypes (MLGs) in individual states in Argentina and the USA. Three strains, two from Argentina and one from the USA, whose state origin unknown (Table 1) were not included in the analysis. Brown, MLGs in cluster IA; orange, MLGs in cluster IB; and green, MLGs in cluster II (Figure 1). The areas of the circles are proportional to the number of strains from individual states and the areas of the pies are proportional to the number of strains in individual MLGs from individual states.
To our knowledge, this is the first study that examined the population structure of F. virguliforme in a large and broad collection of strains from both Argentina and the USA. It showed that our collection likely consisted of three clusters, a potentially ancestral cluster that was only found in the USA, and two dominant clusters that were found in all sampled states in both countries. More studies with broader collection from North and South America are needed to determine the origin of this pathogen. Host resistance is the most economic and effective means in managing soil-borne diseases such as SDS [34]. For breeding programs, it is important to evaluate the soybean lines under development using representative isolates of the pathogen. Our study suggests that the dominant MLGs in Cluster IB (MLG3 and MLG14) and cluster II (MLG2) and a representative strain in cluster IA would be a good choice.
Supplementary Materials
The following supporting information can be downloaded at: https://www.mdpi.com/article/10.3390/jof9111109/s1. Table S1: Summary of microsatellite loci identified in Fusarium virguliforme strain Mont-1 by MISA. Table S2: Primers for the 29 informative microsatellite loci in Fusarium virguliforme. Table S3: ID matching of microsatellite loci identified in our study and those in a previous study [15]. Figure S1: PCR amplification of 29 informative microsatellite loci in four Fusarium virguliforme strains. Microsatellite ids are listed at the top. Lane number: M, 1kb DNA ladder; B, negative control; 1, Mont-1; 2, NRRL34551; 3, LL0009; and 4, Clinton-1B. Figure S2: Confirmation of strain identity as Fusarium virguliforme using species-specific PCR as previously described [21]. Figure S3: The number of multilocus genotypes (MLGs) detected in Fusarium virguliforme by randomly sampling of a subset of 16 microsatellite markers. Figure S4: Delta K graph for each K cluster.
Author Contributions
Conceptualization, G.C.; methodology, G.C. and H.T.; bioinformatic analysis, G.C.; formal analysis, L.L.d.S.; investigation, H.T.; writing—original draft preparation, G.C. and L.L.d.S.; writing—review and editing, G.C., L.L.d.S., J.-R.X. and B.S.; visualization, L.L.d.S.; supervision, G.C.; project administration, G.C.; funding acquisition, G.C. and B.S. All authors have read and agreed to the published version of the manuscript.
Funding
This research was supported by Agricultural Research Service (ARS), USDA, in-house project 5020-21000-008-00D. This research was supported in part by the appointment of Dr. Leandro Lopes da Silva to the Agricultural Research Service (ARS) Research Participation Program administered by the Oak Ridge Institute for Science and Education (ORISE) through an interagency agreement (#60-5020-1) between the U.S. Department of Energy (DOE) and the U.S. Department of Agriculture (USDA). ORISE is managed by ORAU under DOE contract number DE-SC0014664. All opinions expressed in this paper are the author’s and do not necessarily reflect the policies and views of USDA, DOE, or ORAU/ORISE.
Institutional Review Board Statement
Not applicable.
Informed Consent Statement
Not applicable.
Data Availability Statement
The data presented in this study are available in the paper and Supplemental Documents.
Acknowledgments
The authors are grateful to Mercedes Scandiani of Rosario National University, Argentina, for providing the Argentina strains.
Conflicts of Interest
The authors declare no conflict of interest.
References
- Rodriguez, M.C.; Sautua, F.; Scandiani, M.; Carmona, M.; Asurmendi, S. Current recommendations and novel strategies for sustainable management of soybean sudden death syndrome. Pest Manag. Sci. 2021, 77, 4238–4248. [Google Scholar] [CrossRef]
- Bradley, C.A.; Allen, T.W.; Sisson, A.J.; Bergstrom, G.C.; Bissonnette, K.M.; Bond, J.; Byamukama, E.; Chilvers, M.I.; Collins, A.A.; Damicone, J.P.; et al. Soybean yield loss estimates due to diseases in the United States and Ontario, Canada, from 2015 to 2019. Plant Health Prog. 2021, 22, 483–495. [Google Scholar] [CrossRef]
- Wang, J.; Sang, H.; Jacobs, J.L.; Oudman, K.A.; Hanson, L.E.; Chilvers, M.I. Soybean sudden death syndrome causal agent Fusarium brasiliense present in Michigan. Plant Dis. 2019, 103, 1234–1243. [Google Scholar] [CrossRef]
- Aoki, T.; O’Donnell, K.; Scandiani, M.M. Sudden death syndrome of soybean in South America is caused by four species of Fusarium: Fusarium brasiliense Sp. Nov., F. cuneirostrum Sp. Nov., F. tucumaniae, and F. virguliforme. Mycoscience 2005, 46, 162–183. [Google Scholar] [CrossRef]
- Arruda, G.M.T.; Miller, R.N.G.; Ferreira, M.A.S.V.; Café-Filho, A.C. Morphological and molecular characterization of the sudden-death syndrome pathogen of soybean in Brazil. Plant Pathol. 2005, 54, 53–65. [Google Scholar] [CrossRef]
- O’Donnell, K.; Sink, S.; Scandiani, M.M.; Luque, A.; Colletto, A.; Biasoli, M.; Lenzi, L.; Salas, G.; González, V.; Ploper, L.D.; et al. Soybean sudden death syndrome species diversity within North and South America revealed by multilocus genotyping. Phytopathology 2010, 100, 58–71. [Google Scholar] [CrossRef]
- Tewoldemedhin, Y.T.; Lamprecht, S.C.; Vaughan, M.M.; Doehring, G.; O’Donnell, K. Soybean SDS in South Africa is caused by Fusarium brasiliense and a novel undescribed Fusarium sp. Plant Dis. 2017, 101, 150–157. [Google Scholar] [CrossRef]
- Tewoldemedhin, Y.T.; Lamprecht, S.C.; Geldenhuys, J.J.; Kloppers, F.J. First report of soybean sudden death syndrome caused by Fusarium virguliforme in South Africa. Plant Dis. 2013, 98, 569. [Google Scholar] [CrossRef]
- Chehri, K.; Salleh, B.; Zakaria, L. Fusarium virguliforme, a soybean sudden death syndrome fungus in Malaysian soil. Australas. Plant Dis. Notes 2014, 9, 128. [Google Scholar] [CrossRef][Green Version]
- Brar, H.K.; Swaminathan, S.; Bhattacharyya, M.K. The Fusarium virguliforme toxin FvTox1 causes foliar sudden death syndrome-like symptoms in soybean. Mol. Plant-Microbe Interact. 2011, 24, 1179–1188. [Google Scholar] [CrossRef]
- Chang, H.X.; Domier, L.L.; Radwan, O.; Yendrek, C.R.; Hudson, M.E.; Hartman, G.L. Identification of multiple phytotoxins produced by Fusarium virguliforme including a phytotoxic effector (Fvnis1) associated with sudden death syndrome foliar symptoms. Mol. Plant-Microbe Interact. 2016, 29, 96–108. [Google Scholar] [CrossRef] [PubMed]
- Jin, H.; Hartman, G.L.; Nickell, C.D.; Widbolm, J.M. Characterization and purification of a phytotoxin produced by Fusarium solani, the causal Agent of soybean sudden death syndrome. Phytopathology 1996, 86, 277–282. [Google Scholar] [CrossRef]
- Malvick, D.K.; Bussey, K.E. Comparative analysis and characterization of the soybean sudden death syndrome pathogen Fusarium virguliforme in the Northern United States. Can. J. Plant Pathol. 2008, 30, 467–476. [Google Scholar] [CrossRef]
- Mbofung, G.Y.C.; Harrington, T.C.; Steimel, J.T.; Navi, S.S.; Yang, X.B.; Leandro, L.F. Genetic structure and variation in aggressiveness in Fusarium virguliforme in the Midwest United States. Can. J. Plant Pathol. 2012, 34, 83–97. [Google Scholar] [CrossRef]
- Wang, J.; Chilvers, M.I. Development and Characterization of Microsatellite markers for Fusarium virguliforme and their utility within clade 2 of the Fusarium solani species complex. Fungal Ecol. 2016, 20, 7–14. [Google Scholar] [CrossRef]
- Brinkmann, B.; Klintschar, M.; Neuhuber, F.; Hühne, J.; Rolf, B. Mutation rate in human microsatellites: Influence of the structure and length of the tandem repeat. Am. J. Hum. Genet. 1998, 62, 1408–1415. [Google Scholar] [CrossRef]
- Cai, G.; Fleury, T.J.; Zhang, N. Comparative genomics approach to build a genome-wide database of high-quality, informative microsatellite markers: Application on Phytophthora sojae, a soybean pathogen. Sci. Rep. 2019, 9, 7969. [Google Scholar] [CrossRef]
- Thiel, T.; Michalek, W.; Varshney, R.K.; Graner, A. Exploiting EST Databases for the development and characterization of gene-derived SSR-Markers in barley (Hordeum vulgare L.). Theor. Appl. Genet. 2003, 106, 411–422. [Google Scholar] [CrossRef]
- Koressaar, T.; Remm, M. Enhancements and modifications of primer design program Primer3. Bioinformatics 2007, 23, 1289–1291. [Google Scholar] [CrossRef]
- Kuhn, R.M.; Haussler, D.; James Kent, W. The UCSC Genome Browser and Associated Tools. Brief. Bioinform. 2013, 14, 144–161. [Google Scholar] [CrossRef]
- Wang, J.; Jacobs, J.L.; Byrne, J.M.; Chilvers, M.I. Improved diagnoses and quantification of Fusarium virguliforme, causal agent of soybean sudden death syndrome. Phytopathology 2015, 105, 378–387. [Google Scholar] [CrossRef] [PubMed]
- Pritchard, J.K.; Stephens, M.; Donnelly, P. Inference of population structure using multilocus genotype data. Genetics 2000, 155, 945–959. [Google Scholar] [CrossRef]
- Earl, D.A.; vonHoldt, B.M. STRUCTURE HARVESTER: A Website and program for visualizing STRUCTURE output and implementing the Evanno method. Conserv. Genet. Resour. 2012, 4, 359–361. [Google Scholar] [CrossRef]
- Evanno, G.; Regnaut, S.; Goudet, J. Detecting the number of clusters of individuals using the software STRUCTURE: A simulation study. Mol. Ecol. 2005, 14, 2611–2620. [Google Scholar] [CrossRef] [PubMed]
- Hammer, Ø.; Harper, D.A.T.; Ryan, P.D. PAST: Paleontological statistics software package for education and data analysis. Palaeontol. Electron. 2001, 4, 1–9. [Google Scholar]
- Peakall, R.; Smouse, P.E. GENALEX 6: Genetic analysis in excel. population genetic software for teaching and research. Mol. Ecol. Notes 2006, 6, 288–295. [Google Scholar] [CrossRef]
- Kamvar, Z.N.; Tabima, J.F.; Grünwald, N.J. Poppr: An R package for genetic analysis of populations with clonal, partially clonal, and/or sexual reproduction. PeerJ 2014, 2014, e281. [Google Scholar] [CrossRef]
- Nei, M. Estimation of average heterozygosity and genetic distance from a small number of individuals. Genetics 1978, 89, 583–590. [Google Scholar] [CrossRef]
- Excoffier, L.; Laval, G.; Schneider, S. Arlequin (Version 3.0): An integrated software package for population genetics data analysis. Evol. Bioinform. 2005, 1, 117693430500100. [Google Scholar] [CrossRef]
- Teacher, A.G.F.; Griffiths, D.J. HapStar: Automated haplotype network layout and visualization. Mol. Ecol. Resour. 2011, 11, 151–153. [Google Scholar] [CrossRef]
- Moncrief, I.; Garzon, C.; Marek, S.; Stack, J.; Gamliel, A.; Garrido, P.; Proaño, F.; Gard, M.; Dehne, H.; Fletcher, J. Development of simple sequence repeat (SSR) markers for discrimination among isolates of Fusarium proliferatum. J. Microbiol. Methods 2016, 126, 12–17. [Google Scholar] [CrossRef] [PubMed]
- Glenn, T.C.; Schable, N.A. Isolating microsatellite DNA loci. In Methods in Enzymology; Academic Press: Cambridge, MA, USA, 2005; Volume 395, pp. 202–222. [Google Scholar]
- Techen, N.; Arias, R.S.; Glynn, N.C.; Pan, Z.; Khan, I.A.; Scheffler, B.E. Optimized construction of microsatellite-enriched libraries. Mol. Ecol. Resour. 2010, 10, 508–515. [Google Scholar] [CrossRef] [PubMed]
- Panth, M.; Hassler, S.C.; Baysal-Gurel, F. Methods for management of soilborne diseases in crop production. Agriculture 2020, 10, 16. [Google Scholar] [CrossRef]


Disclaimer/Publisher’s Note: The statements, opinions and data contained in all publications are solely those of the individual author(s) and contributor(s) and not of MDPI and/or the editor(s). MDPI and/or the editor(s) disclaim responsibility for any injury to people or property resulting from any ideas, methods, instructions or products referred to in the content. |
© 2023 by the authors. Licensee MDPI, Basel, Switzerland. This article is an open access article distributed under the terms and conditions of the Creative Commons Attribution (CC BY) license (https://creativecommons.org/licenses/by/4.0/).