Article

Prediction of the Potential Distributions of Prunus salicina Lindl., Monilinia fructicola, and Their Overlap in China Using MaxEnt

College of Agronomy, Sichuan Agricultural University, Chengdu 611130, China
*
Author to whom correspondence should be addressed.
J. Fungi 2023, 9(2), 189; https://doi.org/10.3390/jof9020189
Submission received: 26 December 2022 / Revised: 25 January 2023 / Accepted: 28 January 2023 / Published: 31 January 2023

Abstract

:
Prunus salicina Lindl. (P. salicina) is an essential cash crop in China, and brown rot (BR) is one of its most important diseases. In this study, we collected geographic location information on P. salicina and Monilinia fructicola (G. Winter) Honey (M. fructicola), one of the BR pathogenic species, and applied the MaxEnt model to simulate its potential suitable distribution in China. There have been discussions about the dominant environmental variables restricting its geographical distribution and their overlap. The results showed that the mean temperature of the coldest quarter, precipitation of the warmest quarter, precipitation in July, and minimum temperatures in January and November were the main climatic variables affecting the potential distribution of P. salicina, while the coldest quarter, precipitation of the driest month, precipitation of March, precipitation of October, maximum temperatures of February, October, and November, and minimum temperature of January were related to the location of M. fructicola. Southern China had suitable conditions for both P. salicina and M. fructicola. Notably, the overlap area of P. salicina and M. fructicola was primarily located southeast of 91°48′ E 27°38′ N to 126°47′ E 41°45′ N. The potential overlap area predicted by our research provided theoretical evidence for the prevention of BR during plum planting.

1. Introduction

Prunus salicina Lindl. (P. salicina) is a species of plum in the Rosaceae family. It is also known as Jiaqingzi, Bulin, plum, and Jade Emperor plum. P. salicina is cultivated globally, and it is an important temperate fruit [1,2]. P. salicina is a deciduous fruit tree that originated in China and has been cultivated for over 3000 years [3]. At present, more than 20 provinces and municipalities in China grow Prunus. In 2020, China had 1.95 million hectares of harvested area and produced 6.48 million tons of plums, equivalent to 73.86% of the world’s plum planting area and 52.98% of the world’s plum output, according to the Statistics Department of the World Food and Agriculture Organization [4]. Among the plethora of pathogenic agents attacking Prunus crops, brown rot (BR) is the most important disease [5]. It can damage stone fruit trees, such as peaches (Prunus persica (L.) Batsch), nectarines (Prunus persica var. nucipersica (Suckow) C. K. Schneid), plums, apricots (Prunus armeniaca L.), and sour cherries (Prunus cerasus L.), along with some fruit trees, including apples (Malus pumila Mill.), and pears (Pyrus communis L.) [6,7,8,9]. BR is caused by Monilinia spp., which belongs to the phylum Ascomycota, family Sclerotiniaceae, and order Helotiales [10,11,12,13,14].
BR is widely distributed worldwide, with the most obvious damage in Australia, Asia, America, and Europe [10,15,16,17,18]. The disease can not only harm the buds, branches, flowers, and fruits during the growth stage but also induce fruit canker in the storage period, resulting in the decline of fruit yield and quality and increased economic losses [10,11,19]. The control of BR in the production, storage, and transportation of fruits can not only reduce financial loss but also limit the spread of the Monilinia spp. to stop the effect from influencing the full fruit export trade [10,11].
BR was reported in China as early as the 1920s and is generally common in China, with six Monilinia spp., including Monilinia fructicola (G. Winter) Honey (M. fructicola), Monilinia laxa (Aderhold & Ruhland) Honey (M. laxa), Monilinia fructigena (Pers.) Honey (M. fructigena), Monilinia mumeicola (Y. Harada, Y. Sasaki & Sano) Sand.-Den. & Crous (M. mumeicola), Monilinia polystroma (G.C.M. Leeuwen) Kohn (M. polystroma), and Monilinia yunnanensis (M.J. Hu & C.X. Luo) Sand.-Den. & Crous (M. yunnanensis), distributed in 22 provincial-level administrative regions [9,11,20,21,22,23]. M. yunnanensis was the most widely distributed species in 12 provincial-level administrative regions, mainly harming stone fruit and fruit plants [7]. M. fructicola was followed by M. yunnanensis, which mainly affects stone fruit plants in Beijing, Shandong, and Hebei Provinces [7]. It was followed by M. polystroma, which was mainly distributed in Hebei, Heilongjiang, and Shandong Provinces, and mainly infected fruit plants. M. mumeicola has been detected only in peaches, apricot, and Chongqing sour cherry in Hubei Province [5,24,25]. In this study, we pre-investigated 12 plum plantations in Mianyang city, Nanchong city, Luzhou city, Zigong city, Dazhou city, and Yibin city of Sichuan Province from May to June 2022 and detected M. fructicola at all sites. However, there were no report of the detection of M. fructicola from plum BR in Sichuan province [7,23,25]. We chose this specie as the pathogen marker to explore the geographical distribution of BR in plums by MaxEnt model.
MaxEnt is a widely used software for predicting species geographical distributions, especially when the number of distribution points is uncertain and the correlation between climate and environmental factors is unclear. The MaxEnt model can obtain a high prediction accuracy based only on distribution data [26,27,28], making it possible to analyze and predict the suitable habitat of the pathogen and its host plants. Recently, the MaxEnt model has been widely adopted in predicting plant potential planting areas, animal and plant habitats, invasive plant distribution areas, and quarantine pest prediction [29,30,31,32]. There are a few applications in plant protection, mainly used to analyze the climatic suitability of pests and diseases, predict the invasion possibility of quarantined pests and diseases, and simulate the impact of climate change on the distribution areas of pests and diseases [27,33]. For plant pathology, Wang et al. [34] combined MaxEnt and GIS tools to predict the potentially suitable areas of Diaphorina citri under climate change scenarios in China. Galdino’s team first mapped the global scale of the potential risk of the mango’s sudden decline by MaxEnt [35]. In addition to the current climatic scenarios, Ruheili et al. [36] utilized future projected climatic scenarios to eliminate the hotspots and proportions of the areas of witches’ broom disease in Oman. In our pre-investigation, we detected M. fructicola from plum fruits in Sichuan province, which is not included in the locations of the previous studies of plum BR. We hypothesized there were some locations with the potential to overlap P. salicina and M. fructicola in China, but they had not been acknowledged due to the lack of a mature model in the existing literature. Therefore, we collected geographic location information of P. salicina and M. fructicola by searching databases and the literature, downloaded climate variables from the WorldClim website, and used MaxEnt to simulate the potential suitable distribution of each in China. We evaluated the dominant environmental variables restricting the geographical distribution of P. salicina and M. fructicola, and assessed their overlap to provide evidence for future research and protection against BR.

2. Materials and Methods

2.1. Sources of Software and Map

MaxEnt software (version 3.4.1) was downloaded from the Museum of Natural History (https://biodiversityinformatics.amnh.org/open_source/maxent/, accessed on 2 September 2022); Java software was downloaded from the official website (https://www.oracle.com/java/, accessed on 31 August 2022); R (version 4.1.2) and Rstudio software were downloaded from the official websites (https://www.r-project.org/, https://www.rstudio.com/, accessed on 31 August 2022); ArcGIS software (version 10.8.1) came from the website (https://support.esri.com/en/Products/Desktop/arcgis-desktop/arcmap, accessed on 2 September 2022); the base map was provided by the National Meteorological Information Center.

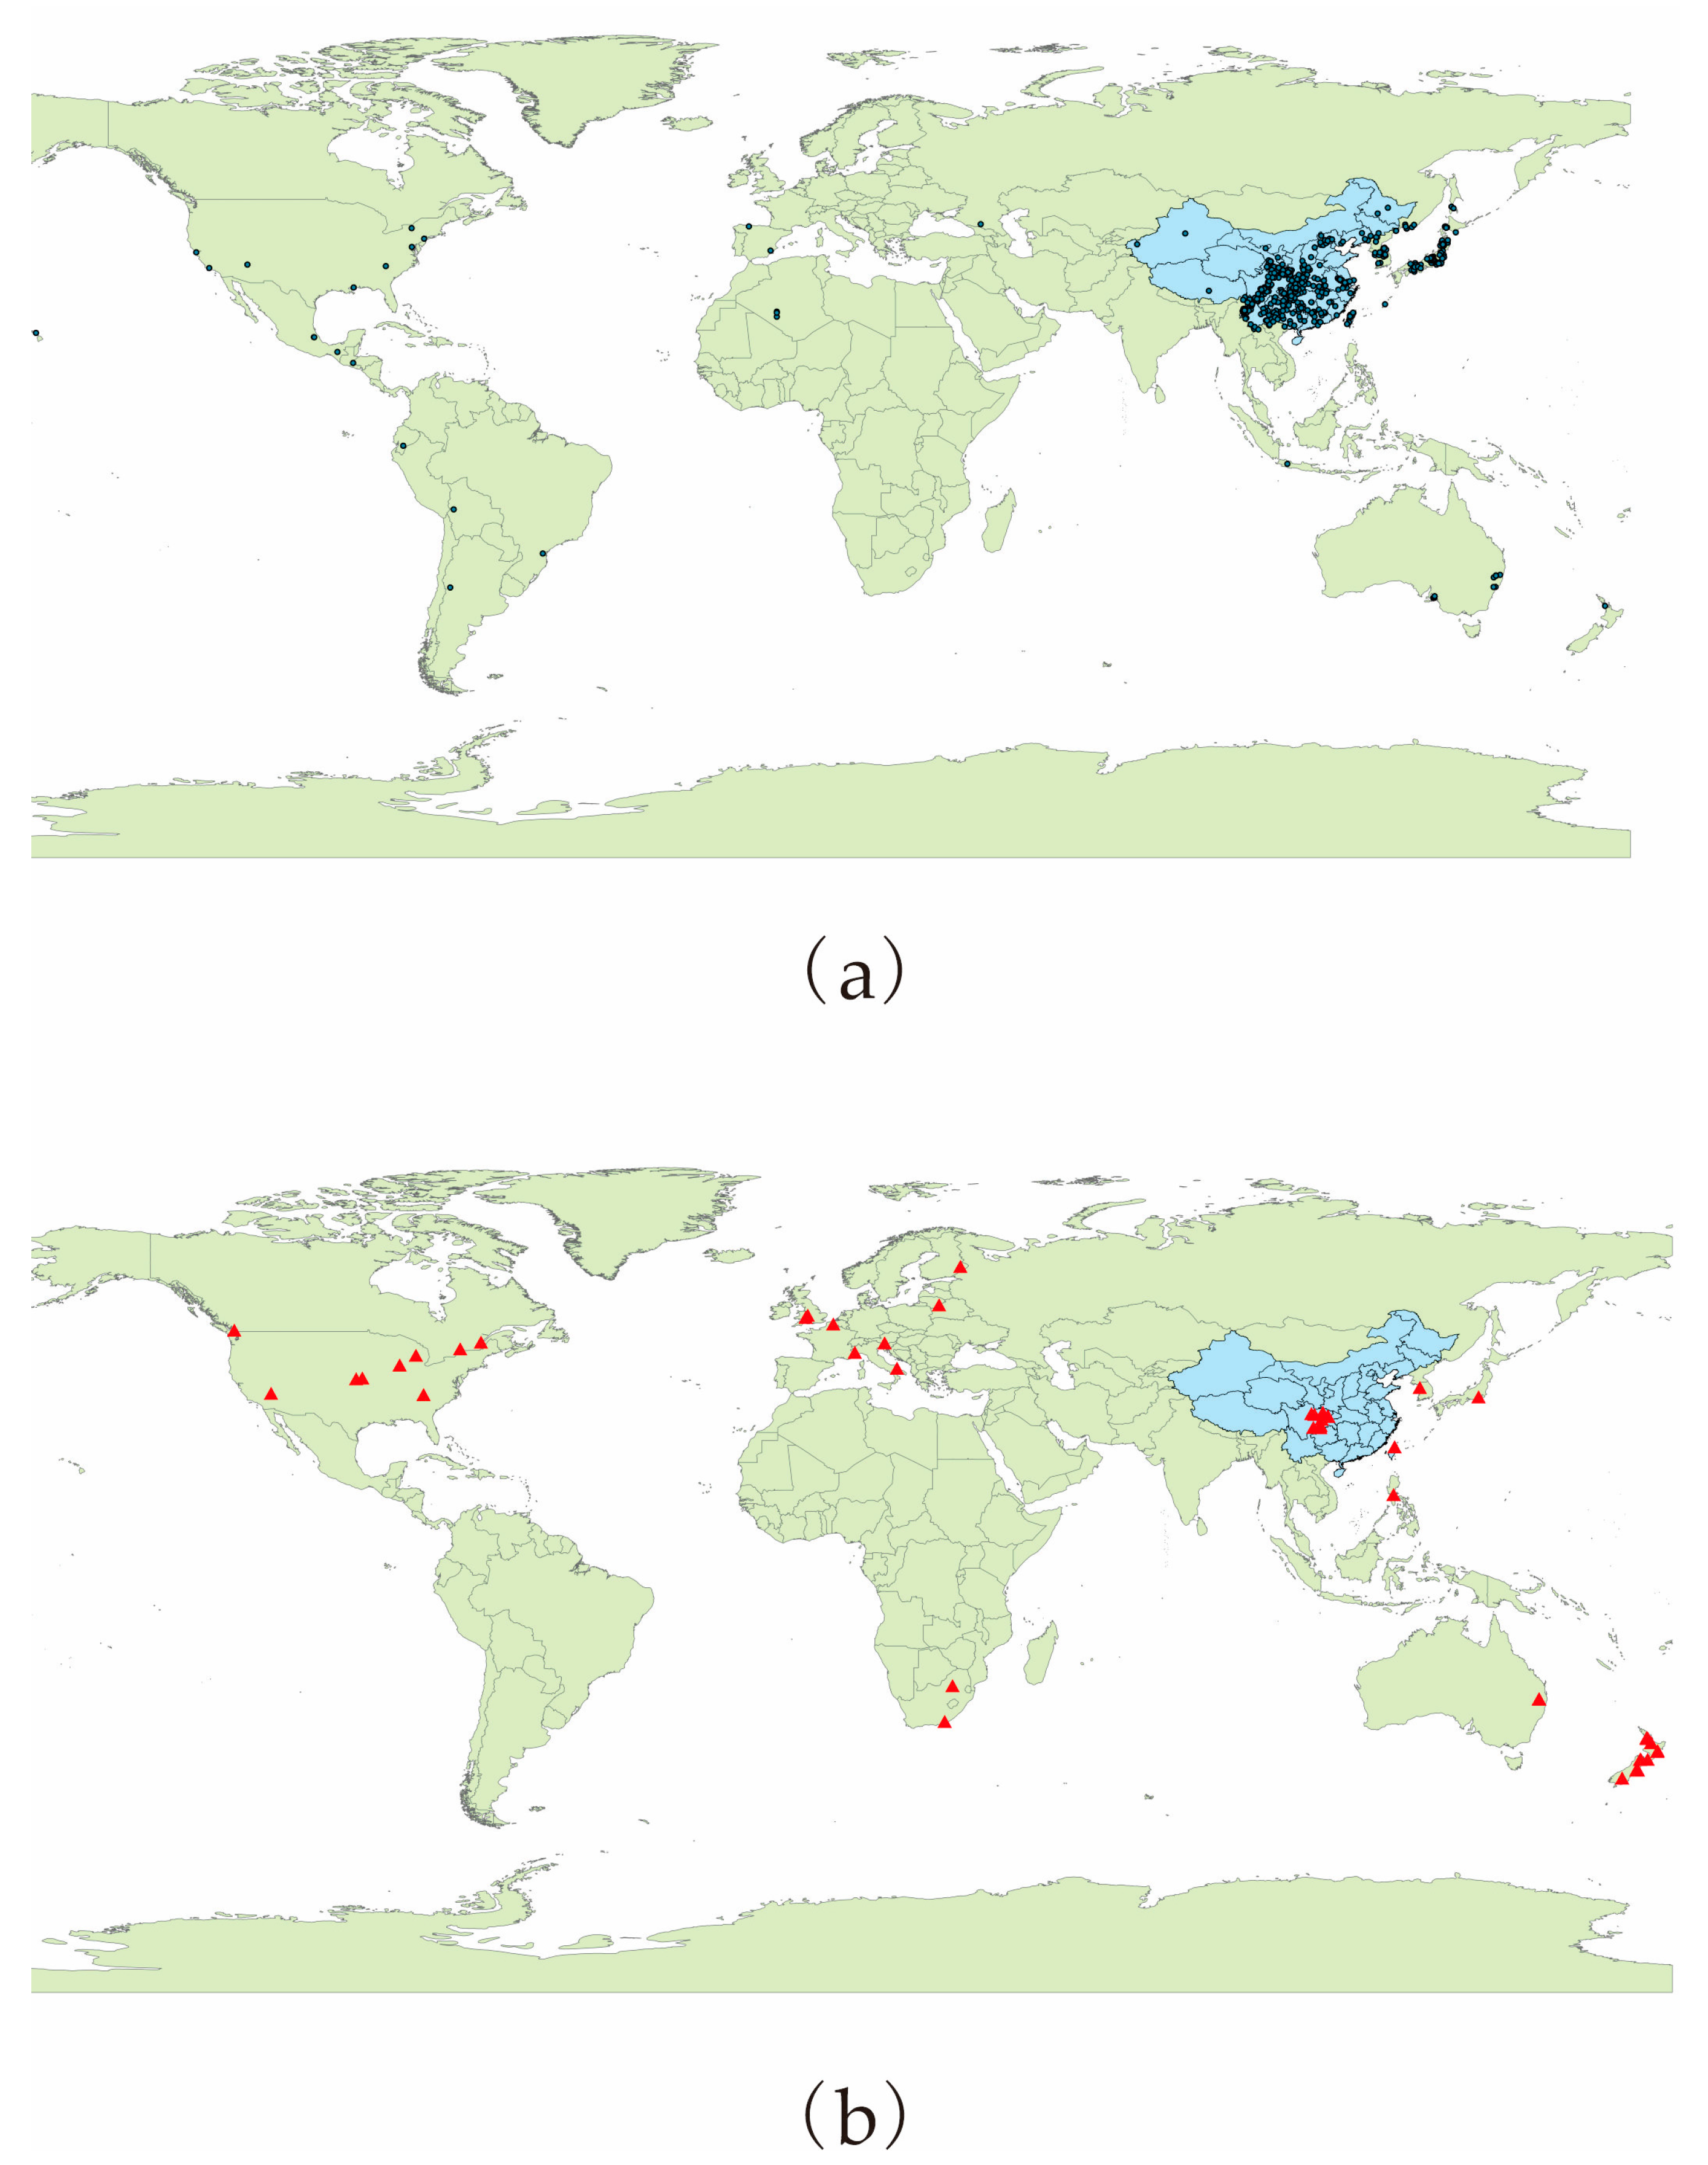
2.2. Occurrence Records of P. salicina and M. fructicola

The species distribution data for P. salicina and M. fructicola were downloaded from the Global Biodiversity Information Facility (GBIF, https://www.gbif.org/, accessed on 3 September 2022) and Centre Agriculture Bioscience International (CABI, https://www.plantwise.org/knowledgebank/, accessed on 3 September 2022), allowing the collection of P. salicina and M. fructicola occurrence data. The latitude and longitude recorded in the literature for P. salicina and M. fructicola were determined using Google Earth. Through the above procedure, 457 and 54 distribution data points were obtained for P. salicina and M. fructicola, respectively (Figure 1).

2.3. Climatic Variables Related to P. salicina and M. fructicola

The historical climate data were downloaded from the WorldClim website (https://www.worldclim.org/, accessed on 3 September 2022) with a spatial resolution of 5′. According to the literature review and the pre-investigation of our study, the climate data included 19 bioclimate factors, reflecting the characteristics and seasonal variation of temperature and precipitation with strong biological significance, monthly average precipitation, monthly average maximum, minimum temperature, etc., and the climate index from 1970 to 2000 (Table 1) [8,13,15,16,24,25,36,37,38,39,40,41]. Then, the climate variables were extracted from the administrative zoning map of China as the base map.
For screening modeling variables, correlation analysis of climate data was implemented using ENMtools software to calculate the Pearson coefficient. Initial climate variables and species distribution data were imported into MaxEnt to calculate the initial contribution rate, and variables with very low contribution rates were removed. Suitable environmental variables were screened based on a Pearson coefficient higher than |0.8| (very significant correlation) and the contribution rate.

2.4. Construction and Evaluation of the MaxEnt Model

To construct the MaxEnt model, the species distribution data were transferred into csv files, and the tiff variable layer was converted by the format conversion function of ArcGIS into the ASC layer required by MaxEnt software. The species distribution data and climate variables were imported into the software “Sample” and “Environmental layers”, respectively. Response curves for climate variables were created by checking “Create response curves”, the predictions were drawn by “Make pictures of predictions”, and variable importance was measured through Jackknife analysis. Output format and Output file type are set to default values. In the initial model, the “Random test percentage” of test data was set as 25%. Then, the reconstructed models were set to improve the accuracy. “Random seed” was set as a random proportion, “Regularization Multiplier” was set to 1, and the number of “ Replicates” was entered as 10, indicating the model would run 10 times. Other parameters were set to the default software. According to the UN’s Intergovernmental Panel on Climate Change (IPCC)’s explanation of the probability of species presence along with the results of previous research, the suitability grades were divided into four categories and displayed in different colors on the map: highly suitable area (p ≥ 0.66, red), moderately suitable area (0.33 ≤ p < 0.66, orange), poorly suitable area (0.05 ≤ p < 0.33, yellow), and unsuitable area (p < 0.05, white) [42,43].
The receiver operating characteristic (ROC) curve output by MaxEnt is one of the most effective and widely-used methods for evaluating the accuracy of niche models by excluding false positive and false negative distribution results [35,44,45,46,47]. The ROC curve is plotted with a false positive rate (1-specific rate) and true positive rate (1-omission rate) as the horizontal and vertical coordinates according to a series of dichotomies. The area under the curve (AUC) is not affected by the incidence of distribution points and the judgment threshold. The value range of AUC is [0, 1]. The closer the AUC is to 1, the greater the correlation between environmental variables and the distribution model and the higher the accuracy of prediction results. AUC values of 0.5–0.7 indicate poor performance. Values of 0.7–0.9 indicate moderate performance, and a value greater than 0.9 indicates high performance [43,48].

2.5. Extraction and Analysis of Overlapping Areas in Suitable Areas

The local analysis function of ArcGIS was utilized to extract the grids of overlapping areas of the total suitable areas of P. salicina and M. fructicola. The distribution in provinces (regions and cities) was calculated according to the grid attributes.

2.6. Evaluation of Simulation Results by the MaxEnt Model

According to the local bureau of agricultural statistics, we sampled, identified, and marked the longitude and latitude of the plum plantations using the unit of a county administrative region. After importing the geographic distribution data into ArcGIS, we calculated the distance between the distribution points in the unit grid and the grid centroid and retained the distribution point closest to the centroid. ArcGIS was used to extract the fitness index corresponding to the distribution points in the field survey. The accuracy of the definition of the distribution points in the high-suitability area was 100%, the accuracy of the definition points in the medium-suitability area was 66%, the accuracy of the definition points in the low-suitability area was 33%, and the accuracy of the definition points in the unsuitable area was 0 (Table 2). The evaluation formula is as follows:
A = i n x i × a i N × 100 %
A: accuracy; i: suitability level; N: number of field investigation points; Xi: number of grade i distribution points; ai: corresponding accuracy of the grade i suitability area.
Table 2. Comparison table of accuracy and suitable grade.
Suitable AreaSuitable GradeAccuracy
Unsuitable10%
Low-suitable233%
Middle-suitable366%
Highly-suitable4100%

3. Results

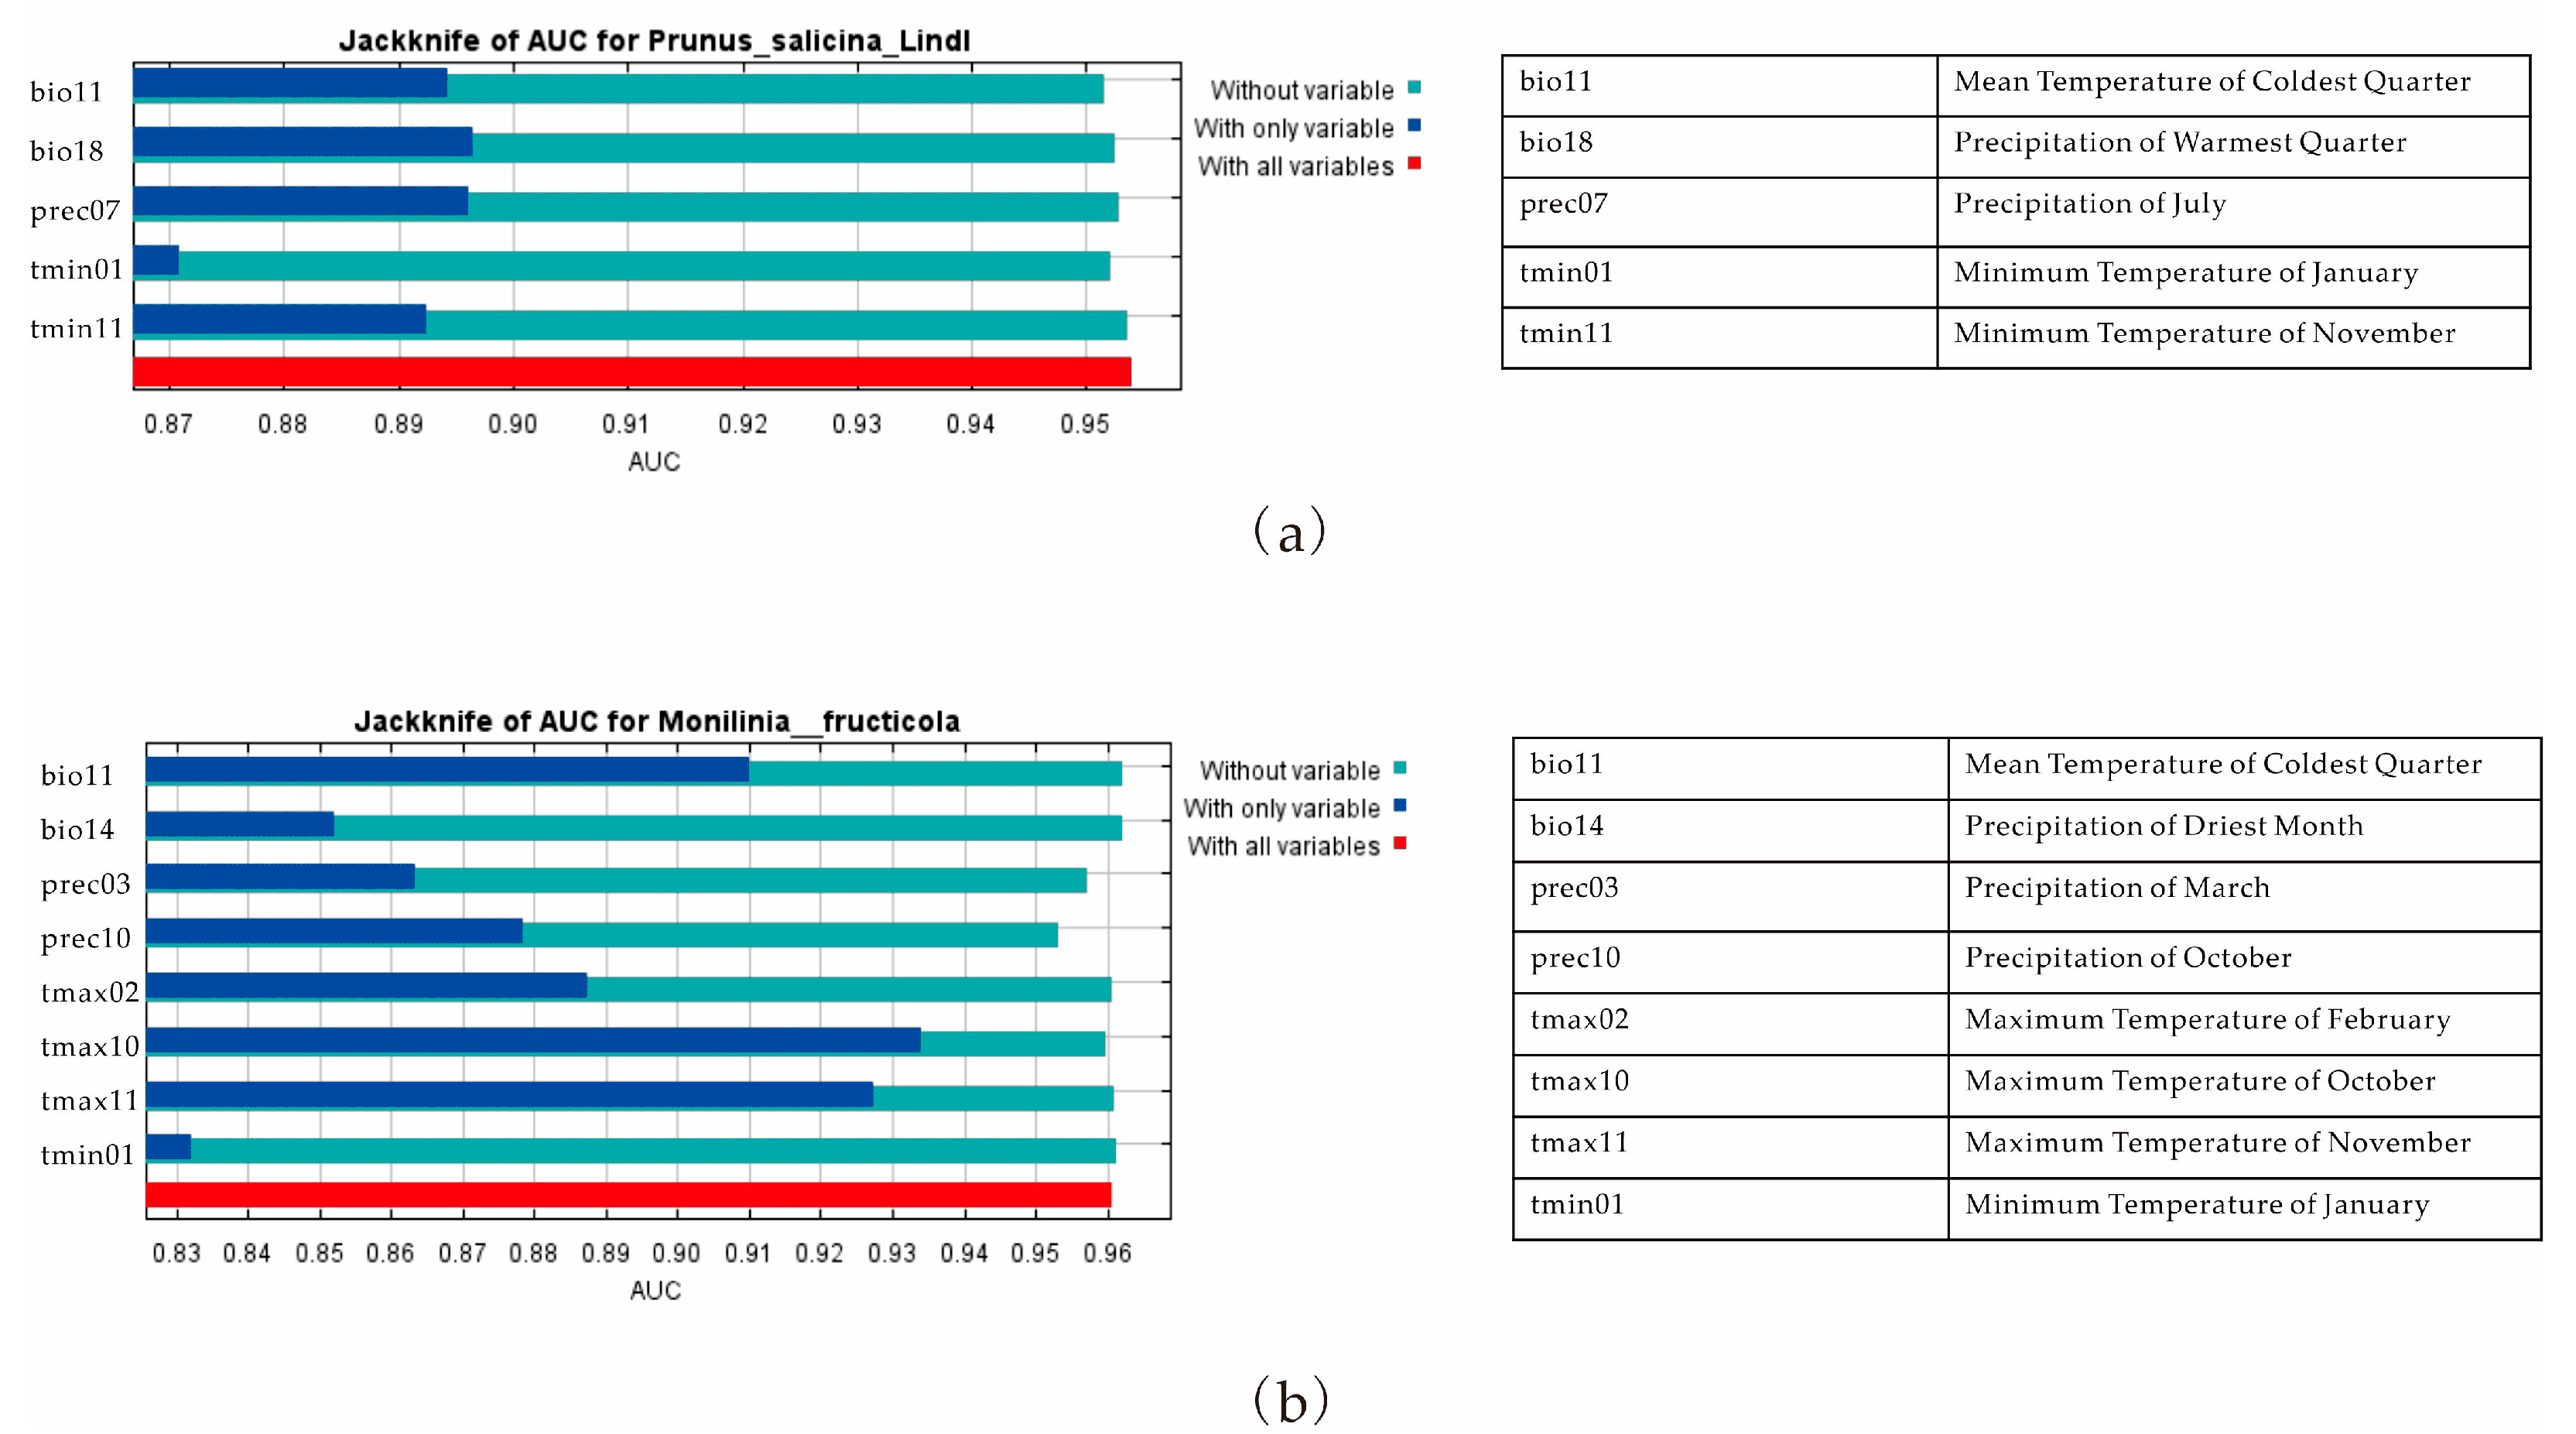
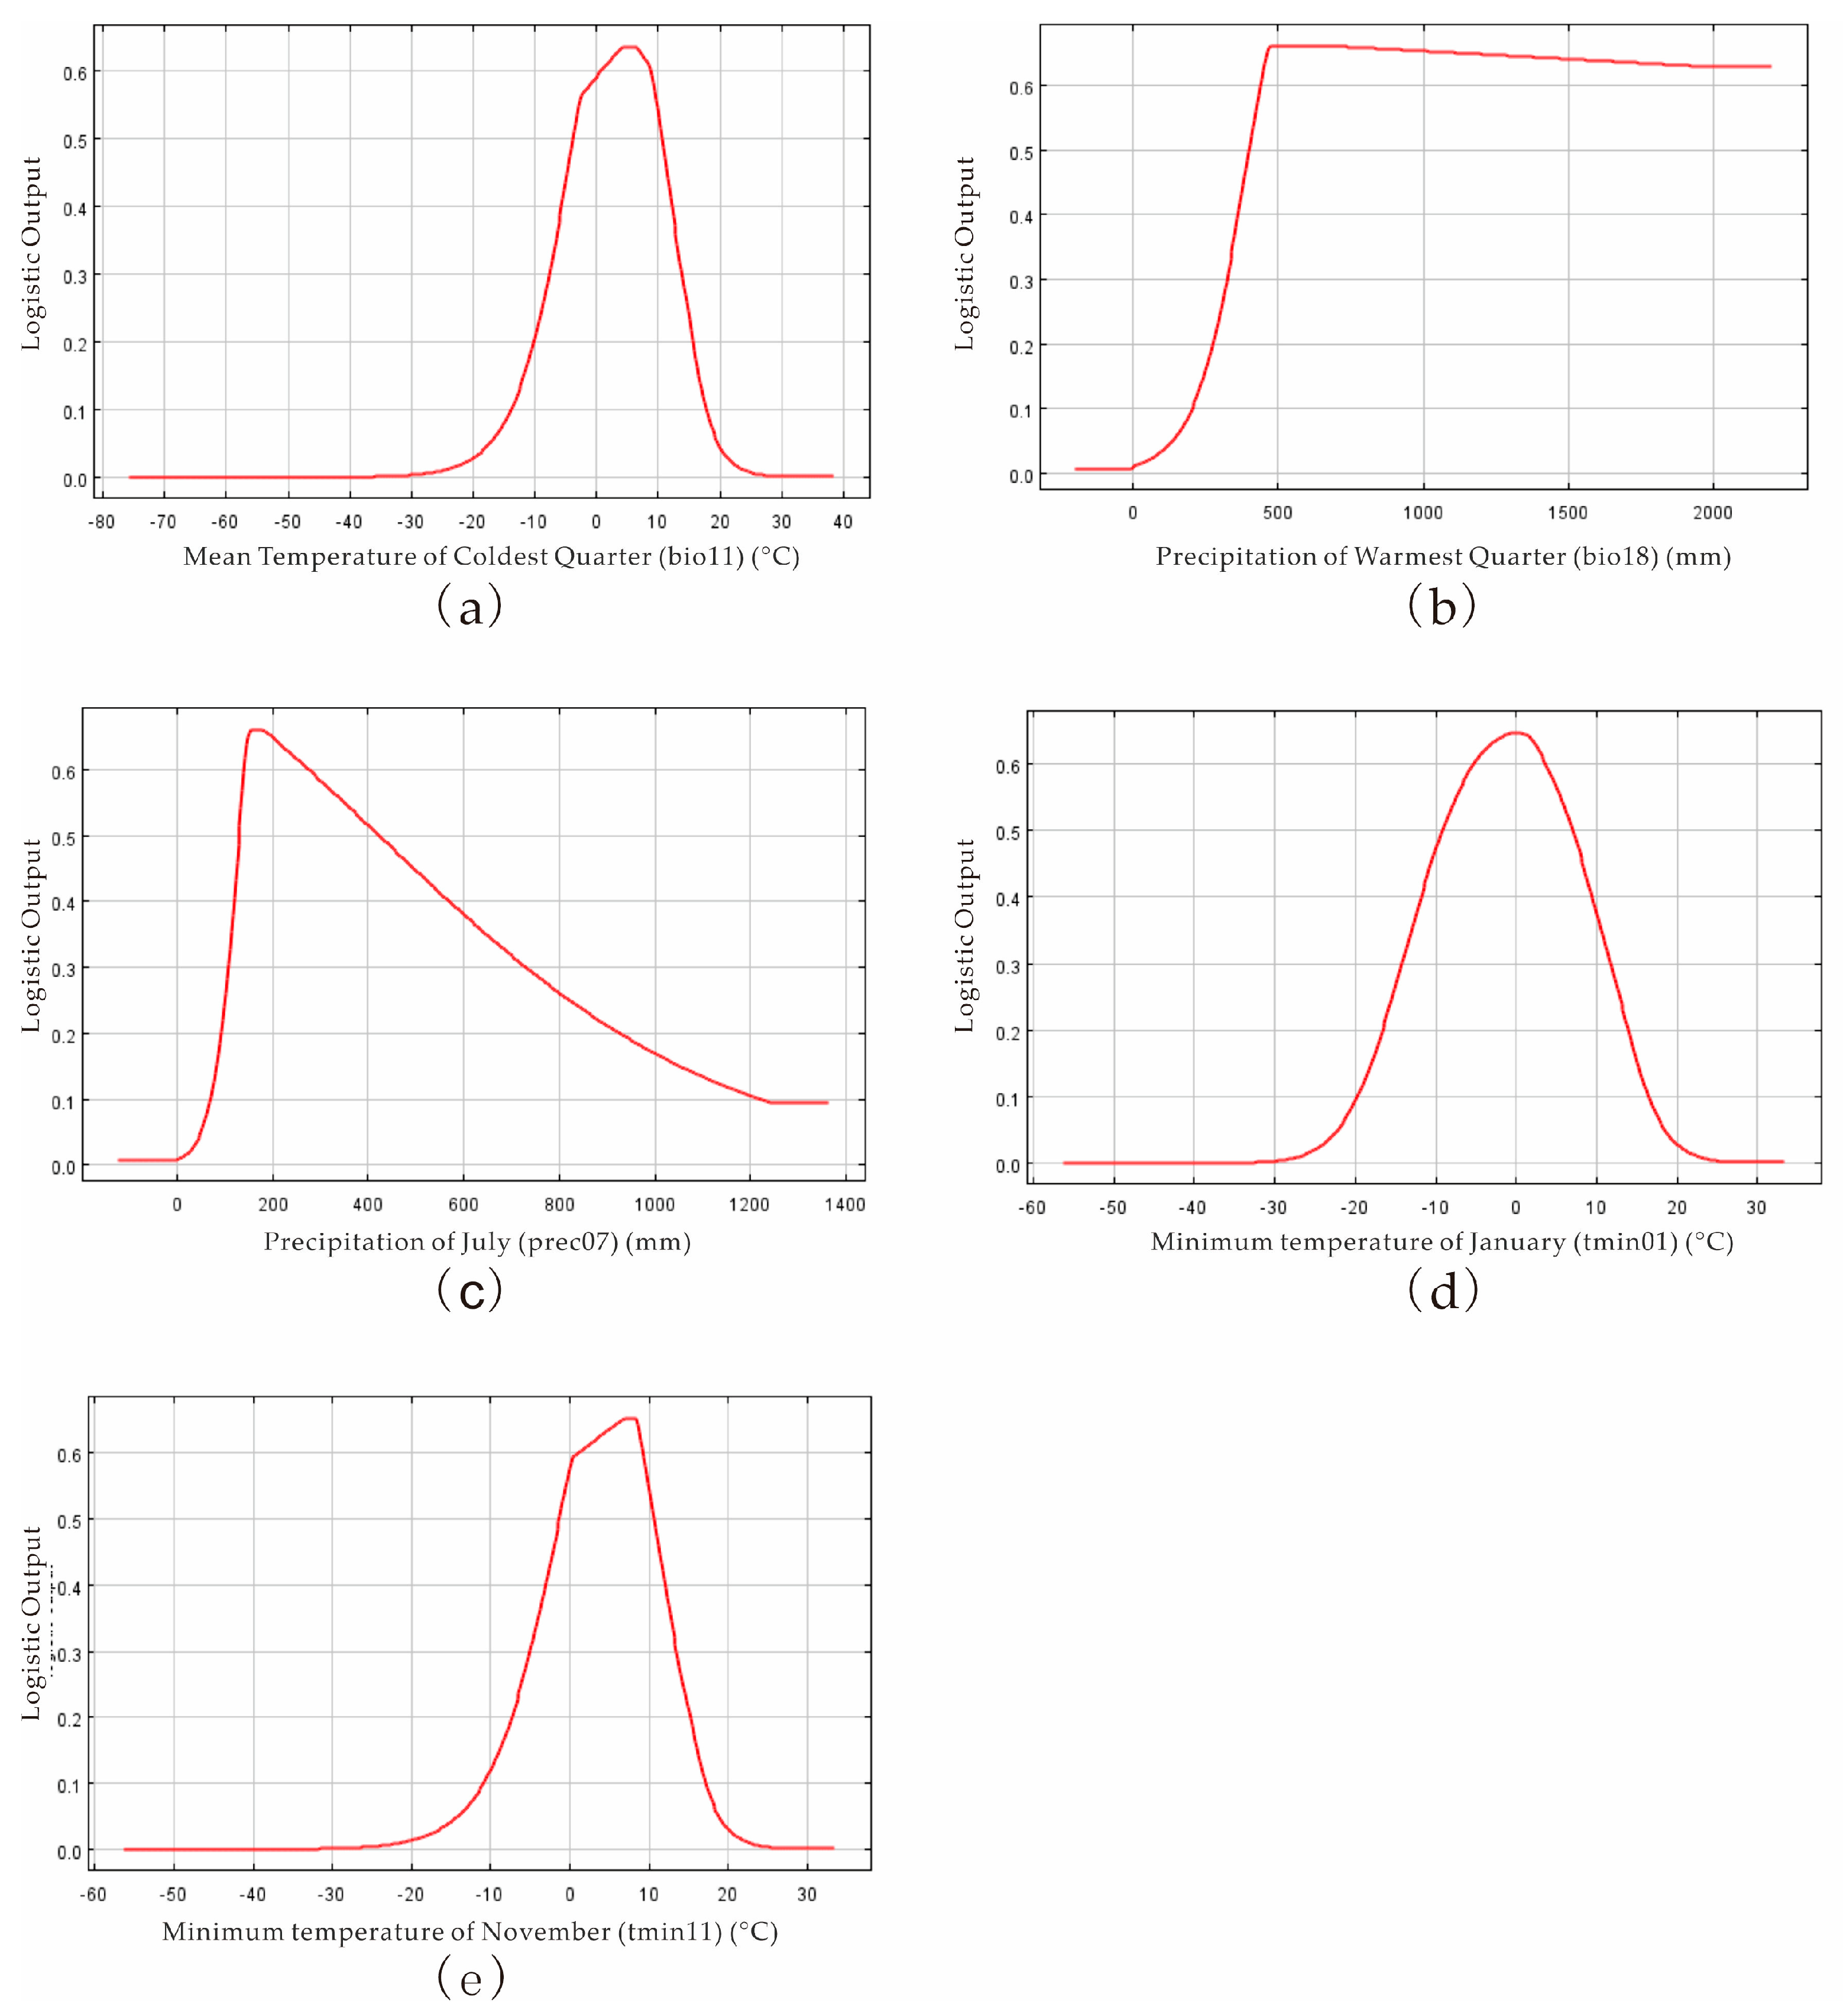
3.1. The Importance of Climate Variables on the Distribution of P. salicina and M. fructicola

The AUC indexes of the reconstructed model for P. salicina and M. fructicola were 0.954 and 0.961, respectively, indicating their high precision and credibility (Figure 2). According to the jackknife test, the AUC values of five environmental variables (bio11, bio18, prec07, tmin01, tmin11) were all >0.8, indicating that they were the main factors affecting the potential distribution area of P. salicina (Figure 3a). The AUC values of bio18 and prec07 were the highest, indicating that the warmest season precipitation and the mean precipitation in July were the most important variables affecting the geographical distribution of P. salicina (Figure 3a). Conversely, seven primary factors affected the distribution of M. fructicola with AUC values over 0.8 (Figure 3b). The AUC of both tmax10 and tmax11 exceeded 0.92, indicating that the maximum temperatures in October and November were the most essential variables influencing the geographical distribution of M. fructicola (Figure 3b). In addition, the mean temperature of the coldest quarter (bio11), precipitation of the warmest quarter (bio18), precipitation of July (prec07), and minimum temperatures of January (tmin01) and November (tmin11) were the main climatic variables affecting the potential distribution of P. salicina, while the coldest quarter (bio11), precipitation of the driest month (bio14), precipitation of March (prec03), precipitation of October (prec10), maximum temperatures of February (tmax02), October (tmax10), and November (tmax11), and minimum temperature of January (tmin01) were the factors most related to the location of M. fructicola (Figure 3).
The response curves presented the relationship between P. salicina and the above-selected environmental variables. Filtered by the response probability >0.66, the average temperature of the coldest quarter (bio11) was from −3.82 to 10.36 °C, the warmest quarterly precipitation (bio18) was from 404.8 to 2200 mm, the average precipitation in July (prec07) was from 131.936 to 450.368 mm, the average minimum temperature in January (tmin01) was from −9.158 to 7.538 °C, and the average minimum temperature in November (tmin11) was from −1.251 to 10.78 °C. These ranges indicated the suitable conditions for P. salicina occurrence (Figure 4).
Conversely, the response curves of M. fructicola are shown in Figure 5. The most suitable variables and ranges for the distribution of M. fructicola were the average temperature of the coldest quarter (bio11) from −3.937 to 11.557 °C, the precipitation of the driest month (bio14) from 24.64 to 308.56 mm, the average precipitation amounts in March (prec03) from 36.0192 to 152.1408 mm and in October (prec10) from 60.2096 to 163.2128 mm, the maximum temperatures in February (tmax02) from 10.027 to 23.887 °C, in October (tmax10) from 13.756 to 22.875 °C, in November (tmax11) from 8.49 to 22.821 °C, and the average minimum temperature in January (tmin01) from −8.928 to 13.714 °C (Figure 5).

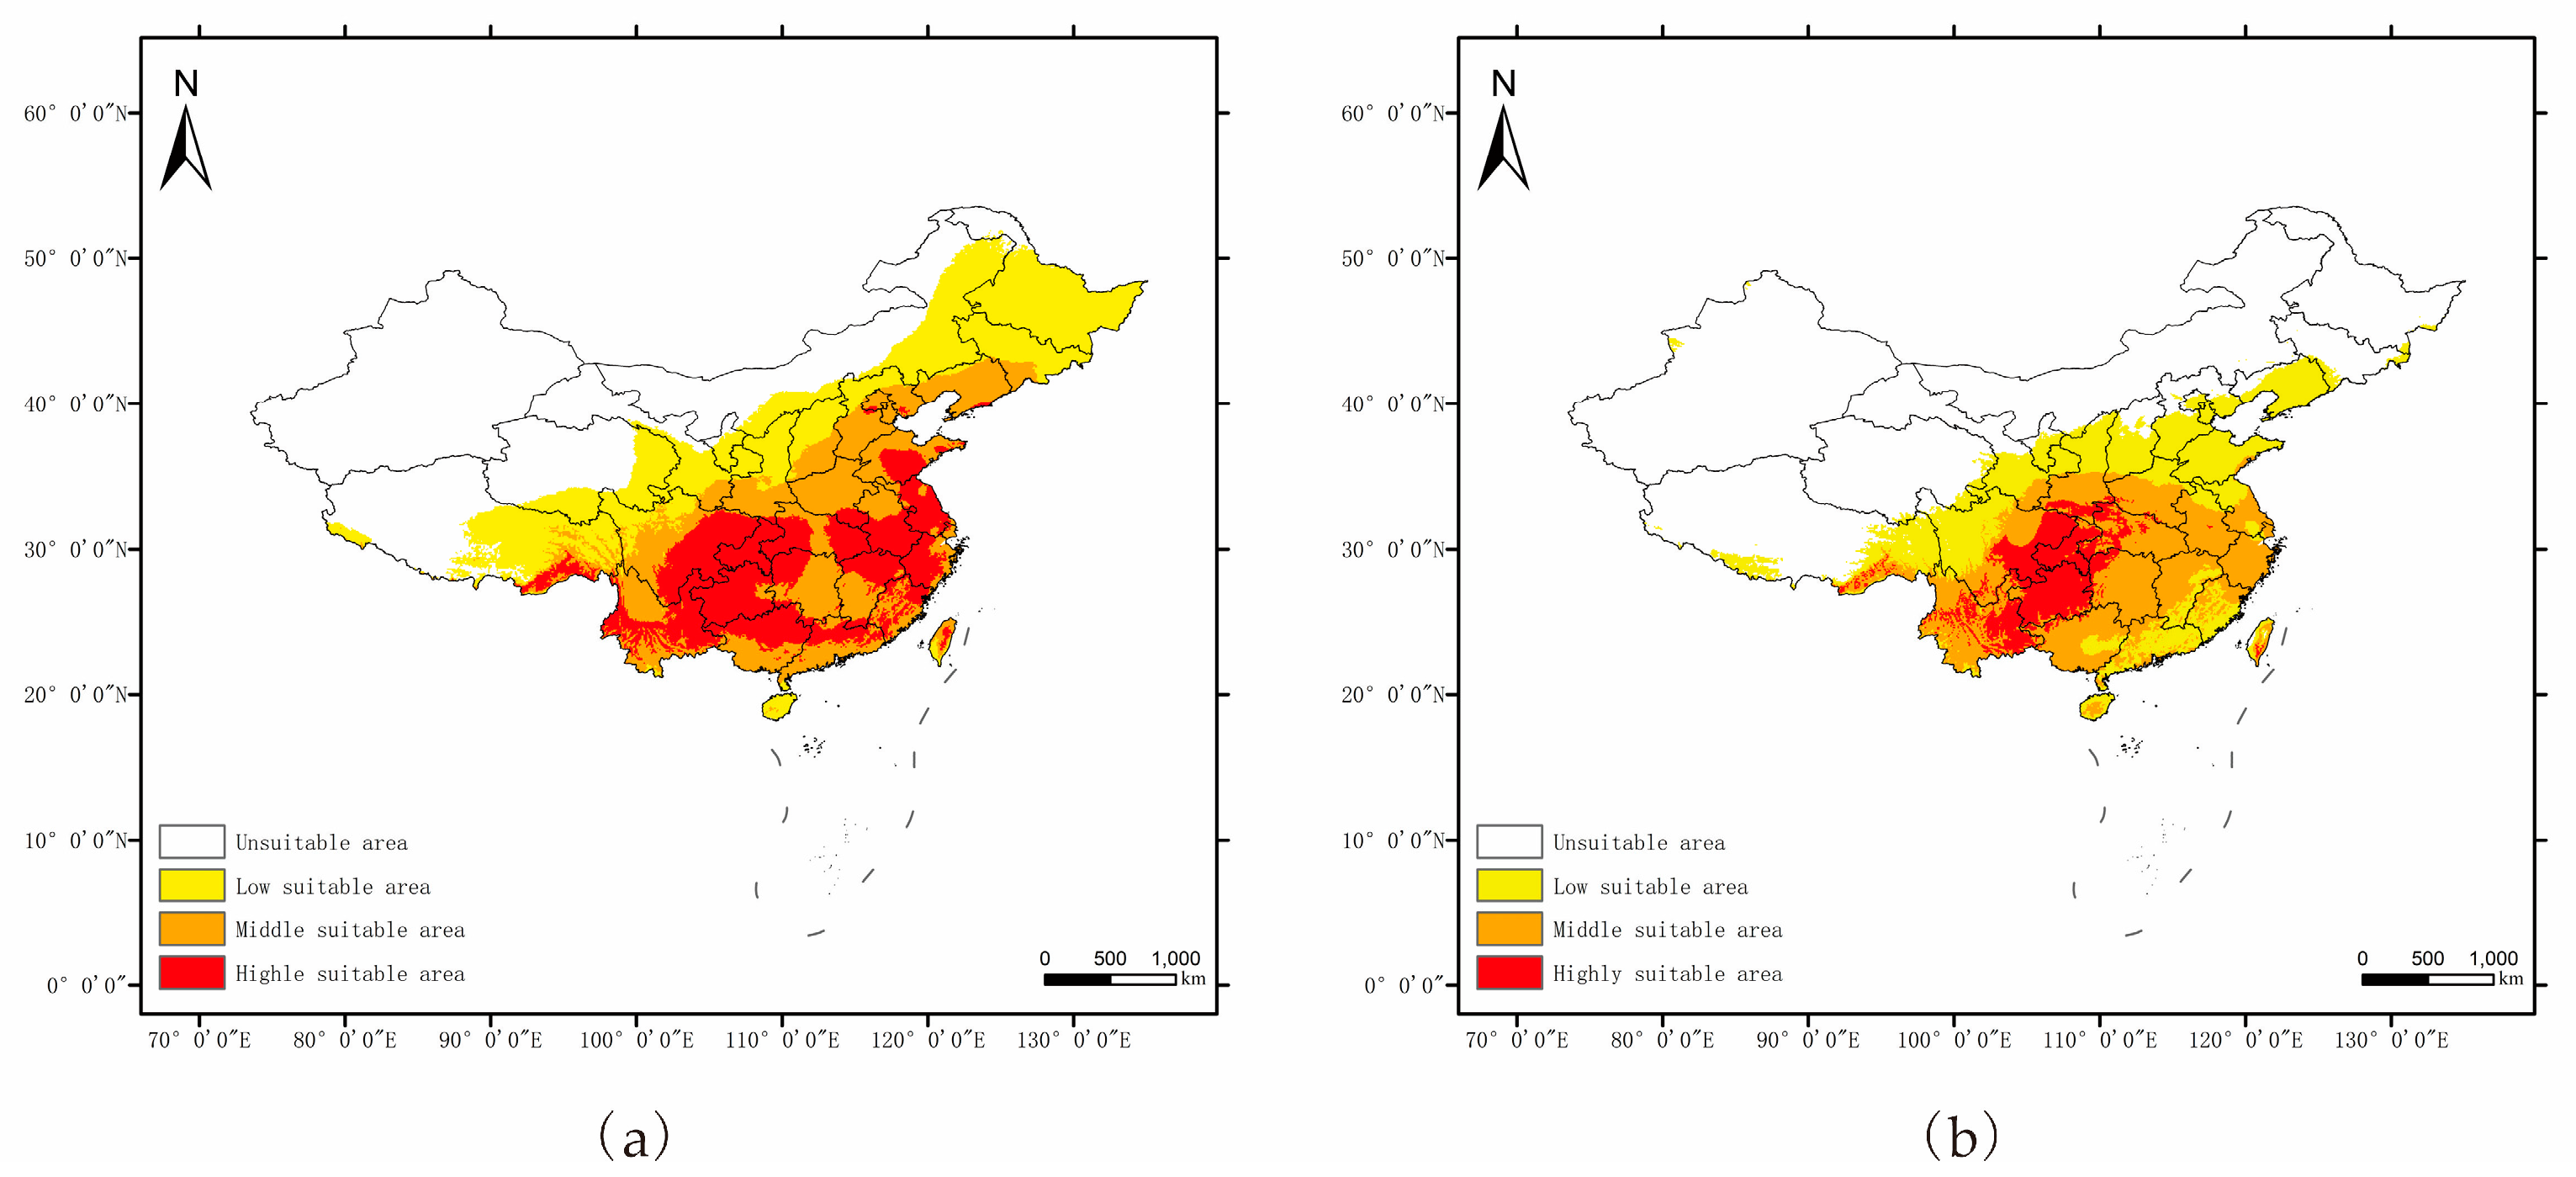
3.2. Potential Distributions of P. salicina and M. fructicola

The geographical distributions of P. salicina and M. fructicola in China under the current climate conditions predicted by MaxEnt are shown in Figure 6. The highly suitable areas for P. salicina were mainly located in southern China, including Chongqing, Guizhou, Jiangsu, most of Zhejiang, most of Anhui, most of Guangxi, Yunnan, Fujian, southeastern Sichuan, northwestern Hunan, southern Henan, and Shandong, as well as in Tibet in northern Guangdong and Jiangxi, and in central Taiwan (Figure 6a). The highly suitable area was 148.54 × 10⁴ km2, while the total suitable area was 554.14 × 10⁴ km2, accounting for 15.41% and 57.50% of China’s land, respectively.
However, there was a smaller, highly suitable area for M. fructicola, which was mainly located in the Yunguichuan Plateau and Chongqing (Figure 6b). The other areas of southern China were marked as moderately suitable for M. fructicola, including Henan, Jiangxi, Jiangsu, Zhejiang, Hunan, Guangxi, and Anhui (Figure 6b). There was a 58.96 × 10⁴ km2 area marked as highly suitable for M. fructicola. Its total suitable area covered 382.63 × 10⁴ km2, accounting for 6.12% and 39.71% of China’s land area (Figure 6b), respectively.

3.3. The Overlap Area between P. salicina and M. fructicola

The overlap area between P. salicina and M. fructicola is mostly located southeast of line 91°48′ E 27°38′ N to 126°47′ E 41°45′ N (Figure 7a). Except for Xinjiang, Tibet, Gansu, Inner Mongolia, Heilongjiang, and Jilin, it covers almost all of the land in southern China, with a total area of 380.125 × 10⁴ km2 (Figure 7a). This accounted for 68.60% and 99.35% of the suitable area for P. salicina and M. fructicola (Figure 7b,c), respectively, showing a high degree of coincidence. The distribution area of only P. salicina was marked in Heilongjiang, Jilin, a small part of Inner Mongolia, Qinghai, and Tibet (Figure 7a). Conversely, the distribution area of only M. fructicola was scattered in Tibet and Xinjiang, with an area of 2.502 × 10⁴ km2, accounting for 0.65% of its suitable area (Figure 7a).

3.4. Independent Sample Evaluation

Field investigation of species distribution is the most direct and reliable way to verify the model. In this study, the accuracy of simulation results was further verified by sample collection from several plum plantations in Sichuan Province. We filtered 12 plum plantations (Table 3), among which 10 were located in highly suitable areas, 2 in moderately suitable areas, and 0 in poorly suitable and unsuitable areas. The representative figure of the plum fruit with BR and cultured M. fructicola is shown in Figure 8. According to Formula (1), the calculation accuracy was 94.33%, indicating that the model’s simulation performance was good.

4. Conclusions and Discussion

Based on the MaxEnt model, we concluded the key environmental variables affecting the distribution of P. salicina and M. fructicola in China. The average temperature of the coldest quarter (−3.82~10.36 °C), the warmest quarterly precipitation (404.8~2200 mm), the average precipitation in July (131.936~450.368 mm), the average minimum temperature in January (−9.158~7.538 °C), and the average minimum temperature in November (−1.251~10.78 °C) were the suitable conditions for P. salicina occurrence. The essential variables of M. fructicola were the average temperature of the coldest quarter (−3.937~11.557 °C), the precipitation of the driest month (24.64~308.56 mm), the average precipitation amounts in March (36.0192~152.1408 mm) and in October (60.2096~163.2128 mm), the maximum temperatures in February (tmax02) from 10.027 to 23.887 °C, in October (13.756~22.875 °C), and in November (8.49~22.821 °C), and the average minimum temperature in January (−8.928~13.714 °C) (Figure 4 and Figure 5). The key environmental variables predicted that P. salicina was highly suitable to southern China, including Chongqing, Guizhou, Jiangsu, most of Zhejiang, most of Anhui, most of Guangxi, Yunnan, and Fujian, southeastern Sichuan, northwestern Hunan, southern Henan, Shandong, and in Tibet in northern Guangdong and Jiangxi, along with central Taiwan, and M. fructicola was mainly located in the Yunguichuan Plateau and Chongqing in China (Figure 6). Nevertheless, the overlap area of P. salicina and M. fructicola, which was at risk of plum BR infected by M. fructicola, was mostly located southeast of line 91°48′ E 27°38′ N to 126°47′ E 41°45′ N in China (Figure 7).
Monilinia spp. easily colonize on wounds formed by fruit rupture and produce a large number of conidia from the dead fruit or diseased remnant to infect the flowers or young fruit of the tree when there is enough rain in the spring [37,38]. In our study, the suitable temperature and humidity in winter and spring provided the environmental conditions for M. fructicola survival (Figure 5). M. fructicola was first found in China in 2003 and has been distributed in Beijing, Shandong, Hebei, and other major stone fruit-producing areas [41]. The distribution areas of M. fructicola around China were Gansu, Yunnan, Chongqing, Hubei, Jiangxi, Fujian, Zhejiang, Shanghai, Shandong, Hebei, Beijing, and Liaoning [5,20,21,23,39]. Based on MaxEnt, our prediction of the suitable areas of M. fructicola was consistent with the conclusions of previous research (Figure 6b). In this study, the unsuitable areas of M. fructicola in China included Northeast China, North China, Northwest China, and the Qinghai-Tibet Plateau, which may stem from the extremely cold and long-duration winters and drought in these areas.
To date, most of the research on BR in China has focused on peach BR. Only a few studies have focused on BR in other stone fruit trees, especially the plum [20,21,24,40,41]. M. fructicola was the second wildly distributed species, followed by M. yunnanensis in China, and mainly affects stone fruit plants in Beijing, Shandong, and Hebei Provinces [7,39]. However, the detected M. fructicola from the plum was only in Beijing, Shandong, Chongqing, and Yunnan [7,23,25]. In recent research, two other species of Monilinia spp., M. fructigena and M. polystroma, have been detected in the plum in China [39,41]. Several studies have suggested that M. laxa, M. fructigena, and M. fructicola have a close genetic relationship, which may contribute to the errors in early molecular sequencing identification [14,23,49,50,51]. However, our research predicted the overlap area of P. salicina and M. fructicola included, and was larger than the existing records, and only detected M. fructicola from the plum fruits, indicating the limitation of sample collection and the deficiency of research on plum BR. According to our prediction, provinces, including Sichuan, Guizhou, Guangxi, Guangdong, Hunan, Hubei, Henan, Anhui, Jiangxi, Jiangsu, Fujian, Zhejiang, and Taiwan, were in the overlap area and had highly suitable area for P. salicina planting, but didn’t have the detection of M. fructicola from previous studies (Figure 6a and Figure 7). Above provinces could be recognized as the potential disease areas of the plum BR caused by M. fructicola, suggesting the need of sampling verification in further researches and the prevention during the plum planting in these areas.
The niche model is based on the assumption that the niche demand of a species is conservative. Factors such as sample size, spatial scale, and climate variables will affect the prediction ability and stability of the model [52]. The species distribution data used in this study were mainly from databases and literature reviews, which ensured the operational requirements of the model, but there were no omissions. In the data obtained by database retrieval and literature review, some distribution points lacked latitudes and longitude and were determined by searching place names through coordinate positioning software, resulting in geographical errors. Furthermore, the occurrence and prevalence of plant pests and diseases are not only affected by climate but also closely related to host conditions, the species and quantity of natural enemies, and the frequency of orchard medication. Environmental factors affecting the distribution of host plants include climate, soil type, vegetation type, topographic factors, variety type, human activities, and socioeconomic structure [53,54,55]. Due to unknown changes in many future factors, and to reduce the complexity of the model, other factors were not included in the environmental variables in this study. It can be speculated that the niche predicted by the MaxEnt model is wider than the actual niche it occupies. In the next step, in addition to the influence of climate factors, the interaction between target species and other factors, the lagged phenomenon of climate change on species distribution, the changes in soil type and vegetation type, and the influence of human activities should also be considered to improve the prediction effectiveness of the model.

Author Contributions

Q.L. contributed to the original concept of the study. Z.Z. performed the experiments and analyzed the data. L.C. and X.Z. developed the modeling design. Q.L. and L.C. reviewed and interpreted the modeling output and visualized the results. Z.Z. and L.C. wrote the original manuscript, and Q.L. revised the article. All authors have read and agreed to the published version of the manuscript.

Funding

This research was funded by the modern agricultural industry technology system of the Sichuan innovation team (SCCXTD-2020-04) (Q.L.).

Institutional Review Board Statement

Not applicable.

Informed Consent Statement

Not applicable.

Data Availability Statement

All data sets generated and/or analyzed in the current study are available from the corresponding author upon reasonable request.

Conflicts of Interest

The authors declare no conflict of interest.

References

  1. Carrasco, B.; Meisel, L.; Gebauer, M.; Garcia-Gonzales, R.; Silva, H. Breeding in peach, cherry and plum: From a tissue culture, genetic, transcriptomic and genomic perspective. Biol. Res. 2013, 46, 219–230. [Google Scholar] [CrossRef] [PubMed]
  2. Ogah, O.; Watkins, C.S.; Ubi, B.E.; Oraguzie, N.C. Phenolic compounds in Rosaceae fruit and nut crops. J. Agric. Food Chem. 2014, 62, 9369–9386. [Google Scholar] [CrossRef] [PubMed]
  3. Umer, M.; Liu, J.; You, H.; Xu, C.; Dong, K.; Luo, N.; Kong, L.; Li, X.; Hong, N.; Wang, G.; et al. Genomic, Morphological and Biological Traits of the Viruses Infecting Major Fruit Trees. Viruses 2019, 11, 515. [Google Scholar] [CrossRef] [Green Version]
  4. Statistics Department of the World Food and Agriculture Organization. Crops and Livestock Products. Available online: https://www.fao.org/faostat/en/#data/QCL (accessed on 30 September 2022).
  5. Hu, M.J.; Cox, K.D.; Schnabel, G.; Luo, C.X. Monilinia species causing brown rot of peach in China. PLoS ONE 2011, 6, e24990. [Google Scholar] [CrossRef] [Green Version]
  6. Bernat, M.; Segarra, J.; Xu, X.M.; Casals, C.; Usall, J. Influence of temperature on decay, mycelium development and sporodochia production caused by Monilinia fructicola and M. laxa on stone fruits. Food Microbiol. 2017, 64, 112–118. [Google Scholar] [CrossRef] [Green Version]
  7. Zhu, X.Q.; Chen, X.Y.; Guo, L.Y. Population Structure of Brown Rot Fungi on Stone Fruits in China. Plant Dis. 2011, 95, 1284–1291. [Google Scholar] [CrossRef] [Green Version]
  8. Zhu, X.Q.; Niu, C.W.; Chen, X.Y.; Guo, L.Y. Monilinia Species Associated with Brown Rot of Cultivated Apple and Pear Fruit in China. Plant Dis. 2016, 100, 2240–2250. [Google Scholar] [CrossRef] [Green Version]
  9. Garcia-Benitez, C.; Casals, C.; Usall, J.; Sánchez-Ramos, I.; Melgarejo, P.; De Cal, A. Impact of Postharvest Handling on Preharvest Latent Infections Caused by Monilinia spp. in Nectarines. J. Fungi 2020, 6, 266. [Google Scholar] [CrossRef]
  10. Oliveira Lino, L.; Pacheco, I.; Mercier, V.; Faoro, F.; Bassi, D.; Bornard, I.; Quilot-Turion, B. Brown Rot Strikes Prunus Fruit: An Ancient Fight Almost Always Lost. J. Agric. Food Chem. 2016, 64, 4029–4047. [Google Scholar] [CrossRef] [Green Version]
  11. Fan, J.Y.; Guo, L.Y.; Xu, J.P.; Luo, Y.; Michailides, T.J. Genetic diversity of populations of Monilinia fructicola (Fungi, Ascomycota, Helotiales) from China. J. Eukaryot. Microbiol. 2010, 57, 206–212. [Google Scholar] [CrossRef]
  12. MYCOBANK Database. Available online: https://www.mycobank.org/ (accessed on 18 January 2023).
  13. Monilinia Fructicola (Brown Rot); Species Pa; Plantwiseplus Knowledge Bank: 2022. Available online: https://plantwiseplusknowledgebank.org/doi/10.1079/pwkb.species.34746 (accessed on 18 January 2023).
  14. De Miccolis Angelini, R.M.; Landi, L.; Raguseo, C.; Pollastro, S.; Faretra, F.; Romanazzi, G. Tracking of Diversity and Evolution in the Brown Rot Fungi Monilinia fructicola, Monilinia fructigena, and Monilinia laxa. Front. Microbiol. 2022, 13, 854852. [Google Scholar] [CrossRef]
  15. Arroyo, F.T.; Camacho, M.; Daza, A. First Report of Fruit Rot on Plum Caused by Monilinia fructicola at Alcalá del Río (Seville), Southwestern Spain. Plant Dis. 2012, 96, 590. [Google Scholar] [CrossRef] [PubMed]
  16. Latorre, B.A.; Díaz, G.A.; Valencia, A.L.; Naranjo, P.; Ferrada, E.E.; Torres, R.; Zoffoli, J.P. First Report of Monilinia fructicola Causing Brown Rot on Stored Japanese Plum Fruit in Chile. Plant Dis. 2014, 98, 160. [Google Scholar] [CrossRef] [PubMed]
  17. Guven, H.; Everhart, S.E.; De Miccolis Angelini, R.M.; Ozkilinc, H. Genetic diversity assessments of brown rot pathogen Monilinia fructicola based on the six simple sequence repeat loci. J. Plant Dis. Prot. 2021, 128, 1459–1465. [Google Scholar] [CrossRef]
  18. Patel, J.S.; Tian, P.; Navarrete-Tindall, N.; Bartelette, W.S. Occurrence of brown rot of wild plum caused by Monilinia fructicola in Missouri. Plant Health Prog. 2022. [Google Scholar] [CrossRef]
  19. Tshikhudo, P.P.; Nnzeru, L.R.; Munyai, T.C. Monilinia fructicola intercepted on Prunus spp. imported from Spain into South Africa between 2010 and 2020. S. Afr. J. Sci. 2022, 118, 1–6. [Google Scholar] [CrossRef]
  20. Yin, L.F.; Chen, S.N.; Yuan, N.N.; Zhai, L.X.; Li, G.Q.; Luo, C.X. First Report of Peach Brown Rot Caused by Monilinia fructicola in Central and Western China. Plant Dis. 2013, 97, 1255. [Google Scholar] [CrossRef] [PubMed]
  21. Hu, M.J.; Chen, Y.; Chen, S.N.; Liu, X.L.; Yin, L.F.; Luo, C.X. First Report of Brown Rot of Peach Caused by Monilinia fructicola in Southeastern China. Plant Dis. 2011, 95, 225. [Google Scholar] [CrossRef]
  22. Zhang, S.; Xiang, D.; Li, T.; Xu, B. First report of brown rot of nectarine caused by Monilia yunnanensis in Tibet. Plant Dis. 2021, 105, 1853. [Google Scholar] [CrossRef]
  23. Côté, M.J.; Prud’homme, M.; Meldrum, A.J.; Tardif, M.C. Variations in sequence and occurrence of SSU rDNA group I introns in Monilinia fructicola isolates. Mycologia 2004, 96, 240–248. [Google Scholar] [CrossRef]
  24. Yin, L.F.; Chen, G.K.; Chen, S.N.; Du, S.F.; Li, G.Q.; Luo, C.X. First Report of Brown Rot Caused by Monilia mumecola on Chinese Sour Cherry in Chongqing Municipality, China. Plant Dis. 2014, 98, 1009. [Google Scholar] [CrossRef] [PubMed]
  25. Yin, L.F.; Chen, S.N.; Chen, G.K.; Schnabel, G.; Du, S.F.; Chen, C.; Li, G.Q.; Luo, C.X. Identification and Characterization of Three Monilinia Species from Plum in China. Plant Dis. 2015, 99, 1775–1783. [Google Scholar] [CrossRef] [PubMed] [Green Version]
  26. Elith, J.; Graham, C.H.; Anderson, R.P.; Dudík, M.; Ferrier, S.; Guisan, A.; Hijmans, R.J.; Huettmann, F.; Leathwick, J.R.; Lehmann, A.; et al. Novel methods improve prediction of species’ distributions from occurrence data. Ecography 2006, 29, 129–151. [Google Scholar] [CrossRef] [Green Version]
  27. Phillips, S.J.; Anderson, R.P.; Schapire, R.E. Maximum entropy modeling of species geographic distributions. Ecol. Model. 2006, 190, 231–259. [Google Scholar] [CrossRef] [Green Version]
  28. Phillips, S.J.; Dudík, M. Modeling of species distributions with Maxent: New extensions and a comprehensive evaluation. Ecography 2008, 31, 161–175. [Google Scholar] [CrossRef]
  29. Sanchez, A.C.; Osborne, P.E.; Haq, N. Identifying the global potential for baobab tree cultivation using ecological niche modelling. Agrofor. Syst. 2010, 80, 191–201. [Google Scholar] [CrossRef]
  30. Pearson, R.G.; Dawson, T.P.; Liu, C. Modelling species distributions in Britain: A hierarchical integration of climate and land-cover data. Ecography 2004, 27, 285–298. [Google Scholar] [CrossRef]
  31. Gaikwad, J.; Wilson, P.D.; Ranganathan, S. Ecological niche modeling of customary medicinal plant species used by Australian Aborigines to identify species-rich and culturally valuable areas for conservation. Ecol. Model. 2011, 222, 3437–3443. [Google Scholar] [CrossRef]
  32. Kroschel, J.; Sporleder, M.; Tonnang, H.E.Z.; Juarez, H.; Carhuapoma, P.; Gonzales, J.C.; Simon, R. Predicting climate-change-caused changes in global temperature on potato tuber moth Phthorimaea operculella (Zeller) distribution and abundance using phenology modeling and GIS mapping. Agric. For. Meteorol. 2013, 170, 228–241. [Google Scholar] [CrossRef]
  33. Li, X.; Wang, Y. Applying various algorithms for species distribution modelling. Integr. Zool. 2013, 8, 124–135. [Google Scholar] [CrossRef]
  34. Wang, R.; Yang, H.; Wang, M.; Zhang, Z.; Huang, T.; Wen, G.; Li, Q. Predictions of potential geographical distribution of Diaphorina citri (Kuwayama) in China under climate change scenarios. Sci. Rep. 2020, 10, 9202. [Google Scholar] [CrossRef] [PubMed]
  35. Galdino, T.V.; Kumar, S.; Oliveira, L.S.; Alfenas, A.C.; Neven, L.G.; Al-Sadi, A.M.; Picanço, M.C. Mapping Global Potential Risk of Mango Sudden Decline Disease Caused by Ceratocystis fimbriata. PLoS ONE 2016, 11, e0159450. [Google Scholar] [CrossRef] [Green Version]
  36. Ruheili, A.M.A.; Boluwade, A.; Subhi, A.M.A. Assessing the Impact of Climate Change on the Distribution of Lime (16srii-B) and Alfalfa (16srii-D) Phytoplasma Disease Using MaxEnt. Plants 2021, 10, 460. [Google Scholar] [CrossRef] [PubMed]
  37. Zhong, Y.F.; Zhang, Y.W.; Chen, X.Y.; Luo, Y.; Guo, L.Y. Overwintering of Monilinia fructicola in stone fruit orchards in Northern China. J. Phytopathol. 2008, 156, 229–235. [Google Scholar] [CrossRef]
  38. Ogawa, J.M.; Zehr, E.; Biggs, A.R. Brown Rot; APS Press: Riverdale Park, MD, USA, 1995; pp. 7–10. [Google Scholar]
  39. Zhu, X.Q.; Duan, W.J.; Hu, M.J.; Guo, L.Y. Research progress on brown rot pathogens of stone and pome fruit. Mycosystema 2022, 41, 331–348. [Google Scholar]
  40. Zhu, X.Q.; Chen, X.Y.; Luo, Y.; Guo, L.Y. First report of Monilinia fructicola on peach and nectarine in China. Plant Pathol. 2005, 54, 575. [Google Scholar] [CrossRef]
  41. Zhu, X.Q.; Guo, L.Y. First Report of Brown Rot on Plum Caused by Monilia polystroma in China. Plant Dis. 2010, 94, 478. [Google Scholar] [CrossRef]
  42. de Almeida, T.M.; Neto, I.R.; Consalter, R.; Brum, F.T.; Rojas, E.A.G.; da Costa-Ribeiro, M.C.V. Predictive modeling of sand fly distribution incriminated in the transmission of Leishmania (Viannia) braziliensis and the incidence of Cutaneous Leishmaniasis in the state of Paraná, Brazil. Acta Trop. 2022, 229, 106335. [Google Scholar] [CrossRef]
  43. Harte, J.; Newman, E.A. Maximum information entropy: A foundation for ecological theory. Trends Ecol. Evol. 2014, 29, 384–389. [Google Scholar] [CrossRef]
  44. Chen, L.; Jiang, C.; Zhang, X.; Song, C.; Wang, R.; Wang, X.; Li, Q. Prediction of the potential distribution of the predatory mite Neoseiulus californicus (McGregor) in China under current and future climate scenarios. Sci. Rep. 2022, 12, 11807. [Google Scholar] [CrossRef]
  45. Deng, X.; Xu, D.; Liao, W.; Wang, R.; Zhuo, Z. Predicting the distributions of Scleroderma guani (Hymenoptera: Bethylidae) under climate change in China. Ecol. Evol. 2022, 12, e9410. [Google Scholar] [CrossRef] [PubMed]
  46. Wang, R.; Li, Q.; He, S.; Liu, Y.; Wang, M.; Jiang, G. Modeling and mapping the current and future distribution of Pseudomonas syringae pv. actinidiae under climate change in China. PLoS ONE 2018, 13, e0192153. [Google Scholar] [CrossRef] [PubMed] [Green Version]
  47. Bai, D.F.; Chen, P.J.; Atzeni, L.; Cering, L.; Li, Q.; Shi, K. Assessment of habitat suitability of the snow leopard (Panthera uncia) in Qomolangma National Nature Reserve based on MaxEnt modeling. Zool. Res. 2018, 39, 373–386. [Google Scholar] [CrossRef]
  48. Remya, K.; Ramachandran, A.; Jayakumar, S. Predicting the current and future suitable habitat distribution of Myristica dactyloides Gaertn. using MaxEnt model in the Eastern Ghats, India. Ecol. Eng. 2015, 82, 184–188. [Google Scholar] [CrossRef]
  49. Ioos, R.; Frey, P. Genomic variation within Monilinia laxa, M. fructigena and M. fructicola, and application to species identification by PCR. Eur. J. Plant Pathol. 2000, 106, 373–378. [Google Scholar] [CrossRef]
  50. Ma, Z.; Luo, Y.; Michailides, T.J. Nested PCR assays for detection of Monilinia fructicola in stone fruit orchards and Botryosphaeria dothidea from pistachios in California. J. Phytopathol. 2003, 151, 312–322. [Google Scholar] [CrossRef]
  51. Silan, E.; Ozkilinc, H. Phylogenetic divergences in brown rot fungal pathogens of Monilinia species from a worldwide collection: Inferences based on the nuclear versus mitochondrial genes. BMC Ecol. Evol. 2022, 22, 119. [Google Scholar] [CrossRef]
  52. Wood, D.; Lenné, J.M. A natural adaptive syndrome as a model for the origins of cereal agriculture. Proc. Biol. Sci. 2018, 285, 20180277. [Google Scholar] [CrossRef] [Green Version]
  53. Pesendorfer, M.B.; Ascoli, D.; Bogdziewicz, M.; Hacket-Pain, A.; Pearse, I.S.; Vacchiano, G. The ecology and evolution of synchronized reproduction in long-lived plants. Philos. Trans. R. Soc. B Biol. Sci. 2021, 376, 20200369. [Google Scholar] [CrossRef]
  54. Shen, J.C.; Zhang, Z.H.; Liu, R.; Wang, Z.H. Ecological restoration of eroded karst utilizing pioneer moss and vascular plant species with selection based on vegetation diversity and underlying soil chemistry. Int. J. Phytoremediat. 2018, 20, 1369–1379. [Google Scholar] [CrossRef]
  55. Acuña, C.V.; Rivas, J.G.; Brambilla, S.M.; Cerrillo, T.; Frusso, E.A.; García, M.N.; Villalba, P.V.; Aguirre, N.C.; Martínez, M.C.; Hopp, E.H.; et al. Characterization of Genetic Diversity in Accessions of Prunus salicina Lindl: Keeping Fruit Flesh Color Ideotype While Adapting to Water Stressed Environments. Agronomy 2019, 9, 487. [Google Scholar] [CrossRef]
Figure 1. Species occurrence records of P. salicina and M. fructicola. Notes: The black circles for P. salicina (a) and red triangles for M. fructicola (b) indicate distribution points.
Jof 09 00189 g001
Figure 2. ROC curve and AUC values for the reconstructed model for P. salicina (a) and M. fructicola (b).
Jof 09 00189 g002
Figure 3. The importance of climate variables on the distribution of P. salicina (a) and M. fructicola (b).
Jof 09 00189 g003
Figure 4. Relationship between distribution area of suitable areas and dominant climate variables ((a) mean temperature of coldest quarter; (b) precipitation of warmest quarter; (c) precipitation of July; (d) minimum temperature of January; (e) minimum temperature of November) of P. salicina.
Jof 09 00189 g004
Figure 5. Relationship between distribution area of suitable areas and dominant climate variables ((a) mean temperature of coldest quarter; (b) precipitation of driest month; (c) precipitation of March; (d) precipitation of October; (e) maximum temperature of February; (f) maximum temperature of October; (g) maximum temperature of November; (h) minimum temperature of January) of M. fructicola.
Jof 09 00189 g005
Figure 6. Potential distribution of P. salicina (a) and M. fructicola (b) in China.
Jof 09 00189 g006
Figure 7. Hot spot map of distribution consistency between P. salicina and M. fructicola in China (a) and their percentage of suitable areas (b and c).
Jof 09 00189 g007
Figure 8. The representative figure of the plum fruit with BR (a) and cultured M. fructicola (b).
Jof 09 00189 g008
Table 1. List of environmental variables.
AbbreviationsVariables
bio1Annual Mean Temperature
bio2Mean Diurnal Range (Mean of monthly (max temp–min temp)
bio3Isothermality (bio2/bio7) (* 100)
bio4Temperature Seasonality (standard deviation *100)
bio5Max Temperature of Warmest Month
bio6Min Temperature of Coldest Month
bio7Temperature Annual Range (bio5–bio6)
bio8Mean Temperature of Wettest Quarter
bio9Mean Temperature of Driest Quarter
bio10Mean Temperature of Warmest Quarter
bio11Mean Temperature of Coldest Quarter
bio12Annual Precipitation
bio13Precipitation of Wettest Month
bio14Precipitation of Driest Month
bio15Precipitation Seasonality (Coefficient of Variation)
bio16Precipitation of Wettest Quarter
bio17Precipitation of Driest Quarter
bio18Precipitation of Warmest Quarter
bio19Precipitation of Coldest Quarter
tminMinimum Temperature of Each Month
tmaxMaximum Temperature of Each Month
tmeanMean Temperature of Each Month
precPrecipitation of Each Month
Table 3. List of location, longitude, and latitude of plum sample points.
Sample PointsLongitudeLatitude
Jiangyou City, Mianyang City104.522031.5158
Jian Town, Jialing District, Nanchong City106.027730.5139
Heshi Town, Dachuan District, Dazhou City107.254331.1019
Mijiaba Town, Dachuan District, Dazhou City107.424931.1017
Xianshi Town, Hejiang County, Luzhou City105.739828.7154
Yaoba Town, Hejiang County, Luzhou City105.655628.7357
Fawangsi Town, Hejiang County, Luzhou City105.666428.7086
Lijiang Town, Hejiang County, Luzhou City105.799428.7639
Zitong Town, Jiangan County, Yibin City105.666428.7086
Dacheng Town, Pingshan County, Yibin City104.276528.7734
Banqiao Town, Fushun County, Zigong City104.700029.1688
Yuedong Town, Cangxi County, Guangyuan City106.266831.9840
Disclaimer/Publisher’s Note: The statements, opinions and data contained in all publications are solely those of the individual author(s) and contributor(s) and not of MDPI and/or the editor(s). MDPI and/or the editor(s) disclaim responsibility for any injury to people or property resulting from any ideas, methods, instructions or products referred to in the content.

