Article

Sol–Gel Synthesis of TiO2 with Pectin and Their Efficiency in Solar Cells Sensitized by Quantum Dots

by
Jean Flores-Gómez
1,
Silvia Mota-Macías
2,
Juan P. Guerrero-Jiménez
1,*,
Victor Hugo Romero-Arellano
1 and
Juan Morales-Rivera
1,*
1
School of Engineering and Technological Innovation, University of Guadalajara, Campus Tonalá, Av. Nuevo Periférico No. 555, Tonalá 45425, Jalisco, Mexico
2
School of Science and Technology, University of Guadalajara, Campus Colotlán, Carretera Federal No. 23, Km. 191, Colotlán 46200, Jalisco, Mexico
*
Authors to whom correspondence should be addressed.
Gels 2024, 10(7), 470; https://doi.org/10.3390/gels10070470
Submission received: 13 June 2024 / Revised: 24 June 2024 / Accepted: 7 July 2024 / Published: 17 July 2024
(This article belongs to the Special Issue Chemical Properties and Application of Gel Materials)

Abstract

:
In this study, titanium oxide TiO2 nanoparticles were produced using the sol–gel approach of green synthesis with pectin as the reducing agent. The synthetized TiO2 nanoparticles with pectin were characterized by scanning electron microscopy (SEM), X-ray diffraction (XRD), visible light absorption (UV–Vis) and the BET method. The structure and morphology of the TiO2 powder were described with SEM, revealing uniform monodisperse grains with a distribution of 80% regarding sizes < 250 nm; the resulting crystal phase of synthetized TiO2 was identified as an anatase and rutile phase with a crystallinity size estimated between 27 and 40 nm. Also, the surface area was determined by nitrogen adsorption–desorption using the Brown–Emmet–Teller method, with a surface area calculated as 19.56 m2/g, typical of an IV type isotherm, indicating mesoporous NPs. UV–Vis spectra showed that sol–gel synthesis reduced the band gap from the 3.2 eV common value to 2.22 eV after estimating the optical band gap energy using the adsorption coefficient; this translates to a possible extended photo response to the visible region, improving photoactivity. In addition, the power conversion of the photoelectrode was compared based on similar assembly techniques of TiO2 electrode deposition. Quantum dot crystals were deposited ionically on the electrode surface, as two different paste formulations based on a pectin emulsifier were studied for layer deposition. The results confirm that the TiO2 paste with TiO2-synthesized powder maintained good connections between the nanocrystalline mesoporous grains and the deposited layers, with an efficiency of 1.23% with the transparent paste and 2.27% with the opaque paste. These results suggest that pectin could be used as a low-cost, functional sol–gel catalysis agent for the synthesis of controlled NPs of metal oxide. It demonstrates interesting optical properties, such as an increase in photo response, suggesting further applications to photocatalysts and biomedical features.

1. Introduction

Given the large and growing energy demand worldwide, alternative energy sources are being sought. One of these sources is solar energy because it is natural and renewable [1]. In the north of Mexico City, global horizontal solar radiation from 14 consecutive years was measured at 18.01 MJ/m2 day, which is equivalent to about 5.0 kWh/m2 [2]. This quantity indicates the large amount of possible energy that reaches this surface without being used. However, photovoltaic systems (PVSs) in urban areas are uncommon. [2]. PVSs represent a cost-effective and eco-friendly alternative to electricity users to decrease energy costs and reduce the amount of electricity that is drawn from the grid [3]. With increasing growth worldwide, PVSs are projected to reach 4500 GW by 2050 [4]. Historically, this technology has been divided into three generations, the first being silicon cells, developed in 1954, which currently generate efficiencies of 20% with monocrystalline silicon [5].
The next generation of heterojunctions or multi-junctions reaches efficiencies of 16% [6,7,8], and the third generation is dye-sensitized solar cells (DSSCs), an electrochemical cell based on the union of a semiconductor with a liquid electrolyte using a ruthenium complex [9]. These currently manage up to 12.5% efficiency in standard conditions and are currently a potential competitor [10] in simplifying the manufacture of solar cells. At the electrolyte interface, a reduction and oxidation process occurs where electron donors jump bands, leaving several gaps by favoring the injection of electrons into the conduction band and generating reference electron–hole pairs [11,12]. This electron transfer occurs vector-wise, which benefits the cell’s lifespan [13] because these electrons are absorbed on a nanoscale; therefore, a broader spectrum is excited during the interphase [11], and a nanostructured material is required since it takes advantage of the quantum confinement effect and charge transfer [14] movement between the semiconductor layers. These photoelectrodes or anodes are typically made of nanostructured materials such as titanium oxide, a material abundant on Earth, which is interesting since it is a semiconductor with a wide range of interesting and applicable properties, such as electrical, magnetic, optics, and catalytic properties, caused by different electronic structures in its oxidation states, its symmetrical magnetic behavior, and its acid–base properties [6,15]. It also has high corrosion resistance and a low biological reaction [10,16,17]. This kind of electrode is also a target of interest in most recent research involving photocatalysis, electrochemistry, and remediation. Naturally, TiO2 presents photoactivity in the UV region from 3.0 to 3.3 eV [18] depending on the phase structure. Only pure structures of anatase (space group I41/amd) or a mixture with rutile (space group P42/mnm) [19] are catalytic; otherwise, it needs to be doped or used in conjunction with a complex to increase adsorption. For the replacement of organic dye molecules [20,21] due to their low efficiencies [22,23] or the high costs of chemicals such as ruthenium [10,24], a cost-effective alternative is sensitizing it with quantum dots (QDs). Some of these metal chalcogenide QDs are CdS (cadmium sulfide), CdSe (cadmium selenium), PbS (lead selenium), InAs (indium arsenide), etc. [25,26]. Another approach to improve light harvesting and energy conversion is the manipulation of nanostructured materials [27]; furthermore, these electrodes can be manufactured without using high-tech equipment and with low-cost materials, following the tendency of finding sustainable ways of advancing this technology. Metal oxides synthesized with plant extracts should be further investigated as metal NPs [28]. Although the approach is similar, some reports such as Rajendhiran et al. suggest using prickly pear (opuntia) extract as a reducing agent with a predominate size of ~300 nm [22]; Fall et al. report the use of natural extracts of citrus sinensis with a 3–96 nm size range of the anisotropic material [18]; the group of Miu et al. synthetized TiO2 on Camellia Shensis, addressing the difficulty of obtaining reproducible green TiO2 NPs due the variability in the green extract, as apparently, the phytocompound is negatively influenced in the formation of a crystalline structure [29]. Kashale et al. report TiO2 NPs in a ~14 nm size range made of Bengal gram bean extract [30]. In reports on the use of pectin [31], it is commonly mentioned that this macromolecule composed of arabinan and galactic side chains can reduce metallics due to its aldehyde groups [28,31].
A typical photoelectrode is composed of (i) conductive glass, (ii) nanostructured semiconductor layers, (iii) polysulfide electrolytes, and (iv) a contra electrode [10,24]. The use of paste for screen printing is the easiest way to achieve semiconductor deposition; this deposit corresponds to three layers of TiO2: a first layer of compact TiO2, a second layer of transparent TiO2 paste, and a third layer of opaque (scattering layer) TiO2 paste.
The standard components of TiO2 paste are TiO2 nanoparticles, a solvent (e.g., terpineol), and a binder (e.g., ethyl cellulose) [7,32,33,34,35,36,37,38]. It is believed that this arrangement prevents short circuits during the transport of charge through metallic counter electrodes. It has also been indicated that this determines a cell’s electronic properties [32]. A cell’s interface with electrolytes influences the way energy levels are reduced; an electron infiltrates its mesoporous network, effectively reaching the conductive glass and, thus, moving. This results in a circuit with a counter electrode. A quantum dot is readjusted and restored while the hole is filled with an electron when it is reduced by that electron [5]. The adhesion of paste to conductive glass influences the success of charge generation and transport. Photoelectrode materials must also be homogeneous and nanostructured, as they must have a greater surface area with larger spaces for crystals with quantum dots to be deposited [12,39,40]. The method used for this deposition is called the successive ionic layer adsorption and reaction (SILAR) method [41], which is a simple and scalable method for the in situ growth of quantum dot nanocrystals [7]. In this work, we propose pectin as a replacement for the acid catalyst on an environmentally benign synthetic route with a low cost for metal oxide nanoparticles. A semiconductor paste for photoelectrodes in the semiconductor deposition layers was prepared using the doctor blade technique, and the SILAR method was used to sensitize the photoelectrodes. Then, we assembled a photosensitive cell, and the power conversion efficiency was measured with a solar simulator to obtain the Jsc–Voc curves. The nanostructured TiO2 material was characterized via XRD, UV–Vis, BET, and SEM to assess the morphology, phase crystallinity, surface area, and adsorption coefficient.

2. Results and Discussion

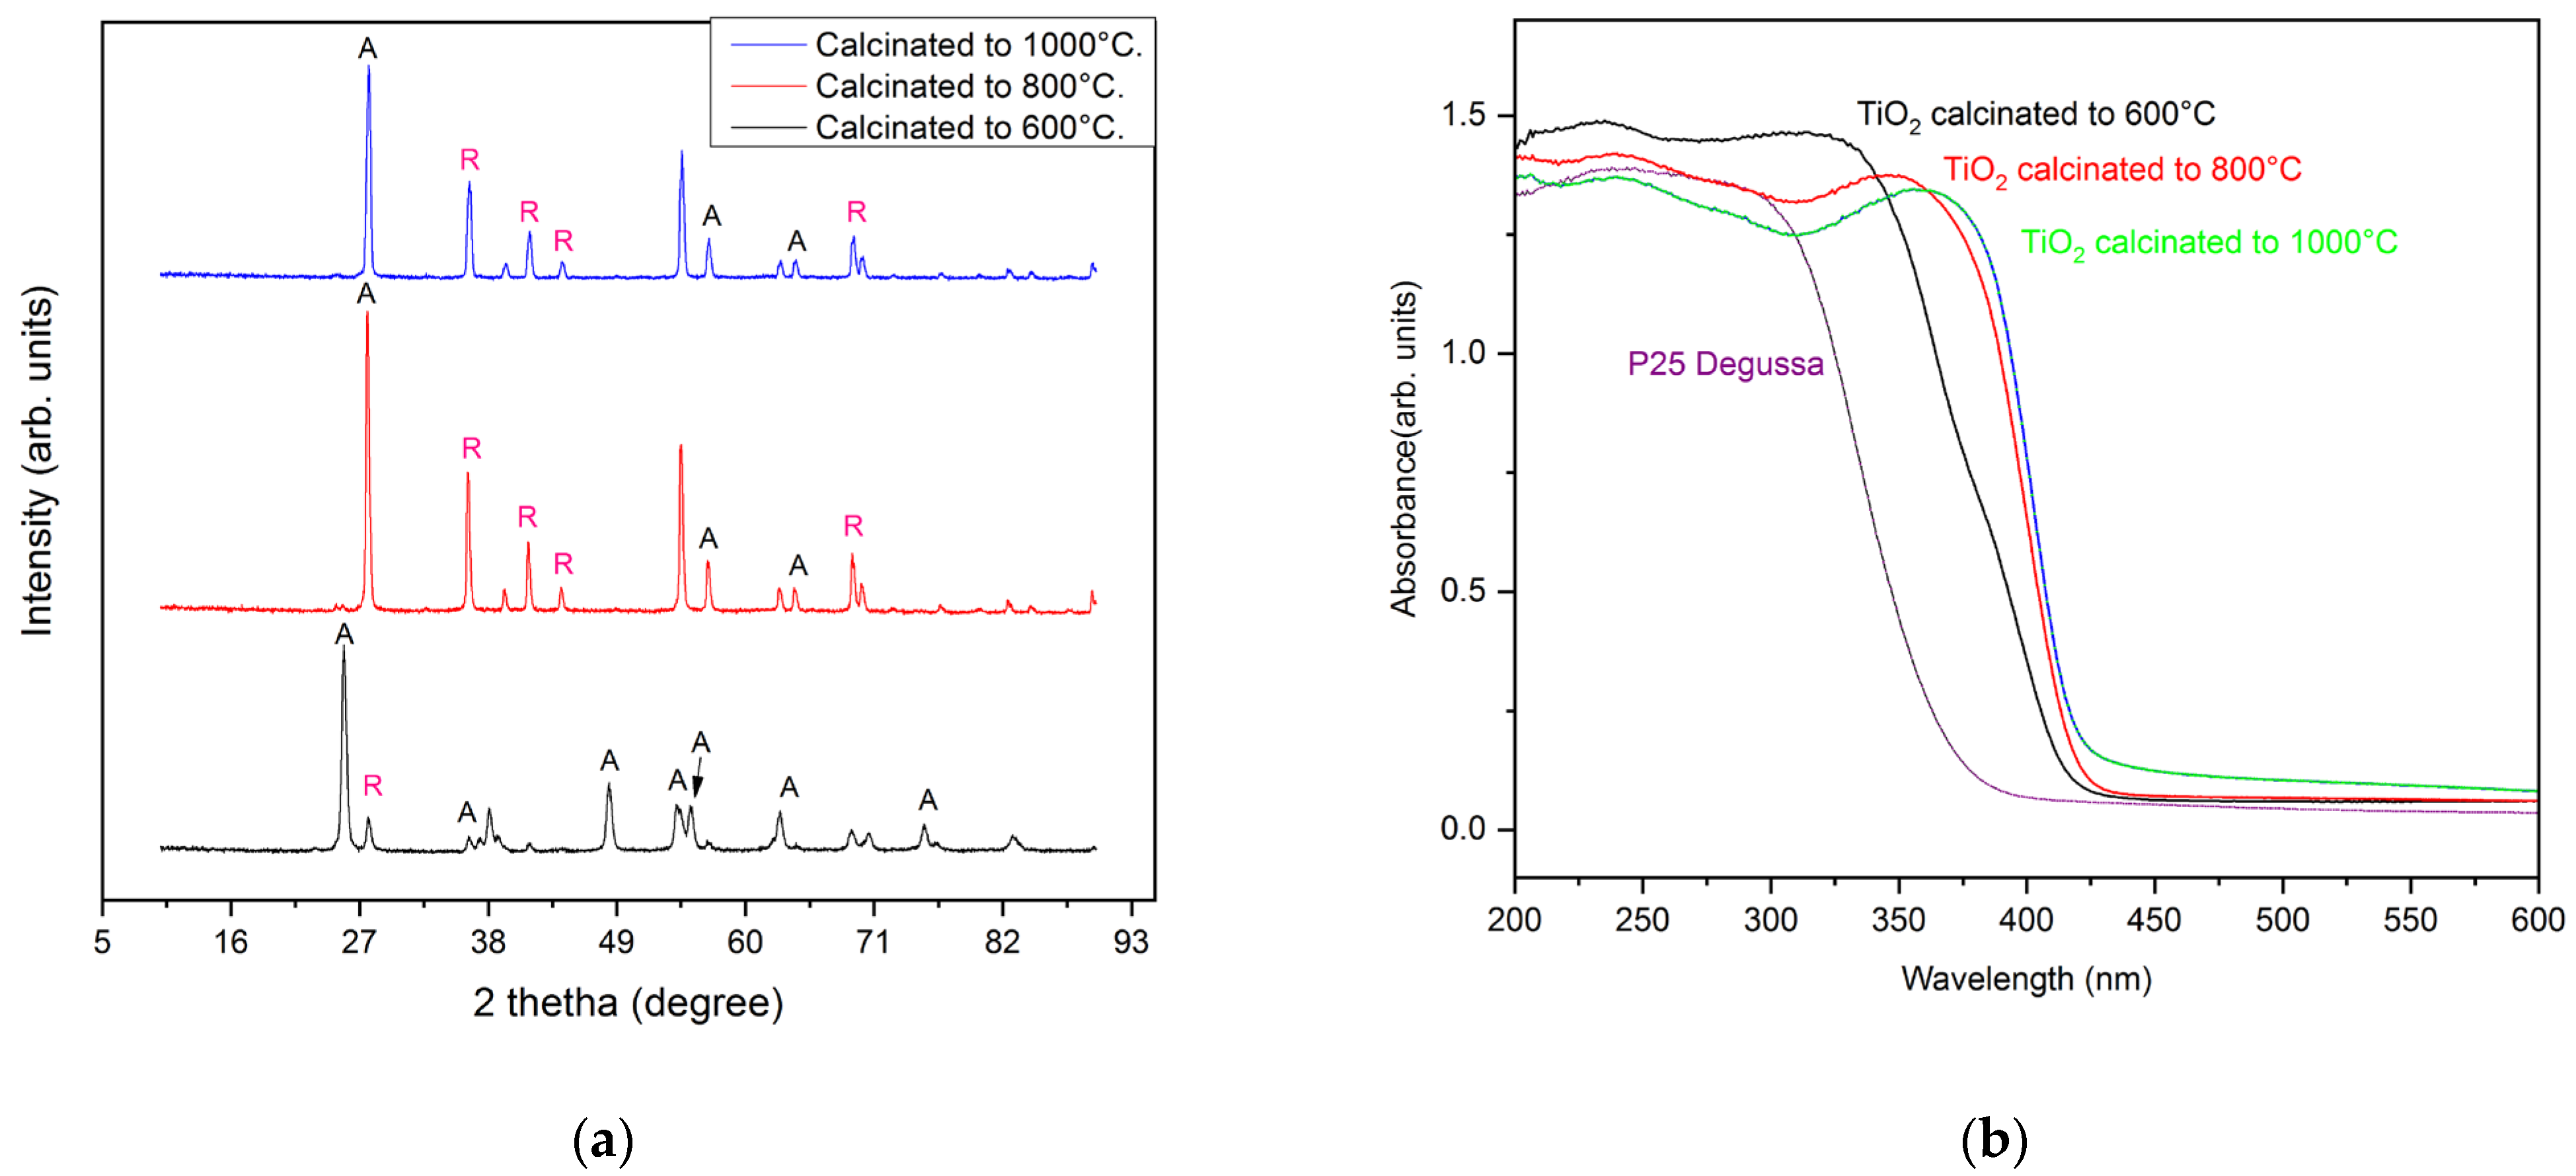
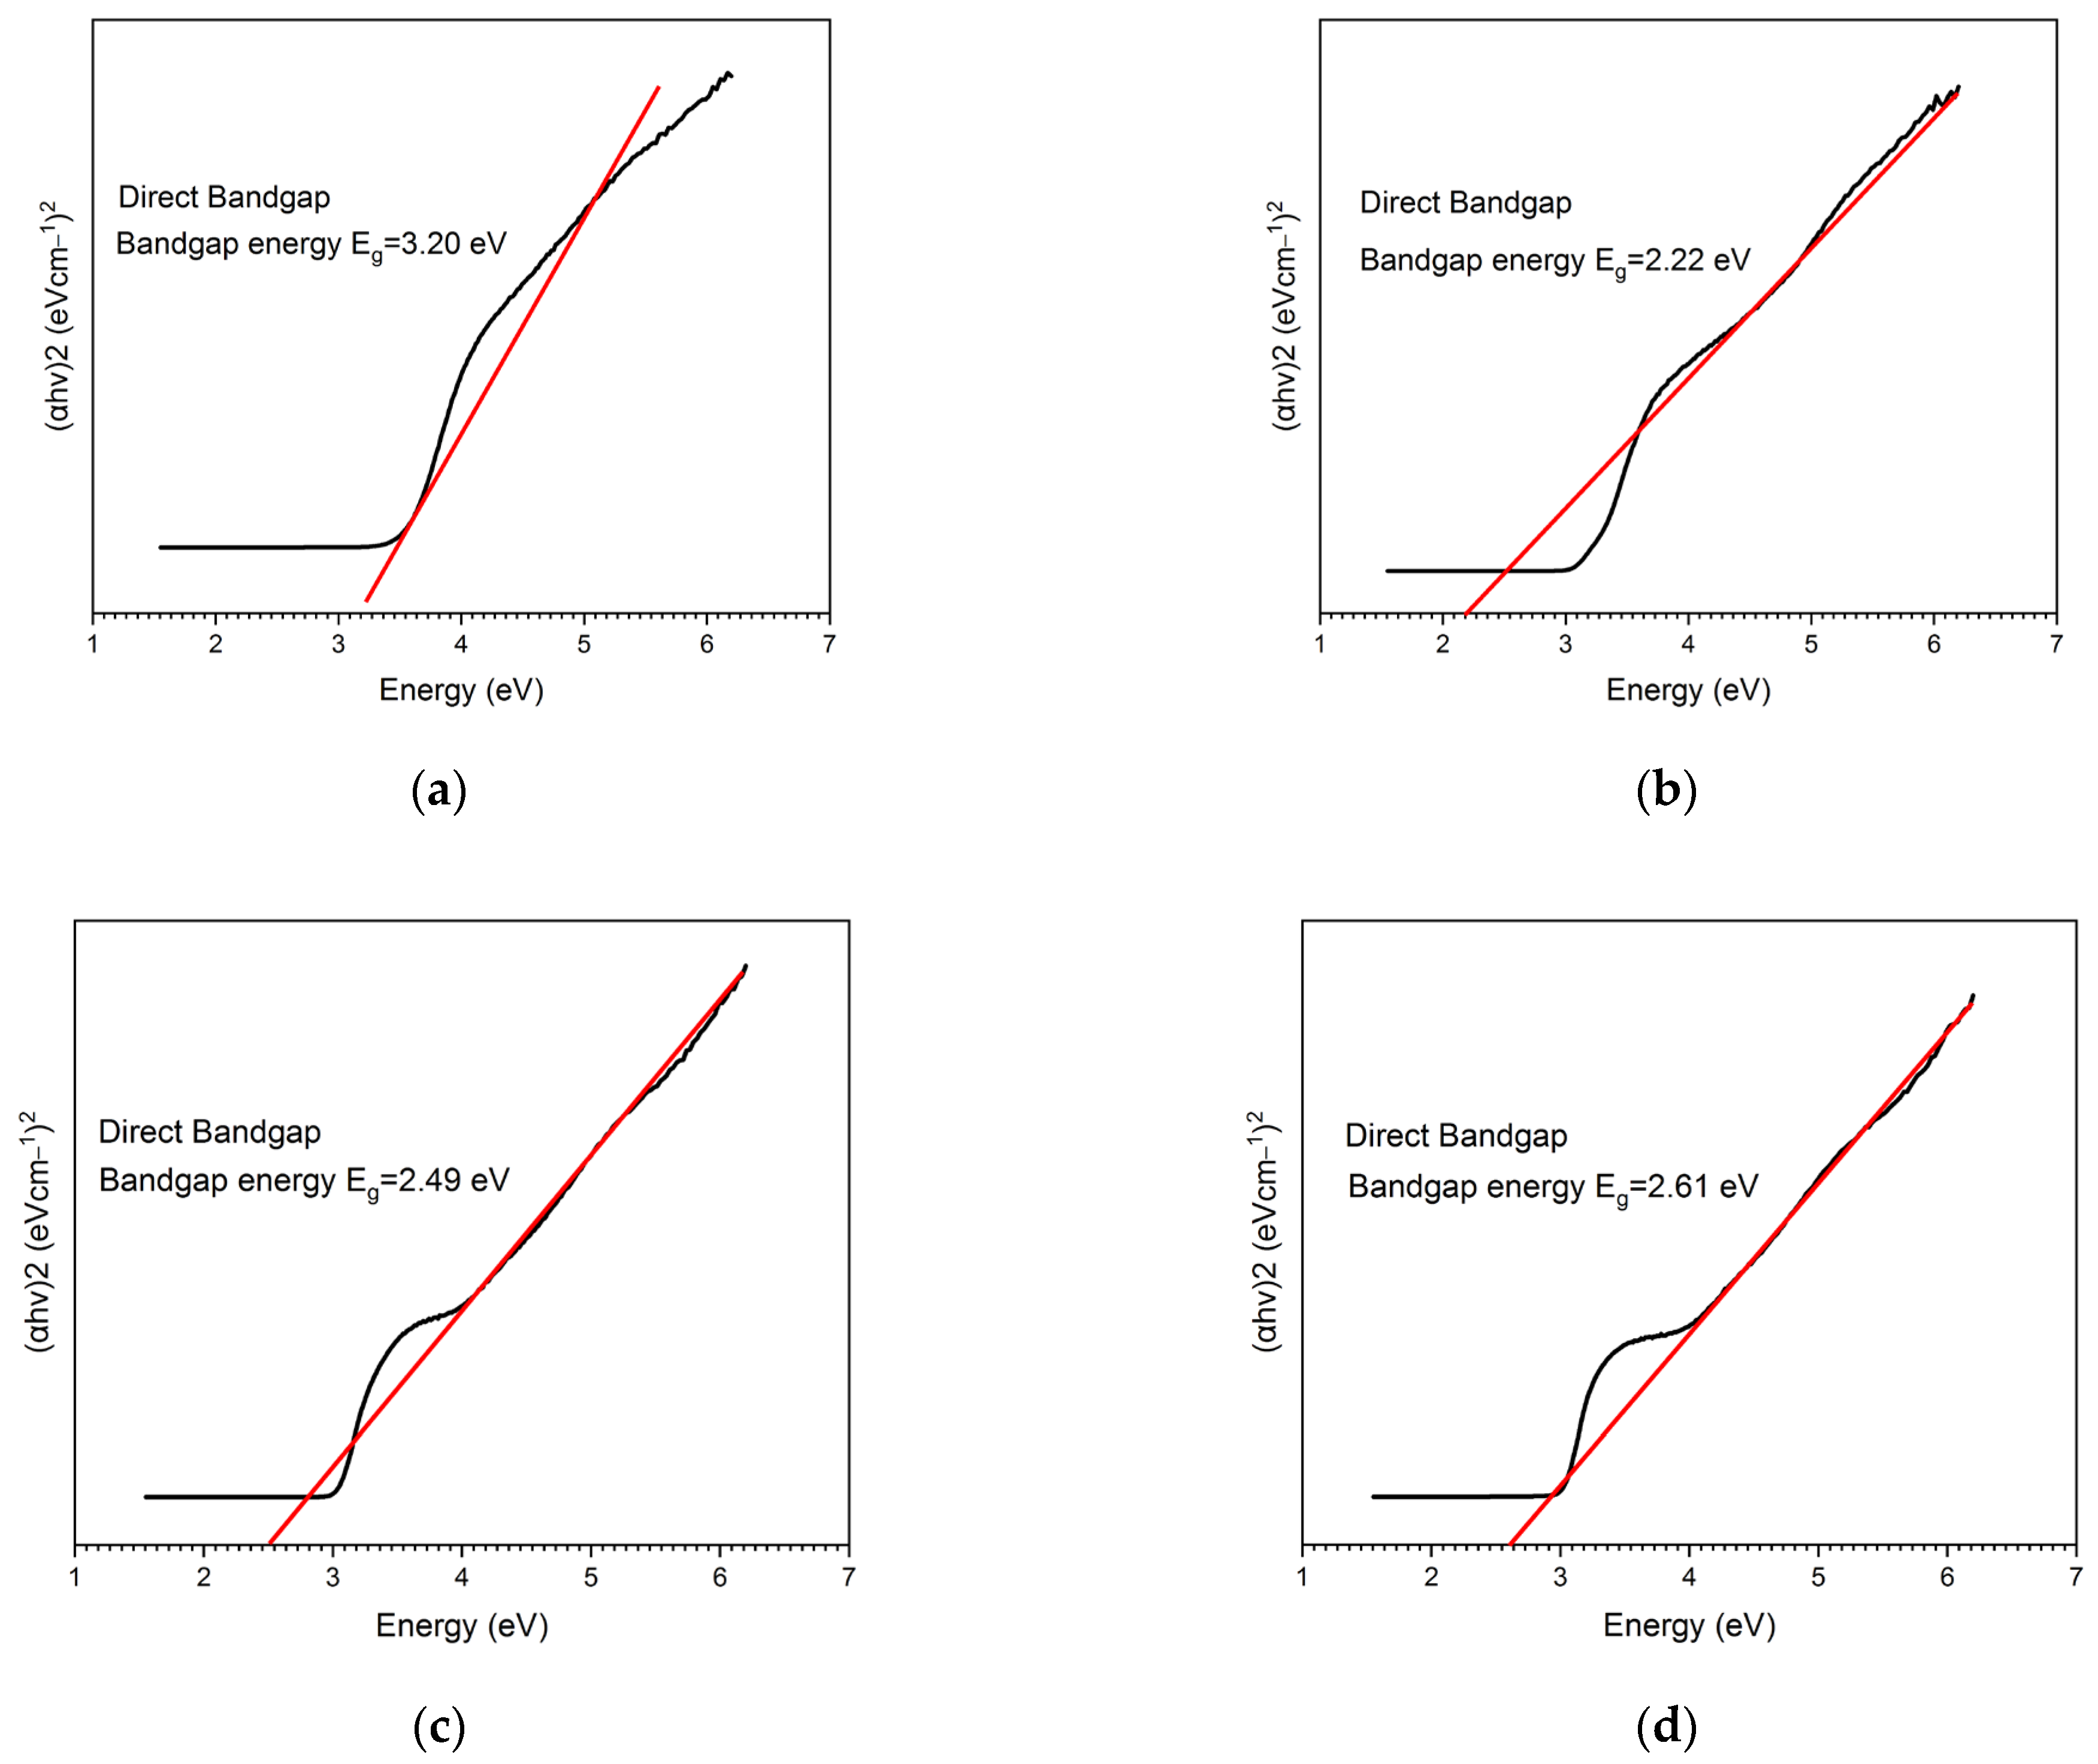
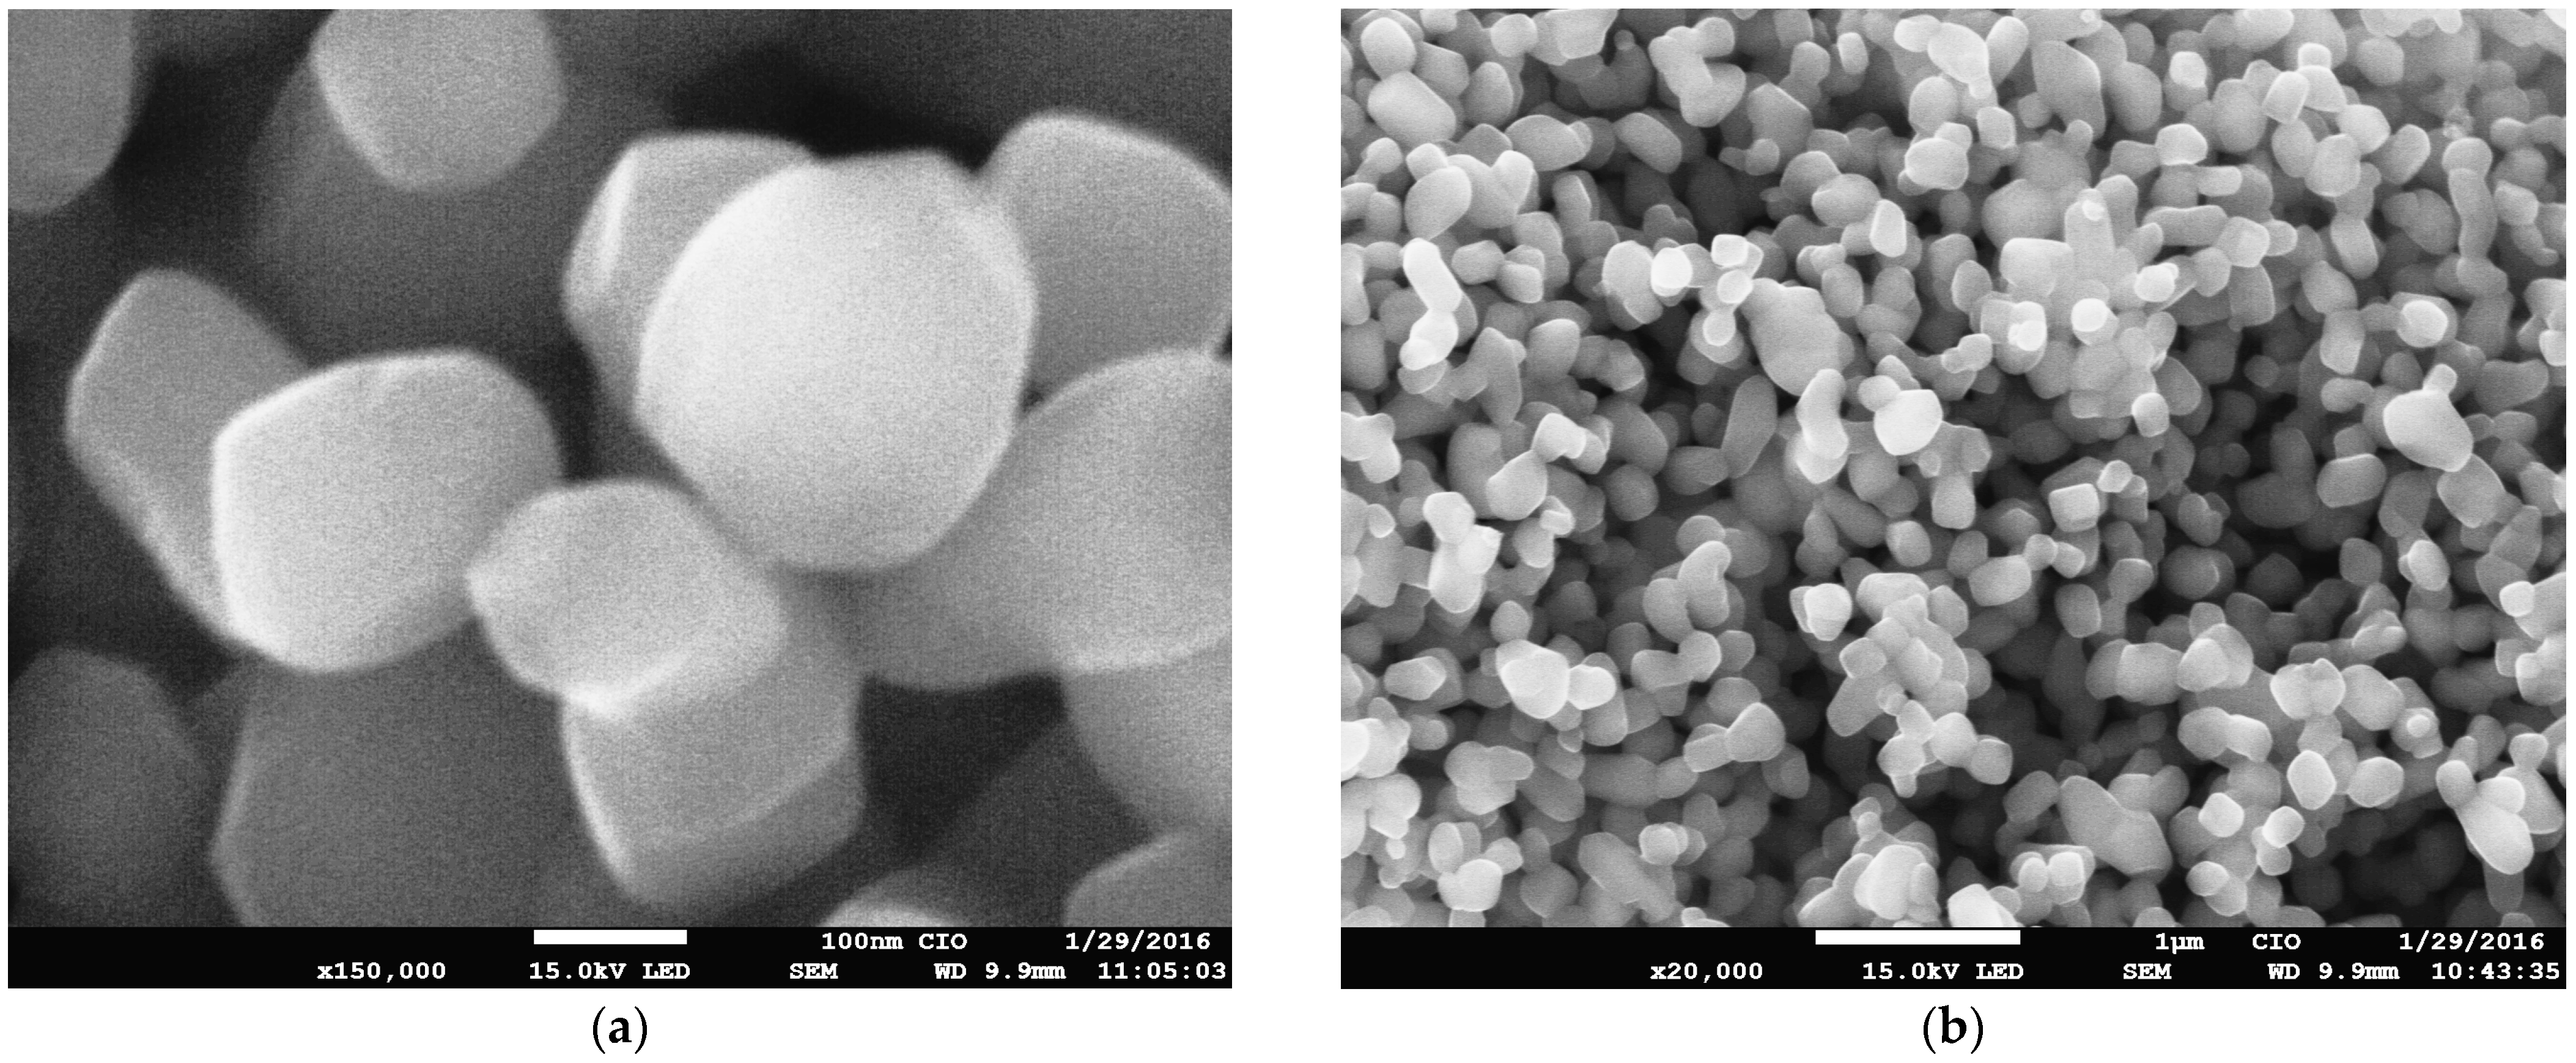
2.1. Characterization of the Sol–Gel Synthesis of TiO2 with Pectin

We compared the materials according to the angles identified by the authors of [23,42,43] via X-ray diffraction, confirming the anatase phase at a distinct peak (2θ) at 25°, 37°, 48°, 54°, 55°, 62°, 71°, and 75°, which corresponded to diffraction from crystal planes (101), (103), (200), (105), (211), (204), (220), and (215). A rutile phase was confirmed at 27°, 36°, 41°, 49°, and 57°, which corresponded to diffraction from crystal planes (110), (101), (111), (210), and (220). These results suggest that the reduction with pectin stabilized the structure of the titanium oxide in its anatase and rutile phases, indicating that the calcination temperature influenced the crystallinity of the phase fraction. Figure 1a shows the synthesis of TiO2 in pectin calcined at different temperatures. The fitting of the results of the analysis revealed the phase crystallinity of the synthesized NPs. For pectin at 600 °C (bottom black graph), the crystallinity of the material was 73.5%, and according to the estimation, the size of the particles was around 27 nm. However, with the same method at 800 °C, the crystallinity of the material was 74.76%; according to the estimation, the size of the particles was around 40 nm. At 1000 °C, there was 64.30% crystallinity, and the size of the particles was 29 nm. This showed that there was an increase in the rutile phase in accordance with calcination temperatures greater than 700 °C. Similar results were reported by Fall et al. [44], who found an increase in the rutile phase after a pure anatase experimental result with calcination temperatures of >700 °C [18], implying that drastic sintering of the material could increase abrupt crystal growth. Additionally, the synthesized TiO2 presented central stability in the subsequent sintering process because of the phase purity [45]. Another consideration was the estimation of the average size of the crystallite using de Scherrer’s formula; the TiO2 varied from approximately 27 to 40 nm depending on the calcination temperature. The calculated values agreed with the values reported by other authors [46]. TiO2 demonstrated absorbance at the non-visible light level of 380 nm, which was in the UV region, unlike the absorption of the TiO2 synthesized with pectin as a reducer. Kashale et al. suggested that pectin remains present with titanium oxide as a composite, helping maintain a uniform size distribution even after calcination at 500 °C [30]. Figure 1b shows a notable difference, evidencing a slight redshift at almost 404 nm, which was closer to the visible region, covering a range from 380 to 400 nm. This behavior was present in all sol–gel syntheses of TiO2 with pectin at different calcination temperatures [47,48]. This alteration of the adsorption coefficient and photoactivity response of green synthetized TiO2 NPs was also reported in other works, such as [22,29]. It was concluded in both cases that a defined crystalline structure was not generated with the green synthesis. The development of defined nanostructured crystal phases ensures appropriate chemical functionalities at the surface, with anatase being more stable at the nanoscale [23].
Optical adsorption measurements provide an accurate estimation of the optical band gap; Alsaal et al. mentioned that the wavelength has a coefficient spectrum associated with the energetic regions excited in lower and higher states, so an increase in the value of the adsorption coefficient probably occurs when there is a decrease in band transitions [49]. As Juvu et al. [50] discussed, this calculation is an estimation because semiconductors usually possess band transitions, so a direct application of Tauc can lead to erroneous estimates of the band gap. It is probably more accurate to take measurements below the scale if this starts from negative values to achieve a slightly more correct bandgap estimation. As observed in Figure 2, the bandgap was theoretically calculated with a linear fit of the Tauc plot for the sol–gel synthesis of TiO2 with pectin at 600 °C (2.22 eV), 800 °C (2.49 eV), and 1000 °C (2.61 eV) and for P25 Degussa with 3.20 eV. This difference in the band gap between the green-synthesized TiO2 NPs was also found in previous reports with 2.91 eV [22] and 2.71 eV [29].
The surface area was determined via nitrogen adsorption/desorption using the Brunauer–Emmett–Teller (BET) method [51]. The type IV isotherm was displayed with a pressure (P/Po) ranging from 0.5 to 0.9, as observed in Figure 3a. Typically, a hysteresis loop with this adjustment indicates a mesoporous material, which is attributed to the release of carbon dioxide during the calcination of organic biomolecules that disperse a metal oxide [22,30], thus causing the remaining alkoxyl groups of the pectin to have a uniform size distribution and surface area. According to surface theory, this is divided into an external surface, which is defined as the surface outside the pores, and an internal surface, which is the surface of all of the pore walls [51]. The calculated surface area was 19.56 m2/g, with an average pore volume of 0.13904 cm3/g and a pore radius of 4.49 nm. These results are consistent with what was reported by [30]: 4.29 nm and 0.2372 cm3/g, respectively. Because the pores had widths greater than 2 nm, the material was defined as mesoporous [51]. In Figure 3b, the distribution count of the sol–gel synthesis of TiO2 with pectin NPs can be observed; most of these were below 300 nm, and 80% of the distribution contained sizes within the range of 120 to 248 nm, which was optimal as an opaque mesoporous paste [33,34].
It was verified that the morphological structure of the nanostructured mesoporous material obtained from the sol–gel synthesis of TiO2 with pectin was similar to that obtained through traditional hydrothermal synthesis. Figure 4a confirms that the TiO2 NPs had a uniform size distribution in small aggregate groups even after calcination; this was a result of the use of pectin as a reducing agent for the synthesis of uniform titanium dioxides. Although the NPs formed were not complete nanospheres, they were conveniently structured and dispersed, and presented a crystalline phase, unlike in previous reports, which indicated that plant extracts such as epigallocatechin-3-gallate (EGCG) from green tea (Camellia sinensis) did not influence the crystalline phase in TiO2 synthesis [29], and reported that the rate of reduction in extract concentration was influenced by the TiO2 precursor and influenced the size of NPs [22], as well as demonstrating that anisotropy and aggregations of NPs were detected although there were crystalline phases [18]. In Figure 4b, the sizes are easily distinguishable, and the particles are uniform. It was mentioned in other reports that the synthesized materials created an efficient way to shorten diffusion paths and improve charge transport in interphase cells in contrast to commercial products [45]. Furthermore, the size and shape of the nanospheres commonly found in reports on green synthesis [28] showed greater stability when generated in sol–gel media [12,16,30]. As sol–gel synthesis is a simple method for minimizing the complexity of the hydrolysis of precursors and for the stabilization of the tuning morphology, this synthetic route is also a good replacement for hazardous reagents using acidic catalysts, as it provides a low environmental impact through the preparation and application of TiO2, since the hydrothermal method continues to be the current trend for the preparation of nanostructured metal oxide phases [23]. Additionally, it has been reported that adding organic chains [22,28,30] such as pectin could increase the porous surface, thus providing viability to the process of obtaining an anatase mesoporous phase, which is desirable as a crystalline phase with sizes greater than 100 nm. This is ideal for an opaque scattering paste [52], and highly porous electron collectors of QD crystals can be attached to sensitize photoelectrodes [53,54].
We mentioned before that the paste deposit corresponded to three TiO2 layers: a first layer of compact TiO2; a second layer of transparent TiO2 paste (initially, this layer needs to be approximately 10–14 μm); and a third layer of opaque (scattering layer) TiO2 paste with a thickness of 4–5 μm and ideal anatase-phase particles [34,35]. This is because the most stable crystalline phase for chemical functionalities on the interface of solid-state diffusion through photoelectrode layers is anatase. The influence of the thickness of the semiconductor layers is attributed to the fill factor (FF%) and hole transport, which translates into efficiency [49]. It has been reported that the optimal thickness is three layers of semiconductor material [27,34,35,55]; below and above this number, the loss of injected electrons was detected during photoconversion. Figure 5a shows the surface of the electrode from above; in Figure 5b, a transverse section shows the arrangement of the layers and their average thicknesses measured using SEM. On the surface of the final opaque layer, there was no complete adhesion, demonstrating the difficulty of finding ideal viscosity conditions for the deposit, although this can also be attributed to the cutting process of the assembly photoelectrode with the films already deposited.

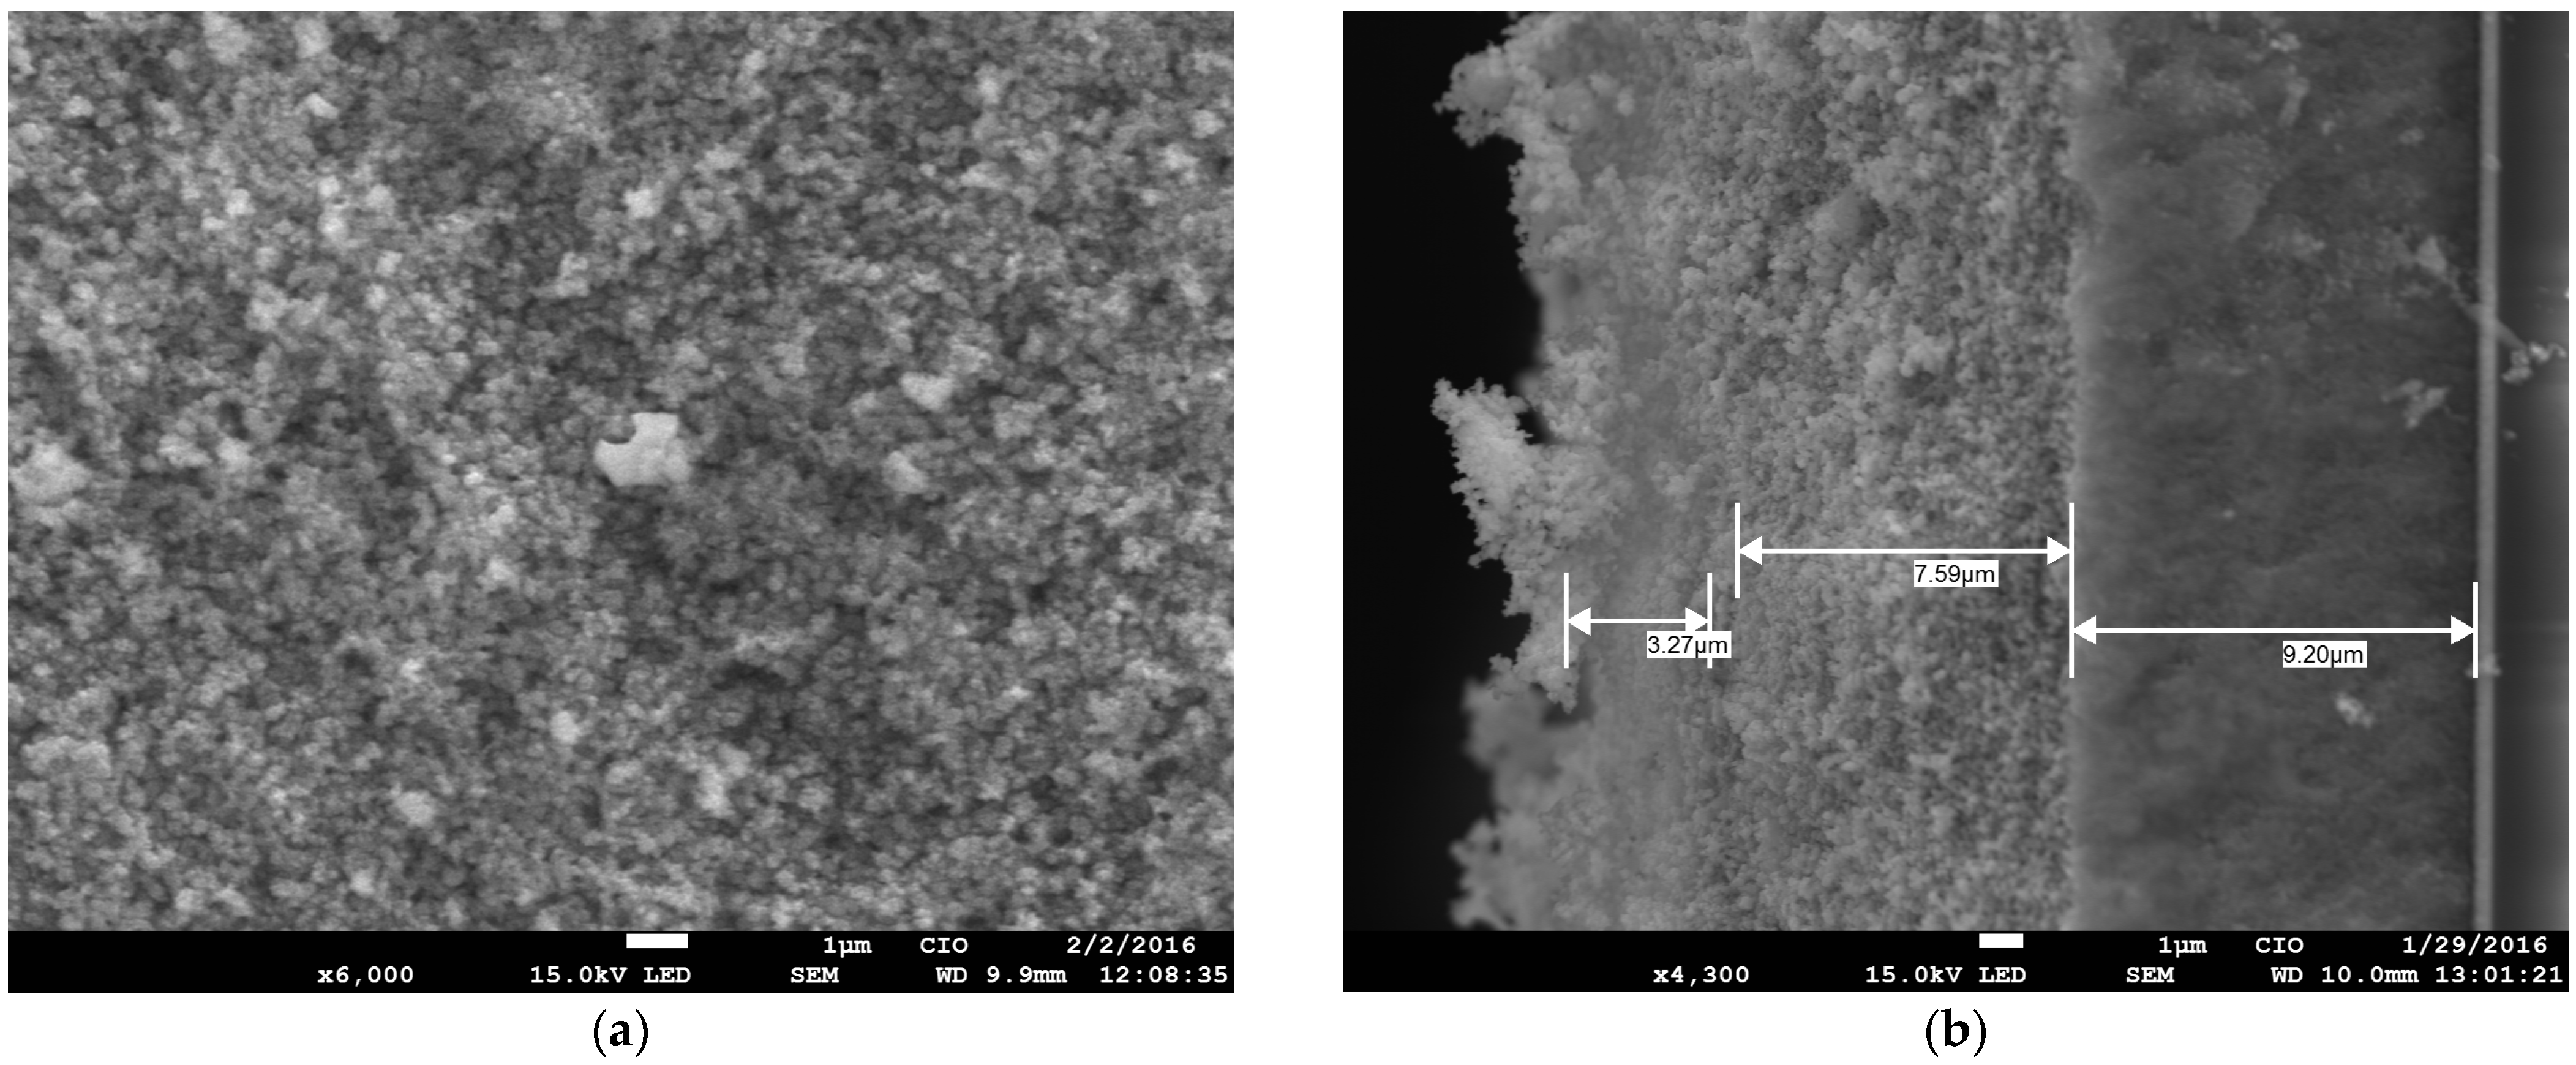
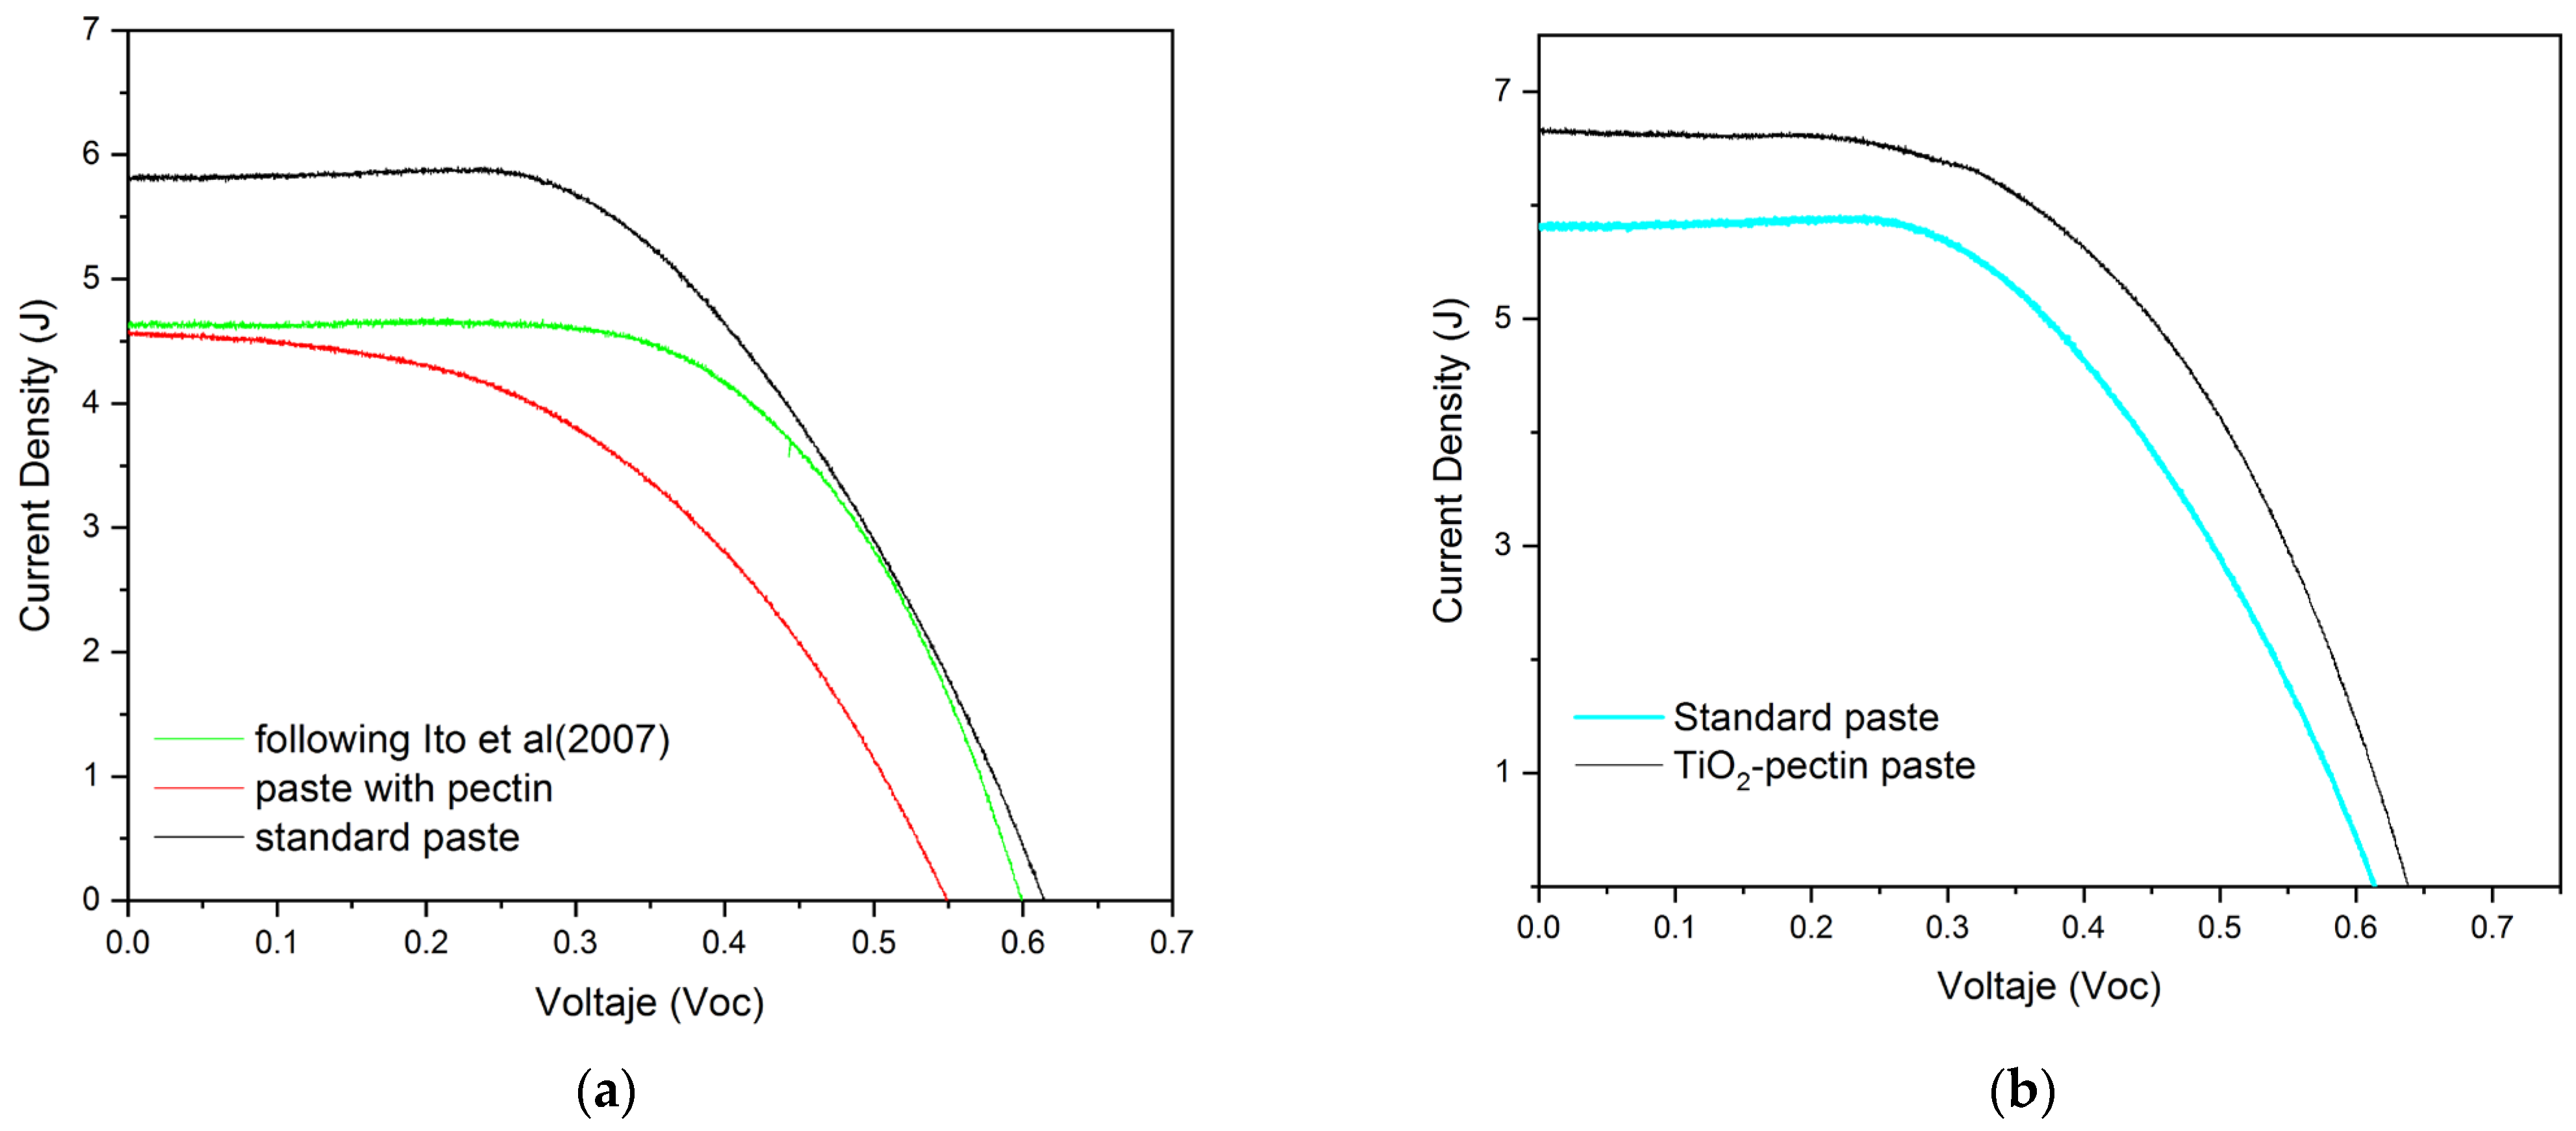
Characterization of the Performance of a DSSC Cell with the Pectin-Based Paste

In a simulator, the voltage difference between a working electrode and a reference electrode was measured. Five repetitions or measurements were carried out for each sample, and each measurement was compared with a blank (the standard reference paste formulation). Figure 6a shows that pectin was viable as a binder in place of ethylcellulose in the transparent paste formulation [34,35]. In fact, we believe that this is the first report of pectin as an emulsifier and that the apparent porosities generated by this chain within the paste after the sintering function efficiently generated and retained QDs and electrolyte diffusion. Additionally, Figure 6b confirms that the sol–gel synthesis of TiO2 with pectin generated a viable material with optical characteristics for the current generation of solar cells used as photoelectrodes. Other reports of TiO2 synthesized with green methods reported similar efficiency, with a maximum of Ƞ = 1.4 in organic dyes [22]. Traditional sol–gel photoelectrode fabrication with TiO2 using sprayed pyrolysis layers resulted in an efficiency of Ƞ = 2.44, and TiO2 made through hydrothermal synthesis had an efficiency of Ƞ = 3.94; these results are notable.
We explored the development of the photoconversion efficiency, as shown in Table 1, proving that it is possible to propose alternative eco-friendly synthetic routes and alternative components that could increase photoconversion efficiency [53] with the manipulation of the nanostructured material to improve light harvesting in electrode semiconductor devices [49]. We can also recall that photoelectrodes with multiple layers of TiO2 facilitate the percolation of charge in nanostructured networks due to the correct diffusion through the roughness and greater dispersion centers with electrolyte and QD nanocrystals [6,34]. This possibility indicates the conversion of more photons into current, as it covers most of the visible spectrum, leading to higher efficiency during device formation [22]. We can attribute this to a good contact surface ratio of the deposition paste.

3. Conclusions

With the proposed sol–gel synthesis of TiO2 with pectin as a reducing agent, NPs were obtained via a low-cost, environmentally friendly method that provides an alternative to hazardous reagents in traditional complex synthesis. XRD patterns confirmed that NPs were obtained in the anatase crystalline phase with a mix of the rutile phase at calcination temperatures greater than 700 °C; at 600 °C, the crystalline phase comprised 73.53%, with a mean size of 27 nm. The BET method indicated that this was a mesoporous material with a surface area calculated as 19.56 m2/g. NPs were obtained as the result of a uniform size stabilization promoted by diluted pectin as a reducing agent, which limited the size distribution and surface area according to the biomolecule chains present in the sol–gel synthesis. According to the adsorption coefficient, the direct band gap estimation of the synthesized NPs decreased from the standard value of 3.2 eV to 2.2 eV; this difference suggested an alteration in the photoactivity with extended photo-response conversion or increased light harvesting. We concluded that this displacement was beneficial to the cell’s optical properties and material performance. In combination with a paste formulation for TiO2 layers, we fabricated DSSC using the TiO2 synthesized with pectin. The last scattering layer had the main function of collecting sensitized QDs on a highly porous substrate to promote optimal hole–pair recombination on the photoelectrode interphase. Our QDSSC exhibited power conversion efficiency at (2.27) with an FF of 54.7%. These values correspond to the maximum efficiencies due to low series resistance. Additionally, when we formulated the paste, pectin was also used as a binder; its combination with TiO2 synthesized with pectin suggested that further interaction with the polymeric chain occurred during the reduction process and that oxygen dissolved during the proposed synthesis. This was essentially a positive result for the proposed green synthesis using pectin, as it promoted spaces between the TiO2 layers after sintering. These findings suggest that this is an innovative and reproducible approach to the synthesis of TiO2 with uniform morphology and size and with a narrow band gap and interesting photo-response, making it interesting for wider applications. Additionally, these photoelectrode layers need to be tested with other methods, such as dyes, to analyze the proposed synthesis of TiO2 as a semiconductor electrode. It is also essential for the efficiency that paste deposition is improved for both transparent and opaque pastes; thus, with improvements in the design of these materials, very promising results can be achieved.

4. Materials and Methods

4.1. Chemicals and Reagents

Titanium (IV) isopropoxide (97%), acetylacetone (>99%), sodium hydroxide (NaOH), pectin from citrus peels (74.0 (dried basis)), titanium (IV) oxide nanopowder, P25 with a primary particle size of 21 nm (TEM) (99.5% trace metal basis), α-Terpineol (96% mixture of isomers), cadmium acetate dehydrate (Cd(CH3COO)2.2H2O), sodium sulfide (Na2S 99%), zinc acetate dihydrate (Zn(CH3COO)2.2H2O), and ethyl cellulose (48% ethoxyl, viscosity 10 cP) were acquired from Sigma-Aldrich (Sofia, Bulgaria). Sodium sulfide (Na2S.9H2O) and sulfur (S) were acquired from KARAL. Fluorine-doped tin oxide (FTO) conductive glass was obtained from MTI (TEC-15). Distilled water (DW) and ethanol (E) were also used for dilution.

4.2. Sol–Gel Synthesis of TiO2 with Pectin

First, 2 g of pectin was placed in 20 mL of DW while stirring at 100 °C. In a beaker, 100 mL of DW was added to dissolve 11.5 mL of titanium (IV) isopropoxide. Afterward, the previously diluted pectin was added with a controlled drip for 10 min. It was stirred for 3 h, washed three times with E and once with DW in a centrifuge for 5 min at 3700 rpm, and dried at 80 °C for 24 h. This was followed by high-temperature treatments at 600 °C, 800 °C, and 1000 °C for 6 h, resulting in TiO2 NPs, which were collected and stored.

4.3. Formulation of the Pectin-Based Paste

The paste was formulated with our proposed modification of the method by Ito [33], which was adapted to our lab conditions. First, 1.5 g of TiO2 synthesized with pectin or P25 Degussa was added to a mortar; then, 1 mL of acetic acid was added and mixed for 5 min, 250 µL of DW was added 20 times, mixing for 1 min each time, and 750 µL of DW was added six times, mixing for 1 min each time. Then, 50 mL of DW was added to the mortar and mixed for 1 min. This mix was sonicated for 1 min, and 5.6 mL of alpha-terpineol (α-Terpineol) was added (to increase shelf life [27]) and sonicated for another 1 min. Then, 5 mL of pectin solution was added and stirred for 1 min (as a binder for tuning the paste viscosity and then porosity, leaving vacancies after sintering [27]), and a rotary evaporator was used for 1 h to obtain the TiO2 paste. The paste formulations followed the same route; only the TiO2 powder component was different in the transparent TiO2 paste (made with P25 with a typical particle size of 20 nm) and the scattering or opaque paste (made with the sol–gel synthesis of TiO2 with pectin NPs with a typical particle size of 200 nm).

4.4. Fabrication of Photoelectrode Using Pectin Synthesized TiO2 NPs

FTO conductive glasses were washed with isopropanol acetone and DW. Afterward, the first layer of compact TiO2 was deposited via spray pyrolysis over the FTO glass, and a solution of 9 g of titanium (IV) isopropoxide (at 0.2 M) with acetylacetone/ethanol (1:1) was used to create a size of 200 +/− 5 nm; this was followed by sintering for 30 min at 450 °C. Then, the doctor blade coating method was used for subsequent layers of the transparent (P25 TiO2) and opaque (pectin-synthesized TiO2 NPSs) paste to control the thickness at 6 mm, and Scotch tape was fixed on the FTO glasses. Finally, the layers were sintered for 30 min at 450 °C to achieve good electrical contact between the NPs and to evaporate the organic solvents [56,57].

4.4.1. Sensitization with Quantum Dots

The SILAR method was used to sensitize the photoelectrode, and the CdS (core) and ZnS (shell) were deposited to enhance the photovoltaic performance; a single cycle consisted of 1 min of dip-coating in 0.05 M Cd ((CH3COO)2.2H2O) for the Cd2+ source and 0.05 M Na2S for the S2− source. Both precursors were dissolved with ethanol and methanol/water (ratio: 1/4; 1:1). During the successive dipping steps, the electrodes were systematically cleaned by submerging them in the corresponding solvents (ethanol and methanol/water) to eliminate excess precursor content. The SILAR method was performed for seven cycles to obtain a constant photoelectrode coverage with CdS QDs. To reduce the recombination of electrons in the TiO2 layers with the polysulfide electrolytes [45,46] and to enhance the photovoltaic performance, a second SILAR procedure with 0.1 M Zn ((CH3COO)2.2H2O) for the Zn2+ source and 0.1 M Na2S for the S2− source was deposited for a 1 min dip in two cycles. ZnS is a popular photoelectrode coating material for preventing interfacial recombination, as it is a semiconductor with a wide band gap of 3.6 eV [24,37].

4.4.2. Fabrication of Counter Electrode

A counter electrode needs to meet some requirements, such as being highly electrocatalytic, catalyzing reduction on polysulfide species, being compatible, not dissolving in polysulfide electrolyte, undergoing photodecomposition, functioning in the range of 4.3–5.3 eV, being a good electron conductor, being inexpensive, and being nontoxic [24]. In terms of these parameters, the Cu2S counter electrodes yielded high performance with QDs only below the nanostructured fabrication of the carbon and platinum layer [9,24,34,35]. Cu2S counter electrodes were constructed by immersing brass foil in HCl solution (38%) for 1 h at 90 °C; then, they were immersed in polysulfide electrolyte for 1 min until the etched portion turned black, indicating the formation of cuprous sulfide. This is an established protocol for growing a Cu2S layer from a brass substrate while using low-cost components and a facile process.

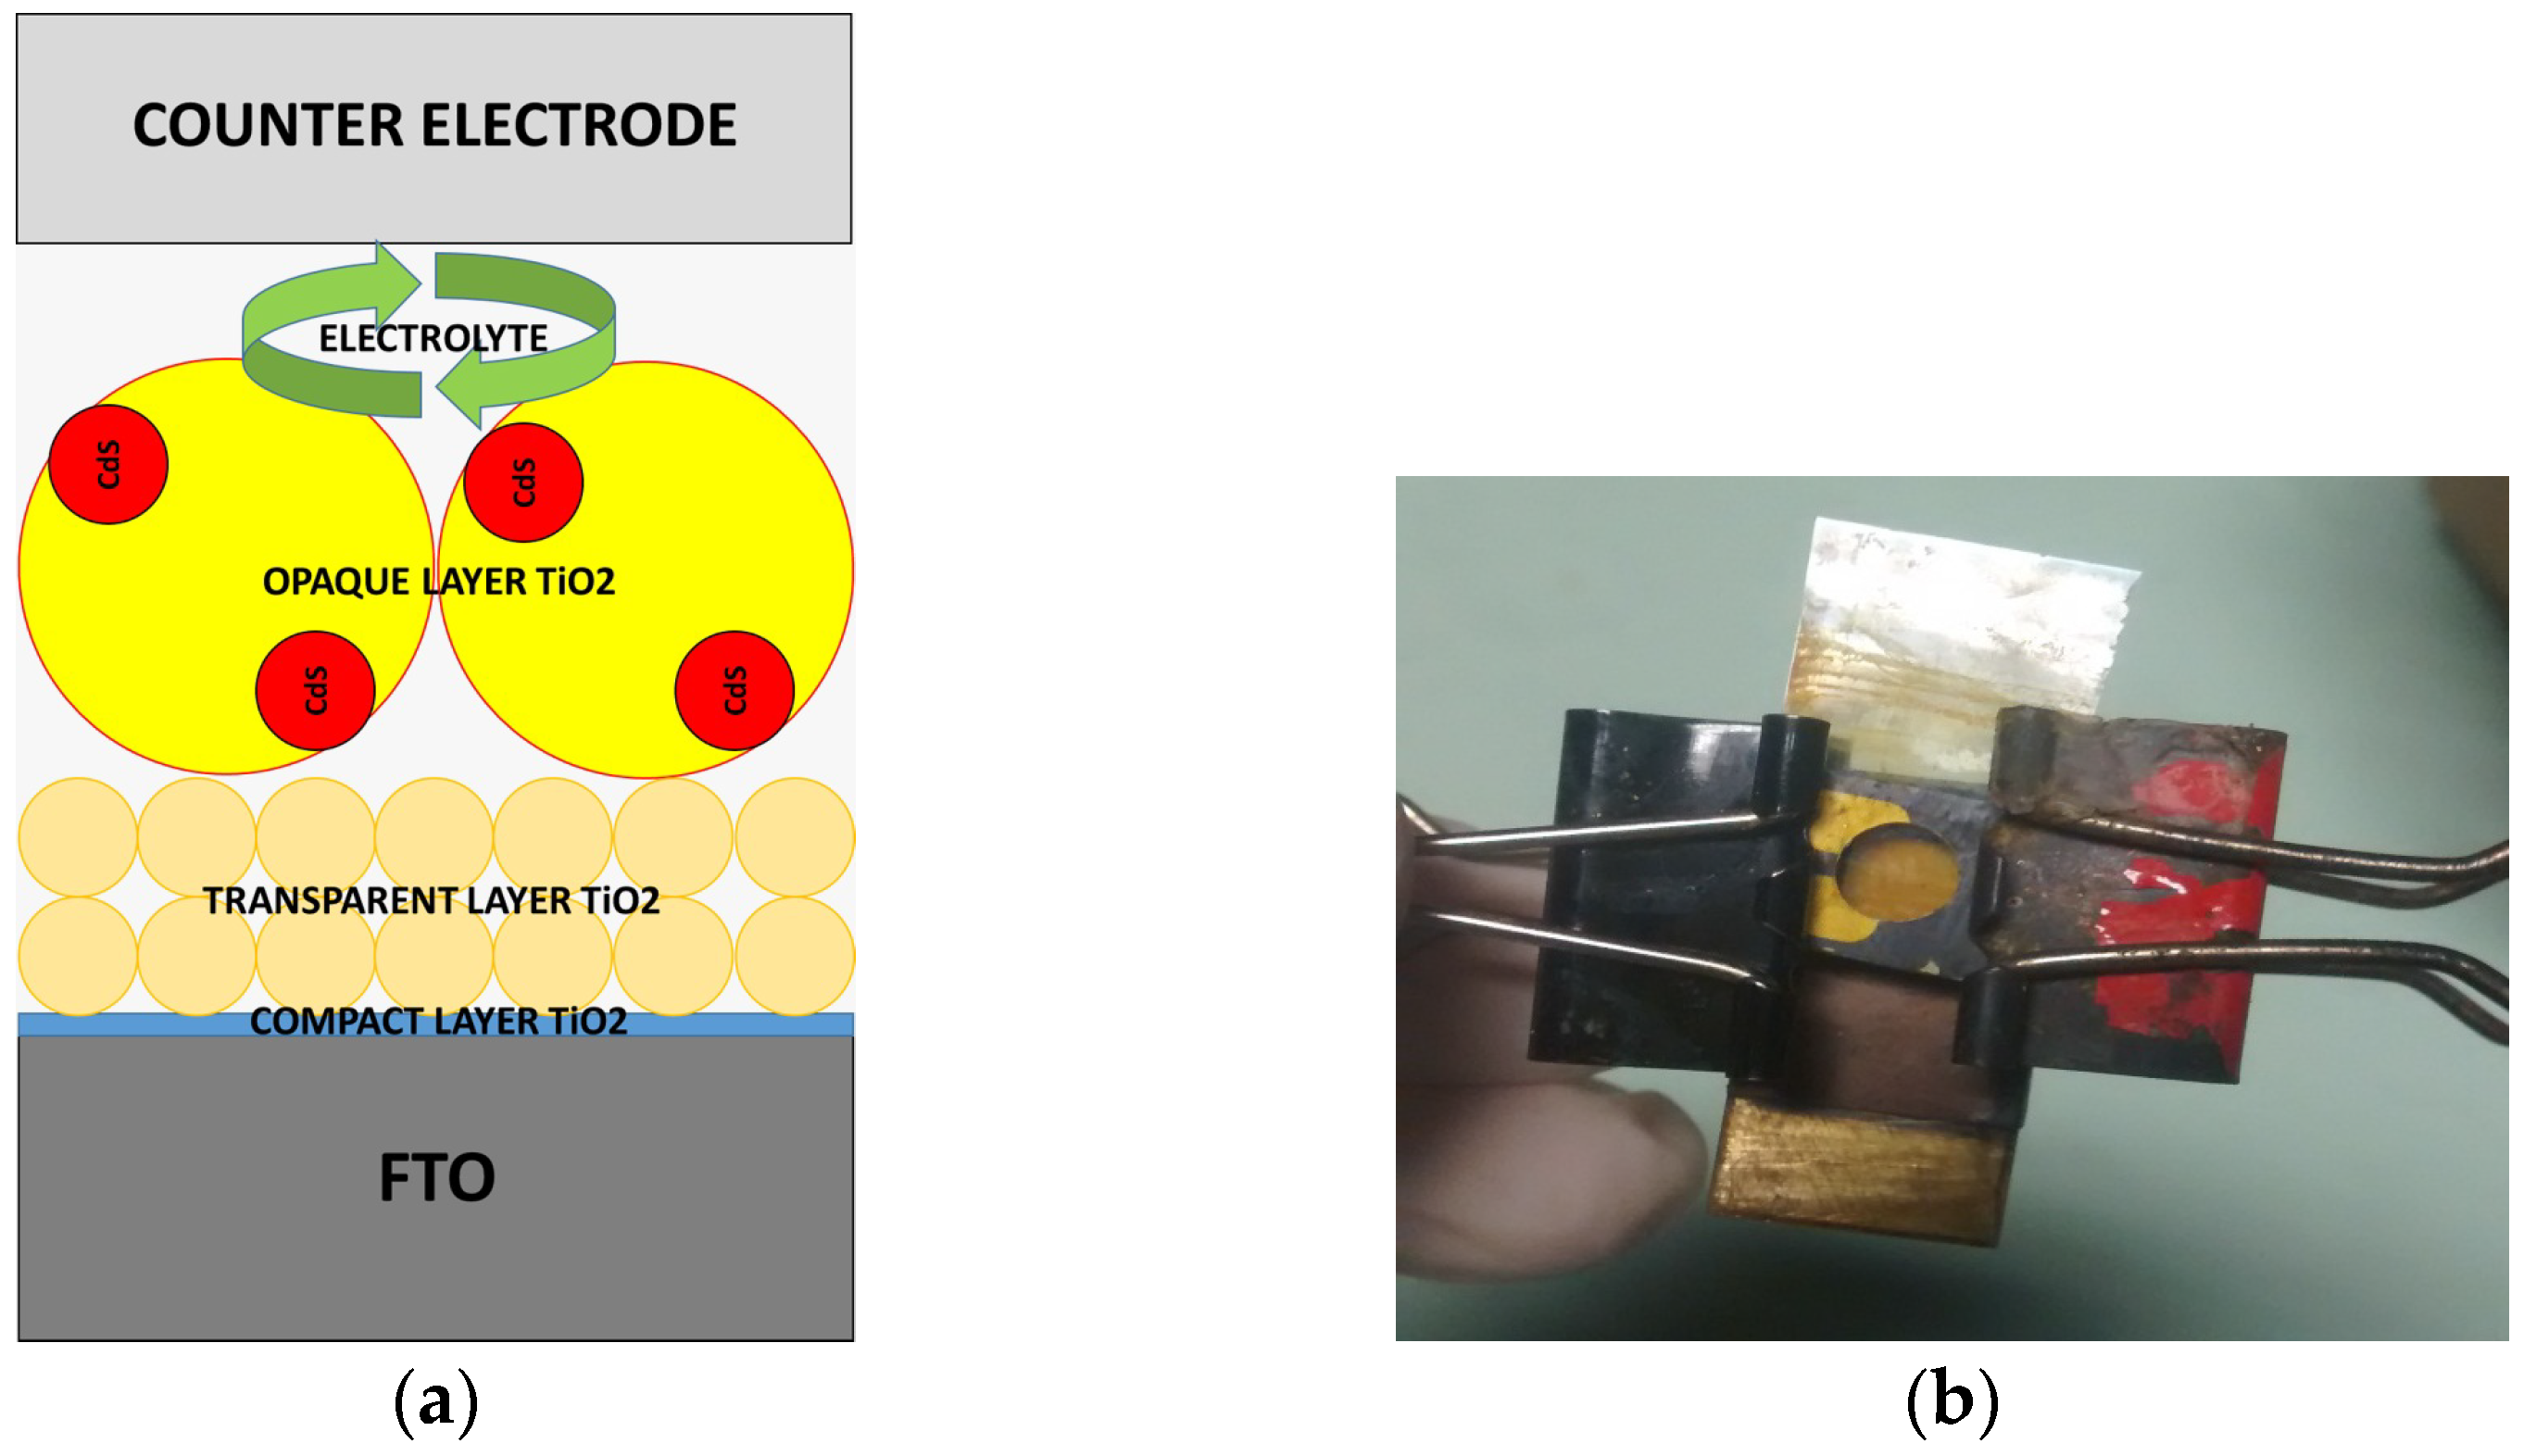
4.5. Cell Configuration Assembly

To test the performance of the photoelectrode and to measure its photovoltaic efficiency, it was necessary to fabricate a sensitized solar cell with QDs by assembling sensitized TiO2 layers deposited on FTO glass and a Cu2S counter electrode and adding a 20 µL drop of polysulfide electrolyte using a Scotch space. Sensitized TiO2 layers with a QD photoelectrode (anode) and a Cu2S counter electrode (cathode) were kept opposite and bound using binder clips. A mixture of 1.0 M S, 0.1 M NaOH, and 1.0 M Na2S, which were diluted with DW, was used for the polysulfide electrolyte. This allowed the creation of an interphase between layers for diffusion prior to subsequently taking Jsc–Voc measurements with a solar simulator. Figure 7a shows a schematic representation of the assembly of solar cells, and Figure 7b shows a photo of the steps of the assembly’s configuration.

4.6. Characterization of the Sol–Gel Synthesis of TiO2 with Pectin

The surface morphology of the NPs was assessed using scanning electron microscopy (SEM). These images were obtained with a JEOL JSM-7800 microscope. Ultraviolet–visible (UV–Vis) absorption spectra were recorded using an Agilent Technologies Cary Series UV–visible–NIR spectrophotometer (Cary 5000), and the BET surface area was measured by Quantachrome Corp. The crystalline structure was described based on X-ray diffraction (XRD) patterns using a BrukerD-2 PHASER.
The crystallite size (D) was obtained using the Debye–Scherrer formula, which is described by Equation (1).
D = k λ β cos θ
where k = 0.9 is the constant of Scherrer for tetragonal TiO2, λ is the wavelength of the source, λ = 0.15418 nm, β is the full width at half maximum (FWHM), and θ is the Bragg angle [58].
Using the Tauc model, we plotted the estimates of the optical bandgap energy (Eg) from the UV–Vis spectra using Equation (2).
α h v = A h v E g n
where α is the absorption coefficient, A is a photonic-energy-independent constant, h is the Planck constant, v is the photon frequency, and n is a factor that depends on the electronic transition (1/2 when equal, 2 when direct or indirect) [22,50].

4.7. Characterization of a DSSC Cell with the Synthesis of TiO2

Current density–voltage (J–V) curves were evaluated with a 600 Gamry Potentiostat as a reference scanning from 0 to 600 mV at 100 mV/S. A solar simulator (Oriel Sol 3) was used to measure the current. The light intensity was adjusted by employing an NREL-calibrated Si solar cell with a KG-2 filter for one instance of sunlight intensity (100 mW/cm2). The experimental results were fitted with the Origin8 software. The photoconversion efficiency Ƞ and fill factor (FF) were calculated with Equations (3) and (4).
F F % = P m a x J s c   V c o × 100
Ƞ % = P m a x P i = F F J s c   V o c P i
where Ƞ (%) is the efficiency, the maximum electrical power from the incident solar power conversion in the cell; FF (%) is the filling factor, the maximum power obtainable from the deviation that the cell presents in the induced area; J s c   (mA/cm2) is the short-circuit current density; V o c (mV) is the open-circuit voltage; P i (mW/cm2) is the incident light power density (100 mW/cm2); P m a x represents the relationship of the maximum obtainable electrical power.
The higher the fill factor (FF), the more electrical energy can be extracted, so that from the previous equations, we have the following: the results are influenced by many photo-electrode factors, such as the texture of the films, electron recombination, and the transmittance within the cell [43,53].

Author Contributions

Methodology, J.F.-G., J.M.-R. and J.P.G.-J.; formal analysis, J.F.-G., J.P.G.-J. and S.M.-M. writing—original draft preparation, J.F.-G., J.M.-R. and S.M.-M.; writing—review and editing, J.P.G.-J., J.F.-G., V.H.R.-A. and S.M.-M. supervision, J.M.-R. and V.H.R.-A. All authors have read and agreed to the published version of the manuscript.

Funding

This research received no external funding.

Institutional Review Board Statement

Not applicable.

Informed Consent Statement

Not applicable.

Data Availability Statement

Data is available by corresponding author upon request.

Acknowledgments

To University of Guadalajara and the National Council for Humanities Science and Technology (CONAHCyT) of México.

Conflicts of Interest

The authors declare no conflicts of interest.

References

  1. García Gutiérrez, D.I.; Navarro Garza, M.A.; Peláez Cienfuegos, R.F.; Guerrero Chávez, L. Aplicaciones de La Nanotecnología En Fuentes Alternas de Energía. Ingenierias 2010, 13, 53–62. [Google Scholar]
  2. Matsumoto, Y.; Valdés, M.; Urbano, J.A.; Kobayashi, T.; López, G.; Peña, R. Global Solar Irradiation in North Mexico City and Some Comparisons with the South. Energy Procedia 2014, 57, 1179–1188. [Google Scholar] [CrossRef]
  3. Perea-Moreno, A.J.; Hernandez-Escobedo, Q.; Garrido, J.; Verdugo-Diaz, J.D. Stand-Alone Photovoltaic System Assessment in Warmer Urban Areas in Mexico. Energies 2018, 11, 284. [Google Scholar] [CrossRef]
  4. Apeh, O.O.; Meyer, E.L.; Overen, O.K. Contributions of Solar Photovoltaic Systems to Environmental and Socioeconomic Aspects of National Development—A Review. Energies 2022, 15, 5963. [Google Scholar] [CrossRef]
  5. Jun, H.K.; Careem, M.A.; Arof, A.K. Quantum Dot-Sensitized Solar Cells-Perspective and Recent Developments: A Review of Cd Chalcogenide Quantum Dots as Sensitizers. Renew. Sustain. Energy Rev. 2013, 22, 148–167. [Google Scholar] [CrossRef]
  6. Sasani Ghamsari, M.; Bahramian, A.R. High Transparent Sol-Gel Derived Nanostructured TiO2 Thin Film. Mater. Lett. 2008, 62, 361–364. [Google Scholar] [CrossRef]
  7. Qian, X.; Qin, D.; Bai, Y.; Li, T.; Tang, X.; Wang, E.; Dong, S. Photosensitization of TiO2 Nanoparticulate Thin Film Electrodes by CdS Nanoparticles. J. Solid State Electrochem. 2001, 5, 562–567. [Google Scholar] [CrossRef]
  8. Irwin, M.D.; Buchholz, D.B.; Hains, A.W.; Chang, R.P.H.; Marks, T.J. P-Type Semiconducting Nickel Oxide as an Efficiency-Enhancing Anode Interfacial Layer in Polymer Bulk-Heterojunction Solar Cells. Proc. Natl. Acad. Sci. USA 2008, 105, 2783–2787. [Google Scholar] [CrossRef]
  9. O’Regan, B.; Grätzel, M. A Low-Cost, High-Efficiency Solar Cell Based on Dye-Sensitized Colloidal TiO2 Films. Nature 1991, 353, 737. [Google Scholar] [CrossRef]
  10. Nelson, J. Solar Cells by Self-Assembly? Sci. New Ser. 2001, 293, 1059–1060. [Google Scholar] [CrossRef]
  11. West, J.L.; Halas, N.J. Engineered Nanomaterials for Biophotonics Applications: Improving Sensing, Imaging, and Therapeutics. Annu. Rev. Biomed. Eng. 2003, 5, 285–292. [Google Scholar] [CrossRef] [PubMed]
  12. Poortmans, J.; Arkhipov, V. Thin Film Solar Cells Fabrication, Characterization and Applications; John Wiley & Sons: Hoboken, NJ, USA, 2006; ISBN 9780470091289. [Google Scholar]
  13. Carp, O.; Huisman, C.L.; Reller, A. Photoinduced Reactivity of Titanium Dioxide. Prog. Solid State Chem. 2004, 32, 33–177. [Google Scholar] [CrossRef]
  14. Zhang, Q.; Cao, G. Hierarchically Structured Photoelectrodes for Dye-Sensitized Solar Cells. J. Mater. Chem. 2011, 21, 6769–6774. [Google Scholar] [CrossRef]
  15. Lu, J.G.; Chang, P.; Fan, Z. Quasi-One-Dimensional Metal Oxide Materials-Synthesis, Properties and Applications. Mater. Sci. Eng. R Rep. 2006, 52, 49–91. [Google Scholar] [CrossRef]
  16. Chen, X.; Mao, S.S. Titanium Dioxide Nanomaterials: Synthesis, Properties, Modifications, and Applications. Chem. Rev. 2007, 107, 2891–2959. [Google Scholar] [CrossRef] [PubMed]
  17. Cacialli, F. Organic Semiconductors for the New Millennium. Philos. Trans. R. Soc. London Ser. A Math. Phys. Eng. Sci. 2000, 358, 173–192. [Google Scholar] [CrossRef]
  18. Fall, A.; Ngom, I.; Bakayoko, M.; Sylla, N.F.; Elsayed Ahmed Mohamed, H.; Jadvi, K.; Kaviyarasu, K.; Ngom, B.D. Biosynthesis of TiO2 nanoparticles by Using Natural Extract of Citrus Sinensis. Mater. Today Proc. 2019, 36, 349–356. [Google Scholar] [CrossRef]
  19. Salomatina, E.V.; Loginova, A.S.; Ignatov, S.; Knyazev, A.V.; Spirina, I.V.; Smirnova, L.A. Structure and Catalytic Activity of Poly(Titanium Oxide) Doped by Gold Nanoparticles in Organic Polymeric Matrix. J. Inorg. Organomet. Polym. Mater. 2016, 26, 1280–1291. [Google Scholar] [CrossRef]
  20. Chen, J.; Bai, F.Q.; Wang, J.; Hao, L.; Xie, Z.F.; Pan, Q.J.; Zhang, H.X. Theoretical Studies on Spectroscopic Properties of Ruthenium Sensitizers Absorbed to TiO2 Film Surface with Connection Mode for DSSC. Dye. Pigment. 2012, 94, 459–468. [Google Scholar] [CrossRef]
  21. Carbó Vela, P.; Rocha Rangel, E. Electrochemical Process in Solar Cells Sensibilized with a Natural Dye. Investig. Cienc. Univ. Autónoma Aguascalientes 2012, 8, 3–10. [Google Scholar]
  22. Rajendhiran, R.; Atchudan, R.; Palanisamy, J.; Balasankar, A.; Oh, T.H.; Deivasigamani, V.; Ramasundaram, S. Prickly Pear Fruit Extract: Capping Agent for the Sol–Gel Synthesis of Discrete Titanium Dioxide Nanoparticles and Sensitizer for Dye-Sensitized Solar Cell. Coatings 2023, 13, 579. [Google Scholar] [CrossRef]
  23. Qaid, S.M.H.; Ghaithan, H.M.; Bawazir, H.S.; Bin Ajaj, A.F.; AlHarbi, K.K.; Aldwayyan, A.S. Successful Growth of TiO2 Nanocrystals with {001} Facets for Solar Cells. Nanomaterials 2023, 13, 928. [Google Scholar] [CrossRef]
  24. Kumar, P.N.; Kolay, A.; Kumar, S.K.; Patra, P.; Aphale, A.; Srivastava, A.K.; Deepa, M. Counter Electrode Impact on Quantum Dot Solar Cell Efficiencies. ACS Appl. Mater. Interfaces 2016, 8, 27688–27700. [Google Scholar] [CrossRef] [PubMed]
  25. Tvrdy, K.; Frantsuzov, P.A.; Kamat, P.V. Photoinduced Electron Transfer from Semiconductor Quantum Dots to Metal Oxide Nanoparticles. Proc. Natl. Acad. Sci. USA 2011, 108, 29–34. [Google Scholar] [CrossRef] [PubMed]
  26. Yun, H.J.; Paik, T.; Edley, M.E.; Baxter, J.B.; Murray, C.B. Enhanced Charge Transfer Kinetics of CdSe Quantum Dot-Sensitized Solar Cell by Inorganic Ligand Exchange Treatments. ACS Appl. Mater. Interfaces 2014, 6, 3721–3728. [Google Scholar] [CrossRef]
  27. Lokman, M.Q.; Shaban, S.; Shafie, S.; Ahmad, F.; Yahaya, H.; Harun, A.M.; Rahman, M.A.A. Improving Dye-Sensitized Solar Cells Photocurrent Performance Based on Titanium Dioxide Photoanode Thickness. J. Adv. Res. Appl. Sci. Eng. Technol. 2024, 34, 177–186. [Google Scholar] [CrossRef]
  28. Devasvaran, K.; Lim, V. Green Synthesis of Metallic Nanoparticles Using Pectin as a Reducing Agent: A Systematic Review of the Biological Activities. Pharm. Biol. 2021, 59, 494–503. [Google Scholar] [CrossRef]
  29. Miu, B.A.; Stan, M.S.; Mernea, M.; Dinischiotu, A.; Voinea, I.C. Pure Epigallocatechin-3-Gallate-Assisted Green Synthesis of Highly Stable Titanium Dioxide Nanoparticles. Materials 2024, 17, 275. [Google Scholar] [CrossRef] [PubMed]
  30. Kashale, A.A.; Gattu, K.P.; Ghule, K.; Ingole, V.H.; Dhanayat, S.; Sharma, R.; Chang, J.Y.; Ghule, A.V. Biomediated Green Synthesis of TiO2 Nanoparticles for Lithium Ion Battery Application. Compos. Part B Eng. 2016, 99, 297–304. [Google Scholar] [CrossRef]
  31. Rao, K.G.; Ashok, C.H.; Rao, K.V.; Chakra, C.H.S.; Akshaykranth, A. Eco-Friendly Synthesis of MgO Nanoparticles from Orange Fruit Waste. Int. J. Adv. Res. Phys. 2015, 2, 1–6. [Google Scholar]
  32. Gemeiner, P.; Mikula, M. Efficiency of Dye Sensitized Solar Cells with Various Compositions of TiO2 Based Screen Printed Photoactive Electrodes. Acta Chim. Slovaca 2013, 6, 29–34. [Google Scholar] [CrossRef]
  33. Opara Krašovec, U.; Berginc, M.; Hočevar, M.; Topič, M. Unique TiO2 Paste for High Efficiency Dye-Sensitized Solar Cells. Sol. Energy Mater. Sol. Cells 2009, 93, 379–381. [Google Scholar] [CrossRef]
  34. Ito, S.; Chen, P.; Comte, P.; Mohammad, K.N.; Liska, P.; Péchy, P.; Grätzel, M. Fabrication of Screen-Printing Pastes from TiO2 Powders for Dye-Sensitised Solar Cells. Prog. Photovolt. Res. Appl. 2007, 15, 603–612. [Google Scholar] [CrossRef]
  35. Ito, S.; Murakami, T.N.; Comte, P.; Liska, P.; Grätzel, C.; Nazeeruddin, M.K.; Grätzel, M. Fabrication of Thin Film Dye Sensitized Solar Cells with Solar to Electric Power Conversion Efficiency over 10%. Thin Solid Films 2008, 516, 4613–4619. [Google Scholar] [CrossRef]
  36. Hočevar, M.; Opara Krašovec, U.; Berginc, M.; Dražič, G.; Hauptman, N.; Topič, M. Development of TiO2 Pastes Modified with Pechini Sol-Gel Method for High Efficiency Dye-Sensitized Solar Cell. J. Sol-Gel Sci. Technol. 2008, 48, 156–162. [Google Scholar] [CrossRef]
  37. Zhang, Y.Q.; Xia, X.H.; Tu, J.P.; Mai, Y.J.; Shi, S.J.; Wang, X.L.; Gu, C.D. Self-Assembled Synthesis of Hierarchically Porous NiO Film and Its Application for Electrochemical Capacitors. J. Power Sources 2012, 199, 413–417. [Google Scholar] [CrossRef]
  38. Zukalova, M.; Zukal, A.; Kavan, L.; Nazeeruddin, M.K.; Liska, P.; Grätzel, M. Organized Mesoporous TiO2 Films Exhibiting Greatly Enhanced Performance in Dye-Sensitized Solar Cells. Nano Lett. 2005, 5, 1789–1792. [Google Scholar] [CrossRef] [PubMed]
  39. Sánchez Sosa, R. Preparación y Caracterización de Películas de TiO2 Sensibilizadas Con CdS Para Aplicaciones en Celdas Solares; Instituto Politecnico Nacional: Mexico City, Mexico, 2014. [Google Scholar]
  40. Lewis, N.S. Toward Solar Cost-Effective Energy Use. Am. Assoc. Adv. Sci. 2007, 315, 798–801. [Google Scholar] [CrossRef] [PubMed]
  41. Sankapal, B.R.; Mane, R.S.; Lokhande, C.D. Successive Ionic Layer Adsorption and Reaction (SILAR) Method for the Deposition of Large Area (Approximately 10 cm2) Tin Disulfide (SnS2) Thin Films. Mater. Res. Bull. 2000, 35, 2027–2035. [Google Scholar] [CrossRef]
  42. Hernadez-Enríquez, J.; García-Alamilla, R.; Zereño-Resendiz, B.; Del Angel-Sánchez, T.; Cuento-Hérnandez, A. Síntesis y Caracterización de Nanopartículas de N-TiO2—Anatasa. Superf. Vacío 2008, 21, 1–5. [Google Scholar]
  43. Ito, S.; Takahashi, K.; Yusa, S.I.; Imamura, T.; Tanimoto, K. Effects of Homogenization Scheme of TiO2 Screen-Printing Paste for Dye-Sensitized Solar Cells. Int. J. Photoenergy 2012, 2012, 405642. [Google Scholar] [CrossRef]
  44. Hu, Y.; Tsai, H.L.; Huang, C.L. Phase Transformation of Precipitated TiO2 Nanoparticles. Mater. Sci. Eng. 2003, 344, 209–214. [Google Scholar] [CrossRef]
  45. Wagemaker, M.; Borghols, W.J.H.; Mulder, F.M. Large Impact of Particle Size on Insertion Reactions. A Case for Anatase LixTiO2. J. Am. Chem. Soc. 2007, 129, 4323–4327. [Google Scholar] [CrossRef] [PubMed]
  46. Vera, R.O.V.; Cruz, O.E.T.; Rojas, J.M.P.; Tarmeño, E.I.C.; Kiyán, J.A.A.; Gutierrez, H.O.C.; Gutierrez, M.M.C. Caracterización Estructural y Óptica de Películas Delgadas de Dióxido de Titanio Depositadas Por Rociado Pirolítico. S. Florida J. Dev. 2021, 2, 2141–2155. [Google Scholar] [CrossRef]
  47. Kuriechen, S.K.; Murugesan, S.; Paul Raj, S. Mineralization of Azo Dye Using Combined Photo-Fenton and Photocatalytic Processes under Visible Light. J. Catal. 2013, 2013, 104019. [Google Scholar] [CrossRef]
  48. Allende, P.; Barrientos, L.; Orera, A.; Laguna-Bercero, M.A.; Salazar, N.; Valenzuela, M.L.; Diaz, C. TiO2/SiO2 Composite for Efficient Protection of UVA and UVB Rays Through of a Solvent-Less Synthesis. J. Clust. Sci. 2019, 30, 1511–1517. [Google Scholar] [CrossRef]
  49. Alsaad, A.; Al Dairy, A.R.; Ahmad, A.; Qattan, I.A.; Al Fawares, S.; Al-Bataineh, Q. Synthesis and Characterization of Polymeric (PMMA-PVA) Hybrid Thin Films Doped with TiO2 Nanoparticles Using Dip-Coating Technique. Crystals 2021, 11, 99. [Google Scholar] [CrossRef]
  50. Jubu, P.R.; Obaseki, O.S.; Yam, F.K.; Stephen, S.M.; Avaa, A.A.; McAsule, A.A.; Yusof, Y.; Otor, D.A. Influence of the Secondary Absorption and the Vertical Axis Scale of the Tauc’s Plot on Optical Bandgap Energy. J. Opt. 2023, 52, 1426–1435. [Google Scholar] [CrossRef]
  51. Thommes, M.; Kaneko, K.; Neimark, A.V.; Olivier, J.P.; Rodriguez-Reinoso, F.; Rouquerol, J.; Sing, K.S.W. Physisorption of Gases, with Special Reference to the Evaluation of Surface Area and Pore Size Distribution (IUPAC Technical Report). Pure Appl. Chem. 2015, 87, 1051–1069. [Google Scholar] [CrossRef]
  52. Yu, J.; Fan, J.; Lv, K. Anatase TiO2 Nanosheets with Exposed (001) Facets: Improved Photoelectric Conversion Efficiency in Dye-Sensitized Solar Cells. Nanoscale 2010, 2, 2144–2149. [Google Scholar] [CrossRef]
  53. Ramachari, D.; Esparza, D.; López-Luke, T.; Romero, V.H.; Perez-Mayen, L.; De la Rosa, E.; Jayasankar, C.K. Synthesis of Co-Doped Yb3+-Er3+:ZrO2 upconversion Nanoparticles and Their Applications in Enhanced Photovoltaic Properties of Quantum Dot Sensitized Solar Cells. J. Alloys Compd. 2017, 698, 433–441. [Google Scholar] [CrossRef]
  54. Esparza, D.; Zarazúa, I.; López-Luke, T.; Carriles, R.; Torres-Castro, A.; Rosa, E.D. La Photovoltaic Properties of Bi2S3 and CdS Quantum Dot Sensitized TiO2 Solar Cells. Electrochim. Acta 2015, 180, 486–492. [Google Scholar] [CrossRef]
  55. Aboulouard, A.; Gultekin, B.; Can, M.; Erol, M.; Jouaiti, A.; Elhadadi, B.; Zafer, C.; Demic, S. Dye Sensitized Solar Cells Based on Titanium Dioxide Nanoparticles Synthesized by Flame Spray Pyrolysis and Hydrothermal Sol-Gel Methods: A Comparative Study on Photovoltaic Performances. J. Mater. Res. Technol. 2020, 9, 1569–1577. [Google Scholar] [CrossRef]
  56. Park, N.G.; Kim, K.M.; Kang, M.G.; Ryu, K.S.; Chang, S.H.; Shin, Y.J. Chemical Sintering of Nanoparticles: A Methodology for Low-Temperature Fabrication of Dye-Sensitized TiO2 Films. Adv. Mater. 2005, 17, 2349–2353. [Google Scholar] [CrossRef]
  57. May, C.D. Industrial Pectins: Sources, Production and Applications. Carbohydr. Polym. 1990, 12, 79–99. [Google Scholar] [CrossRef]
  58. Alaya, Y.; Souissi, R.; Toumi, M.; Madani, M.; El Mir, L.; Bouguila, N.; Alaya, S. Annealing Effect on the Physical Properties of TiO2 Thin Films Deposited by Spray Pyrolysis. RSC Adv. 2023, 13, 21852–21860. [Google Scholar] [CrossRef]
Figure 1. Characterization of the sol–gel synthesis of TiO2 with pectin at different calcination temperatures of 600 °C, 800 °C, and 1000 °C being A anatase R Rutile phase: (a) comparison of the XRD spectra of the crystalline phase of the TiO2 materials obtained at different calcination temperatures; (b) UV–Vis spectra of TiO2 materials compared with P25 Degussa.
Gels 10 00470 g001
Figure 2. Tauc plots of P25 Degussa and the sol–gel synthesis of TiO2 with pectin at different calcination temperatures of 600 °C, 800 °C, and 1000 °C, being Red linear fitting, Black experimental data: (a) value of the bandgap energy estimated via the linear fit of TiO2 P25 Degussa (3.20 eV) in comparison with standard bandgap materials [18,28]; (b) bandgap energy estimated at 600 °C (2.22 eV); (c) bandgap energy estimated at 800 °C (2.49 eV); (d) bandgap energy estimated at 1000 °C (2.61 eV).
Gels 10 00470 g002
Figure 3. Surface area and NP size distribution: (a) N2 adsorption–desorption isotherm of the sol–gel synthesis of TiO2 with pectin to evaluate the surface area; (b) bar chart histogram indicating the average size of TiO2 NPs obtained through the sol–gel synthesis of TiO2 with pectin.
Gels 10 00470 g003
Figure 4. SEM micrograph of the sol–gel synthesis of TiO2 with pectin: (a) closeup with a distinguishable grain shape; (b) micrograph of the uniformity of the size of the TiO2 nanoparticles.
Gels 10 00470 g004
Figure 5. SEM micrograph of the TiO2 layers; (a) closeup from above, seemingly without defects; (b) micrograph of TiO2 layers with thickness measurements.
Gels 10 00470 g005
Figure 6. Jsc–Voc curves: (a) samples prepared with transparent P25 paste with a pectin agglutinant and QD sensitization, compared to Ito [31]; (b) samples prepared with an opaque paste through the sol–gel synthesis of TiO2 and a pectin emulsifier with QD sensitization.
Gels 10 00470 g006
Figure 7. Cell configuration assembly. (a) Schematic representation of the assembly of solar cells; FTO, compact TiO2, transparent TiO2, opaque TiO2, Cd and Zn sulfide quantum dots, electrolyte, counter electrode. (b) Photo of the QDDSSC assembly from above.
Gels 10 00470 g007
Table 1. Photovoltaic response of differently structured photoelectrodes in TiO2 solar cells at an intensity of 100 mW/cm2.
ConfigurationVoc (mV)Jsc (mA/cm2)FF (%) Ƞ (%)Reference
TiO2/CdS/Cu2S8.347441.31.56[53]
TiO2/CdS/ZnS/Cu2S7.250452.91.94[53]
TiO2/CdS/ZnS/ZrO2 with Yb3þ/Er3þ/Cu2S7.159368.73[53]
TiO2/Bi2s3/CdS/Zn/Cu2S9.353.72.52[54]
TiO2/DB/N719/CC10.96553.81[27]
FSPTiO2/DB/N719/PT5.25720642.44[55]
HTTiO2/DB/N719/PT13.46660443.94[55]
TiO2/COM/N719/PT19.56720547.67[55]
GSHTiO2/PPE/RB/CC3.22660551.16[22]
GSHTiO2/PPE/EY/CC2.85640480.8[22]
GSHTiO2/PPE/PP/CC3.49660611.4[22]
TiO2/DB/CdS/Cu2S12.5672331.72.88[22]
TiO2/CdS/ZnS/Cu2S5.761054.11.88This article
TiO2/PNB/CdS/ZnS/Cu2S4.556048.91.23This article
SGPNTiO2/PNB/CdS/ZnS/Cu2S6.564054.72.27This article
Meanings of the acronyms: standard TiO2 (P25), CdS: sulfur cadmium QDs, COM: commercial Titania electrode (Solaronix S.A), FSP: spray pyrolysis synthesis of TiO2, ZnS: sulfur zinc QDs, DB: doctor blade deposition, HT: hydrothermal synthesis of TiO2, N719 dye, Cu2S: copper sulfide counter electrode, GSH: green synthesis, Bi2s3: bismuth sulfide QDs, PT: platinum counter electrode, SGPNTiO2: sol–gel synthesis of TiO2 with pectin, Yb3þ/Er3þ: o-doped ZrO2 nanoparticles, CC: carbon counter electrode, EY: eosin yellow synthetic dye, — not reported, PPE: prickly pear (opuntia) fruit extract, RB: rose Bengal synthetic dye, PNB: paste with pectin binder, PP: prickly pear (opuntia) dye.
Disclaimer/Publisher’s Note: The statements, opinions and data contained in all publications are solely those of the individual author(s) and contributor(s) and not of MDPI and/or the editor(s). MDPI and/or the editor(s) disclaim responsibility for any injury to people or property resulting from any ideas, methods, instructions or products referred to in the content.

