
Compressive and Flexural Properties of Ultra-Fine Coal Gangue-Based Geopolymer Gels and Microscopic Mechanism Analysis


Abstract
:1. Introduction
2. Experimental Section
2.1. Materials
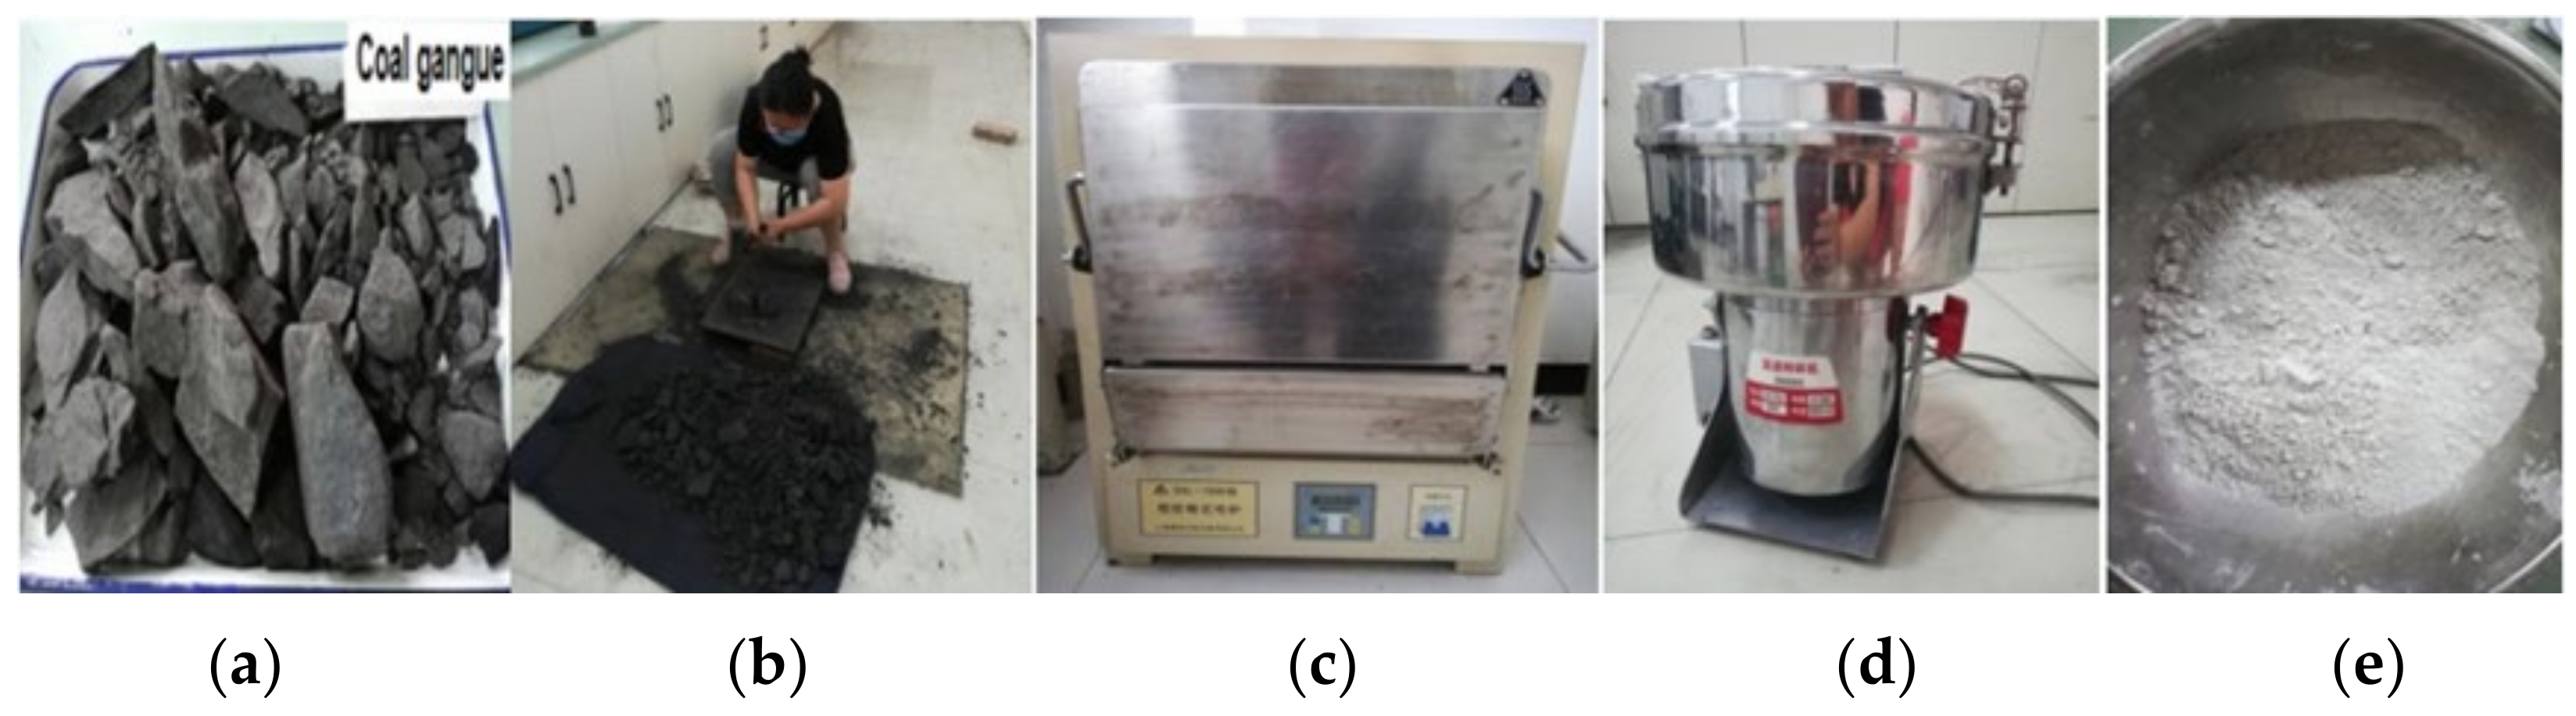
2.1.1. Coal Gangue
2.1.2. Blast Furnace Slag
2.1.3. Alkali
2.2. Preparation and Strength Testing of Geopolymers
2.3. Characterizations
2.4. Experimental Design
3. Strength Test Results
3.1. Analysis of Orthogonal Test Results (Stage I)
3.2. Analysis of the Influencing Factors (Stage II)
3.2.1. Effects of Modulus on Compressive and Flexural Strength
3.2.2. Effects of SS Alkali Activator Dosage Factor on the Compressive and Flexural Strength
3.3. Compared with OPC
4. Microstructural Analysis Results
4.1. XRD
4.2. FTIR
4.3. Analysis of SEM and EDS
4.4. Mechanisms for Strength Development
5. Conclusions
- (1)
- The influencing factors affecting the strength development of the geopolymer in the high-low order of significance were BFS content, alkali content, and modulus.
- (2)
- To maximize the strength development of the coal gangue base geopolymer, the optimum alkali content was 18–20%, the modulus was 0.6–0.8, and the corresponding compressive strength and flexural strength can reach more than 40 MPa and 5.9 MPa, respectively.
- (3)
- The relationships of compressive strength or flexural strength to modulus conformed to a quadratic curve.
- (4)
- The main reasons for the high strength of geopolymer were the strong reaction, dense structure, and the formation of three types of interlinked gels, namely N-A-S-H, C-A-S-H and C-N-A-S-H.
Author Contributions
Funding
Institutional Review Board Statement
Informed Consent Statement
Data Availability Statement
Conflicts of Interest
References
- Nie, Q.; Hu, W.; Huang, B.; Shu, X.; He, Q. Synergistic Utilization of Red Mud for Flue-Gas Desulfurization and Fly Ash-based Geopolymer Preparation. J. Hazard. Mater. 2019, 369, 503–511. [Google Scholar] [CrossRef]
- Ji, Z.; Zhang, Y.; Qi, X.; Wang, Y.; Xia, X.; Pei, Y. Low-Cost and Facile Fabrication of Recyclable and Reusable Waste-based Geopolymer for Visible-light Photocatalysis Degradation. J. Clean. Prod. 2021, 310, 127434. [Google Scholar] [CrossRef]
- Petrus, H.T.B.M.; Fairuz, F.I.; Sa’dan, N.; Olvianas, M.; Astuti, W.; Jenie, S.N.A.; Setiawan, F.A.; Anggara, F.; Ekaputri, J.J.; Bendiyasa, I.M. Green Geopolymer Cement with Dry Activator from Geothermal Sludge and Sodium Hydroxide. J. Clean. Prod. 2021, 293, 126143. [Google Scholar] [CrossRef]
- Ren, B.; Zhao, Y.; Bai, H.; Kang, S.; Zhang, T.; Song, S. Eco-Friendly Geopolymer Prepared from Solid Wastes: A Critical Review. Chemosphere 2021, 267, 128900. [Google Scholar] [CrossRef] [PubMed]
- Zhao, J.; Tong, L.; Li, B.; Chen, T.; Wang, C.; Yang, G.; Zheng, Y. Eco-Friendly Geopolymer Materials: A Review of Performance Improvement, Potential Application and Sustainability Assessment. J. Clean. Prod. 2021, 307, 127085. [Google Scholar] [CrossRef]
- Li, J.; Wang, J. Comprehensive Utilization and Environmental Risks of Coal Gangue: A Review. J. Clean. Prod. 2019, 239, 117946. [Google Scholar] [CrossRef]
- Liu, F.; Xie, M.; Yu, G.; Ke, C.; Zhao, H. Study on Calcination Catalysis and the Desilication Mechanism for Coal Gangue. ACS Sustain. Chem. Eng. 2021, 9, 10318–10325. [Google Scholar] [CrossRef]
- Wang, H.; Fang, X.; Du, F.; Tan, B.; Zhang, L.; Li, Y.; Xu, C. Three-Dimensional Distribution and Oxidation Degree Analysis of Coal Gangue Dump Fire Area: A Case Study. Sci. Total Environ. 2021, 772, 145606. [Google Scholar] [CrossRef]
- Wang, B.; Ma, Y.; Lee, X.; Wu, P.; Liu, F.; Zhang, X.; Li, L.; Chen, M. Environmental-Friendly Coal Gangue-Biochar Composites Reclaiming Phosphate from Water as a Slow-Release Fertilizer. Sci. Total Environ. 2021, 758, 143664. [Google Scholar] [CrossRef]
- Huang, G.; Ji, Y.; Li, J.; Hou, Z.; Dong, Z. Improving Strength of Calcinated Coal Gangue Geopolymer Mortars via Increasing Calcium Content. Constr. Build. Mater. 2018, 166, 760–768. [Google Scholar] [CrossRef]
- Liu, C.; Shui, Z.; Gao, X.; Ma, S. Performance Evaluation of Alkali-Activated Coal Gangue-Blast Furnace Slag Composite. Bull. Chin. Ceram. Soc. 2020, 39, 2877–2884. [Google Scholar] [CrossRef]
- Zhang, W.; Dong, C.; Huang, P.; Sun, Q.; Li, M.; Chai, J. Experimental Study on the Characteristics of Activated Coal Gangue and Coal Gangue-Based Geopolymer. Energies 2020, 13, 2504. [Google Scholar] [CrossRef]
- Koshy, N.; Dondrob, K.; Hu, L.; Wen, Q.; Meegoda, J.N. Synthesis and Characterization of Geopolymers Derived from Coal Gangue, Fly Ash and Red Mud. Constr. Build. Mater. 2019, 206, 287–296. [Google Scholar] [CrossRef]
- Liu, C.; Deng, X.; Liu, J.; Hui, D. Mechanical Properties and Microstructures of Hypergolic and Calcined Coal Gangue Based Geopolymer Recycled Concrete. Constr. Build. Mater. 2019, 221, 691–708. [Google Scholar] [CrossRef]
- Zhang, X. Preparation of Cementitious Materials from Slag and Fly Ash of Liugang and Its Hydration Mechanism; China Hydropower and Water Conservancy Press: Beijing, China, 2017. [Google Scholar]
- Ma, H.; Zhu, H.; Yi, C.; Fan, J.; Chen, H.; Xu, X.; Wang, T. Preparation and Reaction Mechanism Characterization of Alkali-activated Coal Gangue–Slag Materials. Materials 2019, 12, 2250. [Google Scholar] [CrossRef] [Green Version]
- Zhu, H.; Yang, S.; Li, W.; Li, Z.; Fan, J.; Shen, Z. Study of Mechanical Properties and Durability of Alkali-Activated Coal Gangue-Slag Concrete. Materials 2020, 13, 5576. [Google Scholar] [CrossRef]
- Gao, X.; Liu, C.; Shui, Z.; Yu, R. Effects of Expansive Additives on the Shrinkage Behavior of Coal Gangue Based Alkali Activated Materials. Crystals 2021, 11, 816. [Google Scholar] [CrossRef]
- Li, Y.; Yang, X.; Ma, Y.; Sun, D.; Wang, A. Hydration Degree and Property of Coal Gangue-Slag-Cement System. Bull. Chin. Ceram. Soc. 2016, 35, 2729–2740. [Google Scholar] [CrossRef]
- Lei, B. Development and Performance Research of Geopolymer Grouting Materials. New Build. Mater. 2018, 45, 11–15. [Google Scholar]
- Nath, S.K.; Mukherjee, S.; Maitra, S.; Kumar, S. Kinetics Study of Geopolymerization of Fly Ash Using Isothermal Conduction Calorimetry. J. Therm. Anal. Calorim. 2017, 127, 1953–1961. [Google Scholar] [CrossRef]
- Cheng, Y.; Hongqiang, M.; Hongyu, C.; Jiaxin, W.; Jing, S.; Zonghui, L.; Mingkai, Y. Preparation and Characterization of Coal Gangue Geopolymers. Constr. Build. Mater. 2018, 187, 318–326. [Google Scholar] [CrossRef]
- Puertas, F.; Palacios, M.; Manzano, H.; Dolado, J.S.; Rico, A.; Rodríguez, J. A Model for the C-A-S-H Gel Formed in Alkali-Activated Slag Cements. J. Eur. Ceram. Soc. 2011, 31, 2043–2056. [Google Scholar] [CrossRef]
- Lecomte, I.; Liégeois, M.; Rulmont, A.; Cloots, R.; Maseri, F. Synthesis and Characterization of New Inorganic Polymeric Composites based on Kaolin or White Clay and on Ground-Granulated Blast Furnace Slag. J. Mater. Res. 2003, 18, 2571–2579. [Google Scholar] [CrossRef]
- Yang, J.; Fang, Y.; Li, D. Hydration Products C-A-S-H and N-A-S-H of Alkali-Activated Materials. Bull. Chin. Ceram. Soc. 2017, 36, 3292–3297. [Google Scholar] [CrossRef]
- Lodeiro, I.G.; Fernández-Jimenez, A.; Palomo, A.; Macphee, D.E. Effect on Fresh C-S-H Gels of the Simultaneous Addition of Alkali and Aluminium. Cem. Concr. Res. 2010, 40, 27–32. [Google Scholar] [CrossRef]
- Zhou, S.; Yang, Z.; Zhang, R.; Li, F. Preparation, Characterization and Rheological Analysis of Eco-Friendly Road Geopolymer Grouting Materials based on Volcanic Ash and Metakaolin. J. Clean. Prod. 2021, 312, 127822. [Google Scholar] [CrossRef]
- Mirković, M.; Kljajević, L.; Dolenec, S.; Nenadović, M.; Pavlović, V.; Rajačić, M.; Nenadović, S. Potential Usage of Hybrid Polymers Binders Based on Fly Ash with the Addition of PVA with Satisfying Mechanical and Radiological Properties. Gels 2021, 7, 270. [Google Scholar] [CrossRef]
- Song, Y.; Li, Z.; Zhang, J.; Tang, Y.; Ge, Y.; Cui, X. A Low-Cost Biomimetic Heterostructured Multilayer Membrane with Geopolymer Microparticles for Broad-Spectrum Water Purification. ACS Appl. Mater. Interfaces 2020, 12, 12133–12142. [Google Scholar] [CrossRef]
- Bi, S.; Liu, M.; Shen, J.; Hu, X.M.; Zhang, L. Ultrahigh Self-Sensing Performance of Geopolymer Nanocomposites via Unique Interface Engineering. ACS Appl. Mater. Interfaces 2017, 9, 12851–12858. [Google Scholar] [CrossRef]
- Heikal, M.; Nassar, M.Y.; El-Sayed, G.; Ibrahim, S.M. Physico-Chemical, Mechanical, Microstructure and Durability Characteristics of Alkali Activated Egyptian Slag. Constr. Build. Mater. 2014, 69, 60–72. [Google Scholar] [CrossRef]
- Ismail, I.; Bernal, S.A.; Provis, J.L.; San Nicolas, R.; Hamdan, S.; van Deventer, J.S.J. Modification of Phase Evolution in Alkali-Activated Blast Furnace Slag by the Incorporation of Fly Ash. Cem. Concr. Compos. 2014, 45, 125–135. [Google Scholar] [CrossRef]
- Baran, P.; Nazarko, M.; Włosińska, E.; Kanciruk, A.; Zarębska, K. Synthesis of Geopolymers Derived from Fly Ash with an Addition of Perlite. J. Clean. Prod. 2021, 293, 126112. [Google Scholar] [CrossRef]
- Ma, H.; Yi, C.; Chen, H.; Shi, J.; Li, W.; Guo, Y. Property and Cementation Mechanism of Alkali-Activated Coal Gangue-Slag Cementitious Materials. Chin. J. Mater. Res. 2018, 32, 898–904. [Google Scholar] [CrossRef]
- Zhang, D.; Wang, A.-h. Review on Property of Geopolymer Binder and its Engineering Application. J. Archit. Civ. Eng. 2020, 37, 13–38. [Google Scholar] [CrossRef]
- Myers, R.J.; Bernal, S.A.; San Nicolas, R.; Provis, J.L. Generalized Structural Description of Calcium–Sodium Aluminosilicate Hydrate Gels: The Cross-Linked Substituted Tobermorite Model. Langmuir 2013, 29, 5294–5306. [Google Scholar] [CrossRef]
- Ma, H.; Zhu, H.; Wu, C.; Chen, H.; Sun, J.; Liu, J. Study on Compressive Strength and Durability of Alkali-Activated Coal Gangue-Slag Concrete and its Mechanism. Powder Technol. 2020, 368, 112–124. [Google Scholar] [CrossRef]
- Wan, Q.; Rao, F.; Song, S.; García, R.E.; Estrella, R.M.; Patiño, C.L.; Zhang, Y. Geopolymerization Reaction, Microstructure and Simulation of Metakaolin-Based Geopolymers at Extended Si/Al Ratios. Cem. Concr. Compos. 2017, 79, 45–52. [Google Scholar] [CrossRef]
- Lolli, F.; Manzano, H.; Provis, J.L.; Bignozzi, M.C.; Masoero, E. Atomistic Simulations of Geopolymer Models: The Impact of Disorder on Structure and Mechanics. ACS Appl. Mater. Interfaces 2018, 10, 22809–22820. [Google Scholar] [CrossRef] [Green Version]
- Davidovits, J. Geopolymers and Geopolymeric Materials. J. Therm. Anal. 1989, 35, 429–441. [Google Scholar] [CrossRef]
- Zhang, S.; Gong, K. Geopolymer. J. Mater. Sci. Eng. 2003, 21, 430–436. [Google Scholar] [CrossRef]
- Li, J. The Composition and Microstructure of Slag-Based Cementitious Material Activated by Sodium Hydroxide and Modified Water Glass and Their Influence on Its Carbonation and Drying Shrinkage Performance. Ph.D. Thesis, South China University of Technology, Guangzhou, China, 2020. [Google Scholar] [CrossRef]


| Materials | SiO2 | Al2O3 | Fe2O3 | CaO | K2O | TiO2 | MgO | SO3 | Na2O | Others |
|---|---|---|---|---|---|---|---|---|---|---|
| UCGP | 54.2 | 41.6 | 0.98 | 0.55 | 0.91 | 0.96 | 0.10 | 0.02 | 0.46 | 0.22 |
| Specific Surface Area/m2 × kg−1 | Flow Ratio/% | 7-Day Activity Index/% | 28-Day Activity Index/% | Density/g × cm−2 | Ignition Loss/% | Moisture Content/% |
|---|---|---|---|---|---|---|
| 430 | 98 | 84.6 | 98.7 | 3.16 | 1.20 | 0.23 |
| CaO | SiO2 | Al2O3 | SO3 | Fe2O3 | MgO | Others |
| 33.5% | 34.9% | 16.7% | 1.7% | 1.05% | 6.0% | 6.15% |
| Level | BFS Powder Content/% | Alkali Content/% | Modulus |
|---|---|---|---|
| A | B | C | |
| 1 | 10 | 16 | 0.4 |
| 2 | 20 | 18 | 0.6 |
| 3 | 30 | 20 | 0.8 |
| 4 | 40 | 22 | 1.0 |
| Sample No. | SS1 | SS2 | SS3 | SS4 | SS5 | SS6 | SS7 | SS8 |
|---|---|---|---|---|---|---|---|---|
| BFS/% | 10 | 20 | ||||||
| Alkali/% | 16 | 18 | 20 | 22 | 16 | 18 | 20 | 22 |
| Modulus | 0.4 | 0.6 | 0.8 | 1.0 | 0.6 | 0.4 | 1.0 | 0.8 |
| Sample No. | SS9 | SS10 | SS11 | SS12 | SS13 | SS14 | SS15 | SS16 |
| BFS/% | 30 | 40 | ||||||
| Alkali/% | 16 | 18 | 20 | 22 | 16 | 18 | 20 | 22 |
| Modulus | 0.8 | 1.0 | 0.4 | 0.6 | 1.0 | 0.8 | 0.6 | 0.4 |
| Sample No. | SS17 | SS18 | SS14 | SS19 | SS20 | SS21 | SS22 | SS15 | SS23 |
|---|---|---|---|---|---|---|---|---|---|
| Alkali/% | 18 | 18 | 18 | 18 | 18 | 18 | 20 | 20 | 20 |
| Modulus | 0.4 | 0.6 | 0.8 | 1.0 | 1.2 | 1.4 | 0.4 | 0.6 | 0.8 |
| Sample No. | SS24 | SS25 | SS26 | SS16 | SS27 | SS28 | SS29 | SS30 | SS31 |
| Alkali/% | 20 | 20 | 20 | 22 | 22 | 22 | 22 | 22 | 22 |
| Modulus | 1.0 | 1.2 | 1.4 | 0.4 | 0.6 | 0.8 | 1.0 | 1.2 | 1.4 |
| Strength | Expectation Analysis Result and Optimum Combination of Influencing Factors | Fratio | Fcritical | Significance | ||||
|---|---|---|---|---|---|---|---|---|
| A | B | C | A | B | C | |||
| 3d compressive | A > B > C; A4B3C2 | 4.867 | 1.482 | 1.173 | F0.1 = 3.29 F0.05 = 4.76 F0.01 = 9.78 | ** | - | - |
| 3d flexural | A > B > C; A4B3C2 | 6.324 | 3.615 | 2.052 | ** | * | - | |
| 7d compressive | A > B > C; A4B3C2 | 5.667 | 1.787 | 0.870 | ** | - | - | |
| 7d flexural | A > B > C; A4B4C2 | 5.505 | 2.625 | 1.817 | ** | - | - | |
| 28d compressive | A > B > C; A4B2C2 | 4.152 | 1.606 | 0.358 | * | - | - | |
| 28d flexural | A > B > C; A4B4C2/A4B4C1 | 5.749 | 3.526 | 1.918 | ** | * | - | |
| Geopolymer | F(3,7)/F(28) | Na2SiO3 Modulus | |||||
|---|---|---|---|---|---|---|---|
| 0.4 | 0.6 | 0.8 | 1.0 | 1.2 | 1.4 | ||
| 18% SS | F3/F28 | 0.41 | 0.51 | 0.57 | 0.65 | 0.21 | 0.04 |
| F7/F28 | 0.67 | 0.55 | 0.64 | 0.91 | 0.89 | 0.8 | |
| 20% SS | F3/F28 | 0.51 | 0.64 | 0.57 | 0.55 | 0.40 | 0.28 |
| F7/F28 | 0.63 | 0.79 | 0.86 | 0.85 | 0.86 | 0.74 | |
| 22% SS | F3/F28 | 0.54 | 0.60 | 0.57 | 0.49 | 0.49 | 0.5 |
| F7/F28 | 0.60 | 0.65 | 0.84 | 0.82 | 0.82 | 0.81 | |
| Geopolymer | F(3,7)/F(28) | Na2SiO3 Modulus | |||||
|---|---|---|---|---|---|---|---|
| 0.4 | 0.6 | 0.8 | 1.0 | 1.2 | 1.4 | ||
| 18% SS | F3/F28 | 0.78 | 0.8 | 0.54 | 0.59 | 0.38 | 0.06 |
| F7/F28 | 0.80 | 0.89 | 0.97 | 0.88 | 0.64 | 0.66 | |
| 20% SS | F3/F28 | 0.63 | 0.92 | 0.82 | 0.86 | 0.72 | 0.71 |
| F7/F28 | 0.77 | 0.98 | 0.84 | 0.90 | 0.76 | 0.73 | |
| 22% SS | F3/F28 | 0.79 | 0.62 | 0.72 | 0.76 | 0.66 | 0.50 |
| F7/F28 | 0.87 | 0.87 | 0.93 | 0.8 | 0.82 | 0.81 | |
| Grade | Standard | Brittleness | Toughness |
|---|---|---|---|
| C25 | SS22 (20% alkali, M0.4) | SS17 (18% alkali, M0.4) | |
| C30 | SS18, SS20 (18% alkali, M0.6, M1.2) | SS21, SS26, SS31 (18–22% alkali, M1.4) | SS16, SS27 (22% alkali M0.4–M0.6) |
| C35 | SS19, SS24, SS28 (18–22% alkali, M1–M0.8) | SS25, SS29 (20–22% alkali, M1–1.2) | SS30 (22% alkali, M1.2) |
| C40 | SS15, SS23 (20% alkali, M0.6–M0.8) | ||
| C45 | SS14 (18% alkali, M0.8) |
| Element | O | Si | Ca | Al | Na | Mg | Ca/(Si + Al) | Ca/Si | Si/Al | (Ca + Na)/(Si + Al) |
|---|---|---|---|---|---|---|---|---|---|---|
| SS14 | 65.2 | 12.9 | 10.0 | 5.6 | 5.1 | 1.2 | 0.54 | 0.78 | 2.30 | 0.73 |
| SS15 | 67.3 | 12.7 | 9.1 | 5.6 | 5.3 | - | 0.50 | 0.72 | 2.27 | 0.83 |
Publisher’s Note: MDPI stays neutral with regard to jurisdictional claims in published maps and institutional affiliations. |
© 2022 by the authors. Licensee MDPI, Basel, Switzerland. This article is an open access article distributed under the terms and conditions of the Creative Commons Attribution (CC BY) license (https://creativecommons.org/licenses/by/4.0/).
Share and Cite
Yang, X.; Zhang, Y.; Lin, C. Compressive and Flexural Properties of Ultra-Fine Coal Gangue-Based Geopolymer Gels and Microscopic Mechanism Analysis. Gels 2022, 8, 145. https://doi.org/10.3390/gels8030145
Yang X, Zhang Y, Lin C. Compressive and Flexural Properties of Ultra-Fine Coal Gangue-Based Geopolymer Gels and Microscopic Mechanism Analysis. Gels. 2022; 8(3):145. https://doi.org/10.3390/gels8030145
Chicago/Turabian StyleYang, Xiaoyun, Yan Zhang, and Cheng Lin. 2022. "Compressive and Flexural Properties of Ultra-Fine Coal Gangue-Based Geopolymer Gels and Microscopic Mechanism Analysis" Gels 8, no. 3: 145. https://doi.org/10.3390/gels8030145