
Design and Development of Neomycin Sulfate Gel Loaded with Solid Lipid Nanoparticles for Buccal Mucosal Wound Healing

 ,
,  , , ,
, , ,  , , , , ,
Abstract
:1. Introduction
2. Results and Discussion
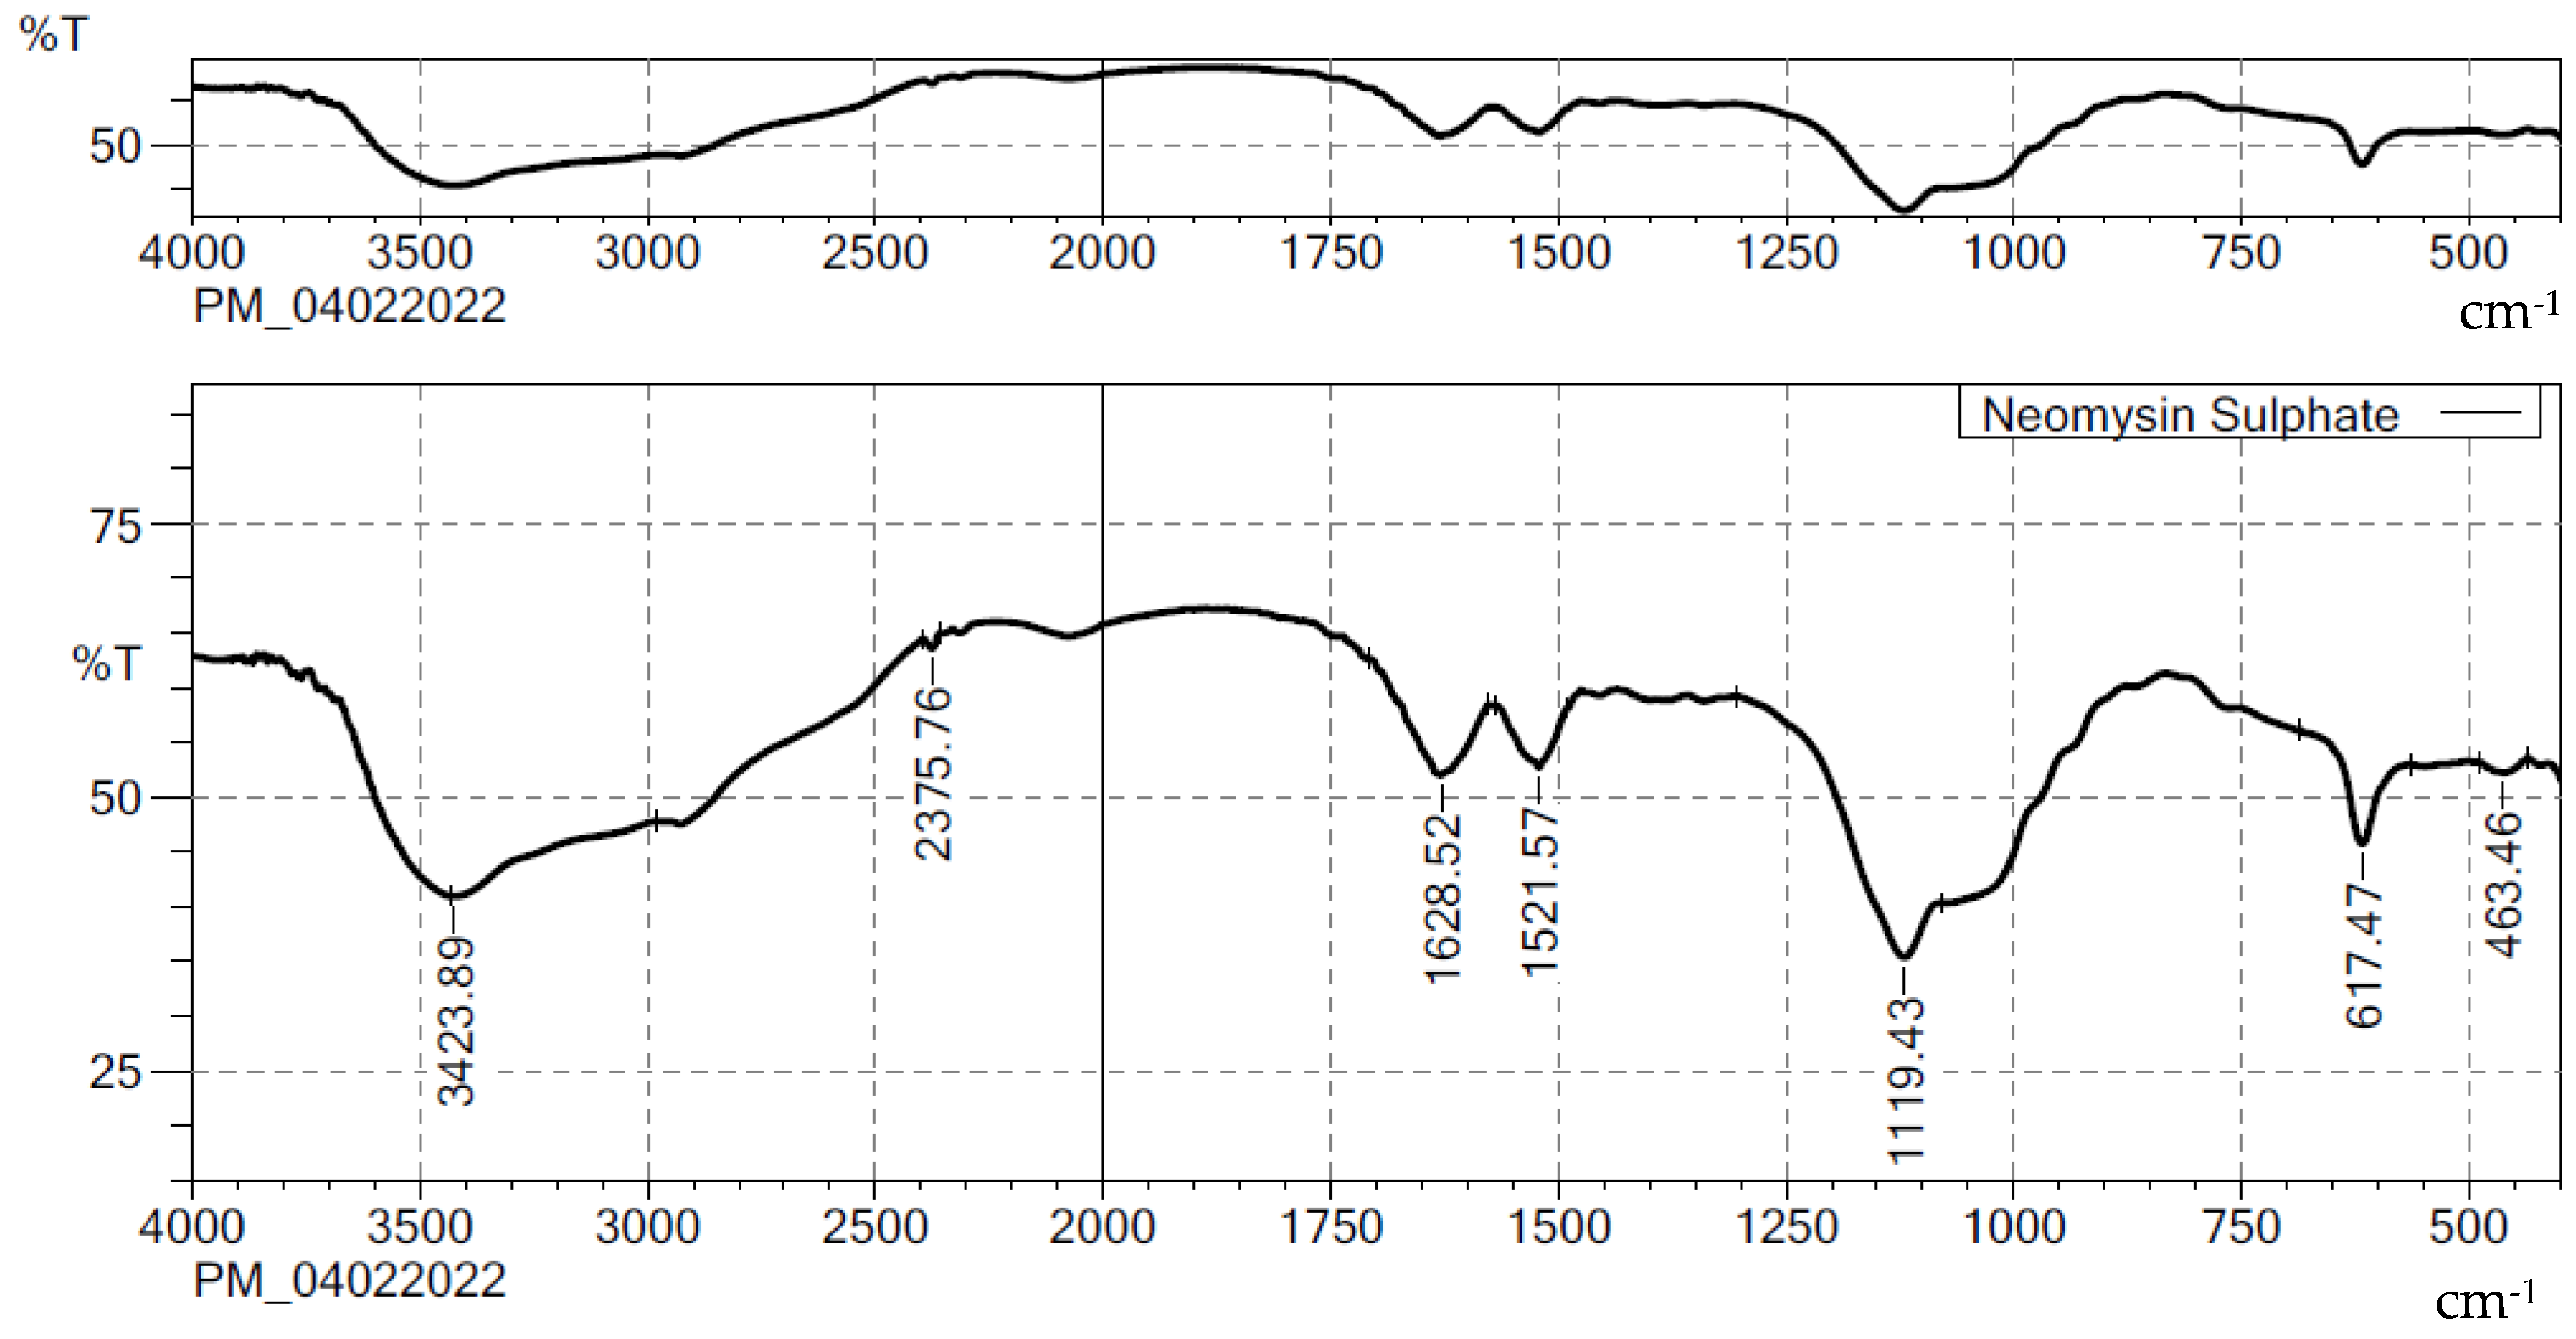
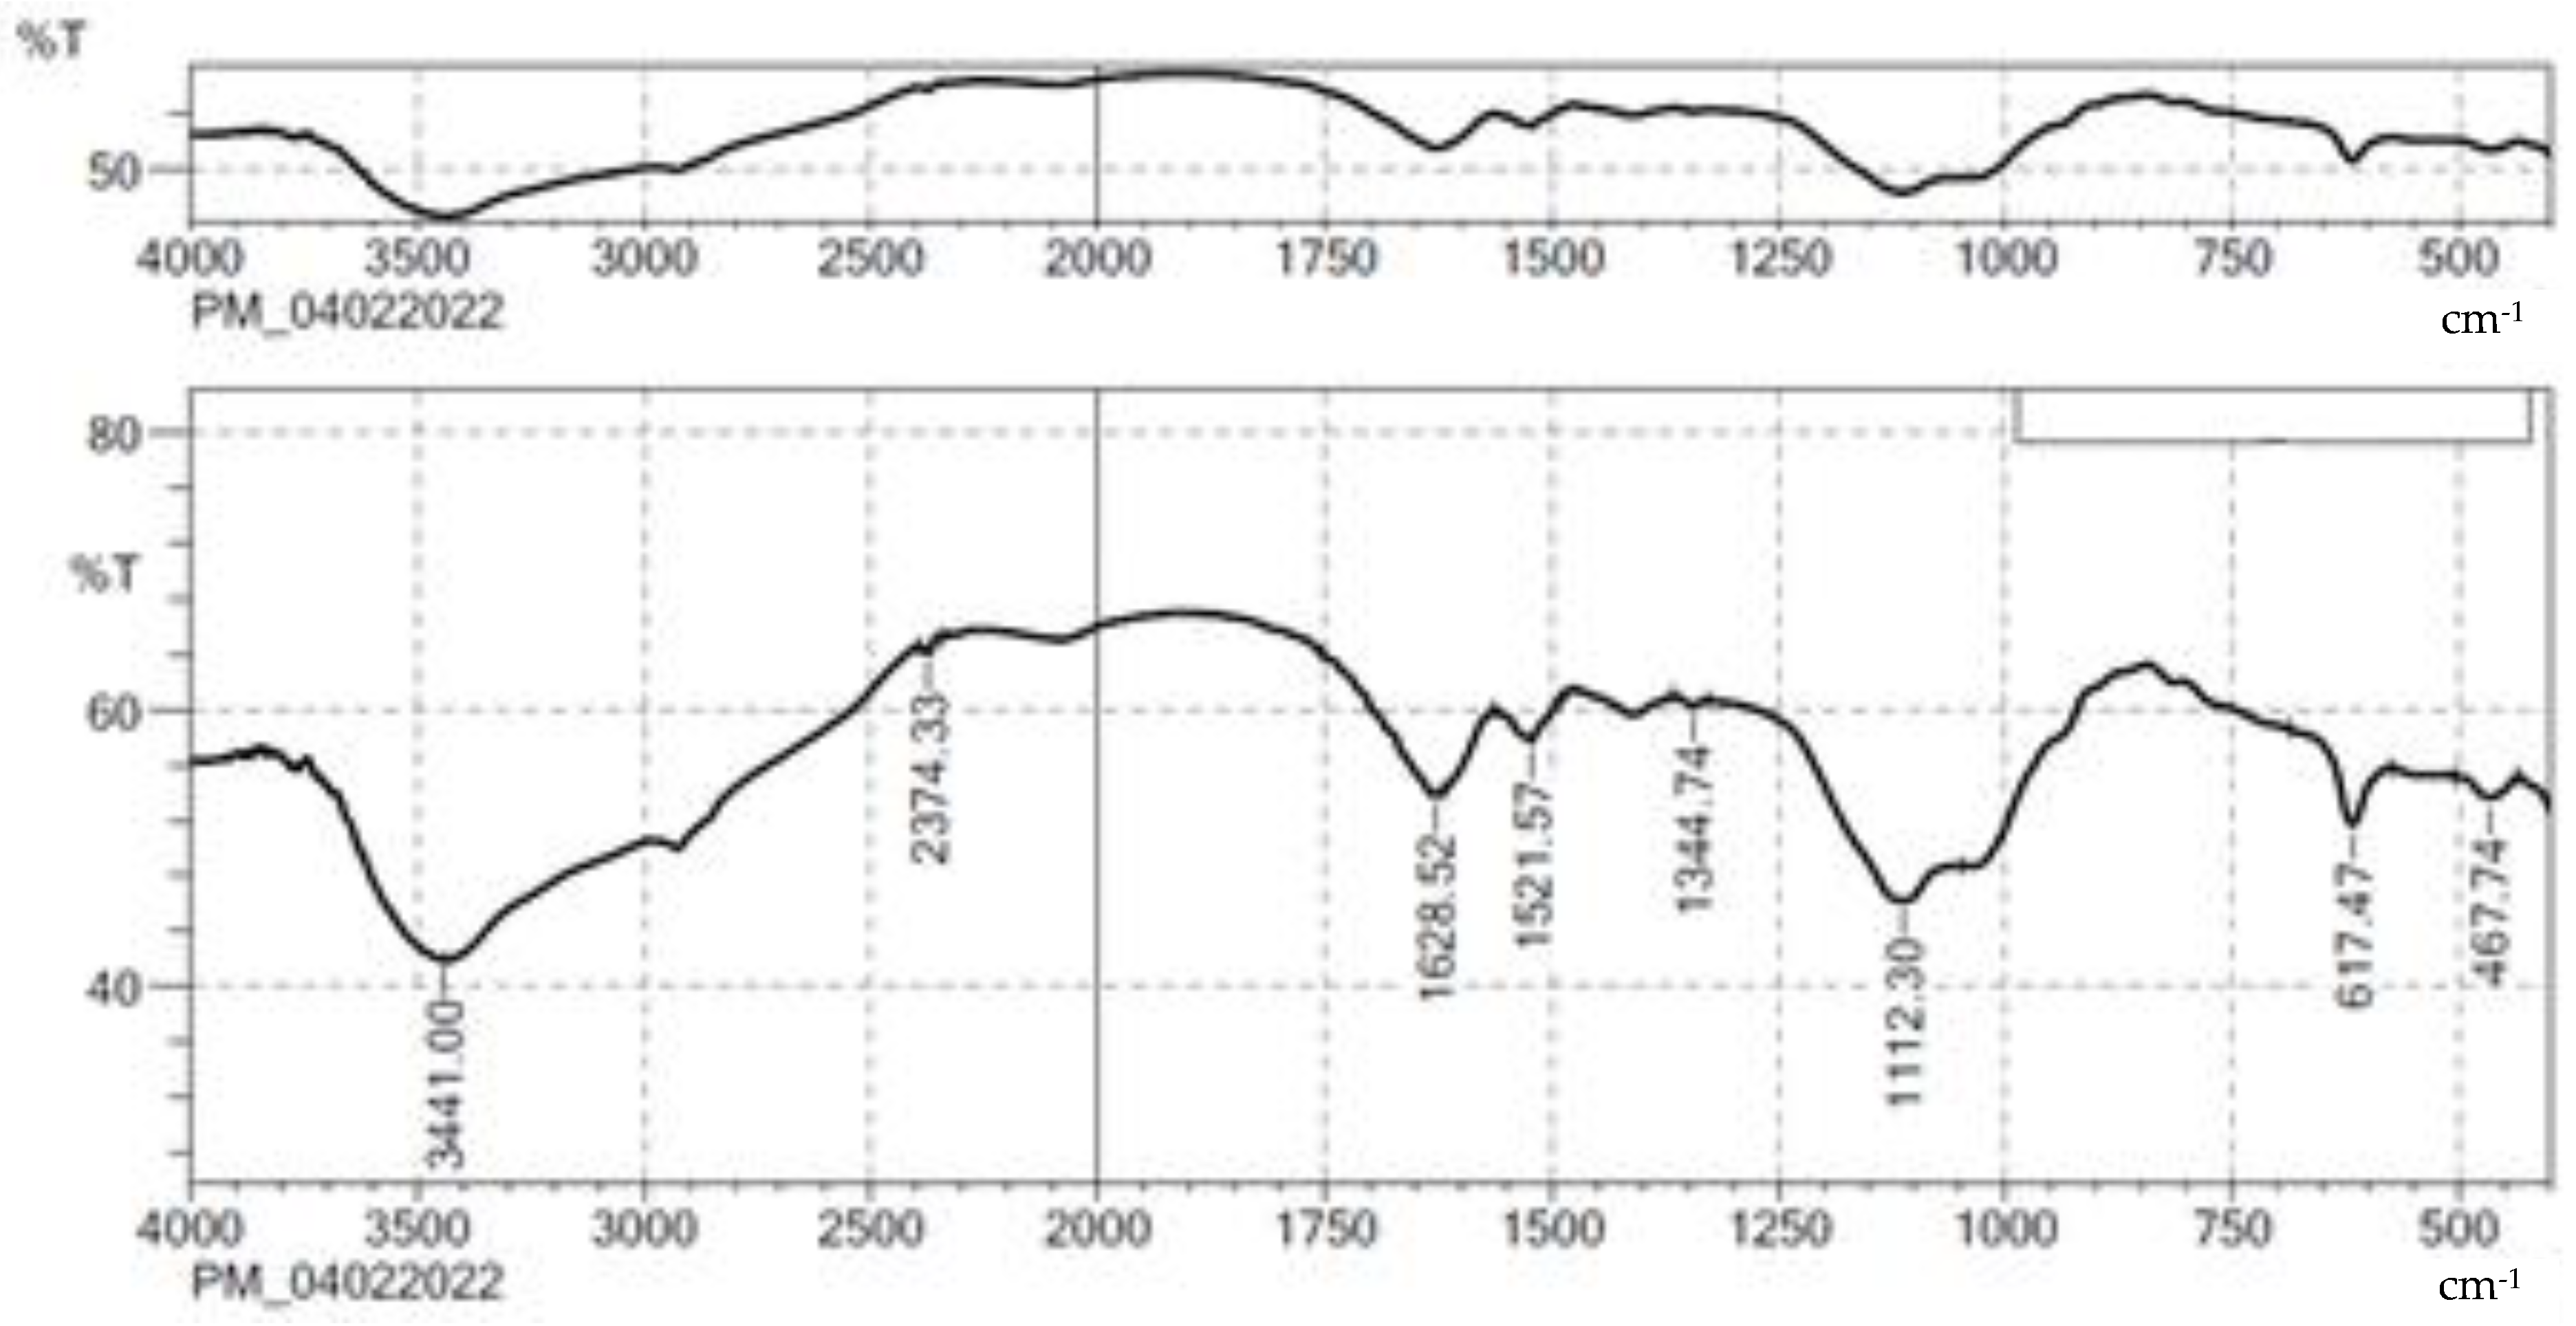
2.1. Compatibility Studies
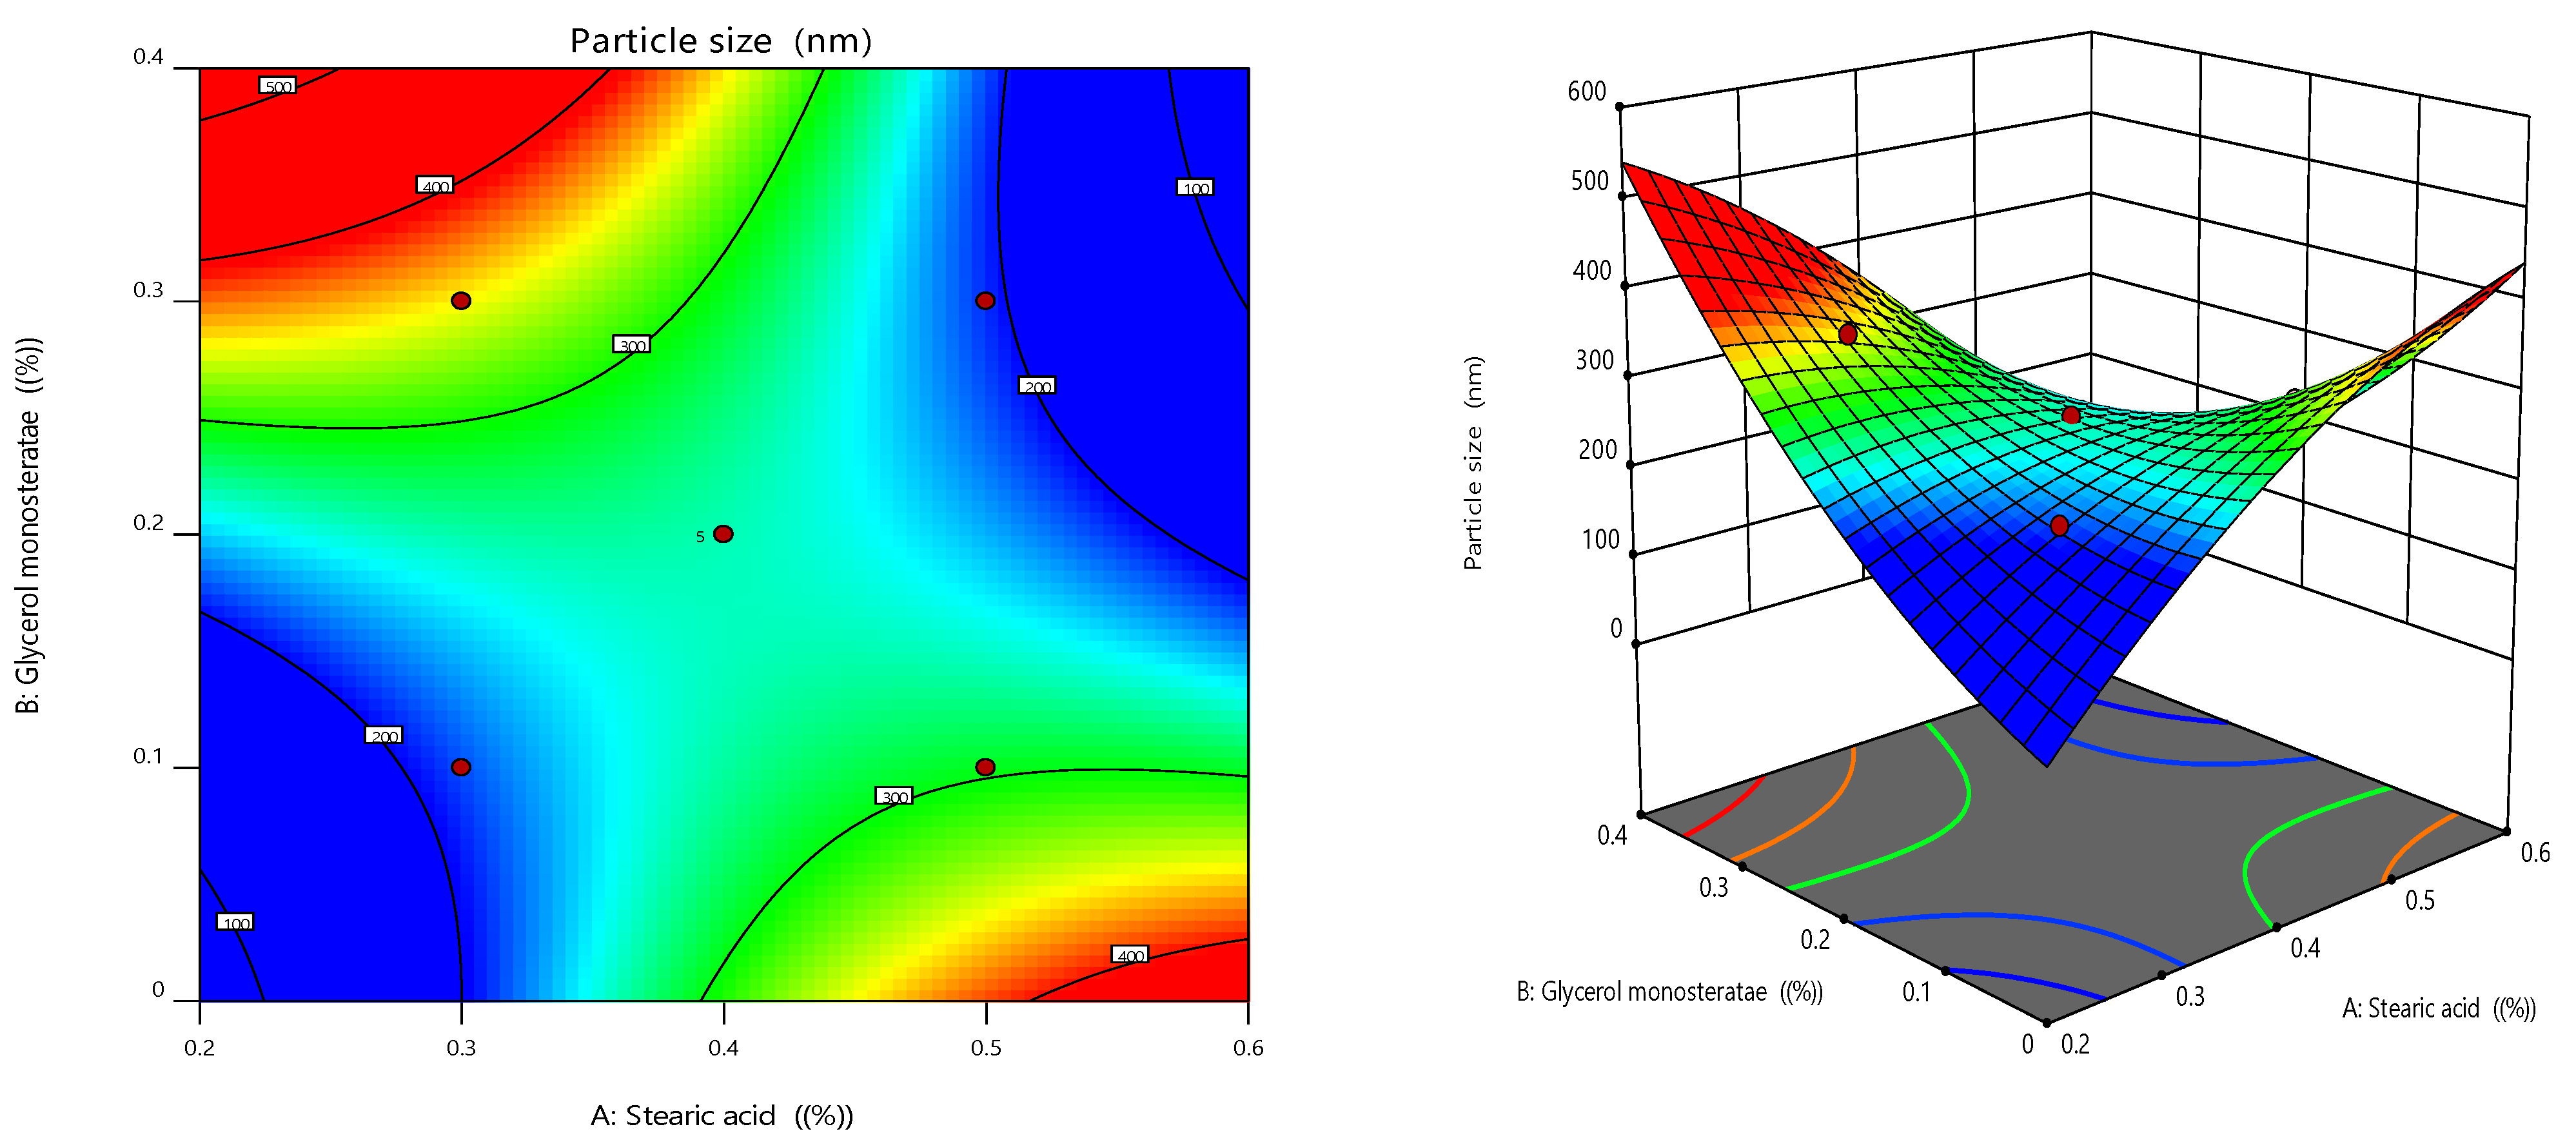
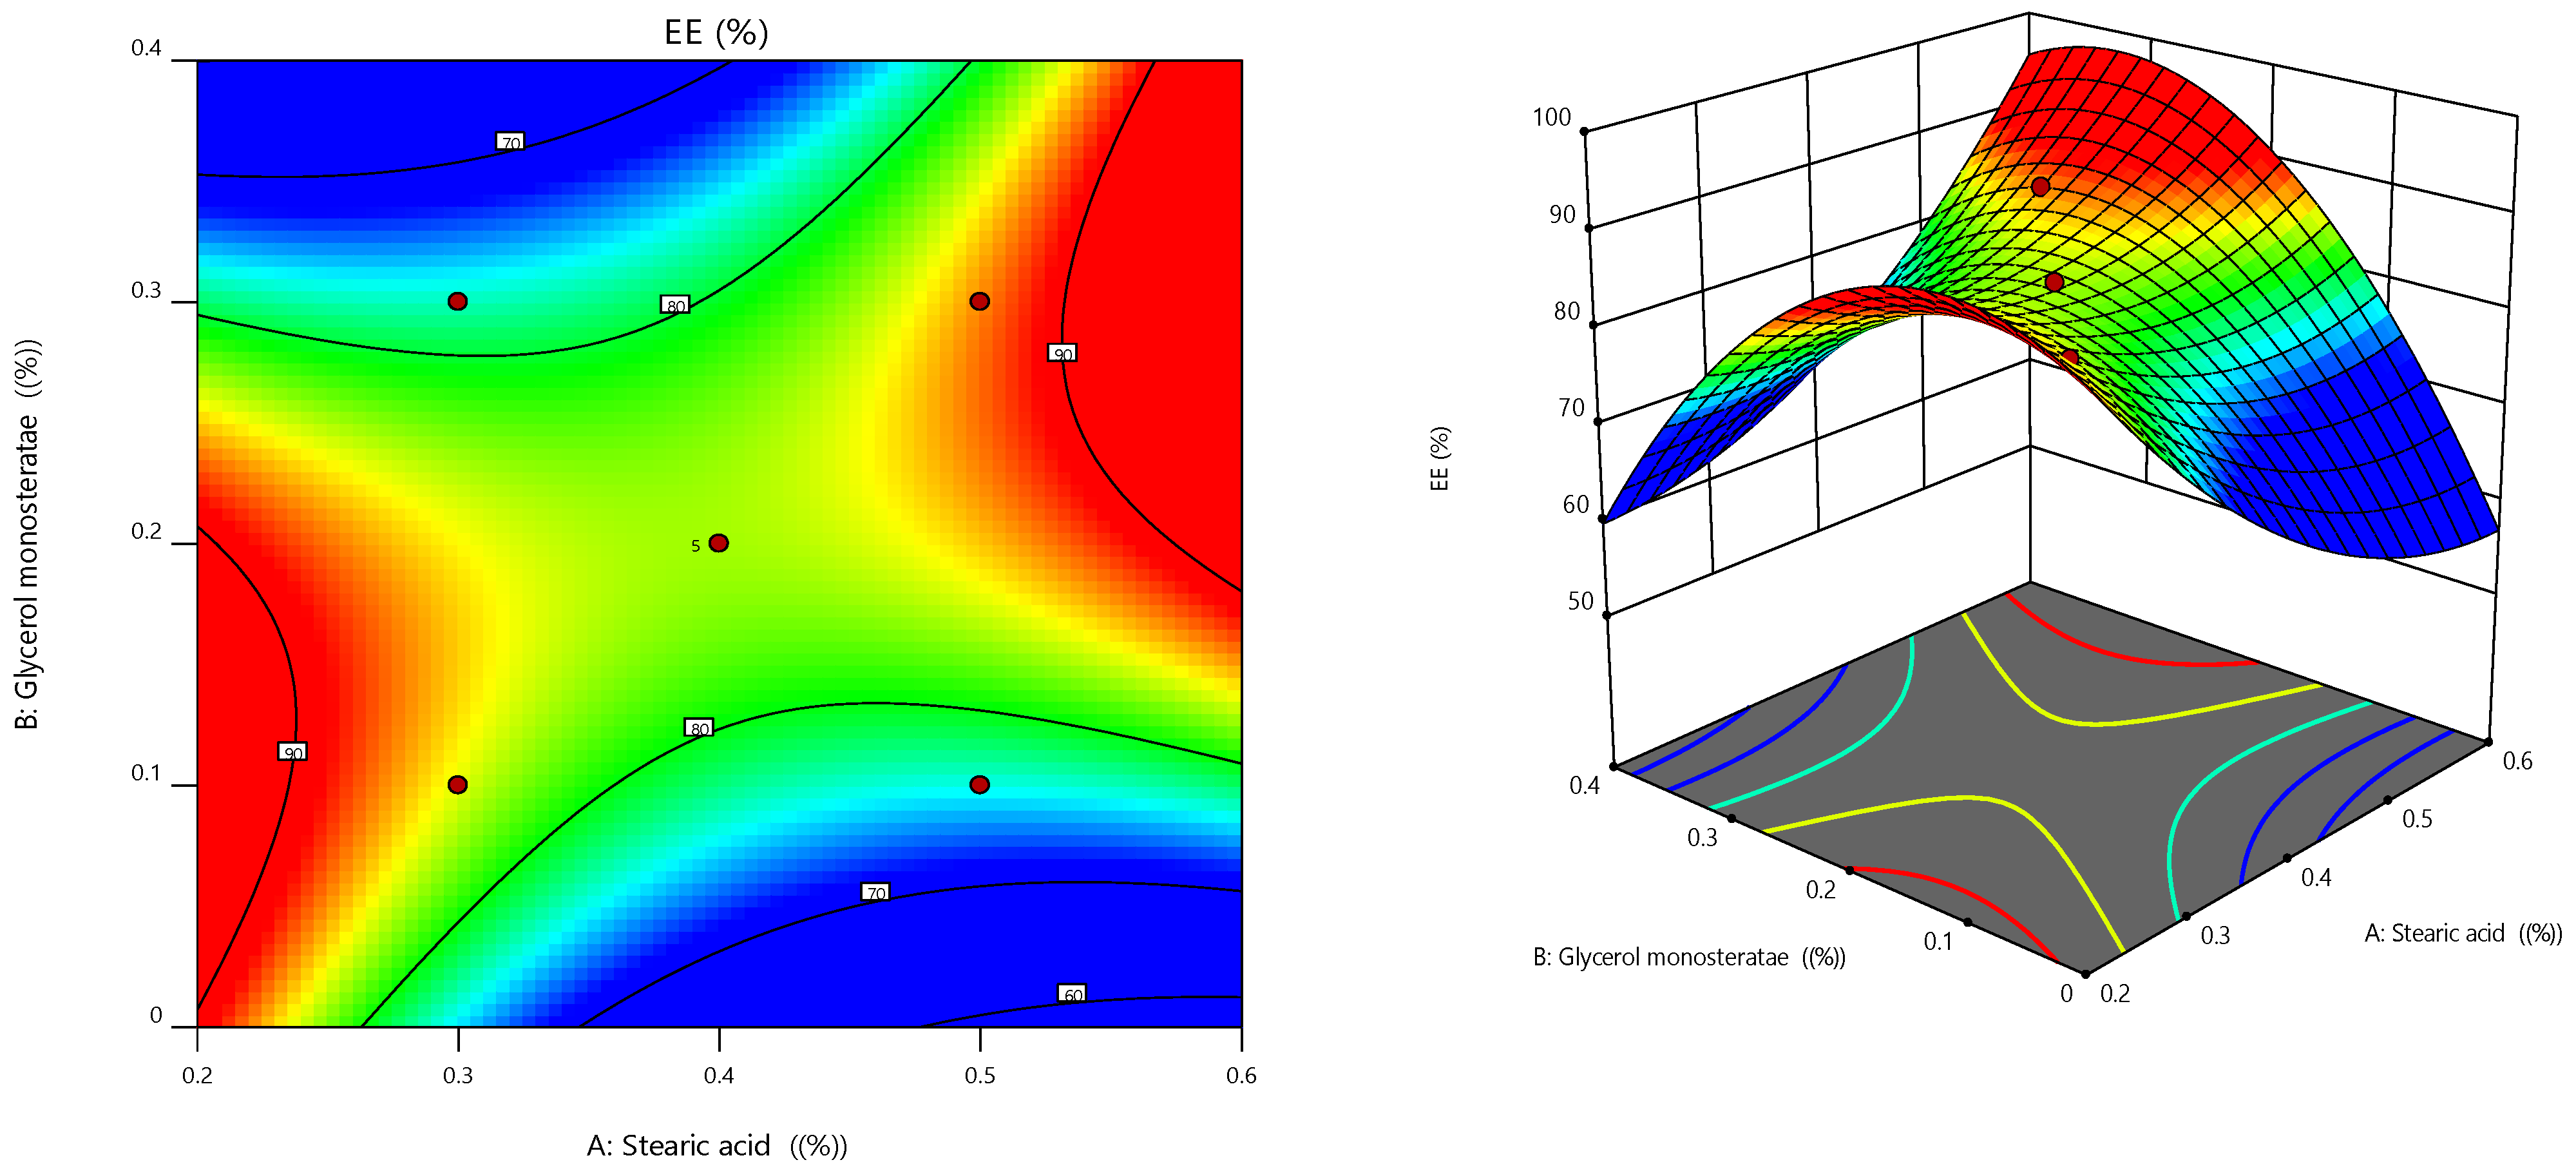
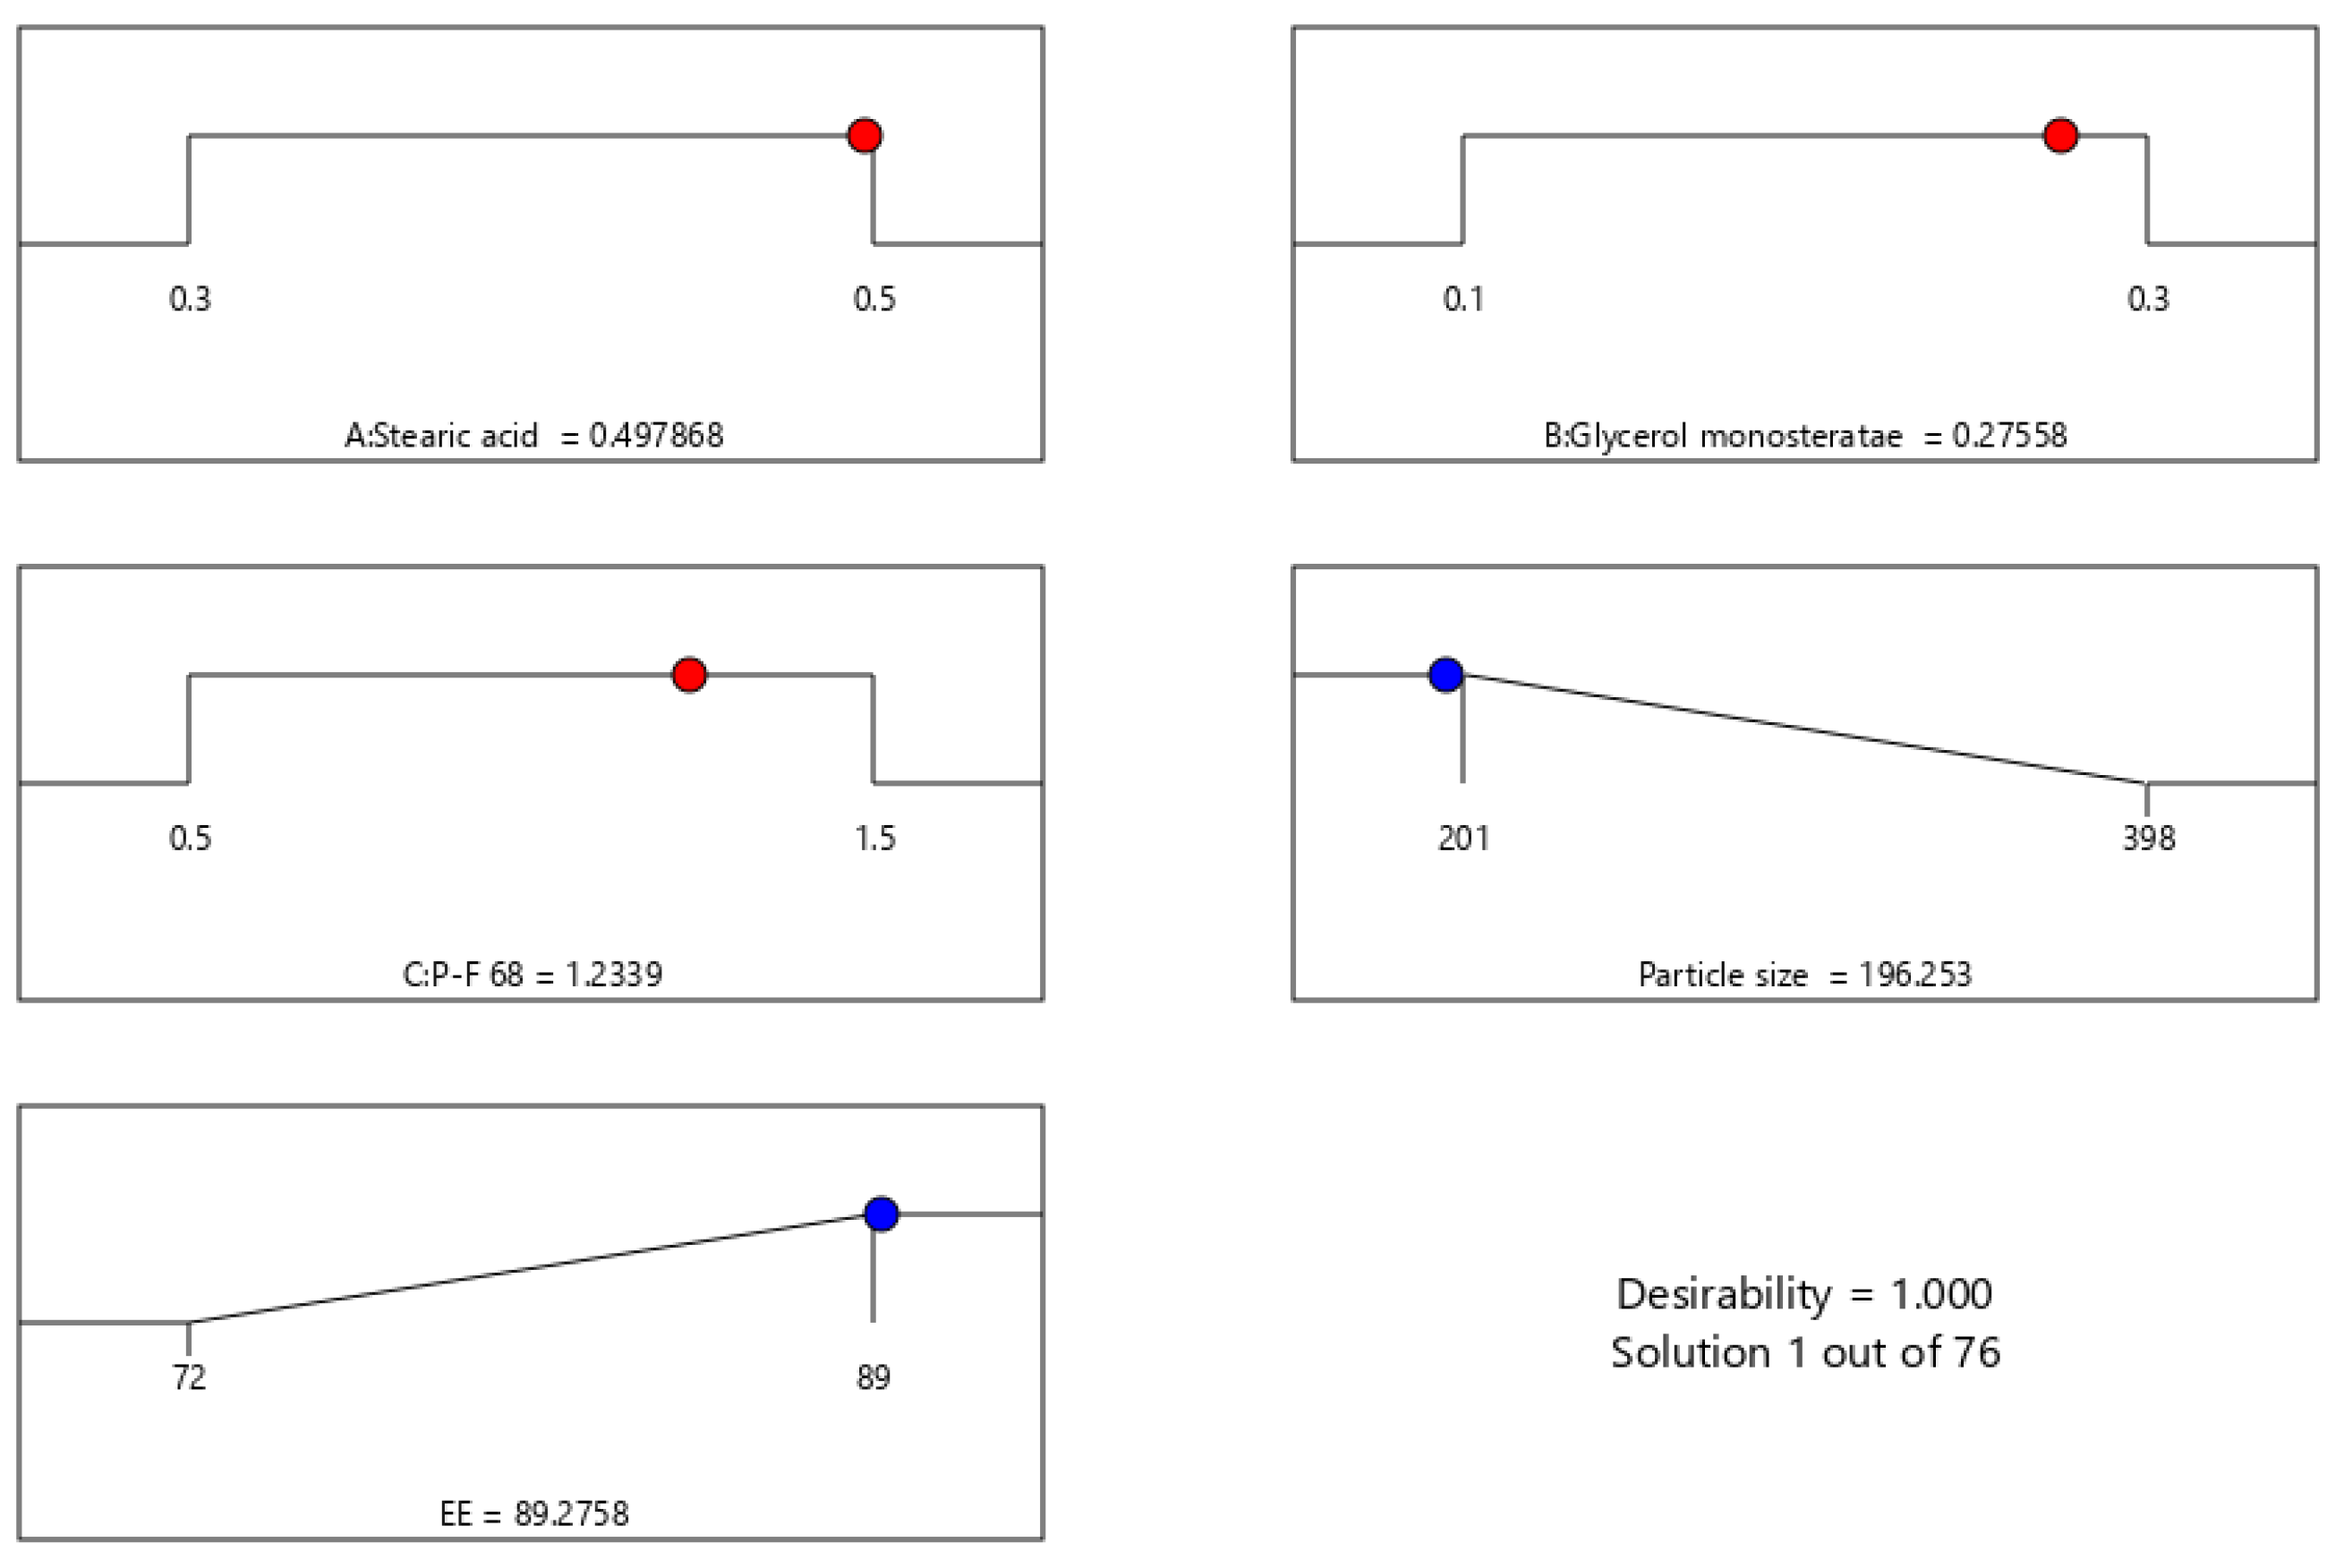
2.2. Optimization of Preparation of NES-SLN
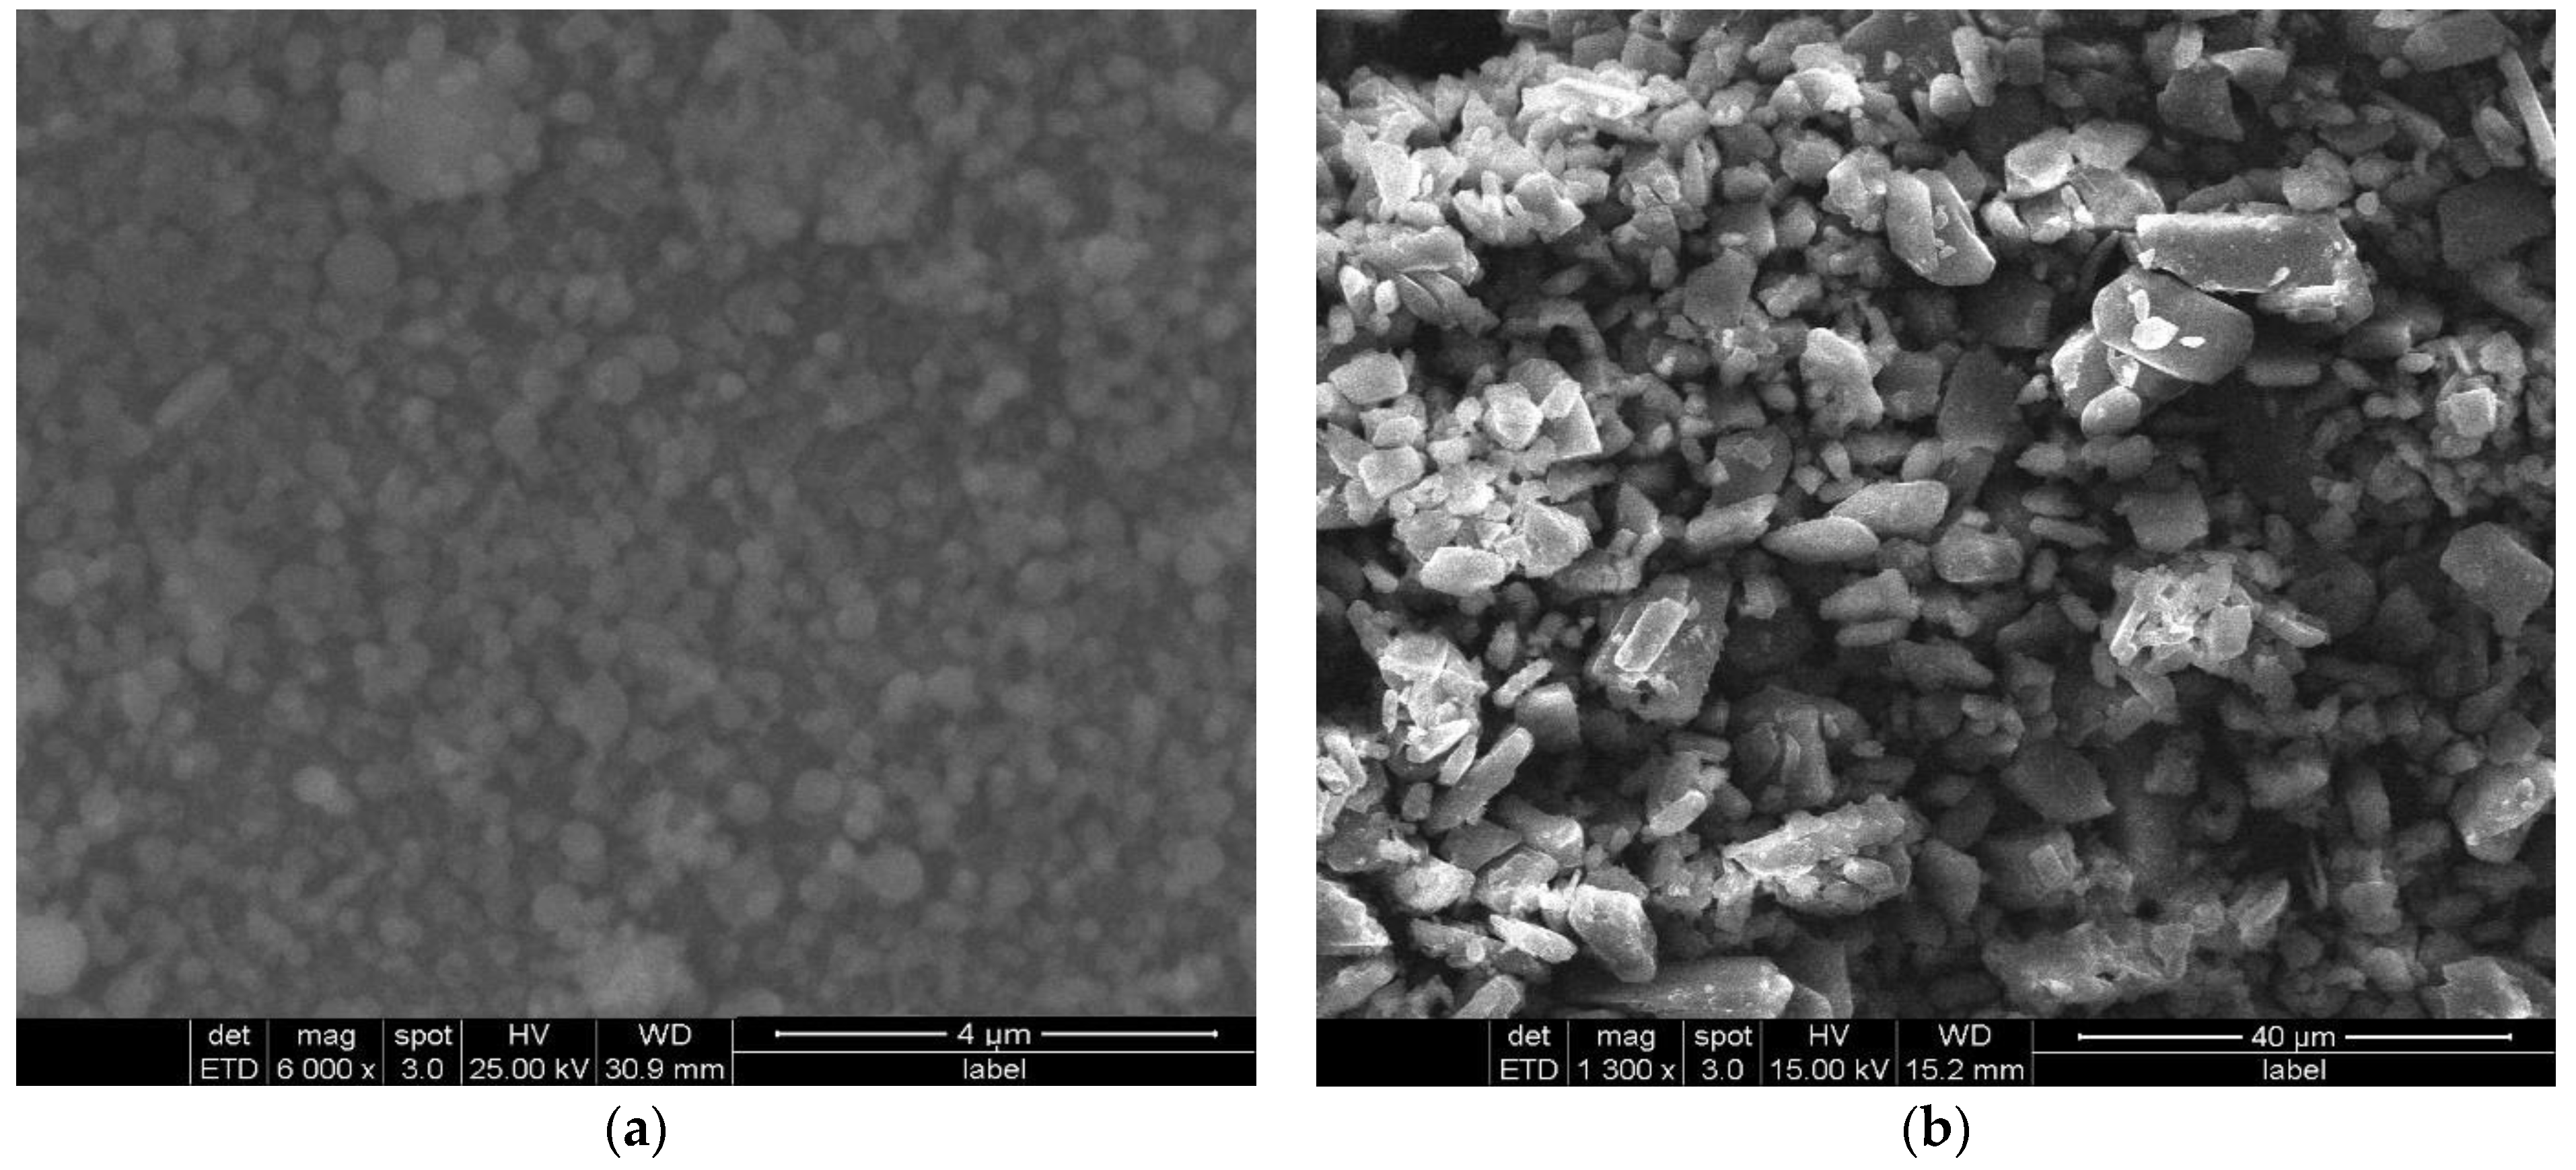
2.3. Formulation and Characterization of NES-SLN-G
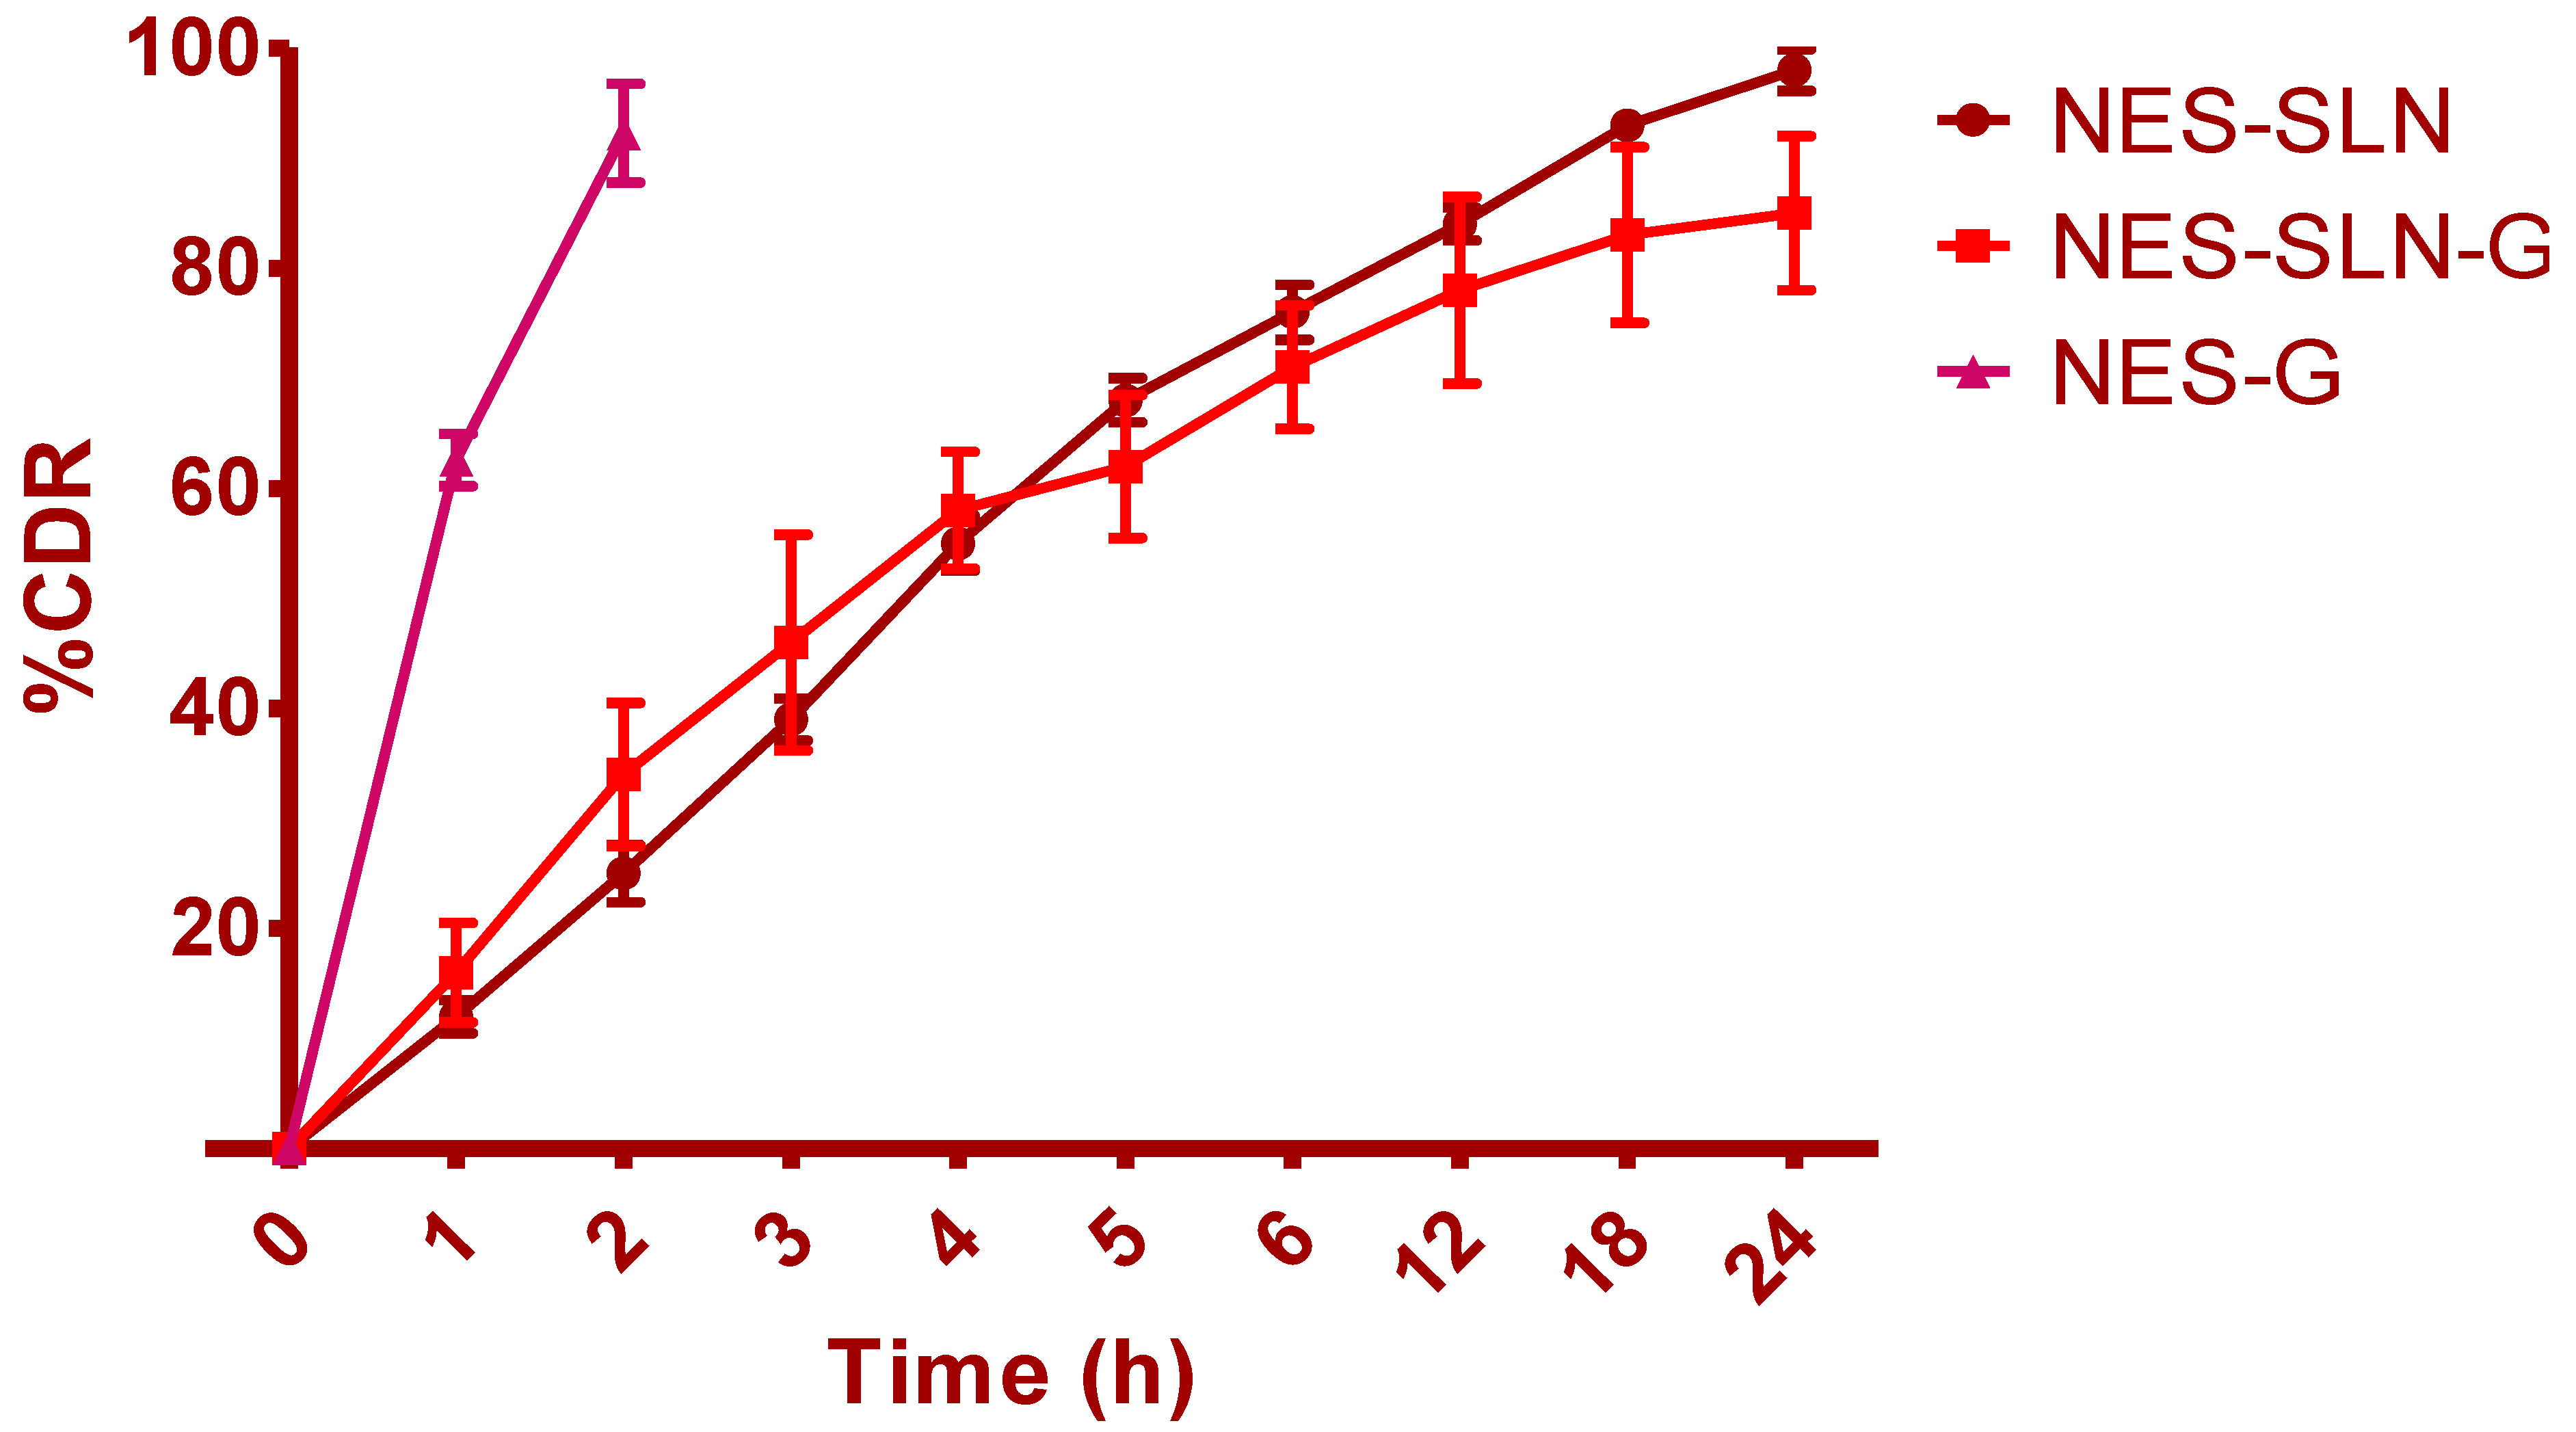
2.4. Ex Vivo Drug Release Studies
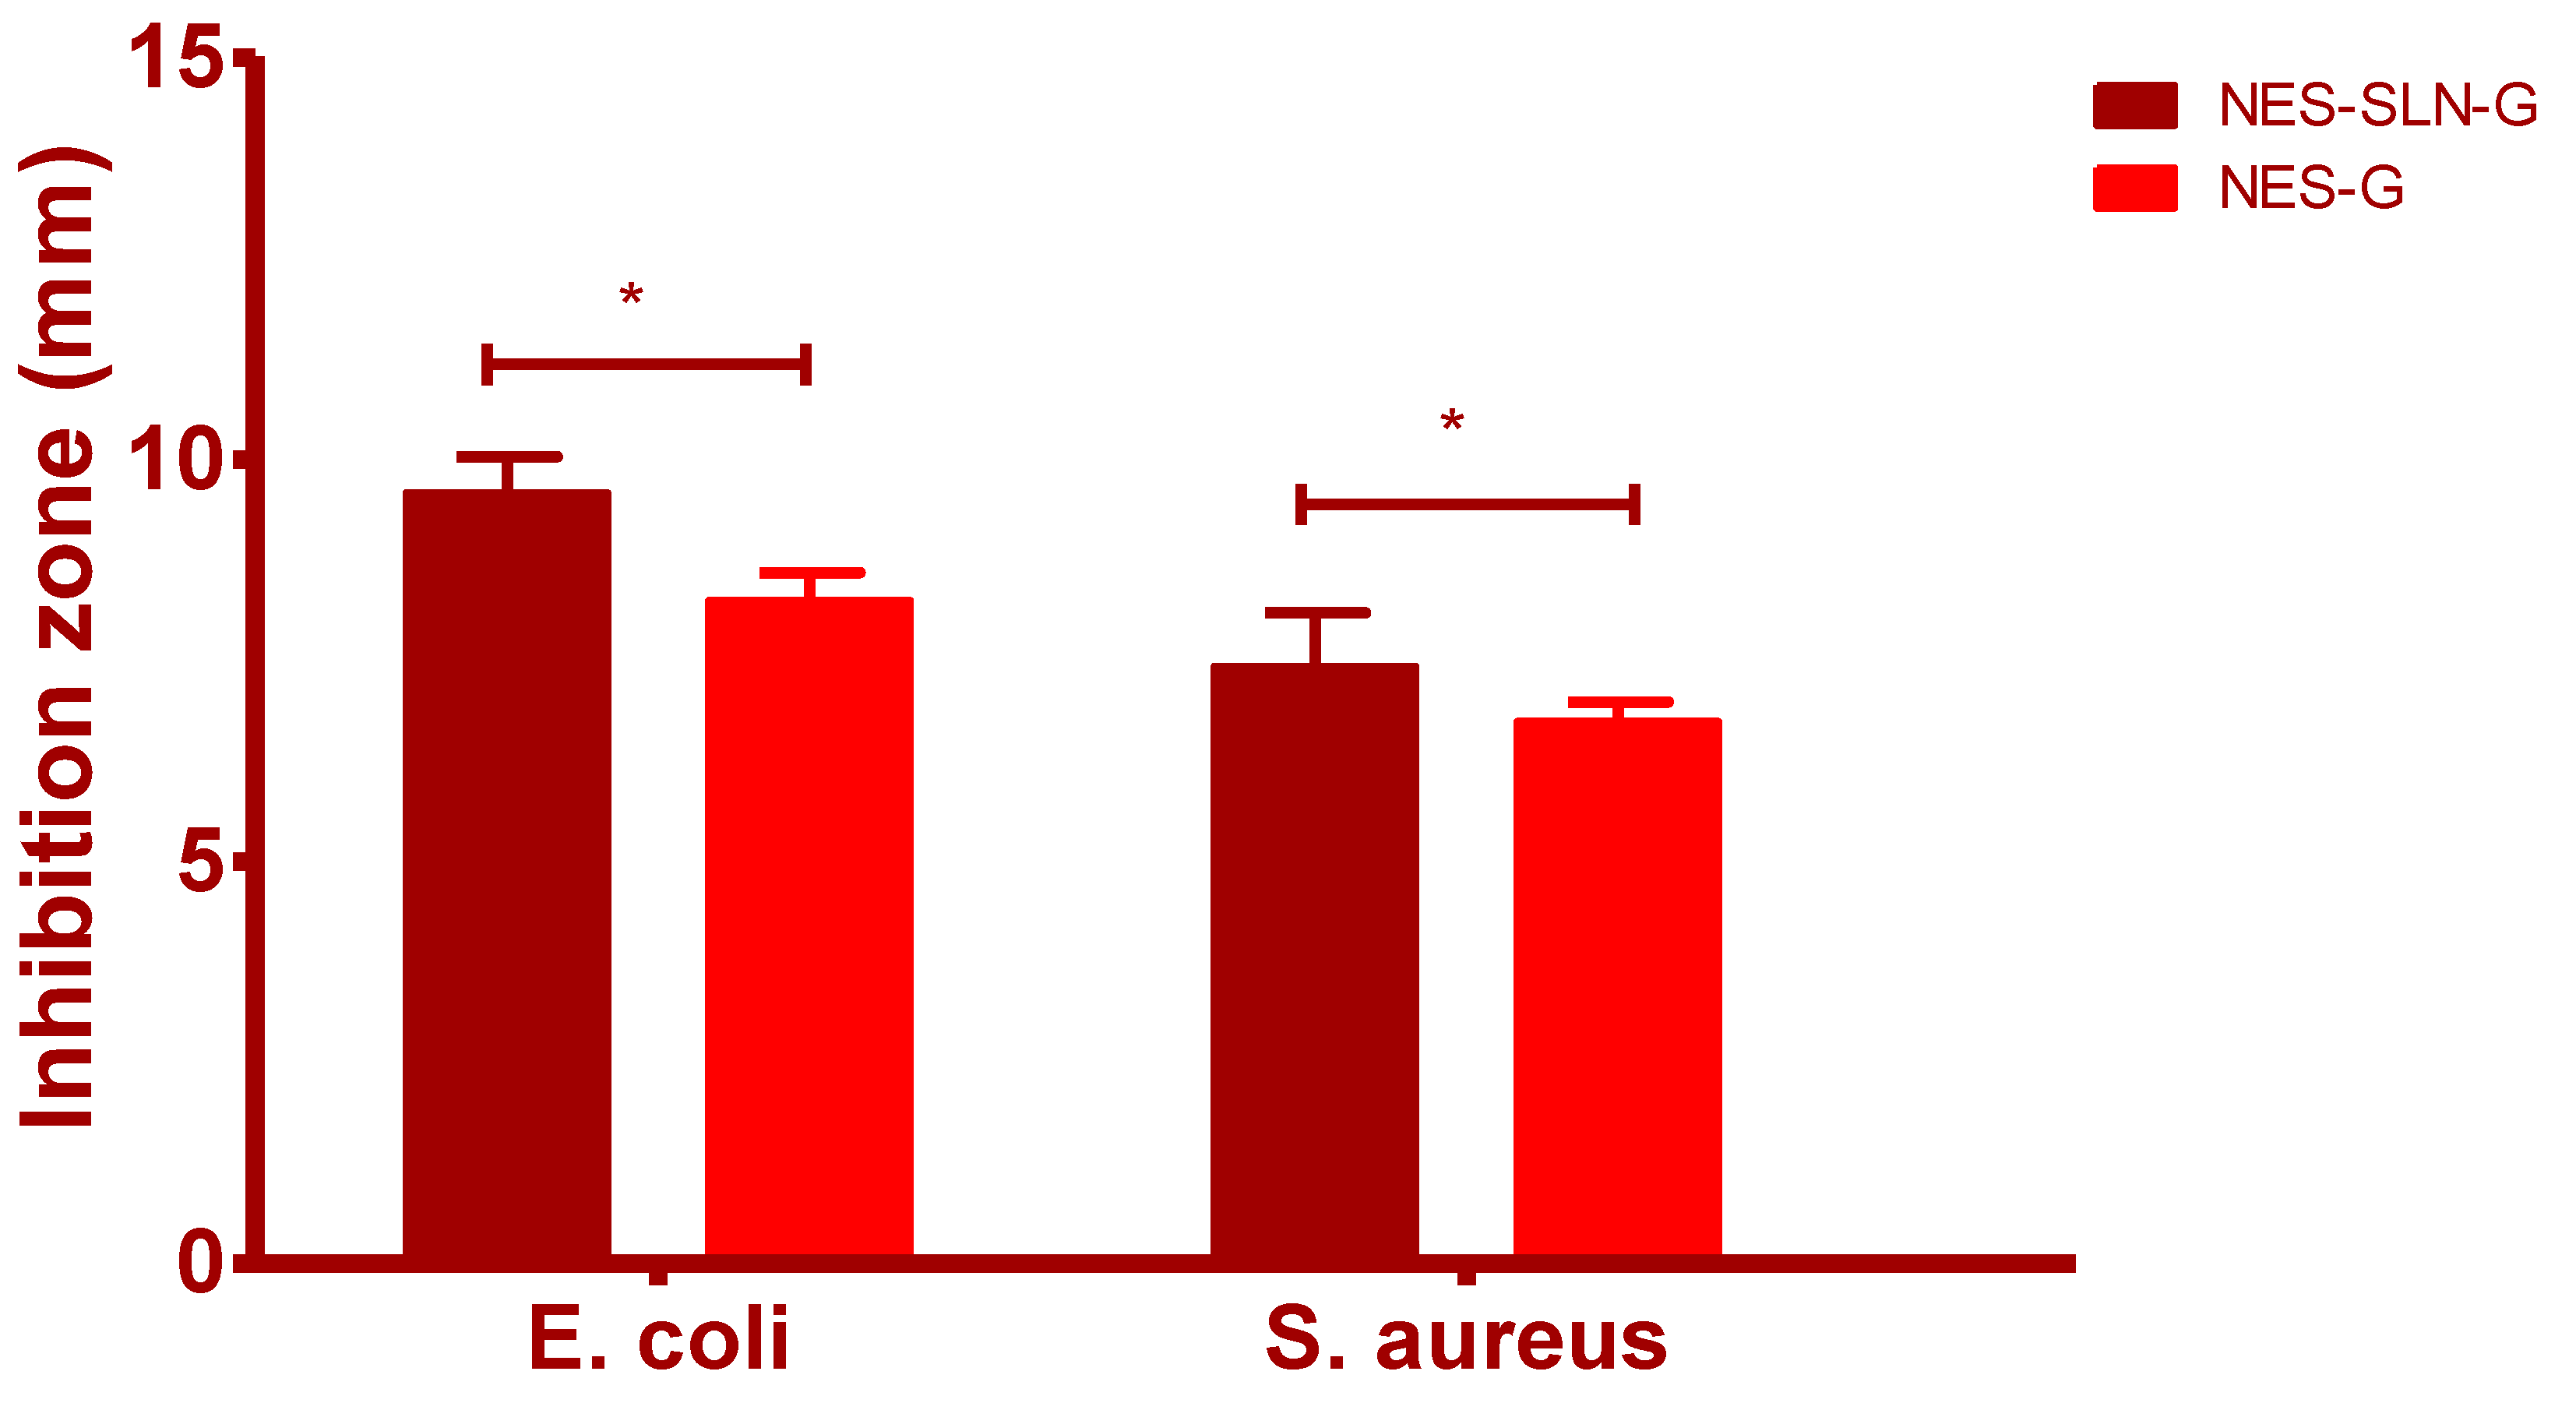
2.5. In Vitro Antimicrobial Activity Assessment
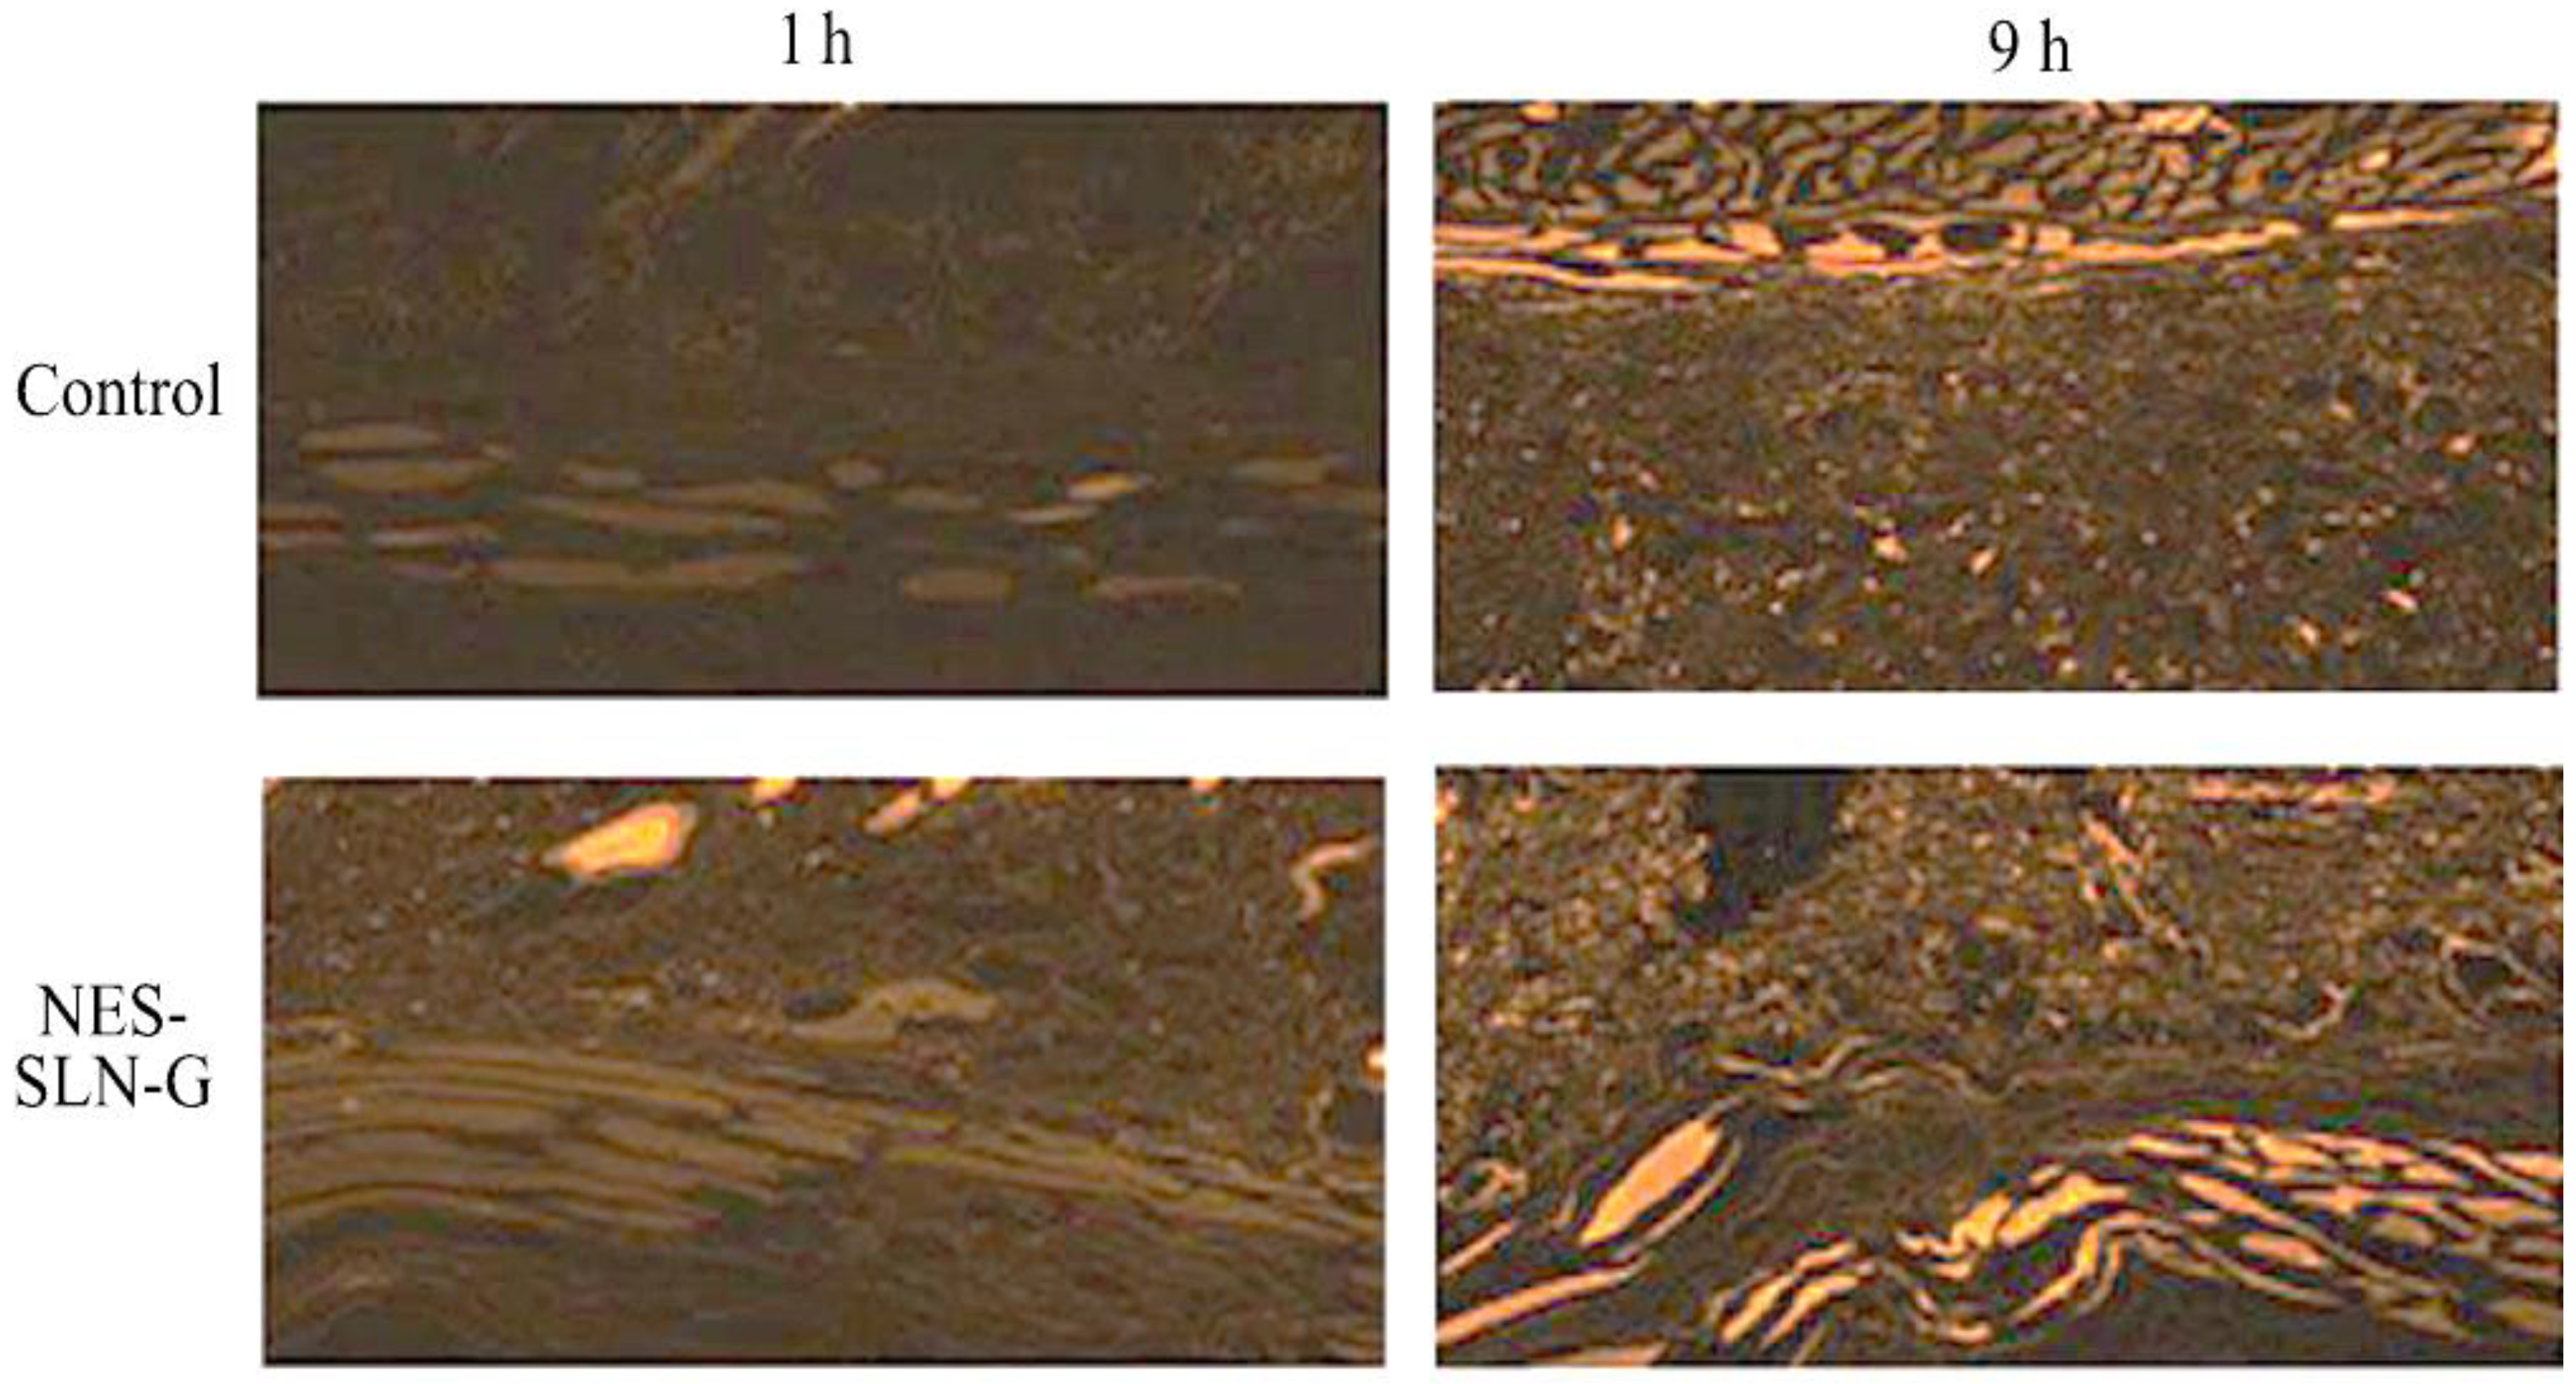
2.6. Confocal Laser Scanning Microscope Study
2.7. Stability Studies
3. Materials and Methods
3.1. Materials
3.2. Compatibility Studies by FTIR
3.3. Formulation of SLNs of NES (NES-SLN)
3.4. Characterization of NES-SLN
3.4.1. Determination of Particle Size
3.4.2. Entrapment Efficacy (EE)
3.5. Validation and Standardization of Optimization Results
3.6. Preparation of Gel (NES-SLN-G)
3.7. Physicochemical Characterization of Gel
3.7.1. Particle Size and Polydispersity Index
3.7.2. Zeta Potential
3.7.3. Structural Analysis
3.7.4. Density
3.7.5. Surface Tension
- γ1: Surface tension of dispersion;
- γ2: Surface tension of water;
- δ1: Density of dispersion;
- δ2: Density of water;
- n1: Number of drops of SLNs;
- n2: Number of drops of deionized water.
3.7.6. Viscosity
3.7.7. Determination of pH and Spreadability
- S = Spreadability of gel,
- M = Weight (g) applied on the upper plate,
- L = Length (cm) of the glass plates,
- T = Time taken for plates to slide the entire length
3.8. Ex Vivo Permeation Study
3.9. In Vitro Antimicrobial Activity Assessment
3.10. Confocal Laser Scanning Microscope (CLSM) Study
3.11. Stability Study
4. Conclusions
Author Contributions
Funding
Data Availability Statement
Acknowledgments
Conflicts of Interest
References
- Zhang, D.; Zhou, W.; Wei, B.; Wang, X.; Tang, R.; Nie, J.; Wang, J. Carboxyl-modified poly(vinyl alcohol)-crosslinked chitosan hydrogel films for potential wound dressing. Carbohydr. Polym. 2015, 125, 189–199. [Google Scholar] [CrossRef] [PubMed]
- Van Leen, M.; Rondas, A.; Neyens, J.; Cutting, K.; Schols, J.M.G.A. Influence of superabsorbent dressings on non-healing ulcers: A multicentre case series from the Netherlands and the UK. J. Wound Care 2014, 23, 543–550. [Google Scholar] [CrossRef] [PubMed]
- Chang, G.; Chen, Y.; Li, Y.; Li, S.; Huang, F.; Shen, Y.; Xie, A. Self-healable hydrogel on tumor cell as drug delivery system for localized and effective therapy. Carbohydr. Polym. 2015, 122, 336–342. [Google Scholar] [CrossRef] [PubMed]
- Lee, J.H.; Lim, S.J.; Oh, D.H.; Ku, S.K.; Li, D.X.; Yong, C.S.; Choi, H.G. Wound healing evaluation of sodium fucidate-loaded polyvinylalcohol/sodium carboxymethylcellulose-based wound dressing. Arch. Pharm. Res. 2010, 33, 1083–1089. [Google Scholar] [CrossRef] [PubMed]
- Choi, Y.K.; Din, F.U.; Kim, D.W.; Kim, Y.I.; Kim, J.O.; Ku, S.K.; Ra, J.C.; Huh, J.W.; Lee, J.I.; Sohn, D.H.; et al. Amniotic membrane extract-loaded double-layered wound dressing: Evaluation of gel properties and wound healing. Drug Dev. Ind. Pharm. 2014, 40, 852–859. [Google Scholar] [CrossRef]
- Chakavala, S.R.; Patel, N.G.; Pate, N.V.; Thakkar, V.T.; Patel, K.V.; Gandhi, T.R. Development and in vivo evaluation of silver sulfadiazine loaded hydrogel consisting polyvinyl alcohol and chitosan for severe burns. J. Pharm. Bioallied Sci. 2012, 4, S54. [Google Scholar] [CrossRef]
- Jaiswal, M.; Gupta, A.; Agrawal, A.K.; Jassal, M.; Dinda, A.K.; Koul, V. Bi-layer composite dressing of gelatin nanofibrous mat and poly vinyl alcohol hydrogel for drug delivery and wound healing application: In-vitro and in-vivo studies. J. Biomed. Nanotechnol. 2013, 9, 1643. [Google Scholar] [CrossRef]
- Coşkun, G.; Karaca, E.; Ozyurtlu, M.; Özbek, S.; Yermezler, A.; Çavuşoǧlu, I. Histological evaluation of wound healing performance of electrospun poly(vinyl alcohol)/sodium alginate as wound dressing in vivo. Biomed. Mater. Eng. 2014, 24, 1527–1536. [Google Scholar] [CrossRef]
- Mosti, G.; Magliaro, A.; Mattaliano, V.; Picerni, P.; Angelotti, N. Comparative study of two antimicrobial dressings in infected leg ulcers: A pilot study. J. Wound Care 2015, 24, 121–127. [Google Scholar] [CrossRef] [Green Version]
- Kevadiya, B.D.; Rajkumar, S.; Bajaj, H.C.; Chettiar, S.S.; Gosai, K.; Brahmbhatt, H.; Bhatt, A.S.; Barvaliya, Y.K.; Dave, G.S.; Kothari, R.K. Biodegradable gelatin-ciprofloxacin-montmorillonite composite hydrogels for controlled drug release and wound dressing application. Colloids Surf. B Biointerfaces 2014, 122, 175–183. [Google Scholar] [CrossRef]
- Nitanan, T.; Akkaramongkolporn, P.; Rojanarata, T.; Ngawhirunpat, T.; Opanasopit, P. Neomycin-loaded poly(styrene sulfonic acid-co-maleic acid) (PSSA-MA)/polyvinyl alcohol (PVA) ion exchange nanofibers for wound dressing materials. Int. J. Pharm. 2013, 448, 71–78. [Google Scholar] [CrossRef] [PubMed]
- Geszke-Moritz, M.; Moritz, M. Solid lipid nanoparticles as attractive drug vehicles: Composition, properties and therapeutic strategies. Mater. Sci. Eng. C 2016, 68, 982–994. [Google Scholar] [CrossRef] [PubMed]
- Paliwal, R.; Paliwal, S.R.; Kenwat, R.; Kurmi, B.D.; Sahu, M.K. Solid lipid nanoparticles: A review on recent perspectives and patents. Expert Opin. Ther. Pat. 2020, 30, 179–194. [Google Scholar] [CrossRef] [PubMed]
- Daneshmand, S.; Jaafari, M.R.; Movaffagh, J.; Malaekeh-Nikouei, B.; Iranshahi, M.; Seyedian Moghaddam, A.; Tayarani Najaran, Z.; Golmohammadzadeh, S. Preparation, characterization, and optimization of auraptene-loaded solid lipid nanoparticles as a natural anti-inflammatory agent: In vivo and in vitro evaluations. Colloids Surf. B Biointerfaces 2018, 164, 332–339. [Google Scholar] [CrossRef]
- Madan, J.; Dua, K.; Khude, P. Development and evaluation of solid lipid nanoparticles of mometasone furoate for topical delivery. Int. J. Pharm. Investig. 2014, 4, 60. [Google Scholar] [CrossRef] [Green Version]
- Madgulkar, A.R.; Bhalekar, M.R.; Kapse, S.B.; Paygude, B.V.; Reddi, S.S. Transdermal permeation enhancement of valsartan using solid lipid nanoparticles. Res. J. Pharm. Technol. 2011, 4, 1297–1302. [Google Scholar]
- Deshkar, S.S.; Bhalerao, S.G.; Jadhav, M.S.; Shirolkar, S.V. Formulation and Optimization of Topical Solid Lipid Nanoparticles based Gel of Dapsone Using Design of Experiment. Pharm. Nanotechnol. 2018, 6, 264–275. [Google Scholar] [CrossRef]
- Aksu, B.; Paradkar, A.; De Matas, M.; Özer, Ö.; Güneri, T.; York, P. A quality by design approach using artificial intelligence techniques to control the critical quality attributes of ramipril tablets manufactured by wet granulation. Pharm. Dev. Technol. 2013, 18, 236–245. [Google Scholar] [CrossRef]
- Yu, L.X.; Amidon, G.; Khan, M.A.; Hoag, S.W.; Polli, J.; Raju, G.K.; Woodcock, J. Understanding pharmaceutical quality by design. AAPS J. 2014, 16, 771–783. [Google Scholar] [CrossRef] [Green Version]
- Zhang, L.; Mao, S. Application of quality by design in the current drug development. Asian J. Pharm. Sci. 2017, 12, 1–8. [Google Scholar] [CrossRef] [Green Version]
- Zhang, H.; Choi, J.P.; Moon, S.K.; Ngo, T.H. A hybrid multi-objective optimization of aerosol jet printing process via response surface methodology. Addit. Manuf. 2020, 33, 101096. [Google Scholar] [CrossRef]
- Kurakula, M.; Naveen, N.; Patel, B.; Manne, R.; Patel, D.B. Preparation, Optimization and Evaluation of Chitosan-Based Avanafil Nanocomplex Utilizing Antioxidants for Enhanced Neuroprotective Effect on PC12 Cells. Gels 2021, 7, 96. [Google Scholar] [CrossRef] [PubMed]
- Singh, B.; Kapil, R.; Nandi, M.; Ahuja, N. Developing oral drug delivery systems using formulation by design: Vital precepts, retrospect and prospects. Expert Opin. Drug Deliv. 2011, 8, 1341–1360. [Google Scholar] [CrossRef] [PubMed]
- Adetunji, A.I.; Olaniran, A.O. Statistical modelling and optimization of protease production by an autochthonous Bacillus aryabhattai Ab15-ES: A response surface methodology approach. Biocatal. Agric. Biotechnol. 2020, 24, 101528. [Google Scholar] [CrossRef]
- Rizg, W.Y.; Naveen, N.R.; Kurakula, M.; Bukhary, H.A.; Safhi, A.Y.; Alfayez, E.; Sindi, A.M.; Ali, S.; Murshid, S.S.; Hosny, K.M. QbD Supported Optimization of the Alginate-Chitosan Nanoparticles of Simvastatin in Enhancing the Anti-Proliferative Activity against Tongue Carcinoma. Gels 2022, 8, 103. [Google Scholar] [CrossRef] [PubMed]
- Sreeharsha, N.; Naveen, N.R.; Anitha, P.; Goudanavar, P.S.; Ramkanth, S.; Fattepur, S.; Telsang, M.; Habeebuddin, M.; Answer, M.K. Development of Nanocrystal Compressed Minitablets for Chronotherapeutic Drug Delivery. Pharmaceuticals 2022, 15, 311. [Google Scholar] [CrossRef]
- Alhakamy, N.A.; Fahmy, U.A.; Ahmed, O.A.A.; Caruso, G.; Caraci, F.; Asfour, H.Z.; Bakhrebah, M.A.; Alomary, M.N.; Abdulaal, W.H.; Okbazghi, S.Z.; et al. Chitosan coated microparticles enhance simvastatin colon targeting and pro-apoptotic activity. Mar. Drugs 2020, 18, 226. [Google Scholar] [CrossRef]
- Kurakula, M.; Ahmed, A.T. Co-Delivery of Atorvastatin Nanocrystals in PLGA based in situ Gel for Anti-Hyperlipidemic Efficacy. Curr. Drug Deliv. 2015, 13, 211–220. [Google Scholar] [CrossRef]
- Naveen, N.R.; Gopinath, C.; Kurakula, M. Okra-Thioglycolic Acid Conjugate—Synthesis, Characterization, and Evaluation as a Mucoadhesive Polymer. Processes 2020, 8, 316. [Google Scholar] [CrossRef] [Green Version]
- Naveen, N.R.; Gopinath, C.; Rao, D.S. Design expert supported mathematical optimization of repaglinide gastroretentive floating tablets: In vitro and in vivo evaluation. Futur. J. Pharm. Sci. 2017, 3, 140–147. [Google Scholar] [CrossRef]
- Schubert, M.A.; Müller-Goymann, C.C. Solvent injection as a new approach for manufacturing lipid nanoparticles—Evaluation of the method and process parameters. Eur. J. Pharm. Biopharm. 2003, 55, S0939–S6411. [Google Scholar] [CrossRef]
- Sharma, R.; Ahuja, M.; Kaur, H. Thiolated pectin nanoparticles: Preparation, characterization and ex vivo corneal permeation study. Carbohydr. Polym. 2012, 87, 1606–1610. [Google Scholar] [CrossRef]
- Shelly; Ahuja, M.; Kumar, A. Gum ghatti-chitosan polyelectrolyte nanoparticles: Preparation and characterization. Int. J. Biol. Macromol. 2013, 61, 411–415. [Google Scholar] [CrossRef] [PubMed]
- Rizg, W.Y.; Naveen, N.R.; Kurakula, M.; Safhi, A.Y.; Murshid, S.S.; Mushtaq, R.Y.; Abualsunun, W.A.; Alharbi, M.; Bakhaidar, R.B.; Almehmady, A.M.; et al. Augmentation of Antidiabetic Activity of Glibenclamide Microspheres Using S-Protected Okra Powered by QbD: Scintigraphy and In Vivo Studies. Pharmaceuticals 2022, 15, 491. [Google Scholar] [PubMed]
- Naveen, N.R.; Kurakula, M.; Gowthami, B. Process optimization by response surface methodology for preparation and evaluation of methotrexate loaded chitosan nanoparticles. Mater. Today Proc. 2020, 33, 2716–2724. [Google Scholar] [CrossRef]
- Kurakula, M.; Raghavendra Naveen, N. In situ gel loaded with chitosan-coated simvastatin nanoparticles: Promising delivery for effective anti-proliferative activity against tongue carcinoma. Mar. Drugs 2020, 18, 201. [Google Scholar] [CrossRef] [Green Version]
- Zhuo, F.; Abourehab, M.A.S.; Hussain, Z. Hyaluronic acid decorated tacrolimus-loaded nanoparticles: Efficient approach to maximize dermal targeting and anti-dermatitis efficacy. Carbohydr. Polym. 2018, 197, 489. [Google Scholar] [CrossRef]
- Trombino, S.; Serini, S.; Cassano, R.; Calviello, G. Xanthan gum-based materials for omega-3 PUFA delivery: Preparation, characterization and antineoplastic activity evaluation. Carbohydr. Polym. 2019, 208, 431–440. [Google Scholar] [CrossRef]
- Bartosova, L.; Bajgar, J. Transdermal Drug Delivery In Vitro Using Diffusion Cells. Curr. Med. Chem. 2012, 19, 4671–4677. [Google Scholar] [CrossRef]
- Khan, A.S.; Shah, K.U.; Al Mohaini, M.; Alsalman, A.J.; Al Hawaj, M.A.; Alhashem, Y.N.; Ghazanfar, S.; Khan, K.A.; Niazi, Z.R.; Farid, A. Tacrolimus-Loaded Solid Lipid Nanoparticle Gel: Formulation Development and In Vitro Assessment for Topical Applications. Gels 2022, 8, 129. [Google Scholar] [CrossRef]
- Gupta, S.; Wairkar, S.; Bhatt, L.K. Isotretinoin and α-tocopherol acetate-loaded solid lipid nanoparticle topical gel for the treatment of acne. J. Microencapsul. 2020, 37, 557–565. [Google Scholar] [CrossRef] [PubMed]
- Wróblewska, M.; Szymańska, E.; Szekalska, M.; Winnicka, K. Different types of gel carriers as metronidazole delivery systems to the oral mucosa. Polymers 2020, 12, 680. [Google Scholar] [CrossRef] [PubMed] [Green Version]
- Kelidari, H.R.; Saeedi, M.; Akbari, J.; Morteza-Semnani, K.; Gill, P.; Valizadeh, H.; Nokhodchi, A. Formulation optimization and in vitro skin penetration of spironolactone loaded solid lipid nanoparticles. Colloids Surf. B Biointerfaces 2015, 128, 473–479. [Google Scholar] [CrossRef] [PubMed]
- Ho, H.N.; Le, H.H.; Le, T.G.; Duong, T.H.A.; Ngo, V.Q.T.; Dang, C.T.; Nguyen, V.M.; Tran, T.H.; Nguyen, C.N. Formulation and characterization of hydroxyethyl cellulose-based gel containing metronidazole-loaded solid lipid nanoparticles for buccal mucosal drug delivery. Int. J. Biol. Macromol. 2022, 194, 1010–1018. [Google Scholar] [CrossRef]
- Chen, M.; Yang, Z.; Wu, H.; Pan, X.; Xie, X.; Wu, C. Antimicrobial activity and the mechanism of silver nanoparticle thermosensitive gel. Int. J. Nanomed. 2011, 6, 2873. [Google Scholar] [CrossRef] [Green Version]
- Kurakula, M.; Ahmed, O.A.A.; Fahmy, U.A.; Ahmed, T.A. Solid lipid nanoparticles for transdermal delivery of avanafil: Optimization, formulation, in-vitro and ex-vivo studies. J. Liposome Res. 2016, 26, 288–296. [Google Scholar] [CrossRef]
- Hosny, K.M.; Sindi, A.M.; Alkhalidi, H.M.; Kurakula, M.; Alruwaili, N.K.; Alhakamy, N.A.; Abualsunun, W.A.; Bakhaidar, R.B.; Bahmdan, R.H.; Rizg, W.Y.; et al. Oral gel loaded with penciclovir–lavender oil nanoemulsion to enhance bioavailability and alleviate pain associated with herpes labialis. Drug Deliv. 2021, 28, 1043–1054. [Google Scholar]


| Factor 1 | Factor 2 | Factor 3 | Response 1 | Response 2 | |
|---|---|---|---|---|---|
| Run | A:Stearic Acid | B:Glycerol Monosteratae | C:P-F 68 | Particle Size | EE |
| (%) | (%) | (%) | nm | % | |
| 12 | 0.3 | 0.3 | 1 | 354 | 78 |
| 6 | 0.3 | 0.2 | 1.5 | 398 | 79 |
| 5 | 0.3 | 0.1 | 1 | 223 | 84 |
| 13 | 0.3 | 0.2 | 0.5 | 219 | 85 |
| 2 | 0.4 | 0.1 | 0.5 | 299 | 72 |
| 16 | 0.4 | 0.3 | 0.5 | 340 | 76 |
| 4 | 0.4 | 0.1 | 1.5 | 346 | 79 |
| 1 | 0.4 | 0.3 | 1.5 | 342 | 79 |
| 3 | 0.4 | 0.2 | 1 | 265 | 82 |
| 7 | 0.4 | 0.2 | 1 | 264 | 83 |
| 9 | 0.4 | 0.2 | 1 | 263 | 83 |
| 14 | 0.4 | 0.2 | 1 | 263 | 84 |
| 17 | 0.4 | 0.2 | 1 | 266 | 84 |
| 10 | 0.5 | 0.1 | 1 | 288 | 76 |
| 11 | 0.5 | 0.2 | 0.5 | 345 | 77 |
| 15 | 0.5 | 0.3 | 1 | 201 | 87 |
| 8 | 0.5 | 0.2 | 1.5 | 245 | 89 |
| Source | Sequential p-Value | Lack of Fit p-Value | Adjusted R2 | Predicted R2 | ||
|---|---|---|---|---|---|---|
| Particle Size | Linear | 0.7345 | <0.0001 | −0.1195 | −0.8423 | |
| 2FI | 0.0057 | <0.0001 | 0.5634 | −0.1454 | ||
| Quadratic | <0.0001 | 0.0002 | 0.9730 | 0.9130 | Suggested | |
| Cubic | 0.0002 | 0.9995 | Aliased | |||
| EE | Linear | 0.5813 | 0.0012 | −0.0644 | −0.7290 | |
| 2FI | 0.0325 | 0.0032 | 0.4025 | −0.5804 | ||
| Quadratic | <0.0001 | 0.4553 | 0.9639 | 0.9628 | Suggested | |
| Cubic | 0.4553 | 0.9650 | Aliased |
| Parameter | PS | EE |
|---|---|---|
| Std. Dev. | 9.19 | 0.8494 |
| Mean | 289.47 | 81.00 |
| C.V. % | 3.17 | 1.05 |
| Adeq Precision | 27.5567 | 26.0962 |
| Lack of Fit F-value | 114.46 | 1.07 |
| Lack of Fit p-value | 0.0785 | 0.4553 |
| Model F-value | 65.10 | 48.51 |
| Model p-value | <0.0001 | <0.0001 |
| Intercept | A | B | C | AB | AC | BC | A2 | B2 | C2 | |
|---|---|---|---|---|---|---|---|---|---|---|
| Particle size | 264.2 | −14.375 | 10.125 | 16 | −54.5 | −69.75 | −11.25 | −13.85 | 16.15 | 51.4 |
| p-values | 0.0031 | 0.0169 | 0.0017 | <0.0001 | <0.0001 | 0.0441 | 0.0175 | 0.0086 | <0.0001 | |
| EE | 83.2 | 0.375 | 1.125 | 2 | 4.25 | 4.5 | −1 | 2.025 | −3.975 | −2.725 |
| p-values | 0.2519 | 0.0072 | 0.0003 | <0.0001 | <0.0001 | 0.0507 | 0.0018 | < 0.0001 | 0.0003 |
| NES-SLN-G * | NES-G * | |
|---|---|---|
| Particle size | 196.5 ± 1.5 nm | 542.5 ± 4.2 nm |
| PDI | 0.15 ± 0.02 | 0.58 ± 0.04 |
| Zeta potential | −32.5 ± 1.2 mV | 6.8 ± 0.45 mV |
| Component | Level | Response | Constraints | |
|---|---|---|---|---|
| Low | High | |||
| Stearic acid (%); (X1) | 0.3 | 0.5 | Particle size (Y1) | Minimum |
| Glycerol monostearate (%); (X2) | 0.1 | 0.3 | EE (Y2) | Maximum |
| P-F 68 (%) (X3) | 0.5 | 1.5 | ||
Publisher’s Note: MDPI stays neutral with regard to jurisdictional claims in published maps and institutional affiliations. |
© 2022 by the authors. Licensee MDPI, Basel, Switzerland. This article is an open access article distributed under the terms and conditions of the Creative Commons Attribution (CC BY) license (https://creativecommons.org/licenses/by/4.0/).
Share and Cite
Hosny, K.M.; Naveen, N.R.; Kurakula, M.; Sindi, A.M.; Sabei, F.Y.; Fatease, A.A.; Jali, A.M.; Alharbi, W.S.; Mushtaq, R.Y.; Felemban, M.; et al. Design and Development of Neomycin Sulfate Gel Loaded with Solid Lipid Nanoparticles for Buccal Mucosal Wound Healing. Gels 2022, 8, 385. https://doi.org/10.3390/gels8060385
Hosny KM, Naveen NR, Kurakula M, Sindi AM, Sabei FY, Fatease AA, Jali AM, Alharbi WS, Mushtaq RY, Felemban M, et al. Design and Development of Neomycin Sulfate Gel Loaded with Solid Lipid Nanoparticles for Buccal Mucosal Wound Healing. Gels. 2022; 8(6):385. https://doi.org/10.3390/gels8060385
Chicago/Turabian StyleHosny, Khaled M., N. Raghavendra Naveen, Mallesh Kurakula, Amal M. Sindi, Fahad Y. Sabei, Adel Al Fatease, Abdulmajeed M. Jali, Waleed S. Alharbi, Rayan Y. Mushtaq, Majed Felemban, and et al. 2022. "Design and Development of Neomycin Sulfate Gel Loaded with Solid Lipid Nanoparticles for Buccal Mucosal Wound Healing" Gels 8, no. 6: 385. https://doi.org/10.3390/gels8060385
APA StyleHosny, K. M., Naveen, N. R., Kurakula, M., Sindi, A. M., Sabei, F. Y., Fatease, A. A., Jali, A. M., Alharbi, W. S., Mushtaq, R. Y., Felemban, M., Tayeb, H. H., Alfayez, E., & Rizg, W. Y. (2022). Design and Development of Neomycin Sulfate Gel Loaded with Solid Lipid Nanoparticles for Buccal Mucosal Wound Healing. Gels, 8(6), 385. https://doi.org/10.3390/gels8060385