


Design and Development of a Topical Nanogel Formulation Comprising of a Unani Medicinal Agent for the Management of Pain

 , , , , and
Abstract
1. Introduction
2. Results and Discussion
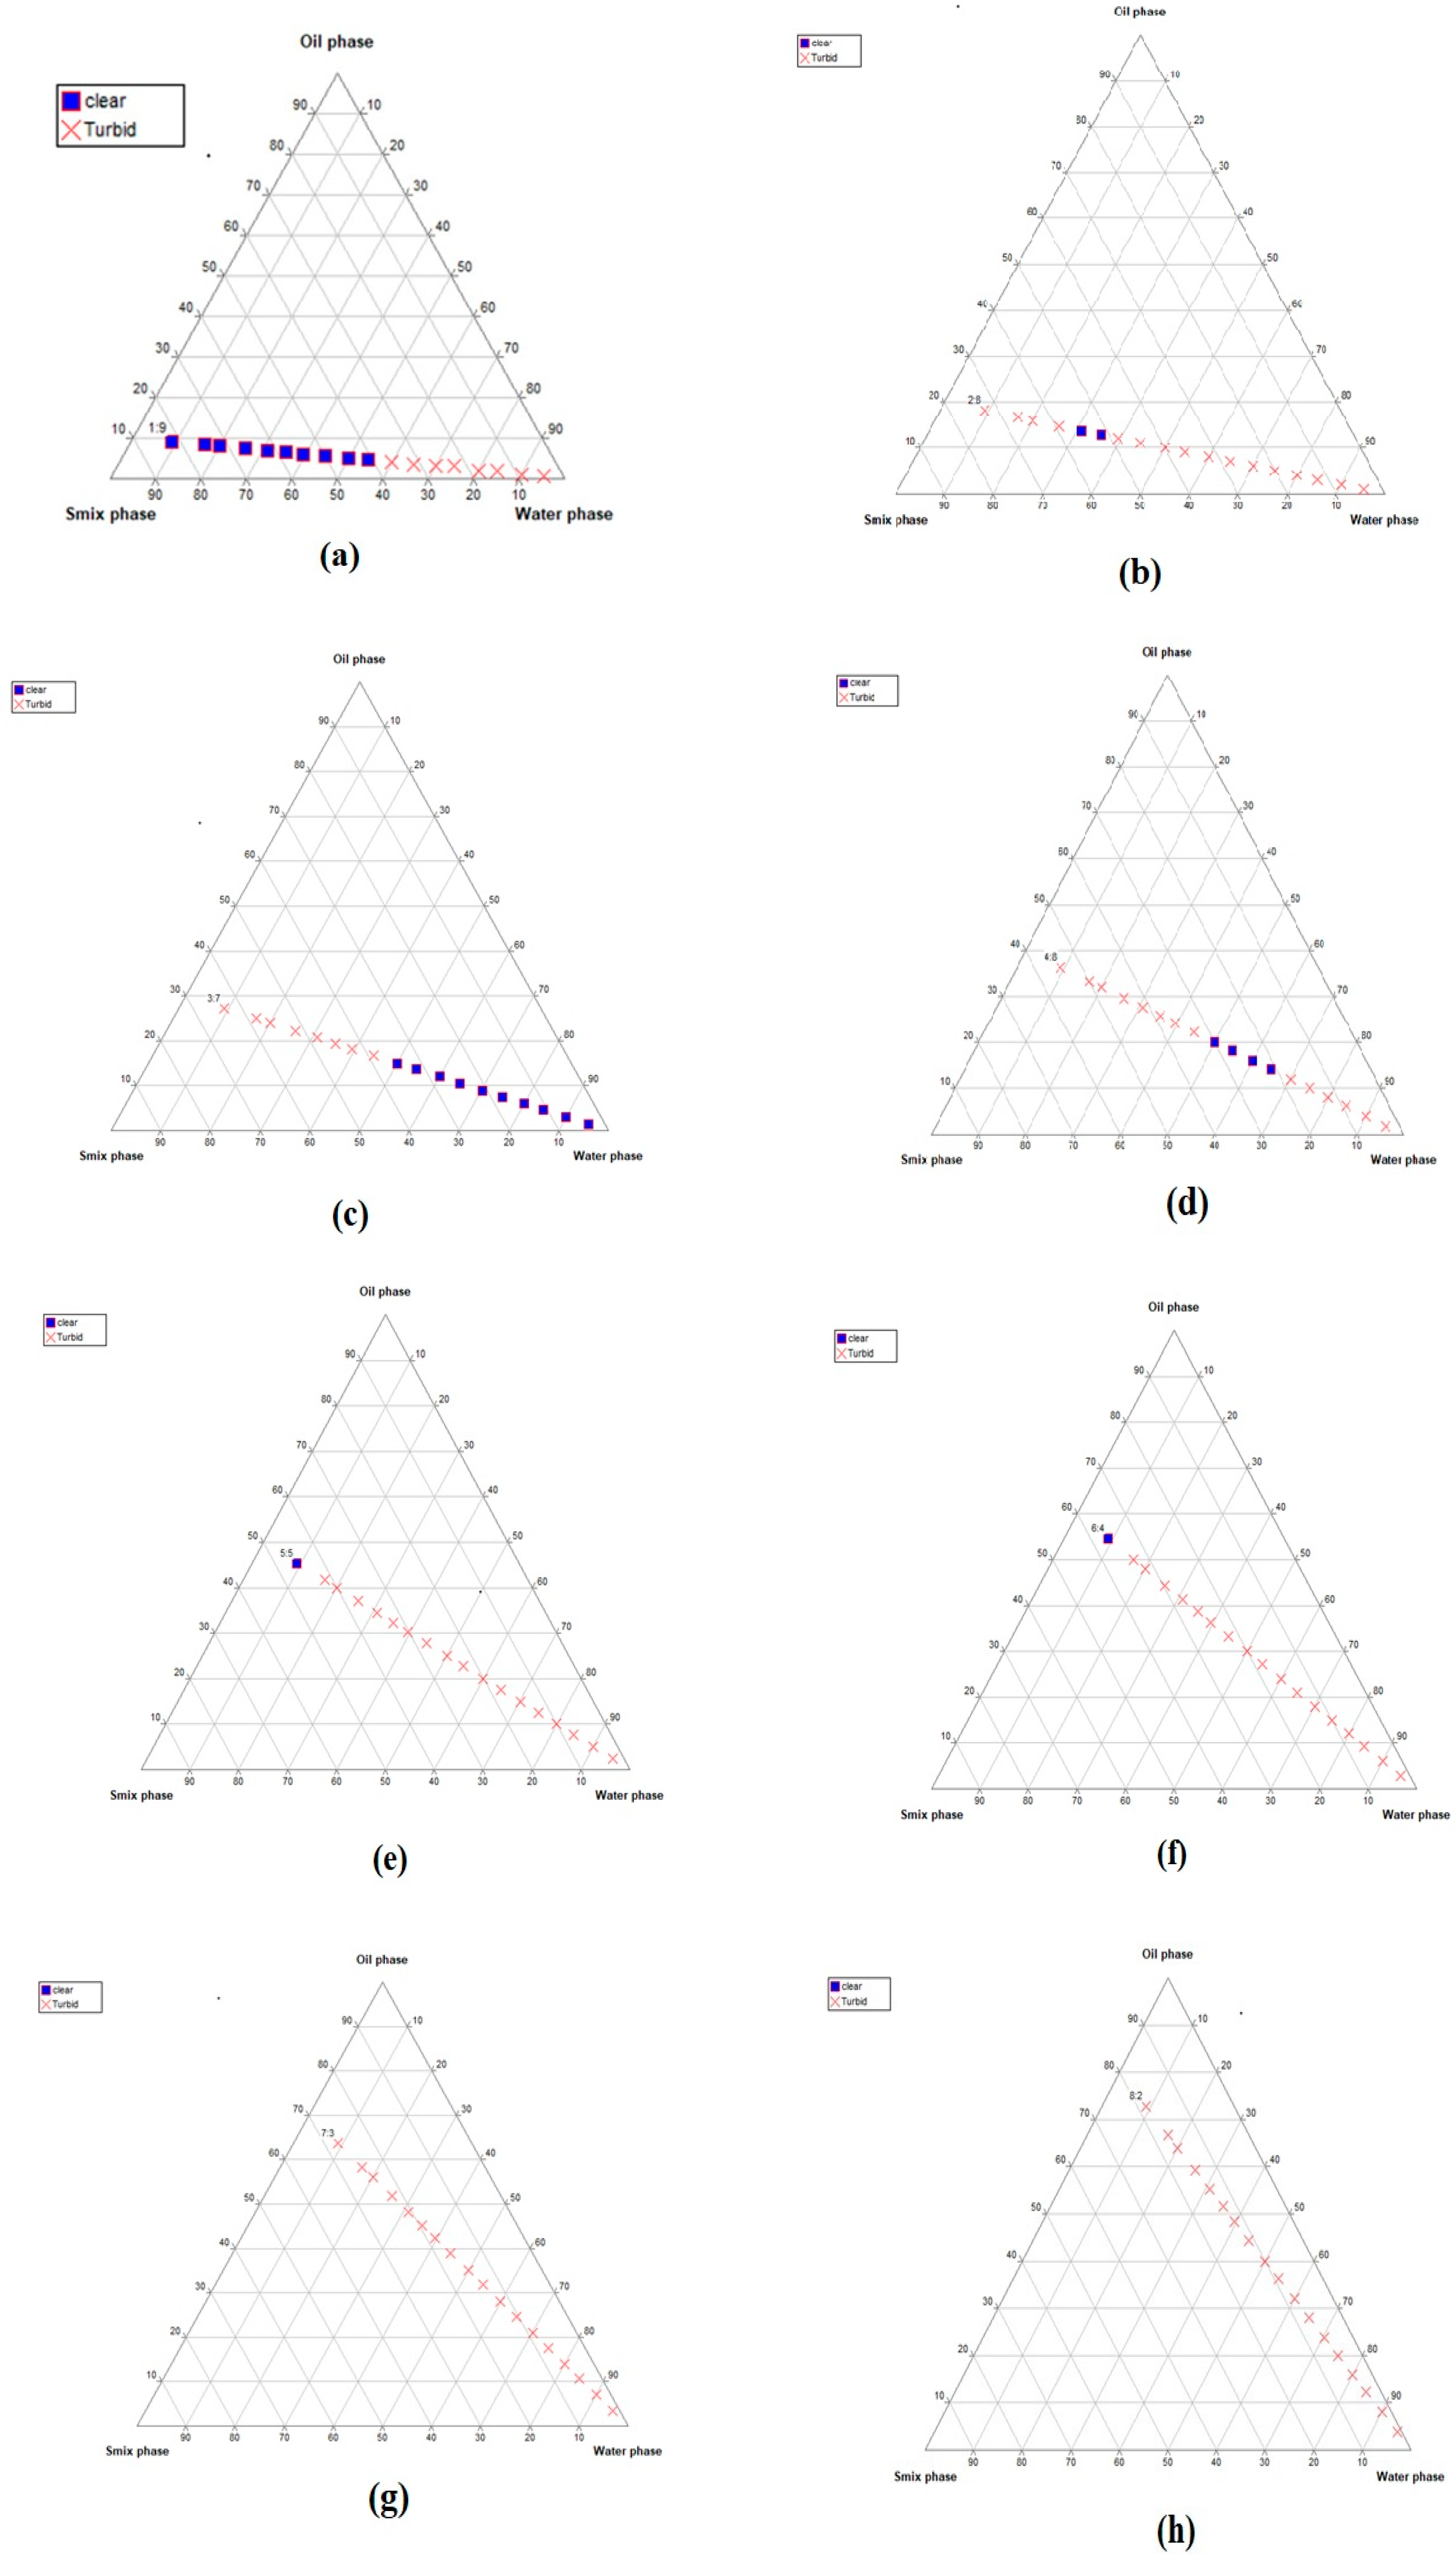
2.1. Construction of Pseudo-Ternary Phase Diagrams
2.2. Thermodynamic Stability Studies of Developed Nanoemulsion
2.3. Characterization of Selected Nanoemulsion Formulations
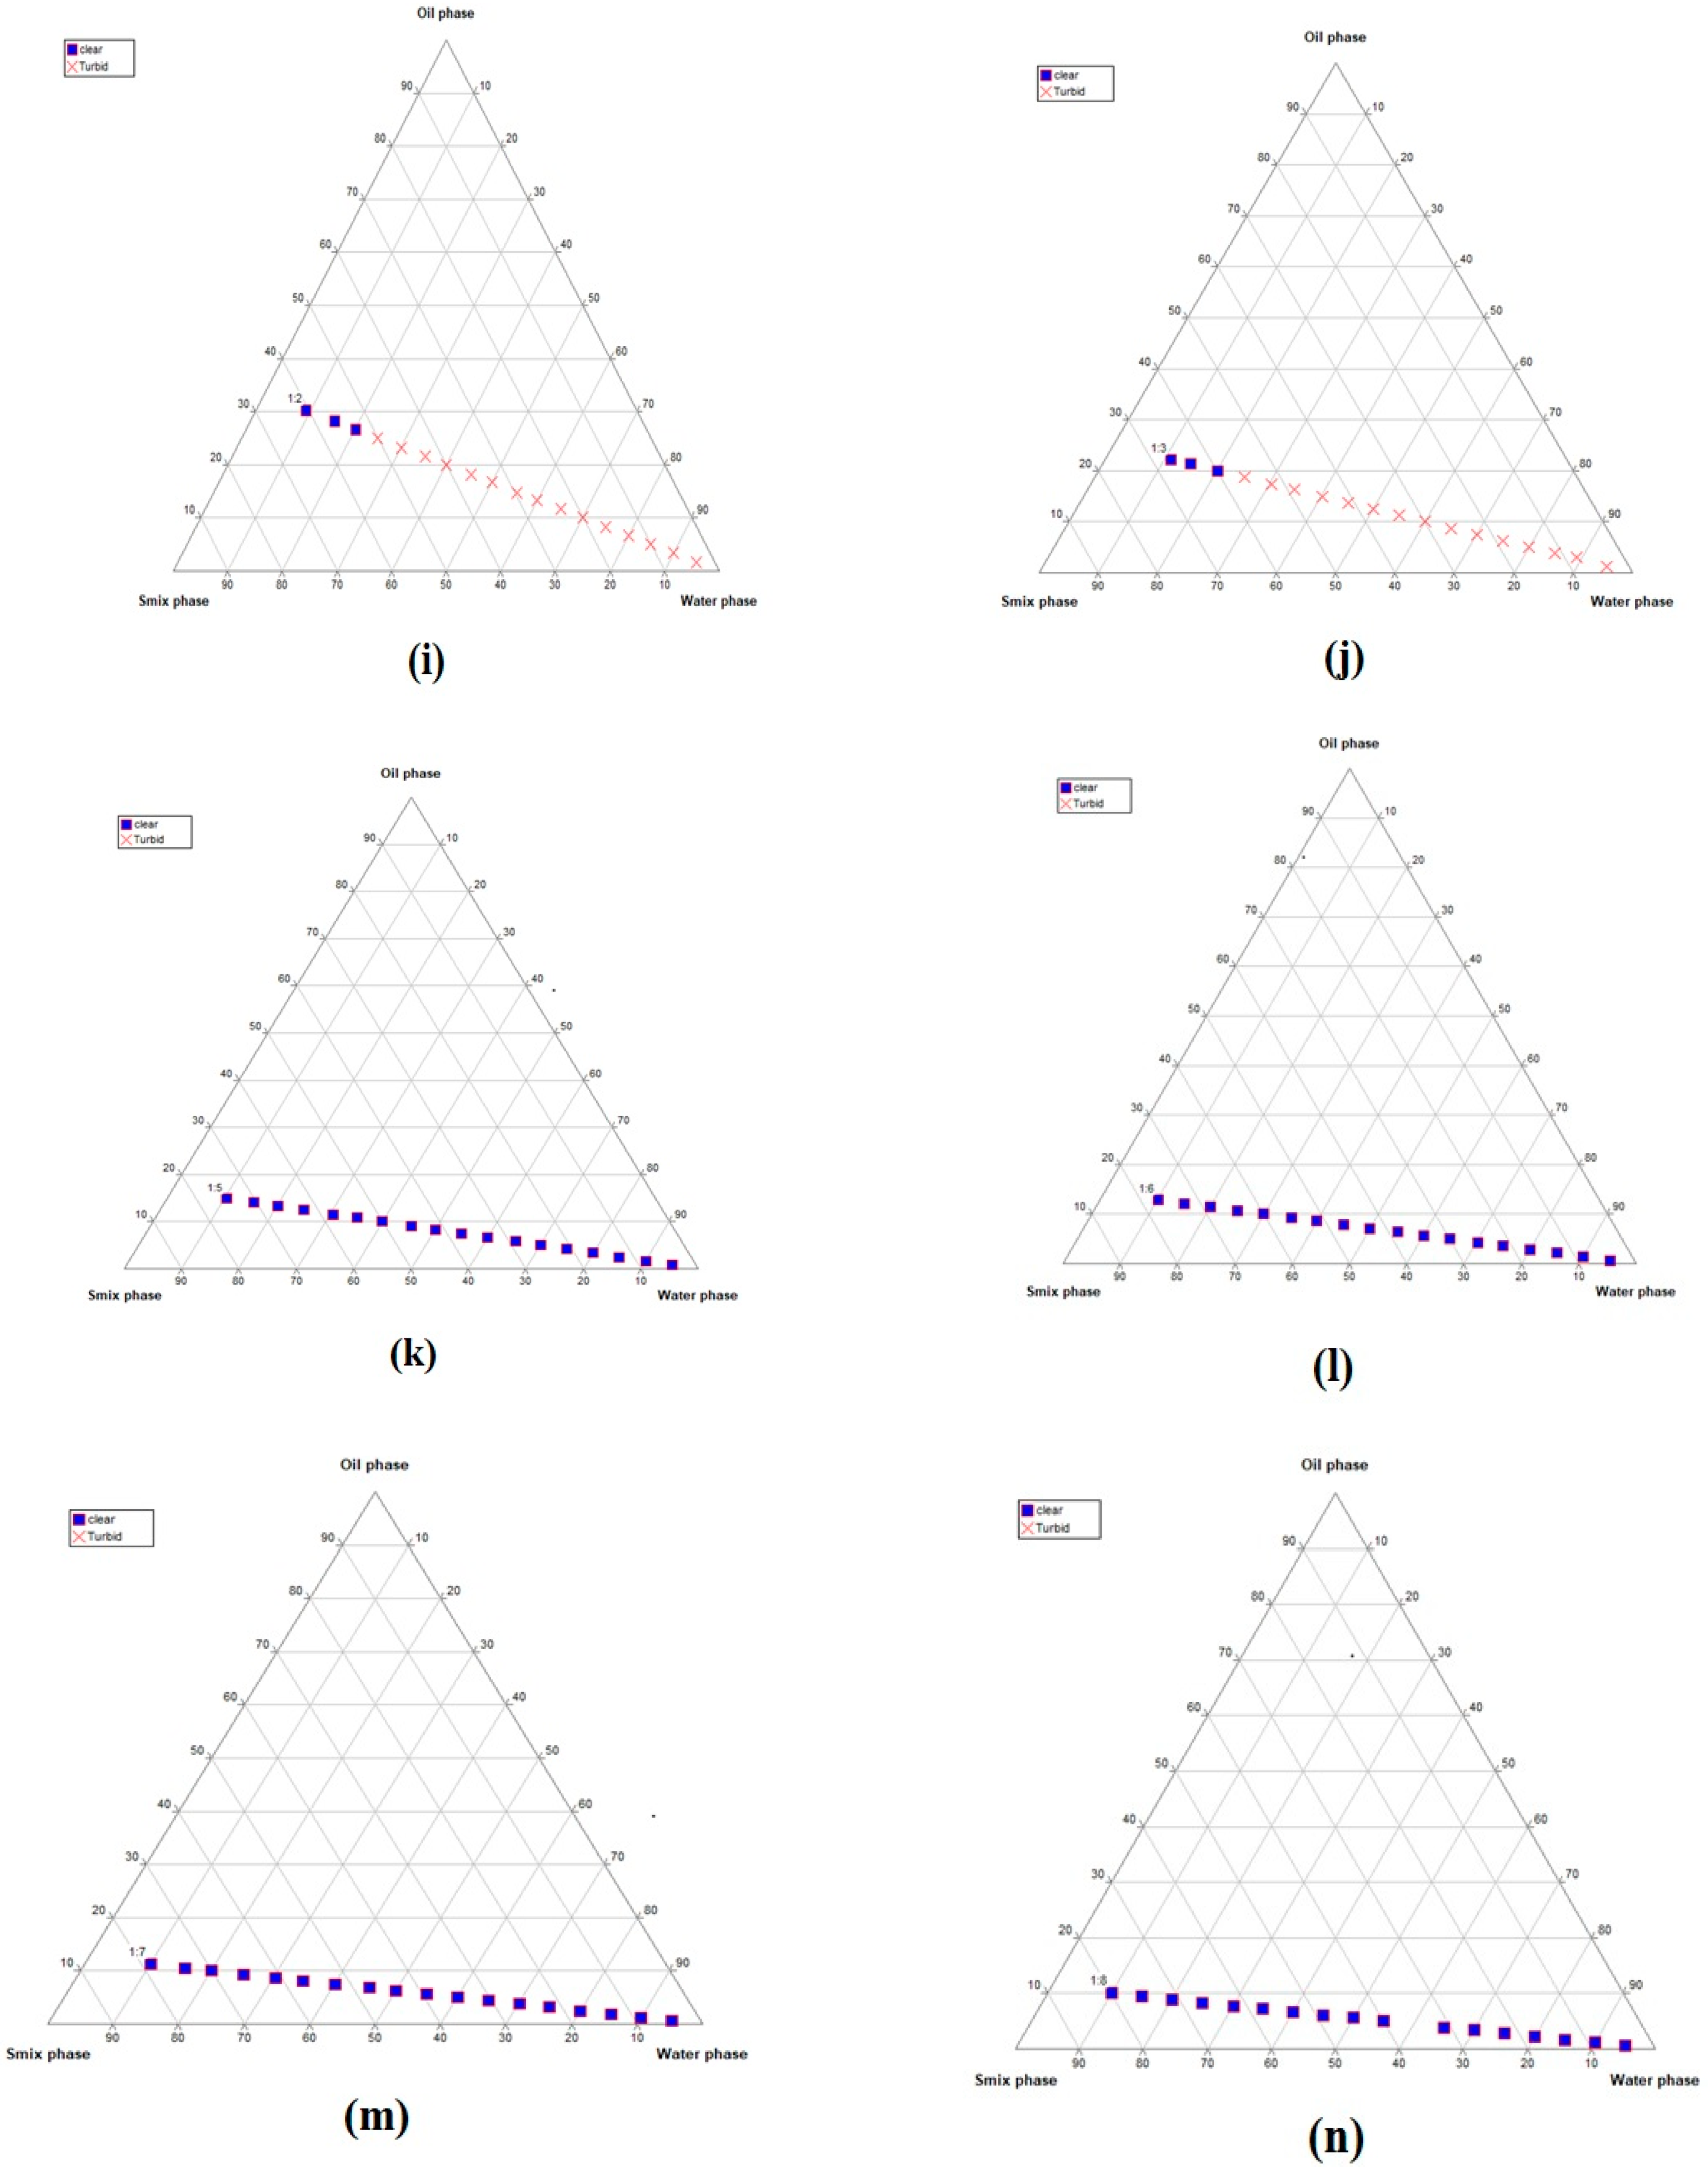
2.3.1. Particle Size, Zeta Potential, and Polydispersity Index (PDI)
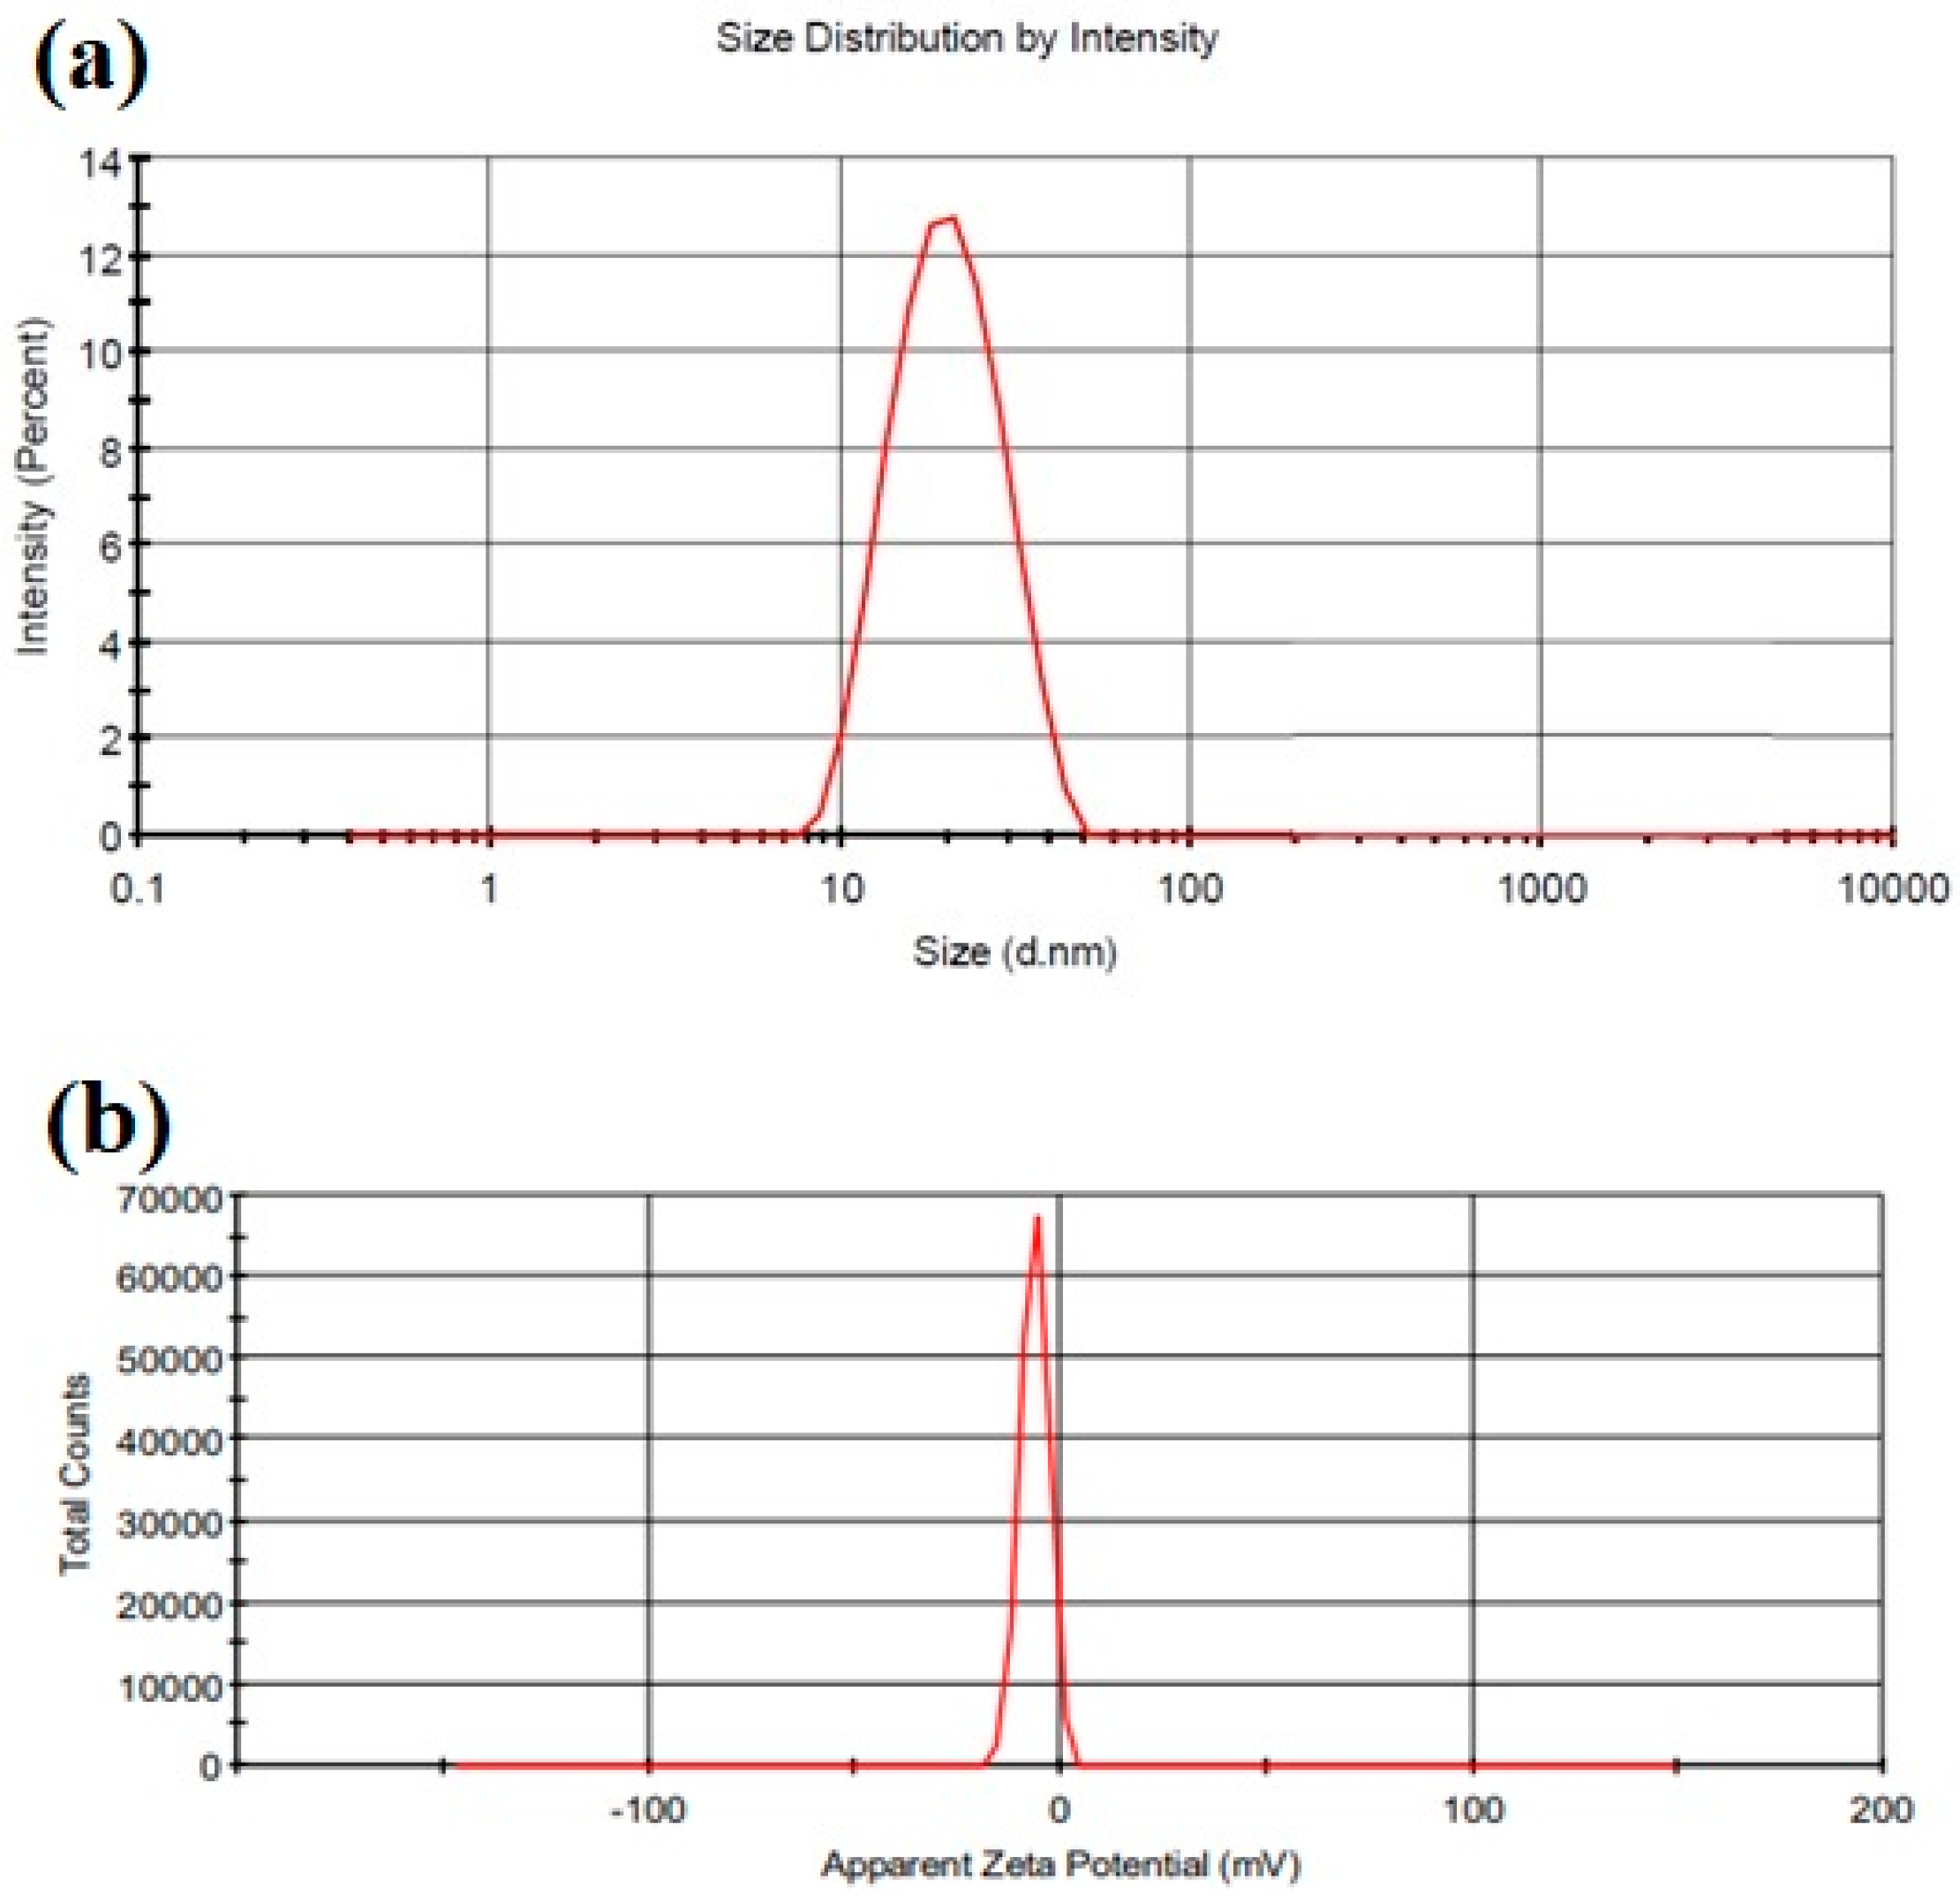
2.3.2. Transmission Electron Microscopy
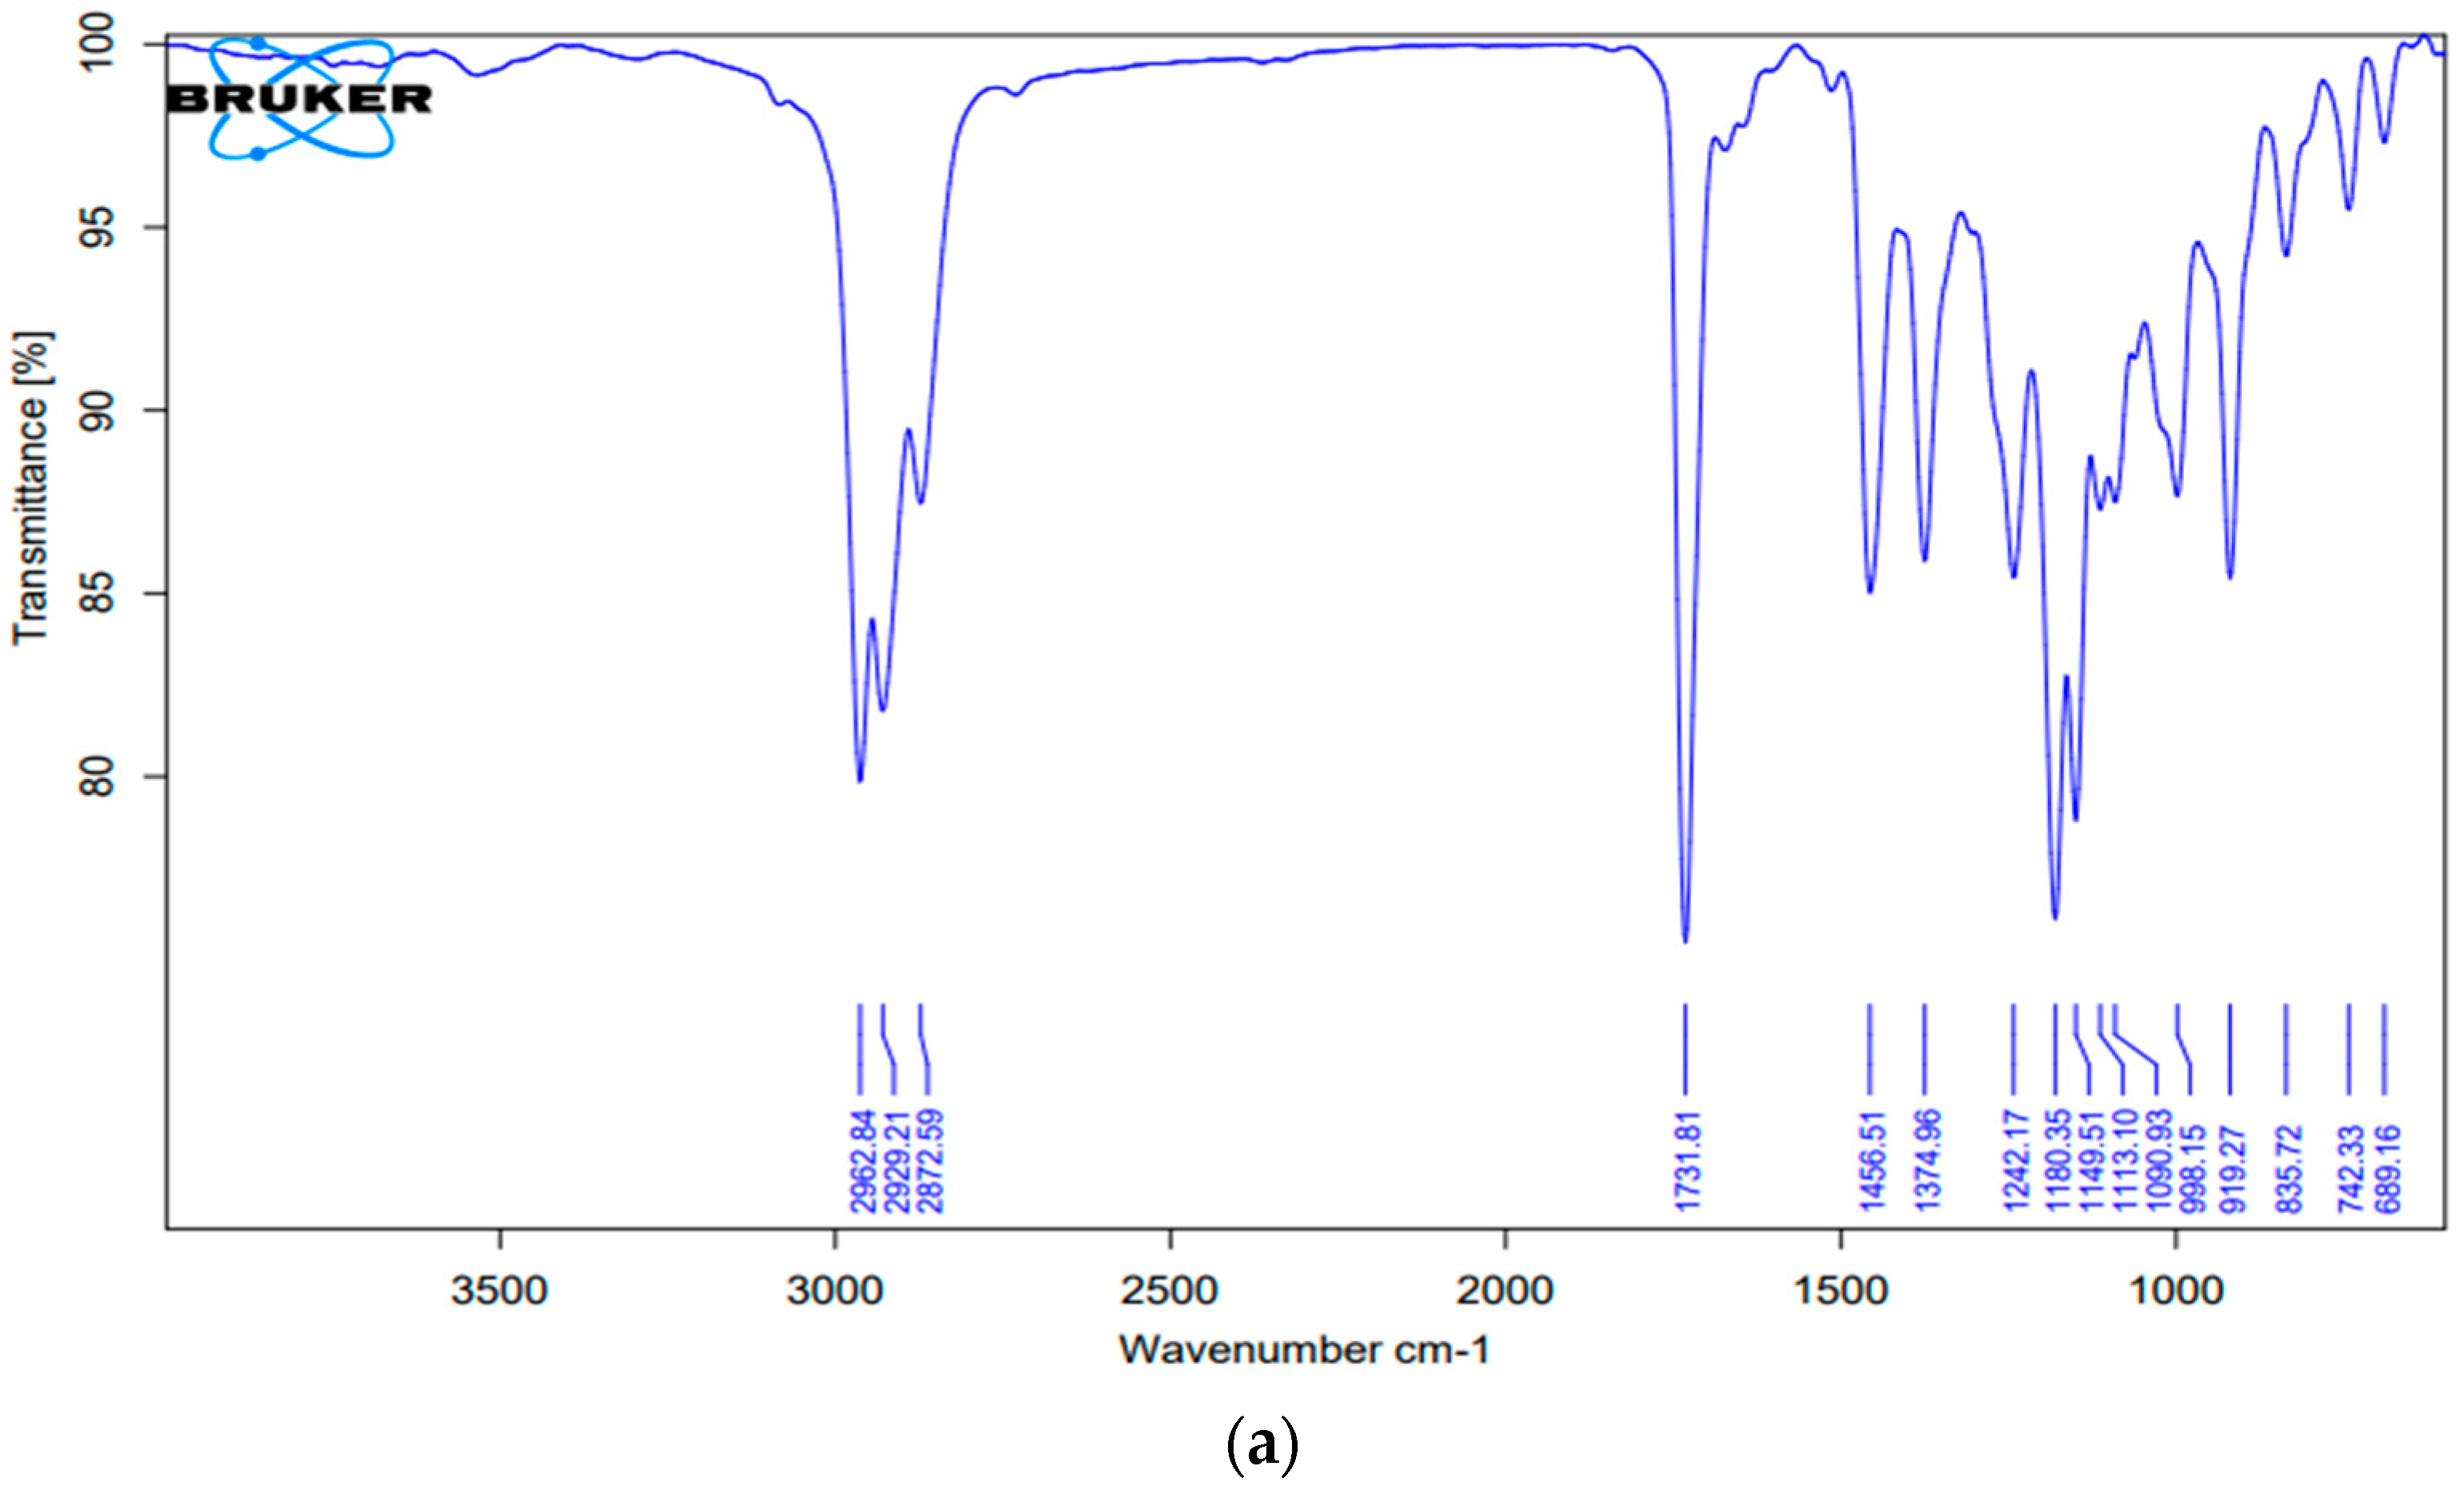
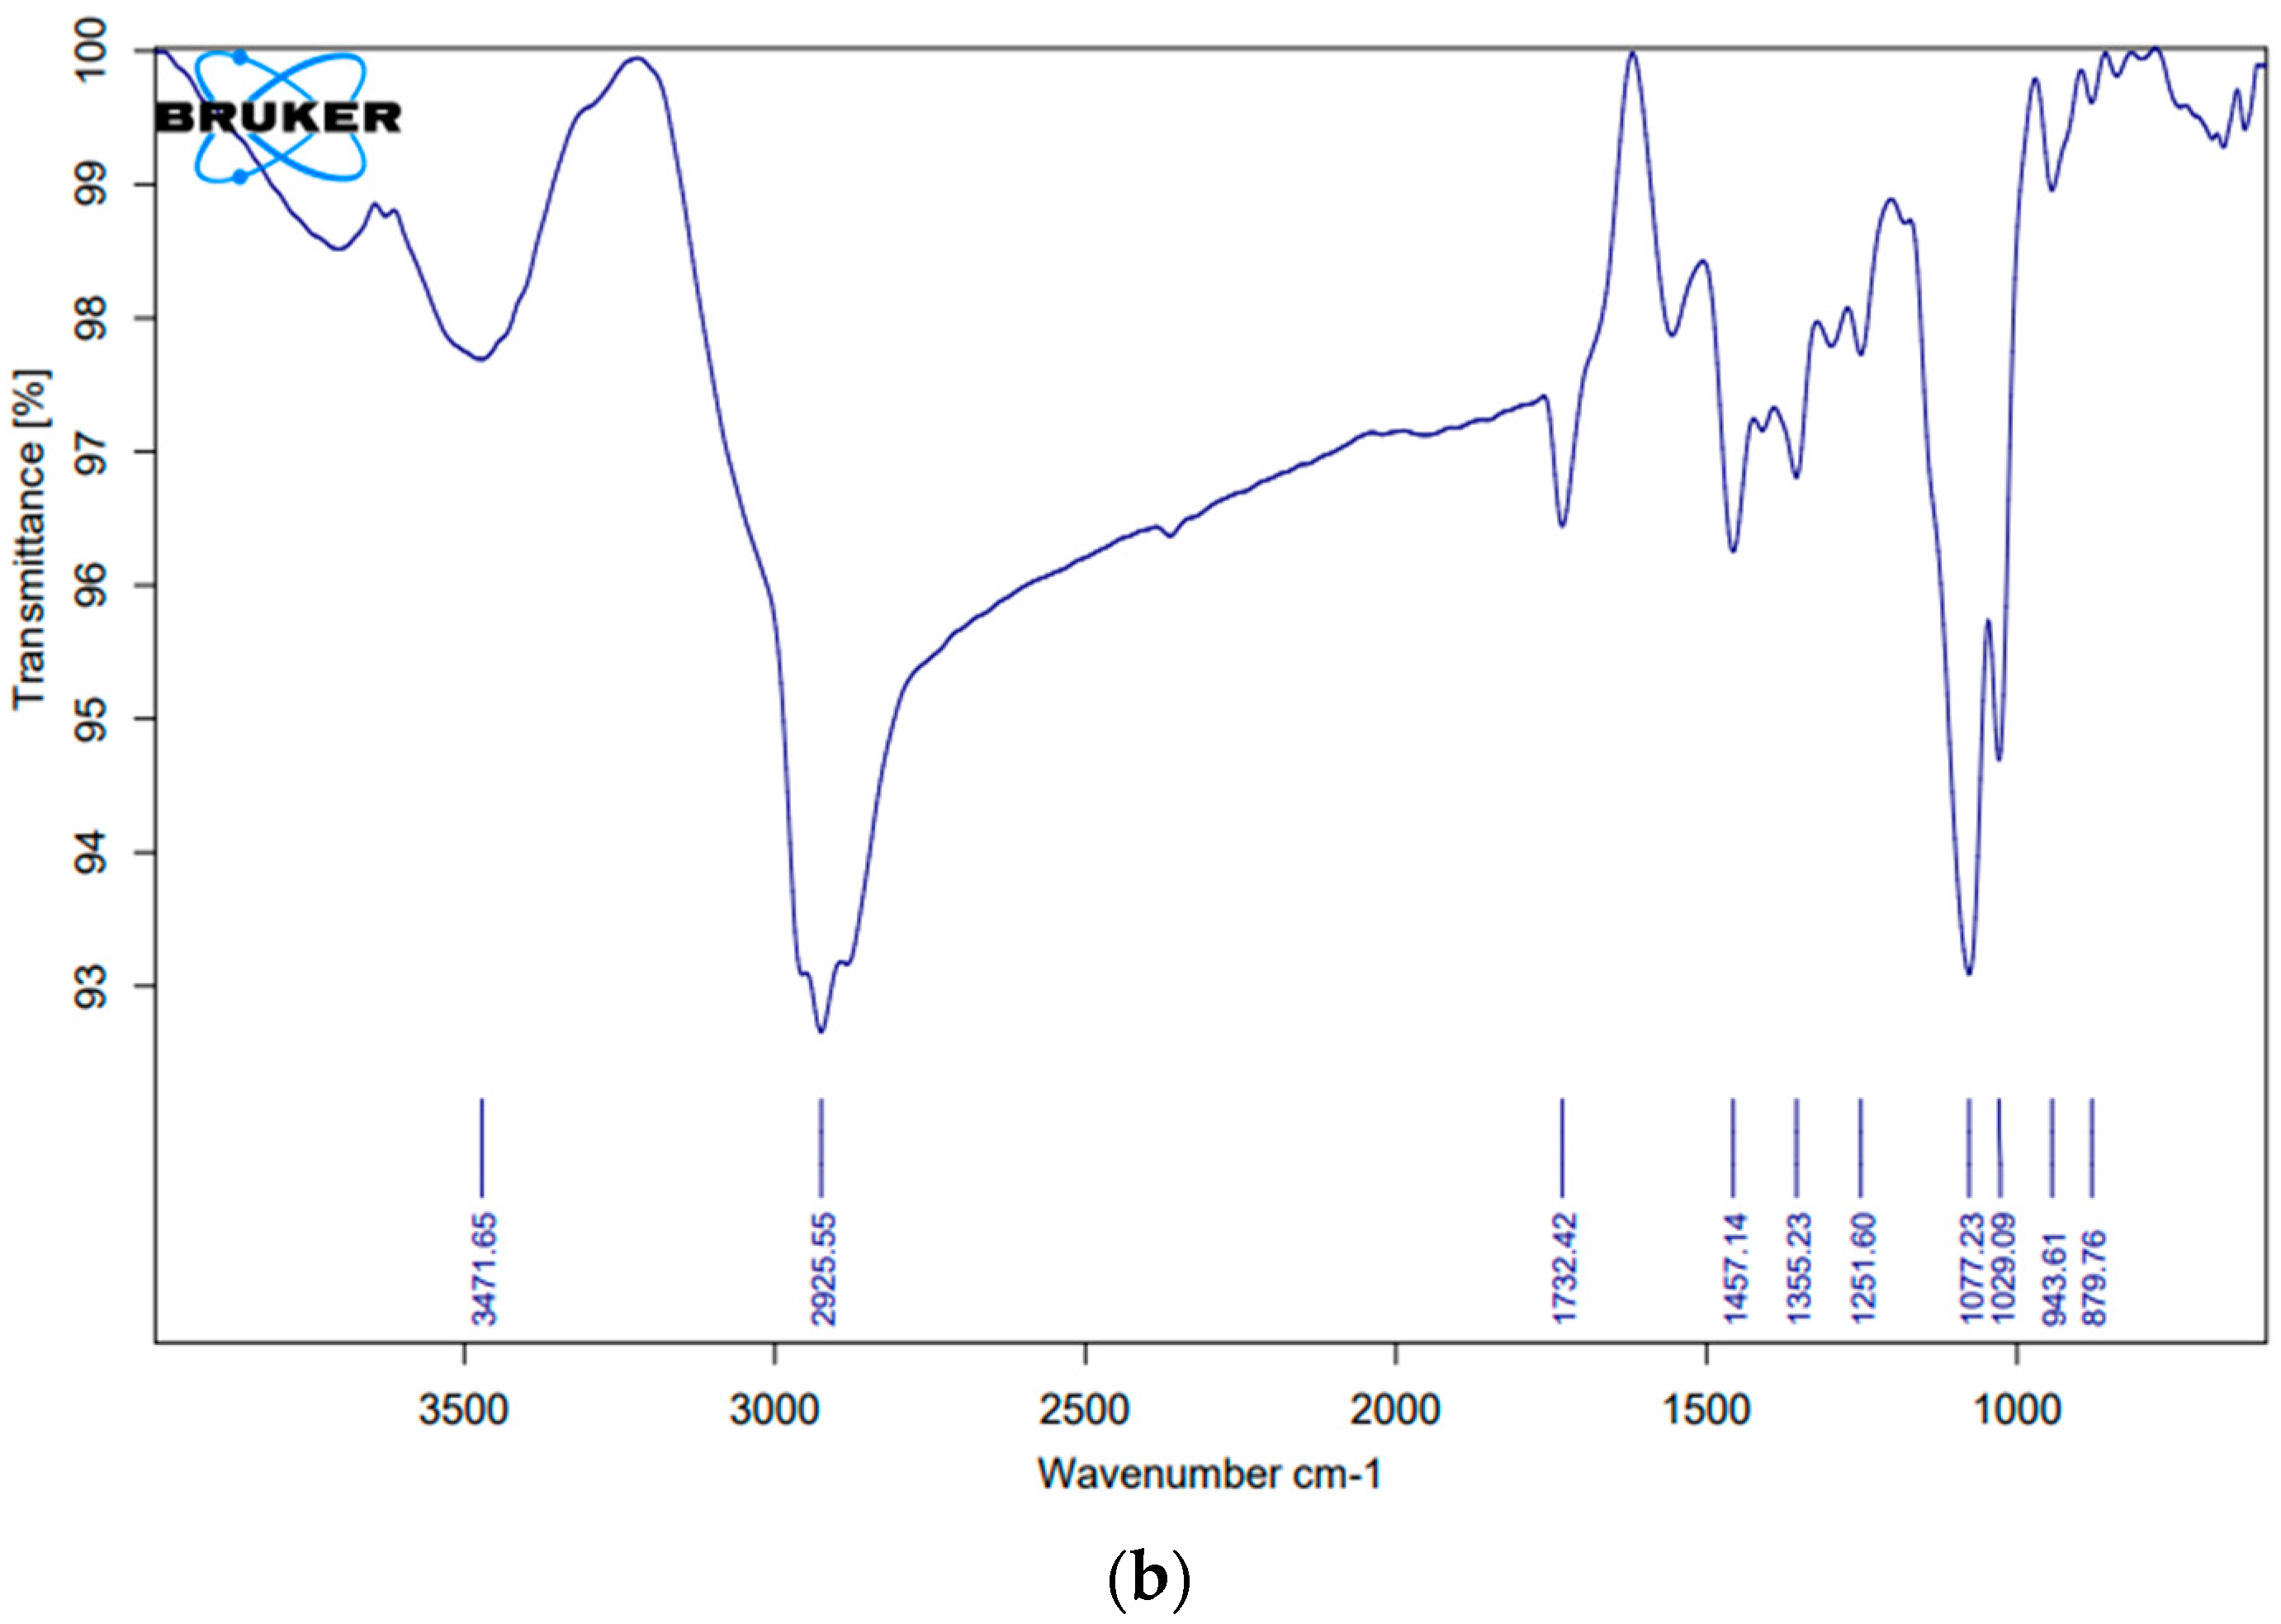
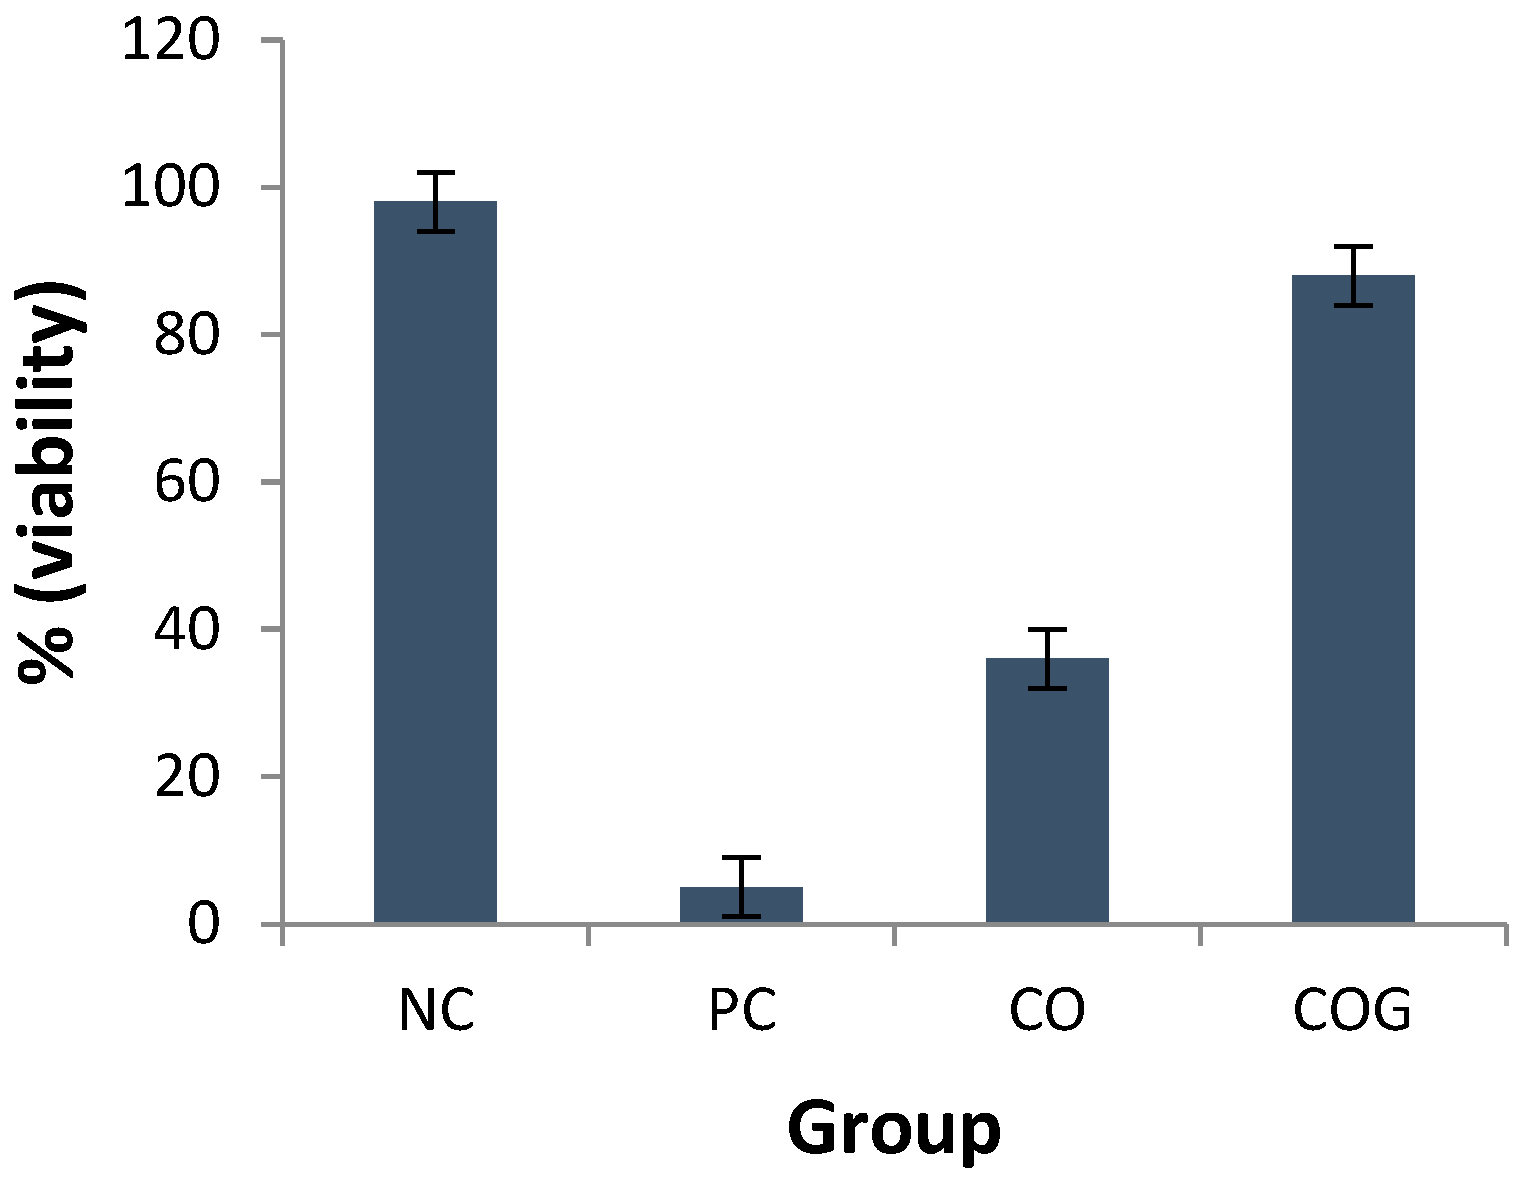
2.3.3. Compatibility Studies
2.4. Preparation and Evaluation of Nanogel
2.4.1. pH Measurement
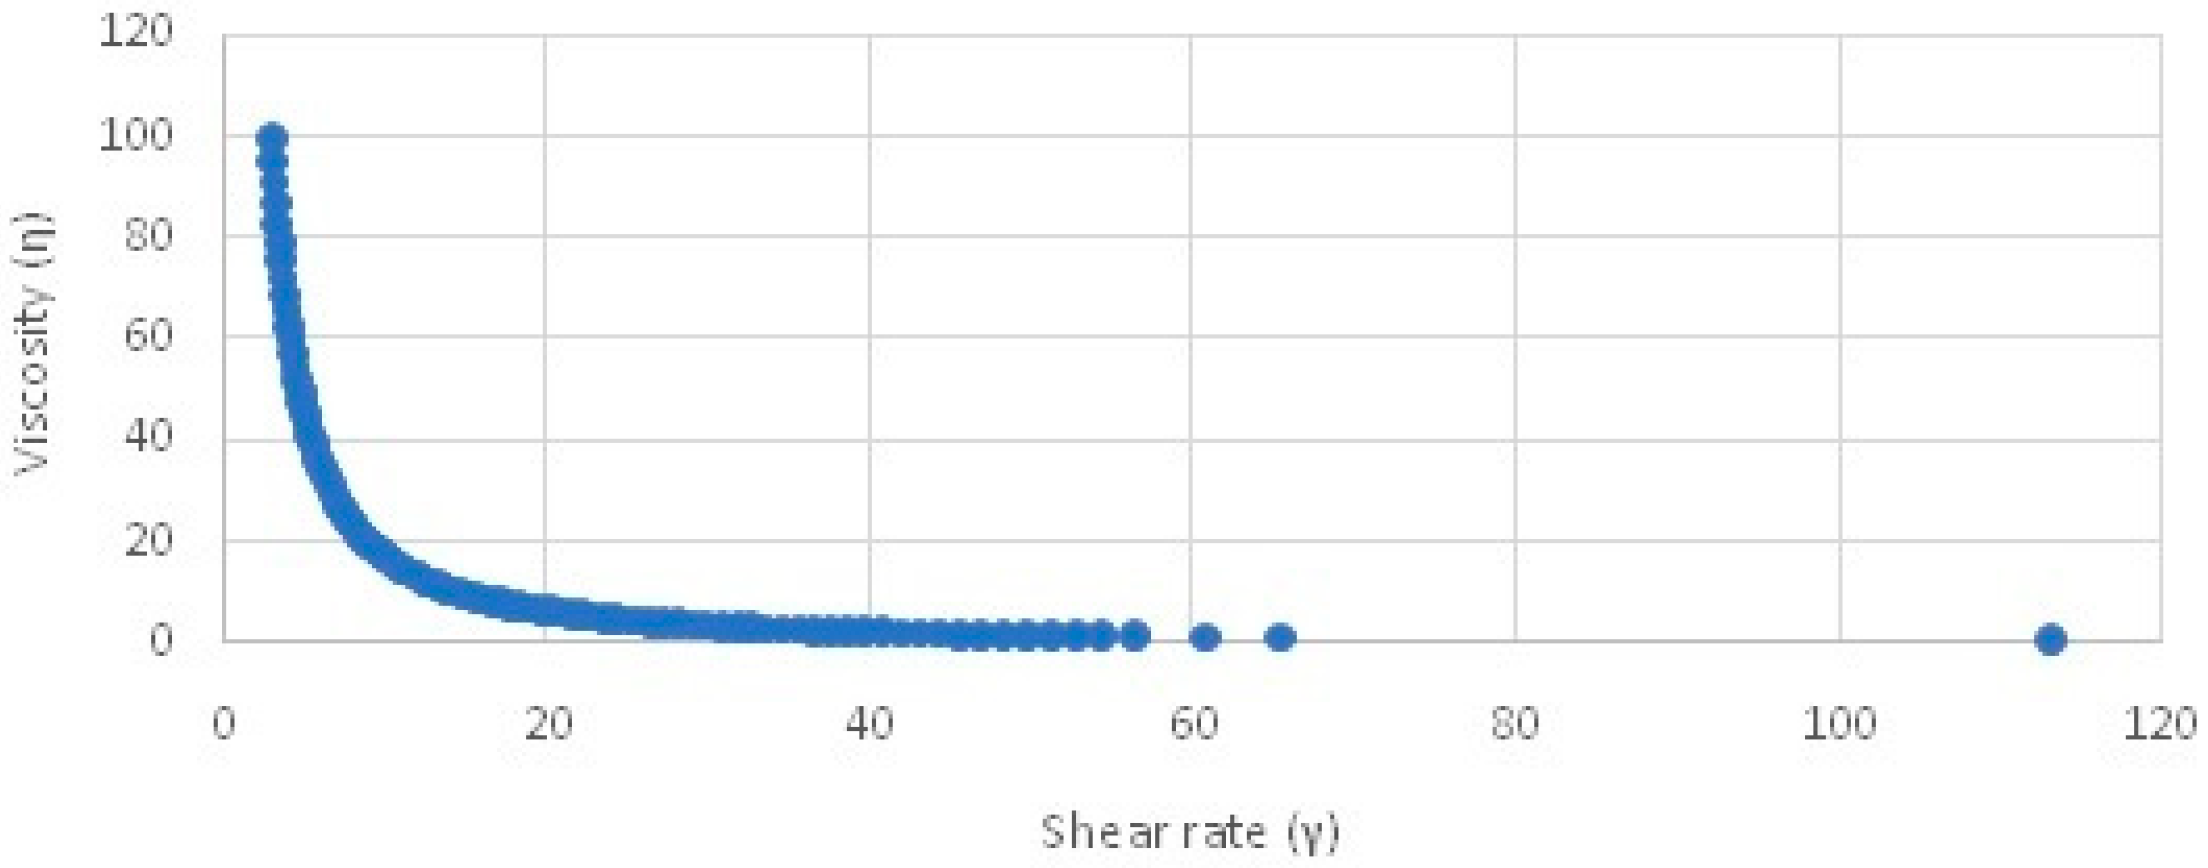
2.4.2. Viscosity
2.4.3. Spreadability and Extrudability Tests
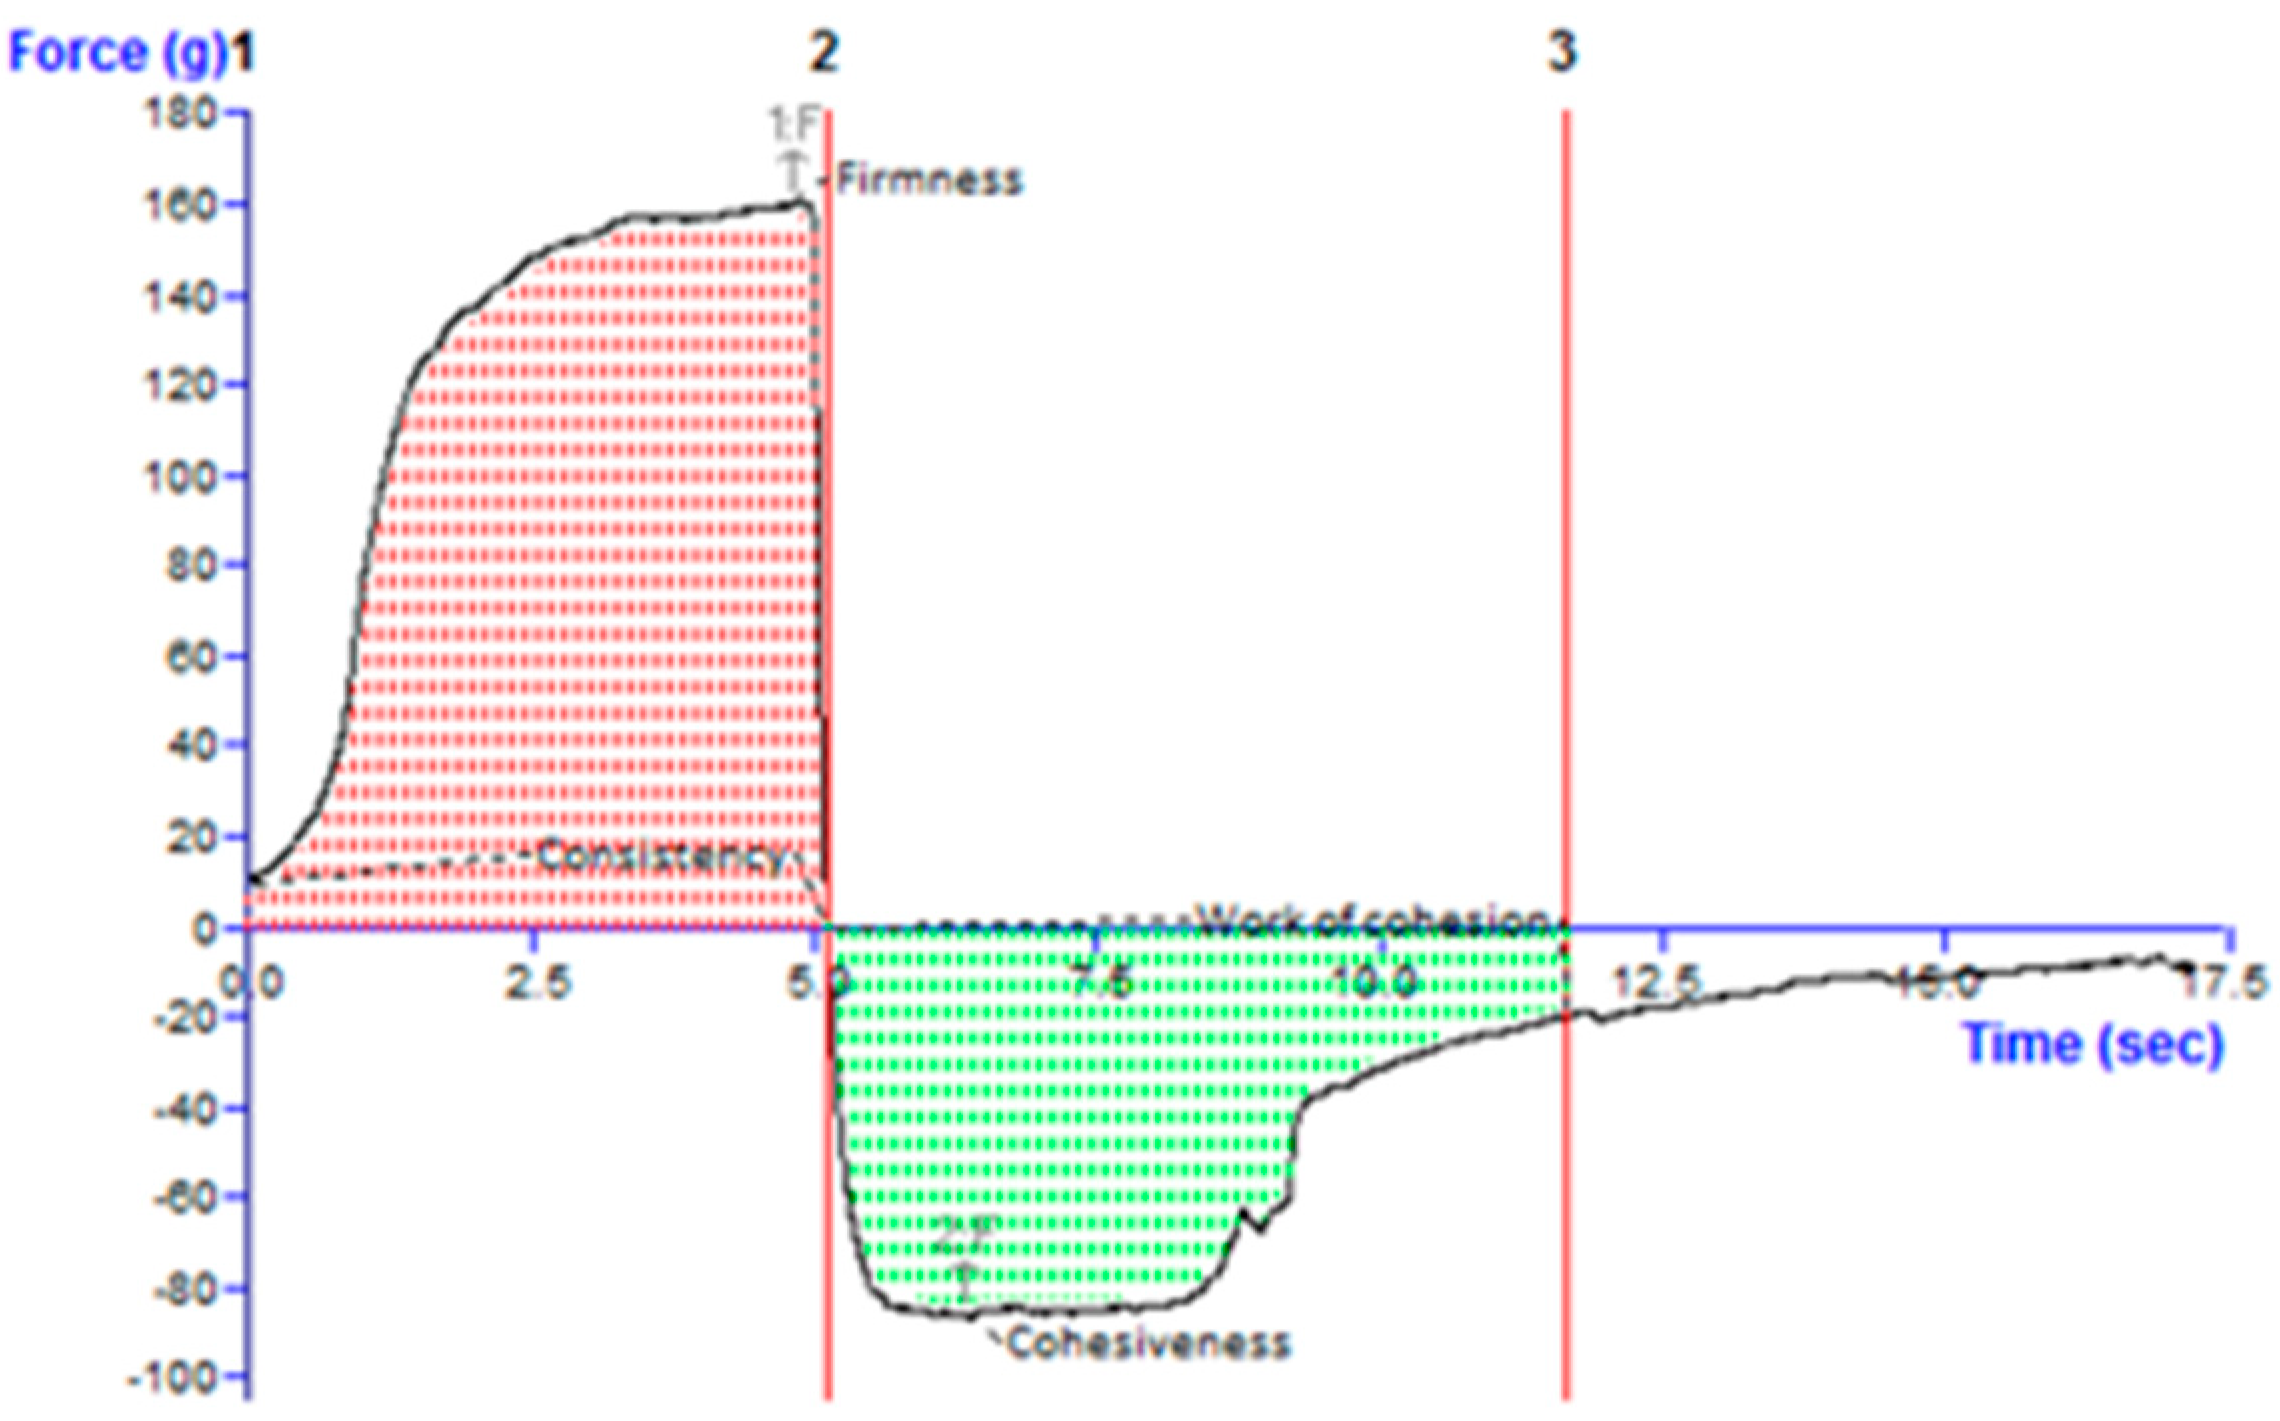
2.4.4. Texture Analysis
2.5. Analytical Method Development
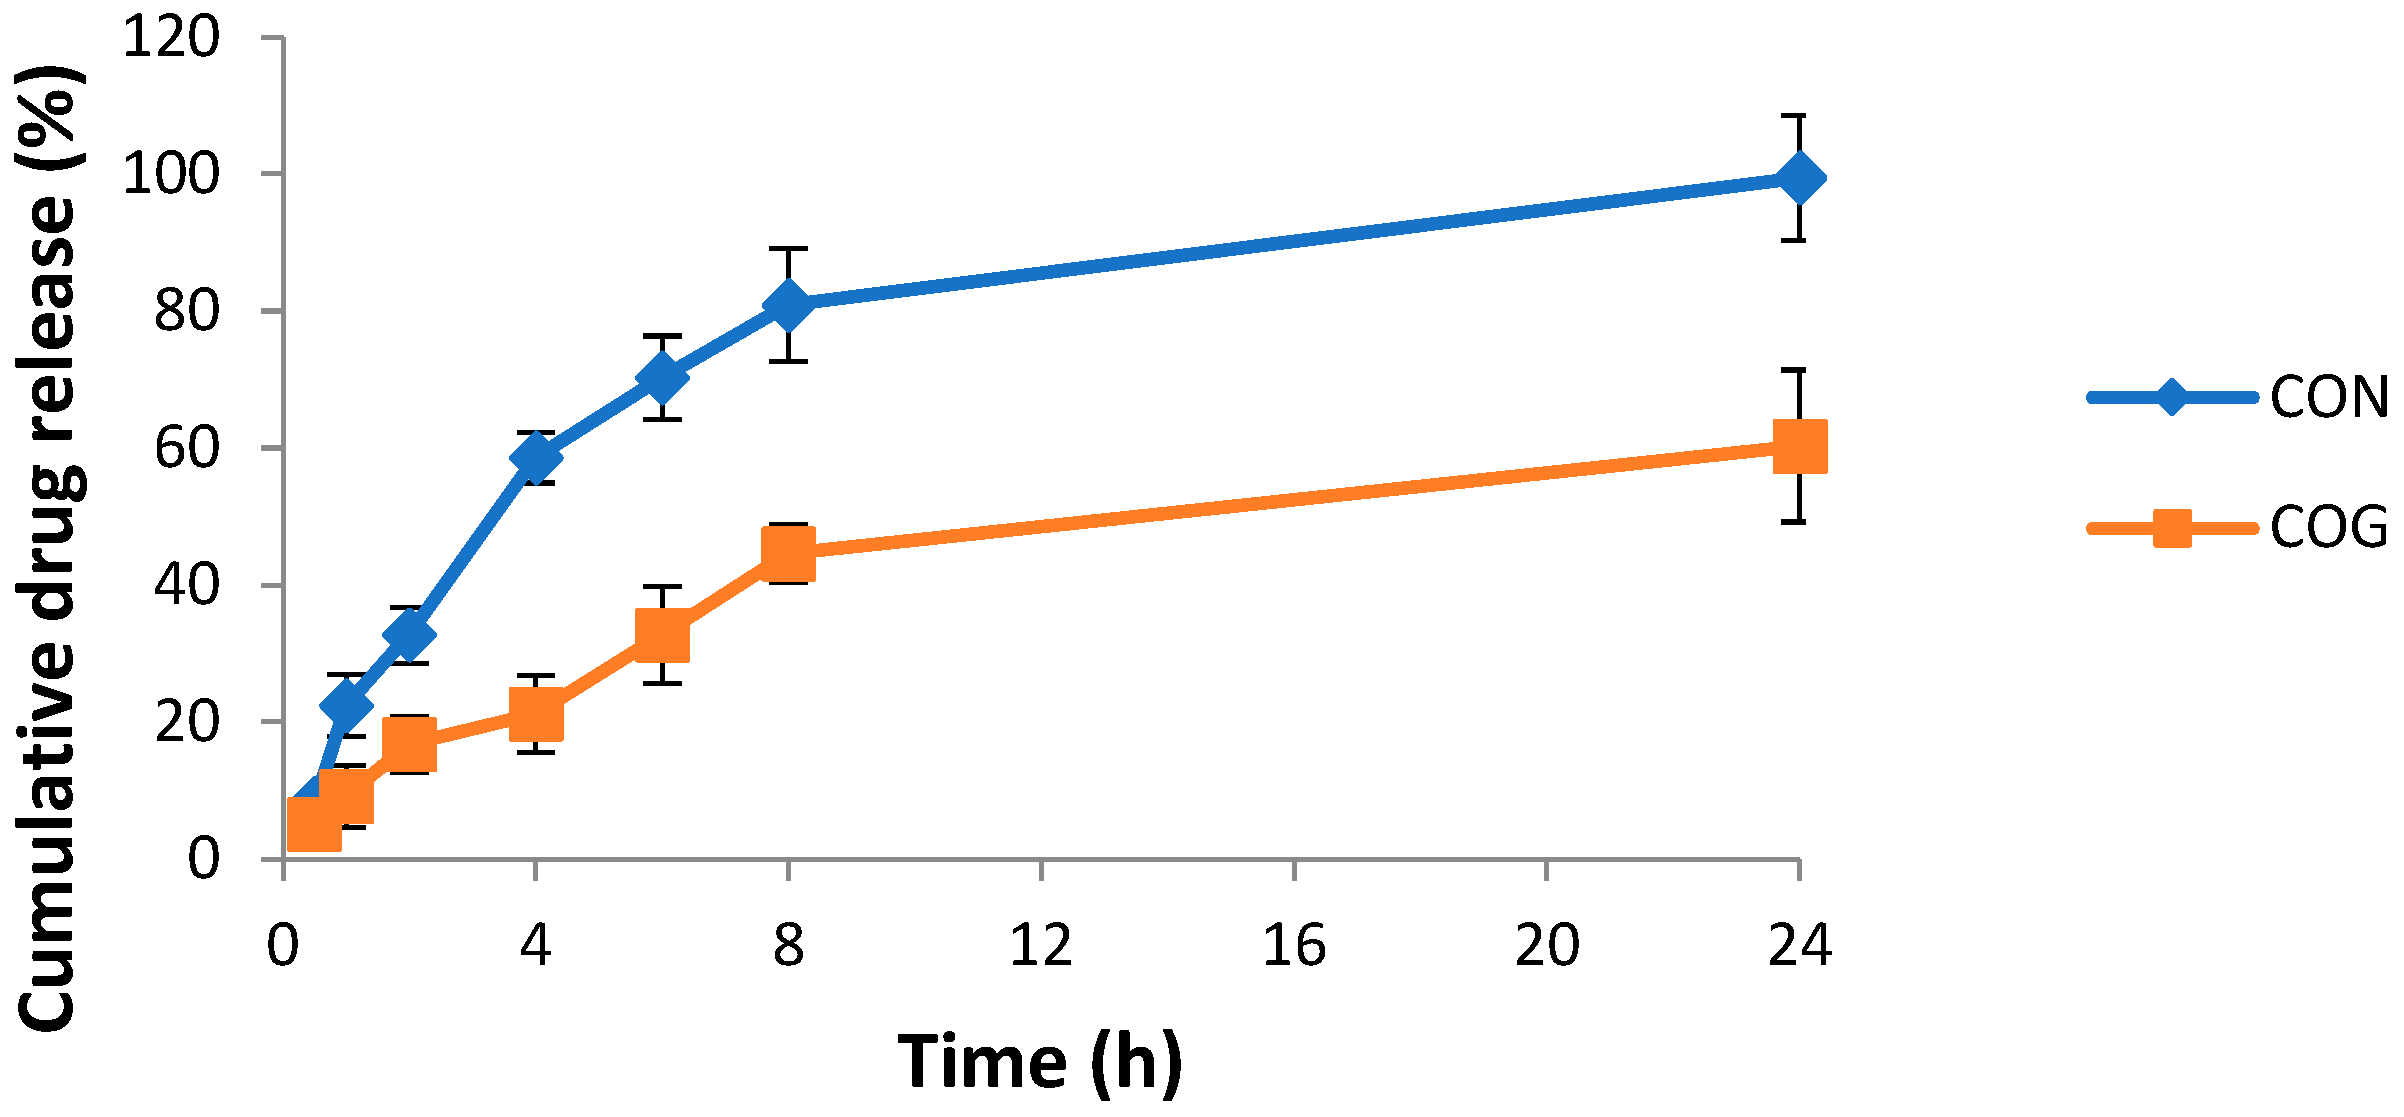
2.6. In Vitro Drug Diffusion Study
2.7. Drug-Release Kinetics
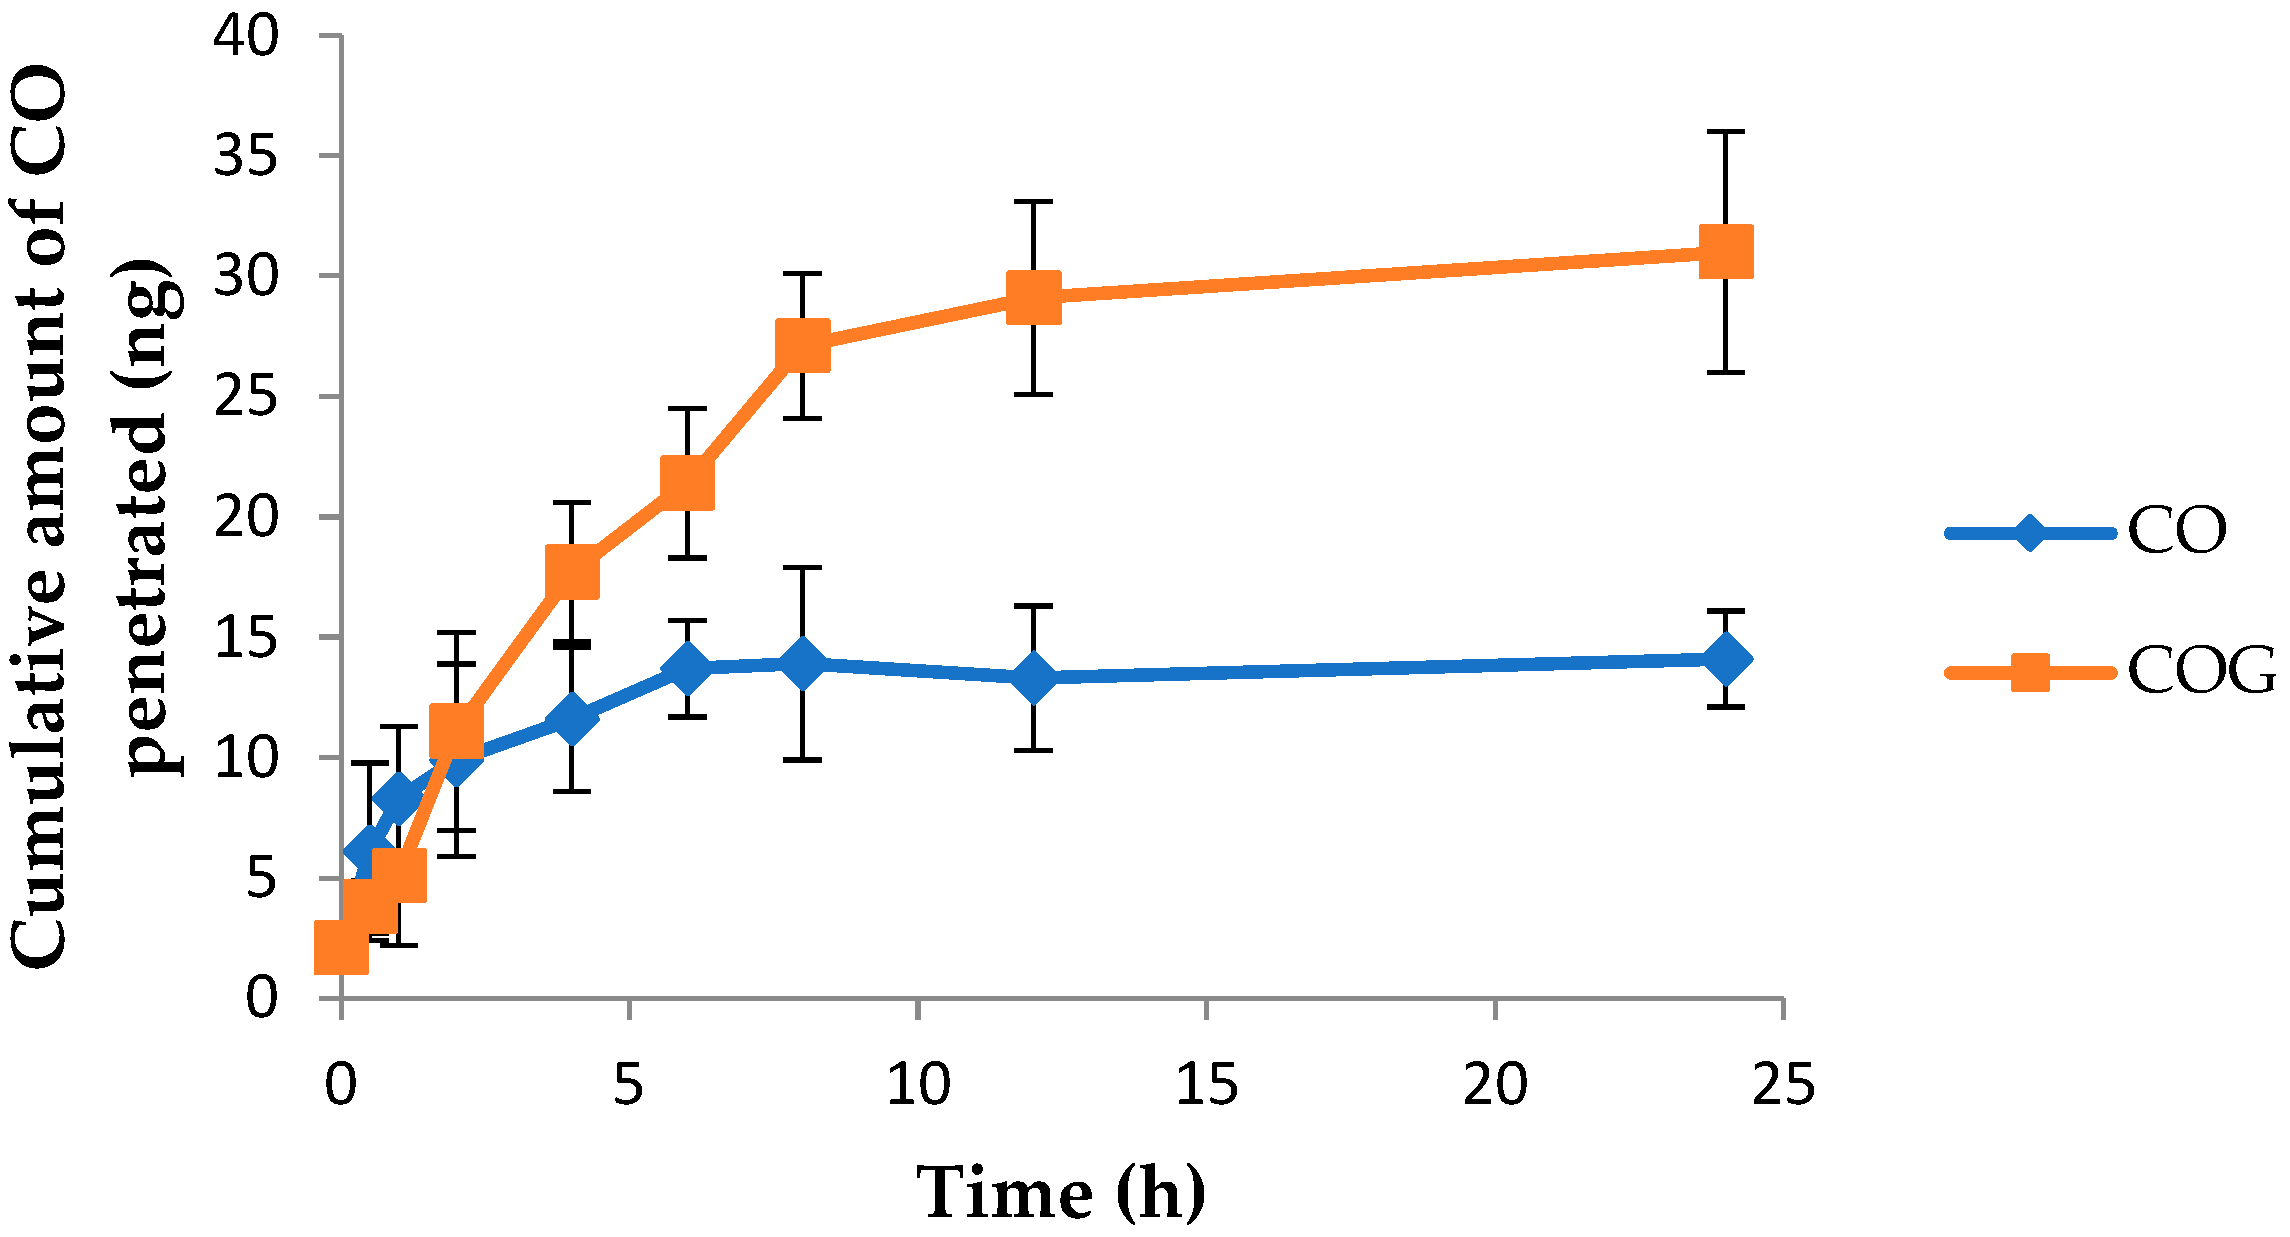
2.8. Skin Penetration Study
2.9. In Vivo Studies
2.9.1. Tail Flick Test
2.9.2. Acetic Acid-Induced Writhing Test
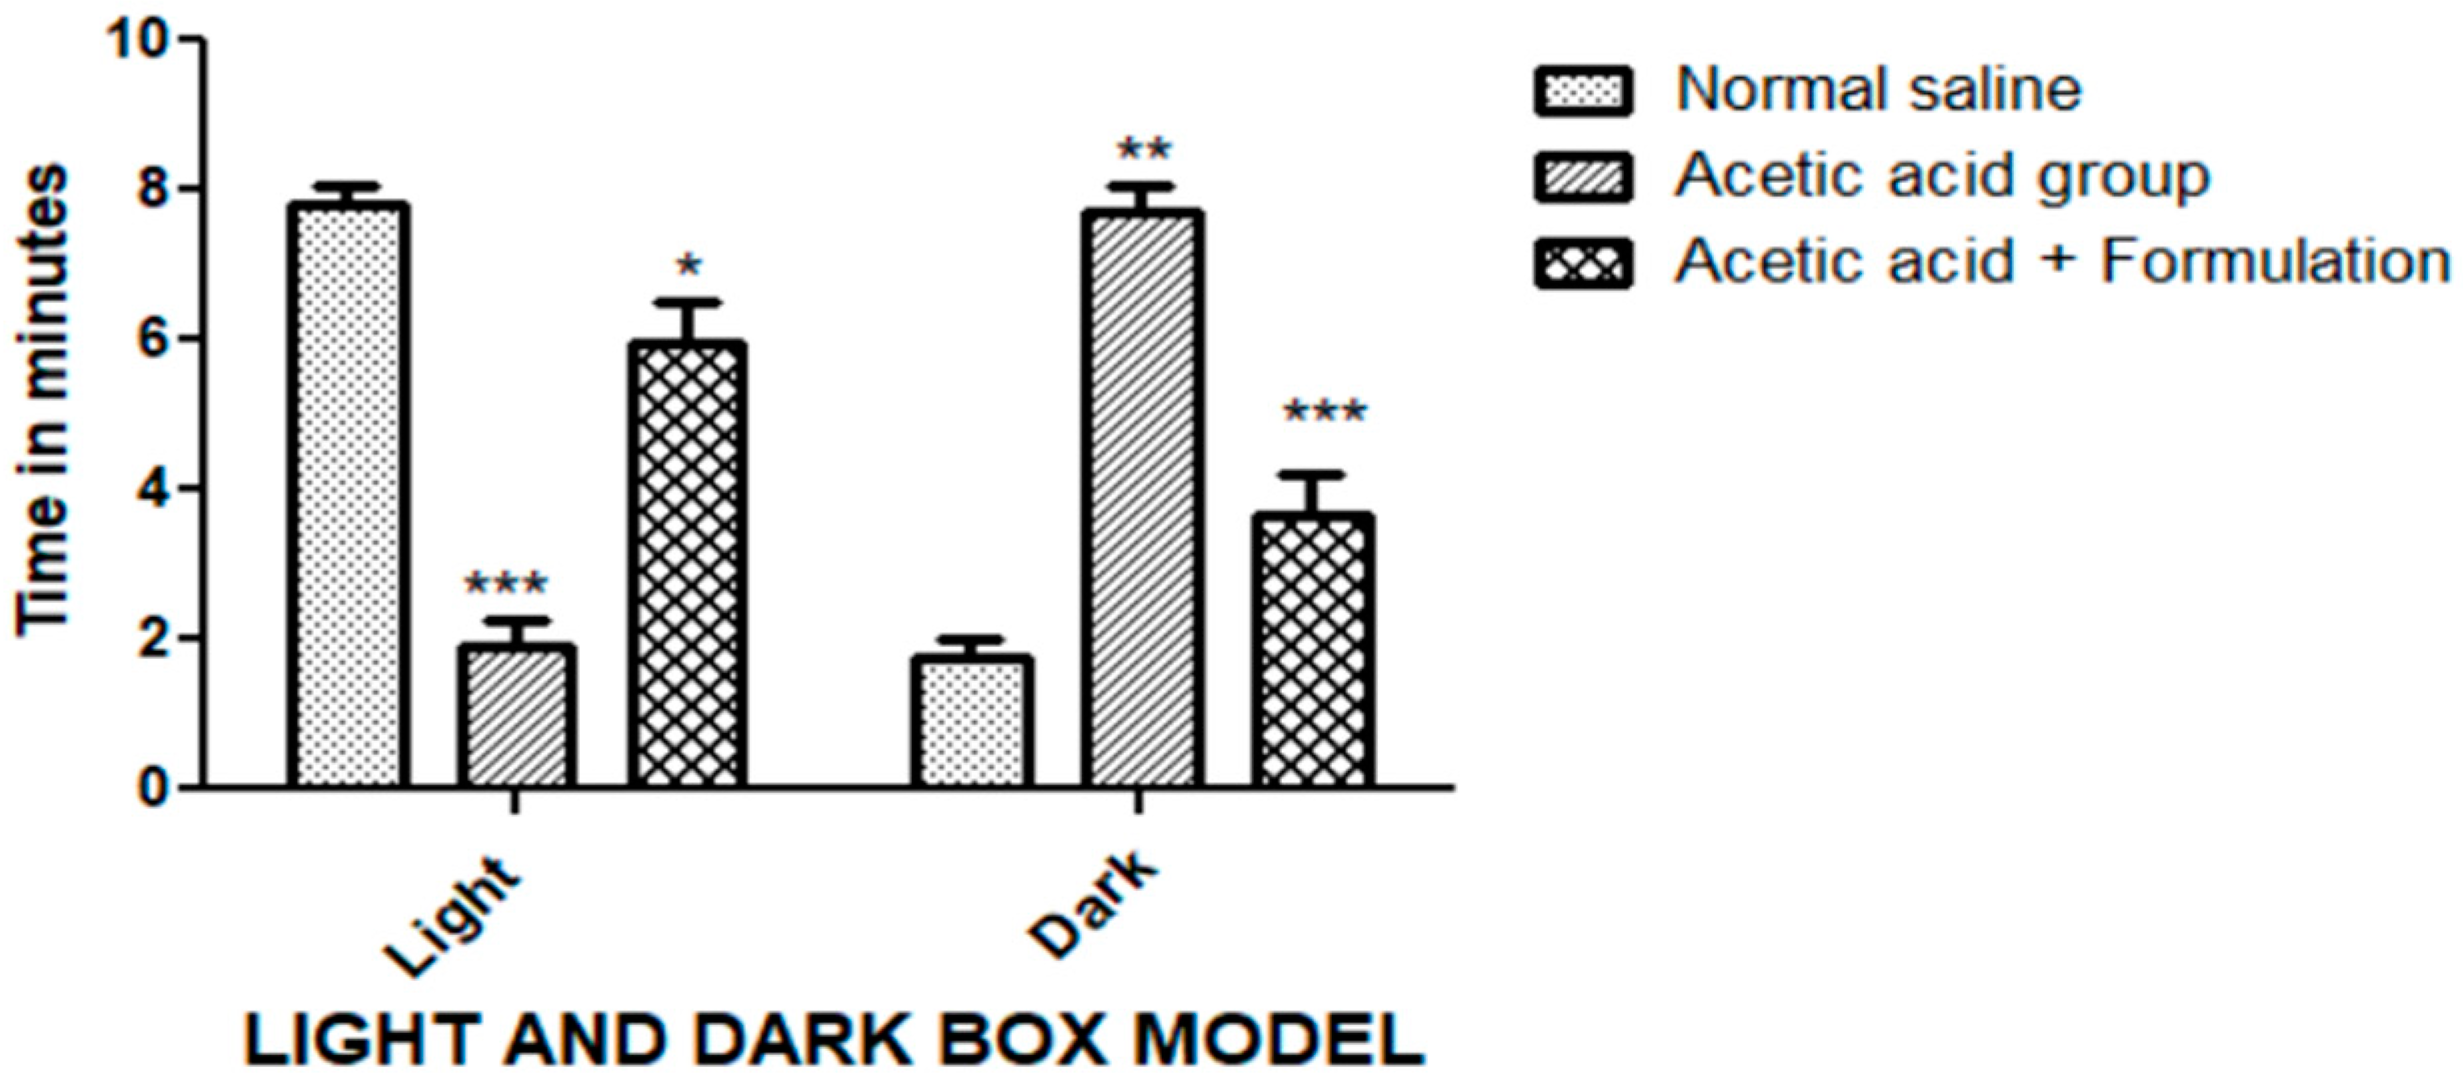
2.9.3. Light/Dark Box Model
2.10. Skin Irritation Test
2.11. Stability Study
2.12. Discussion
3. Conclusions
4. Materials and Methods
4.1. Materials
4.2. Method of Preparation
4.2.1. Selection of the Nanoemulsion-Forming Zone viaPseudo-Ternary Phase Diagrams
4.2.2. Preparation of Nanoemulsion
4.2.3. Thermodynamic Stability Studies of Developed Nanoemulsions
4.2.4. Characterization of Optimized Nanoemulsion Formulations
Particle Size, Zeta Potential, and Polydispersity Index
Transmission Electron Microscopy (TEM)
Compatibility Studies
4.2.5. Preparation of the Nanogel
4.2.6. Characterization and Evaluation of Nanoemulsion-Based Chamomile Nanogel
pH Measurement
Viscosity
Spreadability
Extrudability
Texture Analysis
4.2.7. Analytical Method Development
4.2.8. In Vitro Studies
4.2.9. Drug-Release Kinetics
4.2.10. Skin Penetration Study
4.2.11. Animal Studies
Tail Flick Test
Acetic Acid-Induced Writhing Test
Light/Dark Box Model
4.2.12. Skin Irritation Test
4.2.13. Stability Study
Author Contributions
Funding
Institutional Review Board Statement
Informed Consent Statement
Data Availability Statement
Conflicts of Interest
References
- Rizzoli, P. Pain Medicine: An Essential Review; Yong, R., Nguyen, M., Nelson, E., Urman, R., Eds.; Springer: Cham, Switzerland, 2017; Chapter 138; p. 521. [Google Scholar]
- Davenport, W.J.; Pringsheim, T.M. A 32-year-old woman with headache. CMAJ 2016, 188, E533–E534. [Google Scholar] [CrossRef] [PubMed][Green Version]
- Teleanu, R.I.; Vladacenco, O.; Teleanu, D.M.; Epure, D.A. Treatment of Pediatric Migraine: A Review. Maedica 2016, 11, 136–143. [Google Scholar]
- González-Hernández, A.; Marichal-Cancino, B.A.; MaassenVanDenBrink, A.; Villalon, C.M. Side effects Associated with Current and Prospective Antimigraine Pharmacotherapies. Expert Opin. Drug Metab. Toxicol. 2018, 14, 25–41. [Google Scholar] [CrossRef] [PubMed]
- Teja, P.K.; Mithiya, J.; Kate, A.S.; Bairwa, K.; Chauthe, S.K. Herbal Nanomedicines: Recent Advancements, Challenges, Opportunities and Regulatory Overview. Phytomedicine 2022, 96, 153890. [Google Scholar] [CrossRef]
- Sah, A.; Naseef, P.P.; Kuruniyan, M.S.; Jain, G.K.; Zakir, F.; Aggarwal, G. A Comprehensive Study of Therapeutic Applications of Chamomile. Pharmaceuticals 2022, 15, 1284. [Google Scholar] [CrossRef] [PubMed]
- Zargaran, A.; Borhani-Haghighi, A.; Faridi, P.; Daneshamouz, S.; Kordafshari, G.; Mohagheghzadeh, A. Potential Effect and Mechanism of Action of Topical Chamomile (Matricaria chammomila L.) oil on Migraine Headache: A Medical Hypothesis. Med. Hypotheses 2014, 83, 566–569. [Google Scholar] [CrossRef]
- Kiraly, A.J.; Soliman, E.; Jenkins, A.; Van Dross, R.T. Apigenin inhibits COX-2, PGE2, and EP1 and also initiates terminal differentiation in the epidermis of tumor bearing mice. Prostaglandins Leukot. Essent. Fat. Acids 2016, 104, 44–53. [Google Scholar] [CrossRef] [PubMed]
- Taheri, P.; Mohammadi, F.; Nazeri, M.; Zarei, M.R.; Chamani, G.; Esfahlani, M.A.; Taheri, F.; Shabani, M. Nitric oxide role in anxiety-like behavior, memory and cognitive impairments in animal model of chronic migraine. Heliyon 2020, 6, e05654. [Google Scholar] [CrossRef] [PubMed]
- Wilson, R.J.; Li, Y.; Yang, G.; Zhao, C.X. Nanoemulsions for drug delivery. Particuology 2022, 64, 85–97. [Google Scholar] [CrossRef]
- Ribeiro, L.N.M.; Da Silva, G.H.R.; Couto, V.M.; Castro, S.R.; Breitkreitz, M.C.; Martinez, C.S.; Igartúa, D.E.; Prieto, M.J.; De Paula, E. Functional Hybrid Nanoemulsions for Sumatriptan Intranasal Delivery. Front. Chem. 2020, 8, 589503. [Google Scholar] [CrossRef]
- Algahtani, M.S.; Ahmad, M.Z.; Ahmad, J. Nanoemulsion loaded Polymeric Hydrogel for Topical Delivery of Curcumin in Psoriasis. J. Drug Deliv. Sci. Technol. 2020, 59, 101847. [Google Scholar] [CrossRef]
- Maslowski, M.; Aleksieiev, A.; Miedzianowska, J.; Strzelec, K. Potential Application of Peppermint (Mentha piperita L.), German chamomile (Matricaria chamomilla L.) and Yarrow (Achillea millefolium L.) as Active Fillers in Natural Rubber Biocomposites. Int. J. Mol. Sci. 2021, 22, 7530. [Google Scholar] [CrossRef] [PubMed]
- Zheng, Y.; Ouyang, W.-Q.; Wei, Y.-P.; Syed, S.F.; Hao, C.-S.; Wang, B.-Z.; Shang, Y.-H. Effects of Carbopol® 934 proportion on Nanoemulsion gel for Topical and Transdermal Drug Delivery: A Skin Permeation Study. Int. J. Nanomed. 2016, 11, 5971–5987. [Google Scholar] [CrossRef]
- Hole, K.; Tjolsen, A. Tail flick test. In Enclyopedia of Pain; Schmidt, R., Willis, W., Eds.; Springer: Berlin, Germany, 2007; pp. 2392–2395. [Google Scholar]
- Gupta, A.K.; Parasar, D.; Sagar, A.; Choudhary, V.; Chopra, B.S.; Garg, R.; Ashish; Khatri, N. Analgesic and Anti-inflammatory Properties of Gelsolin in Acetic acid induced Writhing, Tail immersion and Carrageenan induced paw edema in mice. PLoS ONE 2015, 10, e0135558. [Google Scholar] [CrossRef]
- Liao, C.C.; Li, J.M.; Chen, C.H.; Lin, C.L.; Hsieh, C.L. Effect of Paeonia lactiflora, a Traditional Chinese herb, on Migraines based on Clinical Application and Animal Behavior Analyses. Biomed. Pharmacother. 2019, 118, 109276. [Google Scholar] [CrossRef]
- Bhaskaran, N.; Shukla, S.; Srivastava, J.K.; Gupta, S. Chamomile: An Anti-inflammatory agent Inhibits inducible Nitric Oxide Synthase Expression by Blocking RelA/p65 Activity. Int. J. Mol. Med. 2010, 26, 935–940. [Google Scholar] [PubMed]
- Tajti, J.; Vecsei, L. The Mechanism of Peripheral and Central Sensitization in Migraine. A Literature Review. Neuropsychopharmacol. Hung. 2009, 11, 15–21. [Google Scholar]
- Riss, T.L.; Moravec, R.A.; Niles, A.L.; Duellman, S.; Benink, H.A.; Worzella, T.J.; Minor, L. Cell viability assay. In Assay Guidance Manual; Riss, T.L., Minor, L., Eds.; NCBI: Bethesda, MD, USA, 2016; pp. 1–41. [Google Scholar]
- Zakir, F.; Ahmad, A.; Farooq, U.; Mirza, M.A.; Tripathi, A.; Singh, D.; Shakeel, F.; Mohapatra, S.; Ahmad, F.J.; Kohli, K. Design and Development of a Commercially viable in situ Nanoemulgel for the Treatment of Postmenopausal Osteoporosis. Nanomedicine 2020, 15, 1167–1187. [Google Scholar] [CrossRef] [PubMed]
- Nawaz, A.; Latif, M.S.; Alnuwaiser, M.A.; Ullah, S.; Iqbal, M.; Alfatama, M.; Lim, V. Synthesis and Characterization of Chitosan-Decorated Nanoemulsion gel of 5-Fluorouracil for Topical Delivery. Gels 2022, 8, 412. [Google Scholar] [CrossRef]
- Sakeena, M.H.; Muthanna, F.A.; Ghassan, Z.A.; Kanakal, M.M.; Elrashid, S.M.; Munavvar, A.S. Formulation and In vitro Evaluation of Ketoprofen in Palm oil Esters Nanoemulsion for Topical Delivery. J. Oleo Sci. 2010, 59, 223–228. [Google Scholar] [CrossRef]
- Harjot, K.; John, N.A.M. Nanoemulsion for Migraine Prophylaxis Nasal Drug Delivery: Preparation, Characterization and In vitro evaluation. Pharm. Nanotechnol. 2016, 4, 229–241. [Google Scholar] [CrossRef] [PubMed]
- Narawi, M.M.; Chiu, H.I.; Yong, Y.K.; Zain, N.N.M.; Ramachandran, M.R.; Tham, C.L.; Samsurrijal, S.F.; Lim, V. Biocompatible Nutmeg oil-Loaded Nanoemulsion as Phyto-repellent. Front. Pharmacol. 2020, 11, 214. [Google Scholar] [CrossRef] [PubMed]
- Latif, M.S.; Nawaz, A.; Asmari, M.; Uddin, J.; Ullah, H.; Ahmad, S. Formulation Development and In vitro/in vivo Characterization of Methotrexate-Loaded Nanoemulsion Gel Formulations for Enhanced Topical Delivery. Gels 2022, 9, 3. [Google Scholar] [CrossRef]
- Ahmed, S.; Gull, A.; Aqil, M.; Ansari, M.D.; Sultana, Y. Poloxamer-407 Thickened Lipid Colloidal System of Agomelatine for Brain Targeting: Characterization, Brain Pharmacokinetic Study and Behavioral Study on Wistar rats. Colloids Surf. B Biointerfaces 2019, 181, 426–436. [Google Scholar] [CrossRef]
- Guzelmeric, E.; Vovk, I.; Yesilada, E. Development and Validation of an HPTLC method for Apigenin 7-O-glucoside in Chamomile Flowers and its Application for Fingerprint Discrimination of Chamomile-like Materials. J. Pharm. Biomed. Anal. 2015, 107, 108–118. [Google Scholar] [CrossRef]
- Al Bratty, M.; Govindaram, L.K.; Thangavel, N.; Alhazmi, H.A.; Ibrahim, A.M.M.; Maruthamuthu, V.; Kandasamy, R. High Performance Thin-Layer Chromatography and In vitro Cytotoxic Studies on Ethanol Extract of Matricaria chamomilla L. (Asteraceae) Flowers. Trop. J. Pharm. Res. 2019, 18, 1969–1976. [Google Scholar] [CrossRef]
- Rani, K.R.V.; Rajan, S.; Bhupathyraaj, M.; Priya, R.K.; Halligudi, N.; Al-Ghazali, M.A.; Sridhar, S.B.; Shareef, J.; Thomas, S.; Desai, S.M.; et al. The Effect of Polymers on Drug Release Kinetics in Nanoemulsion in situ Gel Formulation. Polymers 2022, 14, 427. [Google Scholar] [CrossRef] [PubMed]
- Zakir, F.; Ahmad, A.; Mirza, M.A.; Kohli, K.; Ahmad, F.J. Exploration of a Transdermal Nanoemulgel as an Alternative Therapy for Postmenopausal Osteoporosis. J. Drug Deliv. Sci. Technol. 2021, 65, 102745. [Google Scholar] [CrossRef]
- Meymandi, M.S.; Sepehri, G.; Izadi, G.; Zamiri, Z. Evidence for Antinociceptive Effects of Combined Administration of Vitamin E and Celecoxib in Tail-flick and Formalin test in Male rats. Pharmacol. Rep. 2019, 71, 457–464. [Google Scholar] [CrossRef]
- Feng, L.; Cui, M.; Willis, W.D. Gabapentin Markedly Reduces Acetic Acid-induced Visceral Nociception. Anesthesiology 2003, 98, 729–733. [Google Scholar] [CrossRef]
- Casili, G.; Lanza, M.; Filippone, A.; Campolo, M.; Paterniti, I.; Cuzzocrea, S.; Esposito, E. Dimethyl Fumarate Alleviates the Nitroglycerin (NTG)-induced Migraine in mice. J. Neuroinflammation 2020, 17, 59. [Google Scholar] [CrossRef] [PubMed]
- Vuralli, D.; Wattiez, A.S.; Russo, A.F.; Bolay, H. Behavioral and Cognitive Animal Models in Headache Research. J. Headache Pain 2019, 20, 11. [Google Scholar] [CrossRef] [PubMed]
- Indrati, O.; Martien, R.; Rohman, A.; Nugroho, A.K. Development of Nanoemulsion-Based Hydrogel containing Andrographolide: Physical Properties and Stability Evaluation. J. Pharm. Bioallied Sci. 2020, 12 (Suppl. 2), S816–S820. [Google Scholar] [PubMed]


| Oil:Smix | Heating–Cooling Cycles | Centrifugation | Freeze–Thaw | Inference |
|---|---|---|---|---|
| 1:5 | Clear | Clear | Clear | Stable |
| 1:6 | PS | PS | PS | Unstable |
| 1:7 | PS | PS | PS | Unstable |
| 1:8 | PS | PS | PS | Unstable |
| S. No | Groups | Actual Value (cm−1) | Observed Values | |
|---|---|---|---|---|
| Chamomile Oil | Nanoemulsion | |||
| 1. | -CH2- (aliphatic asymmetric) | 2926 | 2929.21 | 2925.55 |
| 2. | C=O | 1730–1750 | 1731.81 | 1732.42 |
| 3. | =C-H (Scissor) | Approx. 1465 | 1456.51 | 1457.14 |
| 4. | C-O | 1000–1300 | 1374.96 | 1355.23 |
| Zero-Order | First-Order | Higuchi | Korsmeyer–Peppas | Hixson–Crowell | ||||||
|---|---|---|---|---|---|---|---|---|---|---|
| K0 (intercept) | R2 | K1 (intercept) | R2 | KH (intercept) | R2 | KKP (intercept) | N | R2 | KHC | R2 |
| 0.054 | 0.1065 | 0.001 | 0.1124 | 0.237 | 0.8763 | 0.290 | 0.417 | 0.9051 | 0.000 | 0.1104 |
| Groups | Dose | Time (S) | Percent Inhibition | |
|---|---|---|---|---|
| Pre-Treatment | Post-Treatment | |||
| Control (saline) | 1 mL/kg, IP | 2.88 ± 0.75 | 2.81 ± 1.12 | - |
| Standard treatment (diclofenac) | 20 mg/kg, IP | 2.77 ± 0.31 | 7.21 ± 0.97 | 36.3 |
| Test treatment (COG) | 100 mg/rat, topical | 2.58 ± 0.93 | 6.88 ± 0.81 | 34.62 |
| Groups | Dose | No. of Writhes | % Protection |
|---|---|---|---|
| Control (saline) | 0.3%, 10 mL/kg Ip | 24.88 ± 0.98 | |
| Standard (diclofenac sodium) | 20 mg/kg Ip | 11.27 ± 1.1 | 54.7% |
| Test (COG) | 100 mg/rat, topical | 14.75 ± 0.95 | 40.71% |
| Storage Conditions | Parameters | ||||
|---|---|---|---|---|---|
| Time | Temperature/Relative Humidity | Appearance | Phase Separation | pH | Percent Transmittance |
| 0 day | 25 ± 2 °C/60 ± 5% RH | Good | No | 5.9 | 96.33% |
| 40 ± 2 °C/75 ± 5% RH | Good | No | 5.9 | 96.41% | |
| 30 days | 25 ± 2 °C/60 ± 5% RH | Good | No | 5.8 | 95.18% |
| 40 ± 2 °C/75 ± 5% RH | Good | No | 6.0 | 95.12% | |
| 60 days | 25 ± 2 °C/60 ± 5% RH | Good | No | 6.1 | 95.89% |
| 40 ± 2 °C/75 ± 5% RH | Good | No | 6.0 | 95.93% | |
Disclaimer/Publisher’s Note: The statements, opinions and data contained in all publications are solely those of the individual author(s) and contributor(s) and not of MDPI and/or the editor(s). MDPI and/or the editor(s) disclaim responsibility for any injury to people or property resulting from any ideas, methods, instructions or products referred to in the content. |
© 2023 by the authors. Licensee MDPI, Basel, Switzerland. This article is an open access article distributed under the terms and conditions of the Creative Commons Attribution (CC BY) license (https://creativecommons.org/licenses/by/4.0/).
Share and Cite
Sah, A.; Aggarwal, G.; Jain, G.K.; Zaidi, S.M.A.; Naseef, P.P.; Kuruniyan, M.S.; Zakir, F. Design and Development of a Topical Nanogel Formulation Comprising of a Unani Medicinal Agent for the Management of Pain. Gels 2023, 9, 794. https://doi.org/10.3390/gels9100794
Sah A, Aggarwal G, Jain GK, Zaidi SMA, Naseef PP, Kuruniyan MS, Zakir F. Design and Development of a Topical Nanogel Formulation Comprising of a Unani Medicinal Agent for the Management of Pain. Gels. 2023; 9(10):794. https://doi.org/10.3390/gels9100794
Chicago/Turabian StyleSah, Amit, Geeta Aggarwal, Gaurav K. Jain, Syed Mohammad Abbas Zaidi, Punnoth Poonkuzhi Naseef, Mohamed S. Kuruniyan, and Foziyah Zakir. 2023. "Design and Development of a Topical Nanogel Formulation Comprising of a Unani Medicinal Agent for the Management of Pain" Gels 9, no. 10: 794. https://doi.org/10.3390/gels9100794
APA StyleSah, A., Aggarwal, G., Jain, G. K., Zaidi, S. M. A., Naseef, P. P., Kuruniyan, M. S., & Zakir, F. (2023). Design and Development of a Topical Nanogel Formulation Comprising of a Unani Medicinal Agent for the Management of Pain. Gels, 9(10), 794. https://doi.org/10.3390/gels9100794