Article

Spectral Analysis of Confined Cylinder Wakes

Department of Mechanical Engineering, The University of Melbourne, Melbourne, VIC 3010, Australia
*
Author to whom correspondence should be addressed.
Fluids 2025, 10(4), 84; https://doi.org/10.3390/fluids10040084
Submission received: 29 January 2025 / Revised: 5 March 2025 / Accepted: 17 March 2025 / Published: 25 March 2025
(This article belongs to the Special Issue Aerodynamics and Aeroacoustics of Vehicles, 4th Edition)

Abstract

:
Bluff body flows, while commonly assumed to be isolated, are often subject to confinement effects due to interactions with nearby objects. In this study, a simple approximation of such a flow configuration is considered, where a cylinder is placed symmetrically within an infinite channel. The presence of walls implies the wake is physically confined and introduces interactions between the wake and the boundary layer along the wall. To isolate the effect of confinement, simulations are conducted with slip channel walls, removing the boundary layers. Comparisons of flow statistics between simulations of slip and no-slip channel walls show minor differences at a low blockage ratio, β (defined as the ratio of cylinder diameter to channel height), while for larger blockage ratios, the differences are significant. Spectral analysis is also performed on the wake and shear layers. At the lowest blockage, β = 0.3 , little modification is made to the wake, and we find that Kármán vortices are one-way coupled to the boundary layers along the walls. For β = 0.5 , wall–wake interactions are determined to significantly contribute to wake dynamics, thus to two-way coupling Kármán vortices and the wall boundary layers. Finally, for β = 0.7 , the absence of Kármán shedding couples Kelvin–Helmoltz vortices in the shear layer, separating off the cylinder to the wall boundary layer.

1. Introduction

A quintessential problem in fluid mechanics, flow past a circular cylinder serves as a simplification of many practical flows, from aircraft and wind turbines to flow around bridge piers and offshore structures. Despite the relative simplicity of the geometry, a vast range of flow phenomena emerge with variations in Reynolds number ( R e ), defined by the upstream flow velocity (U) and cylinder diameter (D). Comprehensive reviews on the subject are given by Williamson [1] and Derakhshandeh and Alam [2]. At low R e , the flow is steady and symmetric about the centreline until R e 47 [3], where vortices begin to shed behind the cylinder, forming a Kámán vortex street. The transition to three-dimensionality then occurs at R e 190 through a mode A instability [4], characterised by long wavelength undulations in Kármán vortices of approximately 3 D . As R e further increases, the transition to finer-scale structures of diameter D occurs at R e 260 [4]. A transition to turbulence in the separated shear layers occurs around R e = 1000 , forming the sub-critical regime, with the bulk of experimental and numerical studies occurring at R e = 3900 [5,6,7,8,9,10,11,12,13,14,15].
Practically, however, an isolated cylinder may not provide a representative approximation, as confinement effects may be provided by nearby structures. For example, the proximity of wind turbines or bridge piers located in water channels may exert an effect. Such confinement introduces complexities that dramatically alter flow behaviour, with profound implications in engineering applications arising from wall effects, which have a strong influence on wake patterns. Hence, a natural simplification is to consider a cylinder placed within a channel. The placement of such walls introduces an additional geometric parameter that defines the flow, known as the blockage ratio, defined as the ratio of cylinder diameter to channel height ( H ) , i.e., β = D / H . At small blockage ratios, little changes to wake topology are observed from the unconfined case [16,17]. Interactions with the wall boundary layer result in Kármán vortices crossing the centreline, forming a reverse Kármán vortex street. To characterise these changes, Nguyen and Lei [18] sought to understand the evolution of hydrodynamic coefficients with blockage in the sub-critical regime. It was determined within the range β 0.5 and R e 30,000, and the mean drag coefficient and Strouhal number increased with β . Similar observations were made by Ooi et al. [17] at R e = 3900.
With increases in blockage, wake topology has been found to drastically change as well. In the laminar regime, Sahin and Owens [16] determined the wake transitions through a symmetry breaking pitchfork bifurcation. However, at a higher Reynolds number, the suppression of vortex shedding has been observed at β = 0.6 [19,20]. It has been suggested that this effect may be caused by low-frequency perturbations [19] or side-wall effects [21]. Even larger blockage ratios see the wake transitioning to a mean asymmetric state [16,17], with a spanwise modulated asymmetry possible in appropriate initial conditions [22]. Recent work by Lu et al. [23] has suggested that the effect is caused by interactions between wake and wall, as they are able to recover symmetry in the flow at β = 0.7 through the introduction of turbulence upstream. However, no clear explanation has been provided in the literature. For additional information, we refer the reader to the comprehensive review by Nguyen et al. [24].
As the channel walls are brought closer to the cylinder, two phenomena affect wake dynamics and thus hydrodynamic coefficients. The first of these is the physical confinement effect of the presence of the walls. Meanwhile, the second occurs from the formation of a boundary layer along the channel wall, which may interact with shear layers separating from the cylinder. However, in studies thus far, both effects have been considered together due to the difficulty in separating the two in physical problems. Nevertheless, numerical simulations allow for the prescription of boundary conditions that eliminate wall shear and thus enable te investigation of both these effects separately. Hence, the objective of this study is to understand how these contribute to the dynamics of flow past a cylinder in a channel. Direct numerical simulations (DNSs) have been conducted with varying boundary conditions to eliminate boundary layers along the channel walls, which we outline in Section 2. Comparisons of instantaneous flow structures and statistics are then presented in Section 3 and Section 4, respectively. Spectral analysis is conducted in Section 5 and Section 6. Finally, conclusions are drawn in Section 7.

2. Methodology

2.1. Numerical Dataset

In this work, we consider flow past a circular cylinder of diameter D placed symmetrically within a channel of height H, as shown in Figure 1, along with the computational domain. We define the x, y, and z ordinates as the streamwise, crossflow, and spanwise directions, respectively. The upstream flow is assumed to be laminar and fully developed, and given by
u ( y ) = U 1 2 y H 2 ,
where U is the centreline velocity upstream. Based on U as a velocity scale, we define the Reynolds number as R e = U D / ν , following Sahin and Owens [16]. We also note a second nondimensionalisation commonly considered [23,24] is the bulk Reynolds number R e b = U b D / ν , where U b is the bulk velocity upstream, particularly when the upstream flow varies between cases. The inlet and outlet boundaries are placed a distance of 10 D upstream and 30 D downstream of the cylinder, respectively. The spanwise domain is assumed to be π D , with periodicity imposed in this direction.
To test how the boundary layer along the walls interacts with the wake, two sets of boundary conditions have been considered for the crossflow boundaries. The first consists of no-slip conditions along y w = ± 1 / ( 2 β ) , as have been previously utilised in the literature [17,18,22,25]. Data for these cases have been obtained from the data set of Ooi et al. [17]. The same numerical method was applied by the authors as is done presently, which we will outline in the following paragraph. The second set of boundary conditions aims to remove the boundary layer along the channel walls, and therefore consists of slip boundaries, defined by
u · n = 0
( u · t ) · n = 0 ,
where n and t are unit vectors normal and tangential to the boundary. To keep the effect of upstream shear on the cylinder, no-slip conditions have been applied along the crossflow boundaries for x / D < 0.5 , with slip conditions only for x / D 0.5 . The effects of upstream shear can be found in [26]. It was shown that the removal of upstream shear does not significantly affect wake topology downstream of the cylinder. Hence, we have decided in this study to keep the upstream shear to allow for easy comparison with published data.
It is of note that for β = 0.0 , the crossflow domain is truncated at y = ± 20 D with slip conditions across the entire boundary. A uniform velocity has also been used along the inlet.
The unsteady three-dimensional incompressible Navier–Stokes equations are solved with the highly accurate code NekRS [27], a GPU extension of Nek5000 [28]. Both Nek5000 and NekRS have been extensively validated for a wide range of flows, including wall-bounded [29,30,31,32], bluff body [17,21,22,26,33,34], compressor [35,36], and buoyancy-driven [37,38,39,40,41,42] flows. The domain is spatially discretised using the spectral element method [43], in which the problem is cast into a weak form and partitioned into E macro-elements, within which the solution is assumed to be represented as a polynomial defined by the Gauss–Lobatto–Legendre (GLL) nodes of order N. A polynomial order of N = 9 has been chosen presently, leading to a total number of grid points of E ( N + 1 ) 3 . Details of each case are given in Table 1. Basis polynomials are assumed to be of equal order for both pressure and velocity spaces using the P N P N method. Temporal discretisation is performed using a backwards differentiation formula for diffusive terms and the operator-integration-factor-splitting scheme (OIFS) for convective terms [44], thus allowing for larger Courant–Friedrichs–Lewy numbers. In the present case, we choose a time-step Δ t such that C F L < 2 , as has been recommended by Fischer et al. [27].
To ensure the quality of our DNS, we compare a length scale defined by the size of each micro-element Δ = Δ x Δ y Δ z 3 with the Kolmogorov length scale η = ( ν 3 / ε ) 1 / 4 , where ε is the instantaneous dissipation
ε = ν u i x j u i x j .
Here, the primed quantities denote fluctuating quantities when Reynolds decomposition is performed
u i = u ¯ i + u i
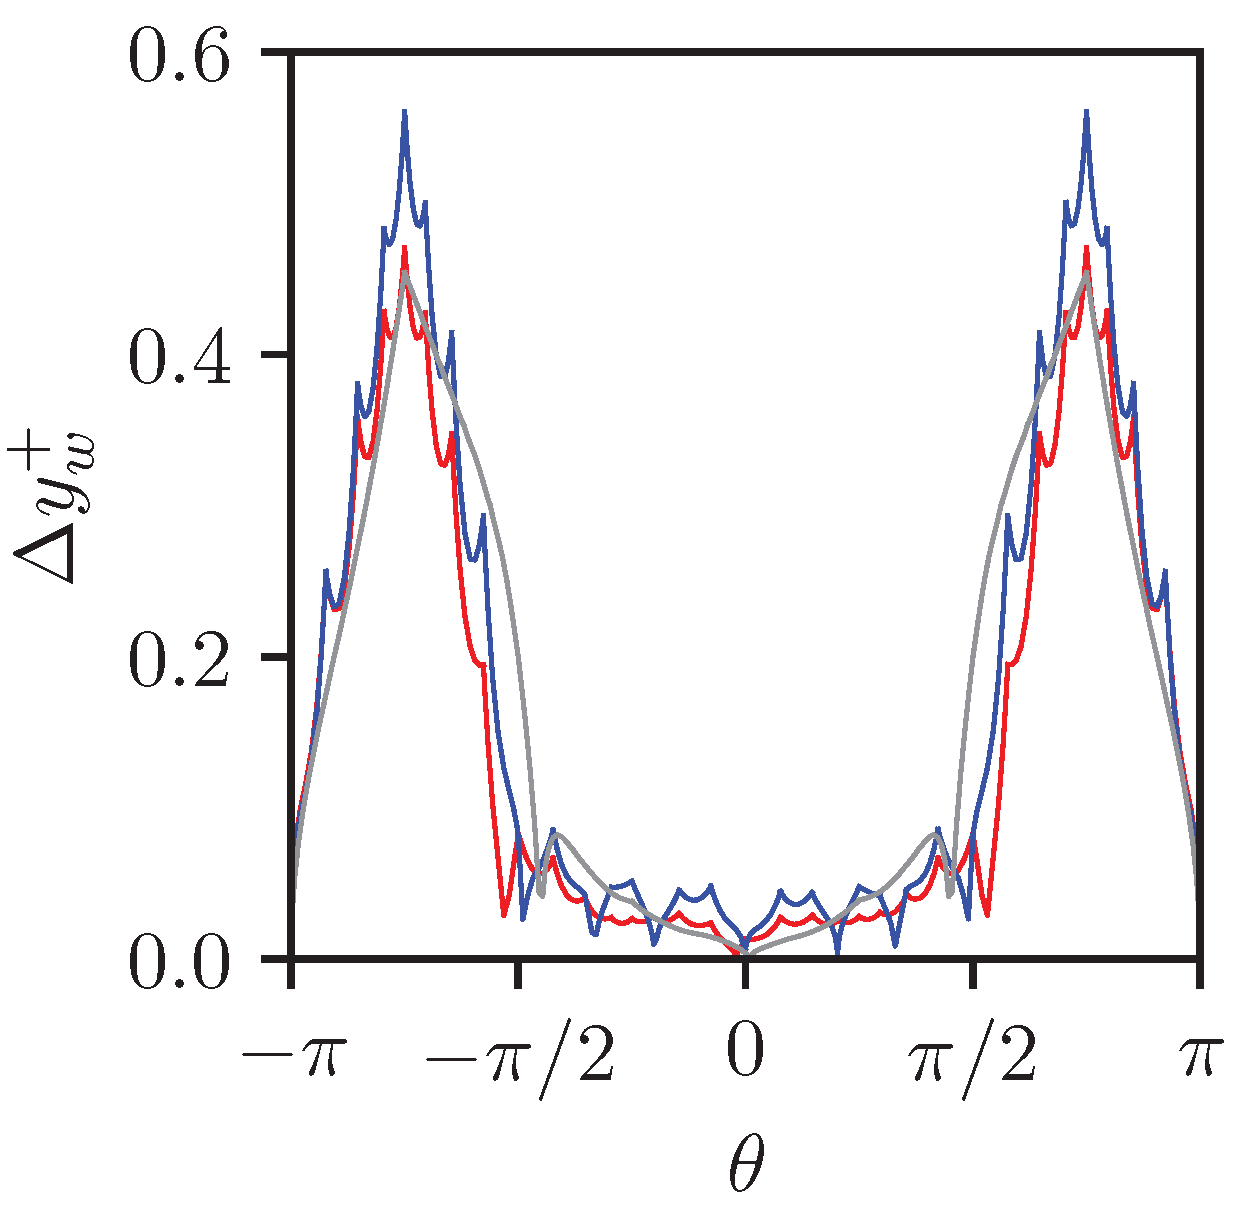
with overbars denoting time- and spanwise-averaged quantities. We plot in Figure 2 visualisations of the quantity Δ / η for the β = 0.3 , 0.5 , and 0.7 with slip walls. We find Δ / η < 11 across the domain, with the largest values concentrated in the wake. While for the remainder of the domain sees values of predominantly Δ / η < 5 , such values align with the convergence criterion recommended by Zahtila et al. [29] for second-order statistics. To ensure the boundary layer along the cylinder is also adequately resolved, the wall-normal distance of the first grid point Δ y w is computed in viscous units, l + = ν / u τ . Here, u τ = τ w / ρ is the friction velocity defined using the wall shear stress τ w along the cylinder surface and the fluid density ρ . Note that computations of Δ y + along both cylinder surface and channel walls, when no-slip conditions are applied, are provided in Ooi et al. [17]. Adequate resolution is observed, provided Δ y w + < 1 , which is shown presently in Figure 3. Hence, we are confident in the numerical model used here.

2.2. Spectral Proper Orthogonal Decomposition

Spectral proper orthogonal decomposition (SPOD) is a dimension reducing technique, first introduced by Lumley [45,46], commonly used for the identification of coherent structures within the flow. This is achieved by obtaining a set of orthogonal modes for each frequency, which are ranked based on their energy contribution. The theory of SPOD is detailed in the work of Towne et al. [47], Schmidt and Colonius [48], which we refer the reader to for additional details, but we will outline the numerical procedure used within this manuscript.
Let q k = [ u ( x , t k ) , v ( x , t k ) , w ( x , t k ) , p ( x , t k ) ] be a vector that contains data of a single snapshot of the flow field at a predefined set of N p measurement points x . We then assemble a 4 N p × N t snapshot matrix Q
Q = q 1 q 2 q N t ,
where N t are the number of temporal snapshots taken. Q is then partitioned into N b N t smaller matrices of N b t snapshots, with size 4 N p × N b t . These submatrices are then transformed into the frequency domain by taking the discrete Fourier transform. It is typical to consider each of these blocks as statistically independent from one another through assumption of the ergodic hypothesis. Thus, we construct a 4 N p × N b t matrix of the Fourier coefficients of each block
Q ^ ( ) = q ^ 1 ( ) q ^ 2 ( ) q ^ N b t ( ) ,
where = 1 , , N b . It is of note that each column represents the spatial distribution of the quantities of interest for a specific frequency. These matrices are then reshaped to form matrices Q ^ f i of size 4 N p × N b whose columns are an ensemble of N b Fourier coefficients for a specific frequency f i ,
Q ^ f i = q ^ f i ( 1 ) q ^ f i ( 2 ) q ^ f i ( N b ) .
Proper orthogonal decomposition (POD) may then be applied on Q ^ f i to obtain modes Φ j ( f i ) ranked in order of energy contribution λ j for a given frequency f i .

3. Flow Structures

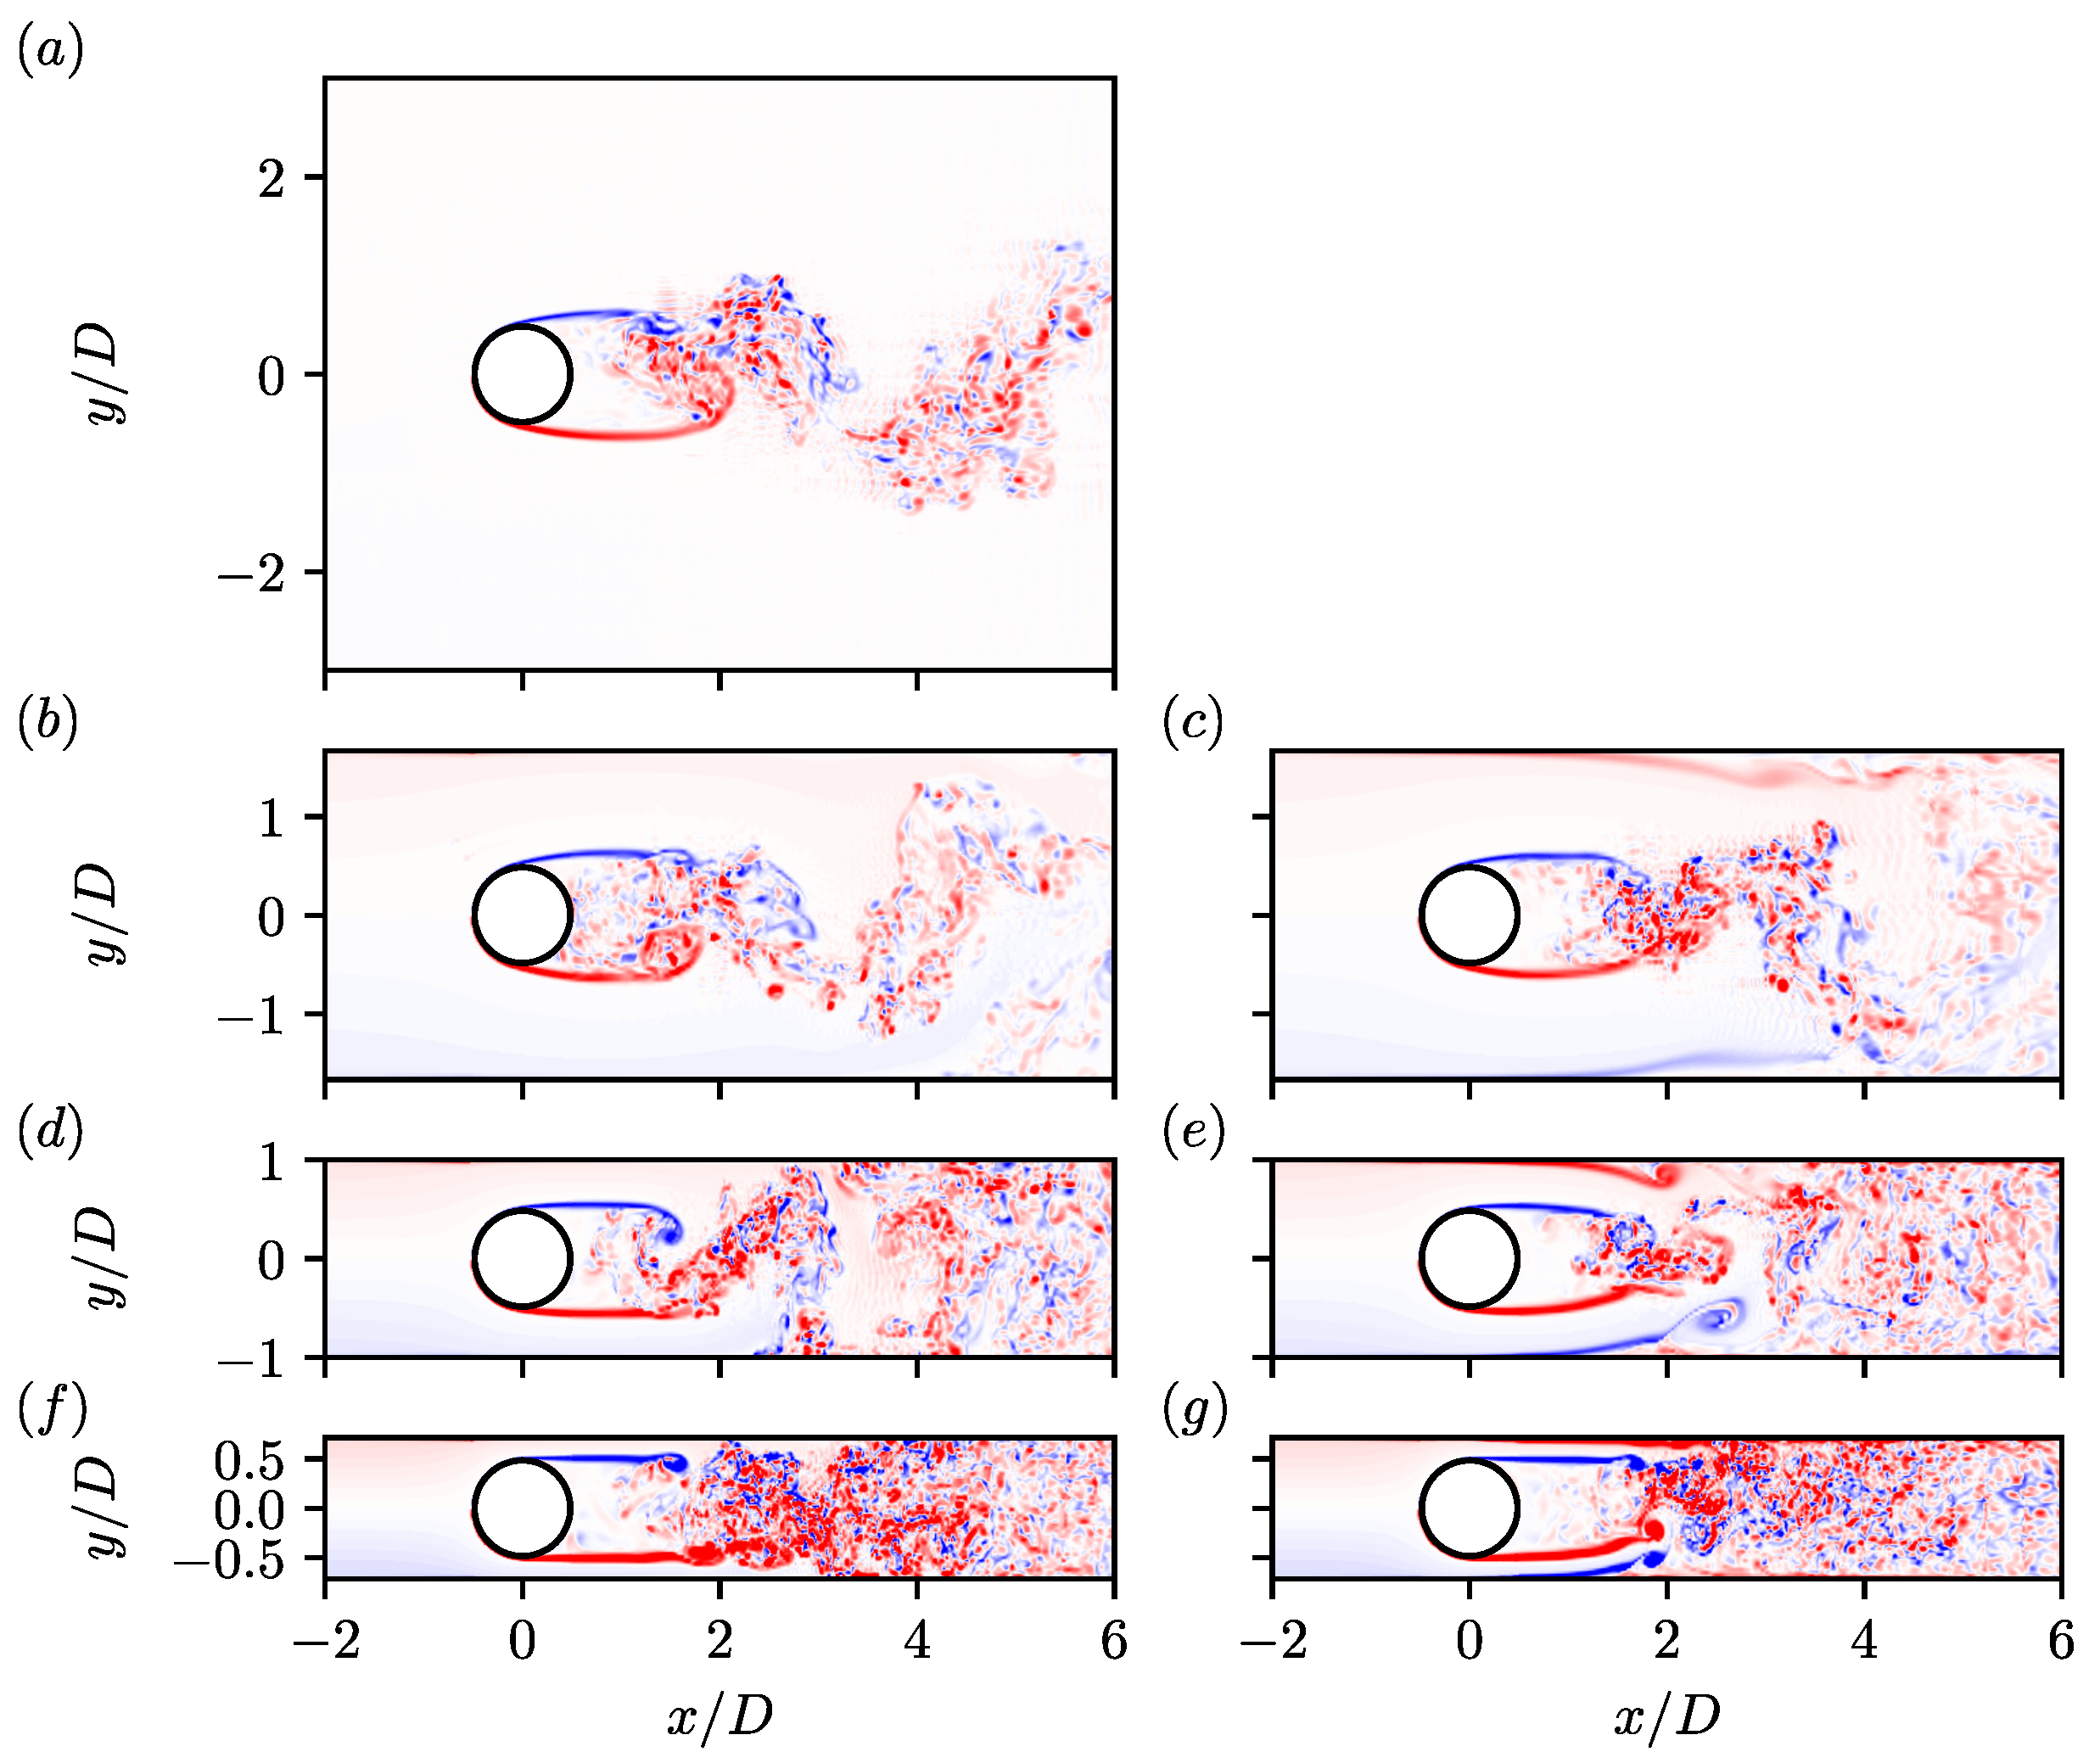
We begin by looking at the effects of eliminating the wall shear layer on the instantaneous flow, along with the unconfined case in the left column of Figure 4; also plotted in the right column for reference are instantaneous realisations of the flow with no-slip walls. For reference, the unconfined case β = 0.0 contours of the instantaneous spanwise ω z D / U are visualised in (a). As has been found in prior studies [1], Kármán vortices are shed from the cylinder, resulting in a spatially (and temporally) periodic pattern of large-scale vortices. As the Reynolds number is within the subcritical regime, these Kármán vortices consist of finer scale turbulent structures formed by instabilities in the shear layers emanating off the cylinder, herein referred to as cylinder shear layers (CSLs).
Adding a slight amount of blockage, β = 0.3 , Figure 4b,c shows there is little effect in the near-wake, x / D < 2 , for both slip and no-slip walls. The CSLs roll up to form Kármán vortices, which are then convected downstream. However, for x / D > 2 , differences are more noticeable. With slip walls, the wake just spreads out. Wake vortices therefore encompass the entire crossflow domain, with some vortices ‘hitting’ the slip wall for x / D > 4 . Meanwhile, with no-slip walls, a boundary layer forms along the channel walls, referred to herein as wall shear layers (WSLs). Observation of the WSLs shows that separation occurs at x / D 1.8 , forming coherent vortices that interact with Kármán vortices. At this blockage, shear is significantly weaker in the WSLs compared to the CSLs. As such, we hypothesise that the dynamics in the WSL are driven by shedding in the wake.
At β = 0.5 , the CSLs are still able to roll up to form Kármán vortices. However, confinement provided by walls compresses the wake in Figure 4d,e, resulting in wake vortices hitting the slip walls further upstream at x / D 2 . Finally, for β = 0.7 we observe a lack of vortex shedding with both slip and no-slip walls, implying the WSLs are not responsible for the suppression of vortex shedding. Strong vortices are also observed in the shear layer for both cases, caused by a breakdown of the shear layer via a Kelvin–Helmholtz-type instability.

4. Flow Statistics

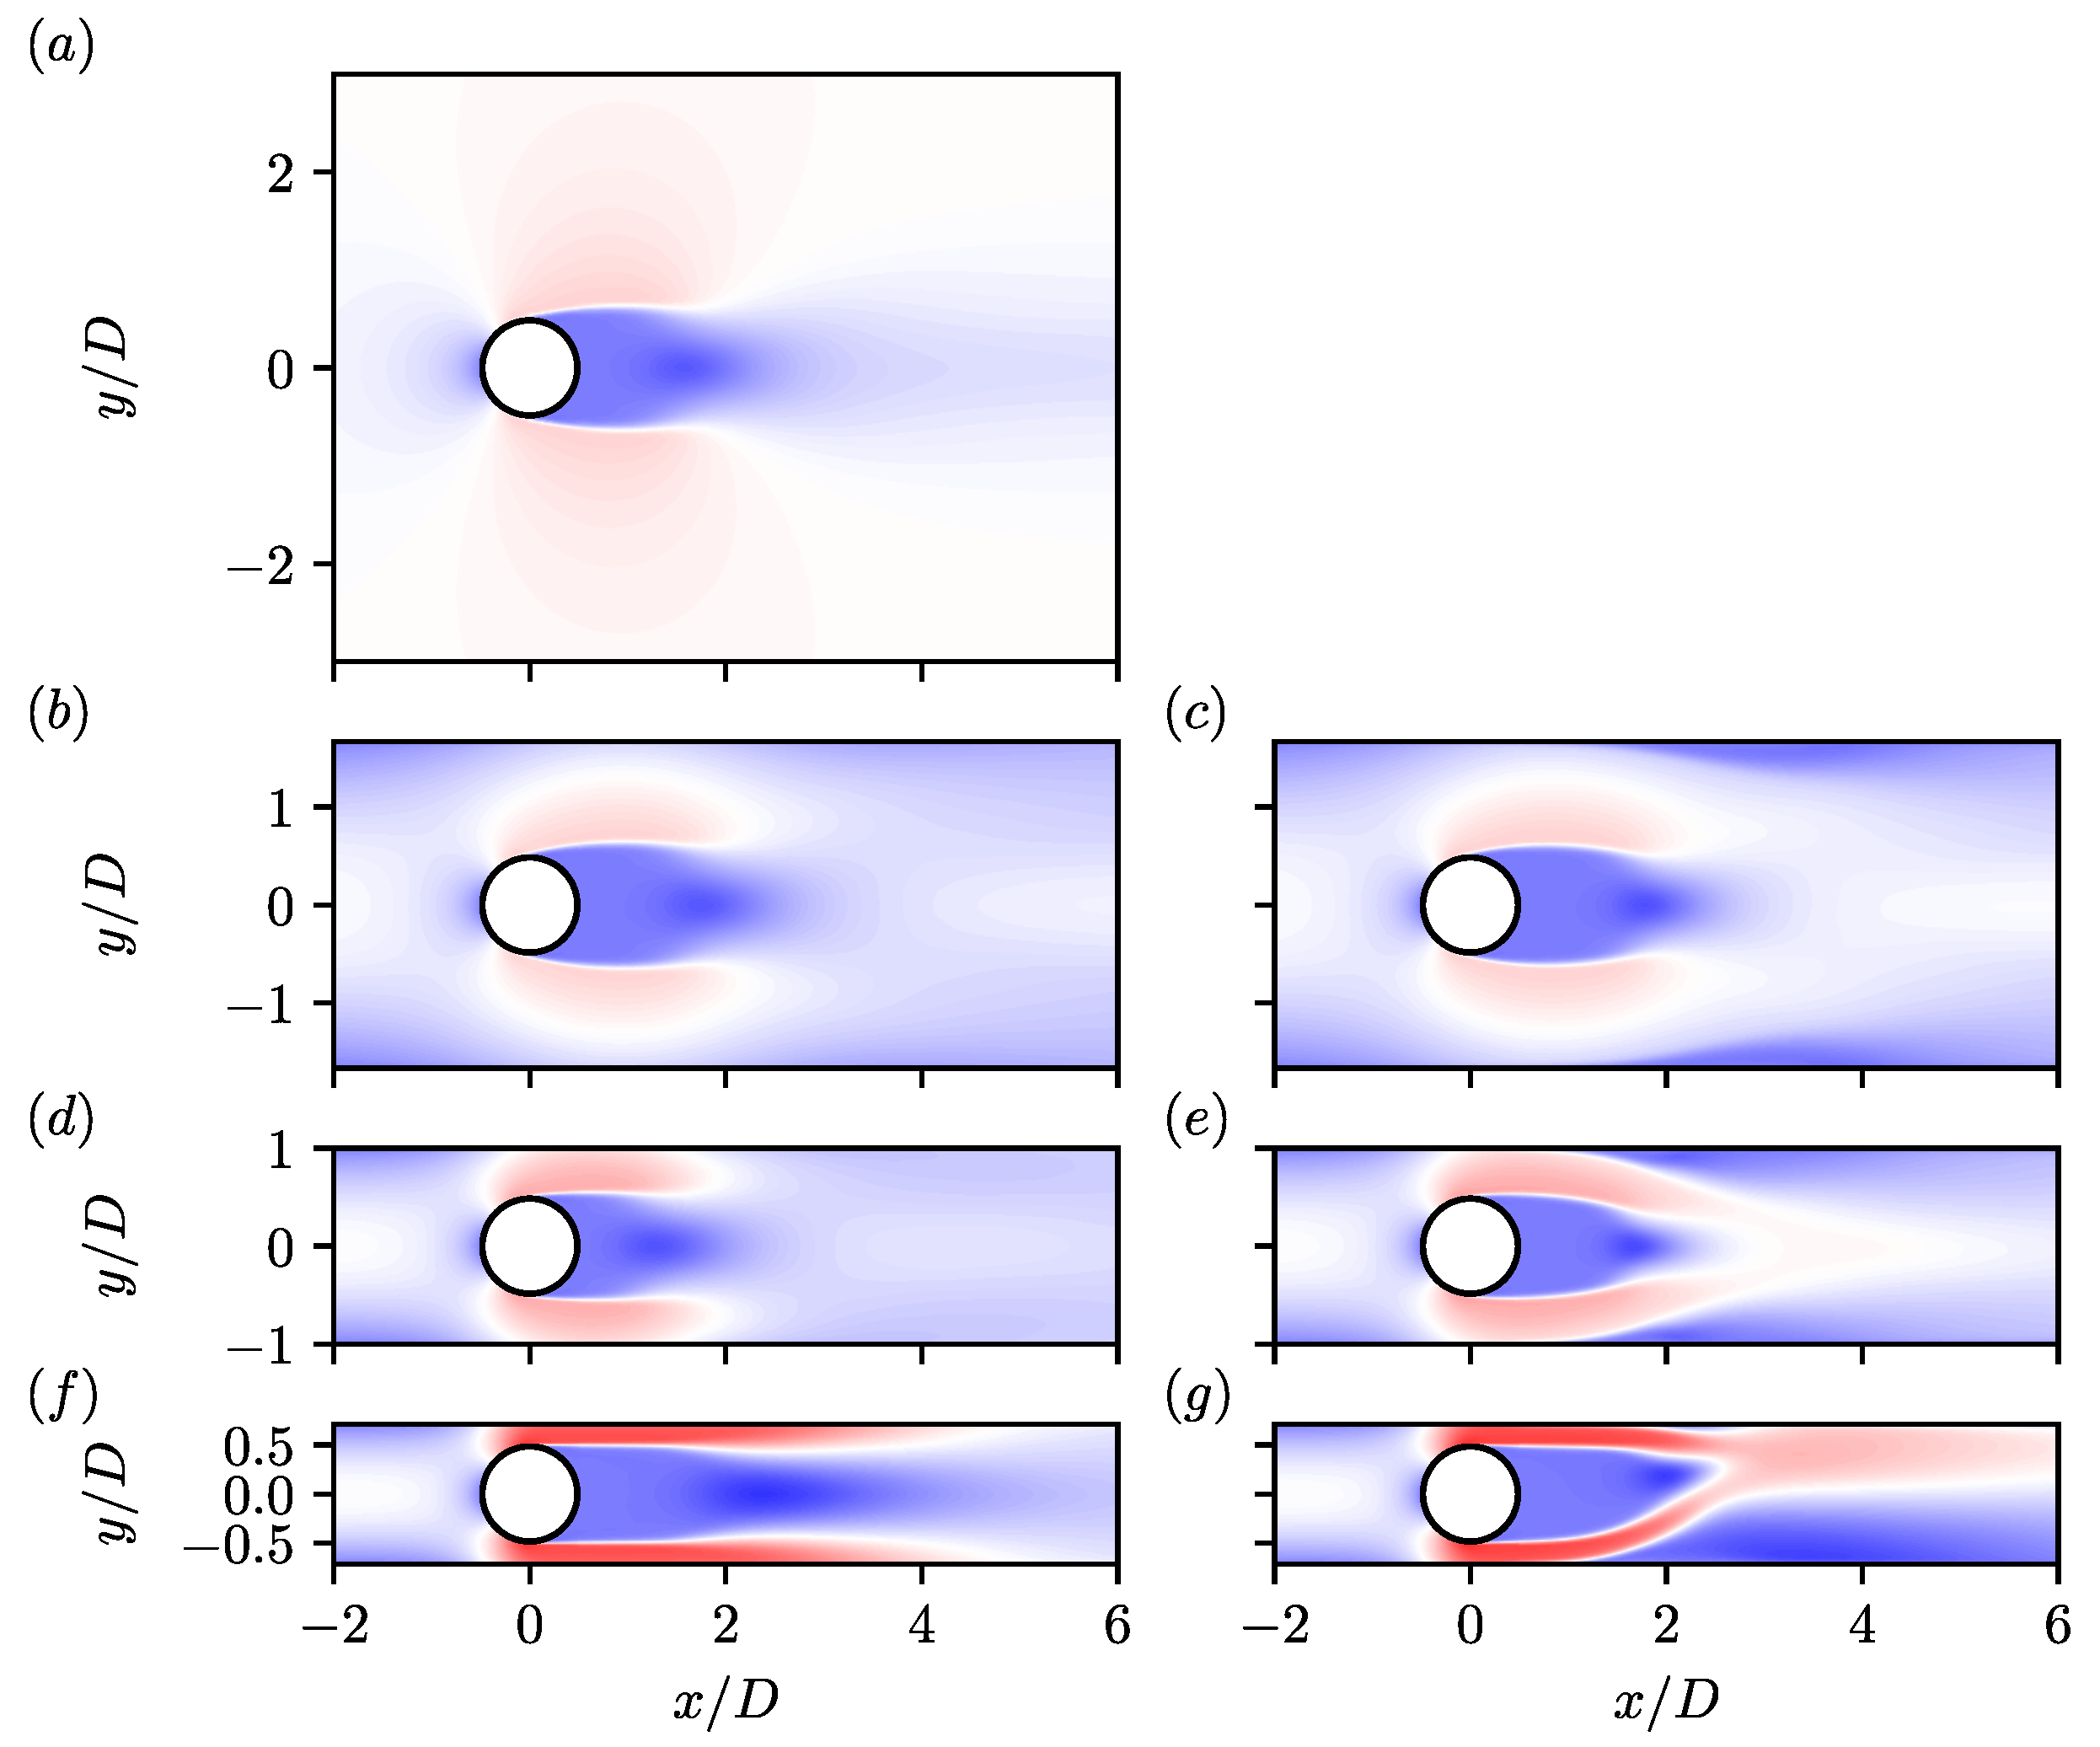
Moving onto first- and second-order flow statistics in Figure 5 and Figure 6, respectively, we find that the general topology of the mean flow remains relatively unchanged for β = 0.3 . The lack of a WSL with slip walls results in no separation along the crossflow boundaries downstream of the cylinder, which may also be observed for other blockages. Therefore, no recirculation bubble is observed in the near-wall region. As a result, there is less curvature in the CSLs with slip walls as the fluid is no longer being deflected towards the wake centreline. Due to the similarities of the wake, we compare the profiles of u ¯ / U with slip and no-slip walls for β = 0.3 with the unconfined case in Figure 7. It is of note that the use of a parabolic inlet at β = 0.3 implies that U b = 2 U / 3 , giving a bulk Reynolds number of R e b = 2600 . Therefore, to also keep a consistent R e b , an additional simulation has been conducted for β = 0.0 at R e b = R e = 2600 with a uniform upstream profile. We find in Figure 7a that the unconfined case has a shortened wake length for R e = 3900 compared with R e = 2600 , consistent with data from the open literature [15]. The data at R e = 2600 seem to match better with the minimum, occurring at approximately the same location as the β = 0.3 data for both sets of boundary conditions. This is also reflected in profiles in a constant streamwise position. In the near-wake, x / D = 1.06 and 1.54 , the velocity deficit for β = 0.3 is extremely similar between both cases. Compared with β = 0.0 , the data shows generally good agreement, although the R e = 2600 case matches better. At x / D = 1.06 , the profile is much flatter, matching the β = 0.3 data, and similarly at x / D = 1.54 . Further downstream at x / D = 2.02 , the velocity deficit for R e = 3900 is over-predicted by the β = 0.3 data, whereas for R e = 2600 , it matches quite well due to the wake being longer. Comparing slip and no-slip walls, we find the wake being more compressed in the crossflow direction with no-slip walls. It is arguable the slip wall data agree better here than with no-slip walls, which is likely caused by the separation of the WSLs at this location pushing fluid towards the centreline. Finally, at the furthest streamwise location considered, x / D = 4.04 , a velocity deficit is observed for β = 0.0 , while for β = 0.3 , the flow has begun to recover. No-slip walls show some backflow occurring near the walls, indicating the separated WSL has not reattached. Hence, there is faster-moving fluid near the centreline. Meanwhile, with slip walls, the profile is flatter in the absence of this effect, along with there being no boundary layer along the walls.
At higher blockages, at β = 0.5 , a similar effect occurs, shown in Figure 5d,e. With slip walls, the absence of WSLs prevents separation from occurring, leading to the jet-like flow through the gap adhering to the walls. Whereas, with no-slip walls, the WSLs separate, directing fluid towards the centreline. In both cases, the wake length is observed to be shorter at β = 0.5 compared with β = 0.3 . A possible interpretation may be made by looking at the flow in an unconfined cylinder. Generally, with increases in R e , provided it is sufficiently large, the wake length has been found to decrease [15,49,50,51]. Now, as β increases, so will the velocity scale within the gap, say U g . Hence, if we consider a local Reynolds number in the gap R e g U g D / ν , increasing β will yield increases in R e g , thereby shortening the wake. It is important to note that for an unconfined flow, the infinite extent of the crossflow boundaries implies that U g = U , hence R e g = R e .
Finally, for β = 0.7 , we find in Figure 5f,g that the mean flow is asymmetric with no-slip walls, as has been previously shown in the literature [17,22], but it is symmetric in the case of slip walls. Lu et al. [23] hypothesised that if the CSLs could be broken down sufficiently early, then the mechanism behind wake asymmetries would not enact on the flow, resulting in a recovery symmetry. A similar effect is likely occurring here, as the removal of the WSLs prevents wall–wake interactions. Therefore, the mechanism behind wake asymmetry is at least partially related to the interaction between the WSLs and CSLs.
Figure 5. Visualisations of the mean streamwise velocity u ¯ / U for (a) β = 0.0 , (b,c) β = 0.3 , (d,e) β = 0.5 , and (f,g) β = 0.7 . Simulations with no-slip channel walls are depicted in (c,e,g), and simulations with slip walls in (b,d,f). Contours range from blue to red between 1 u ¯ / U 3 .
Fluids 10 00084 g005
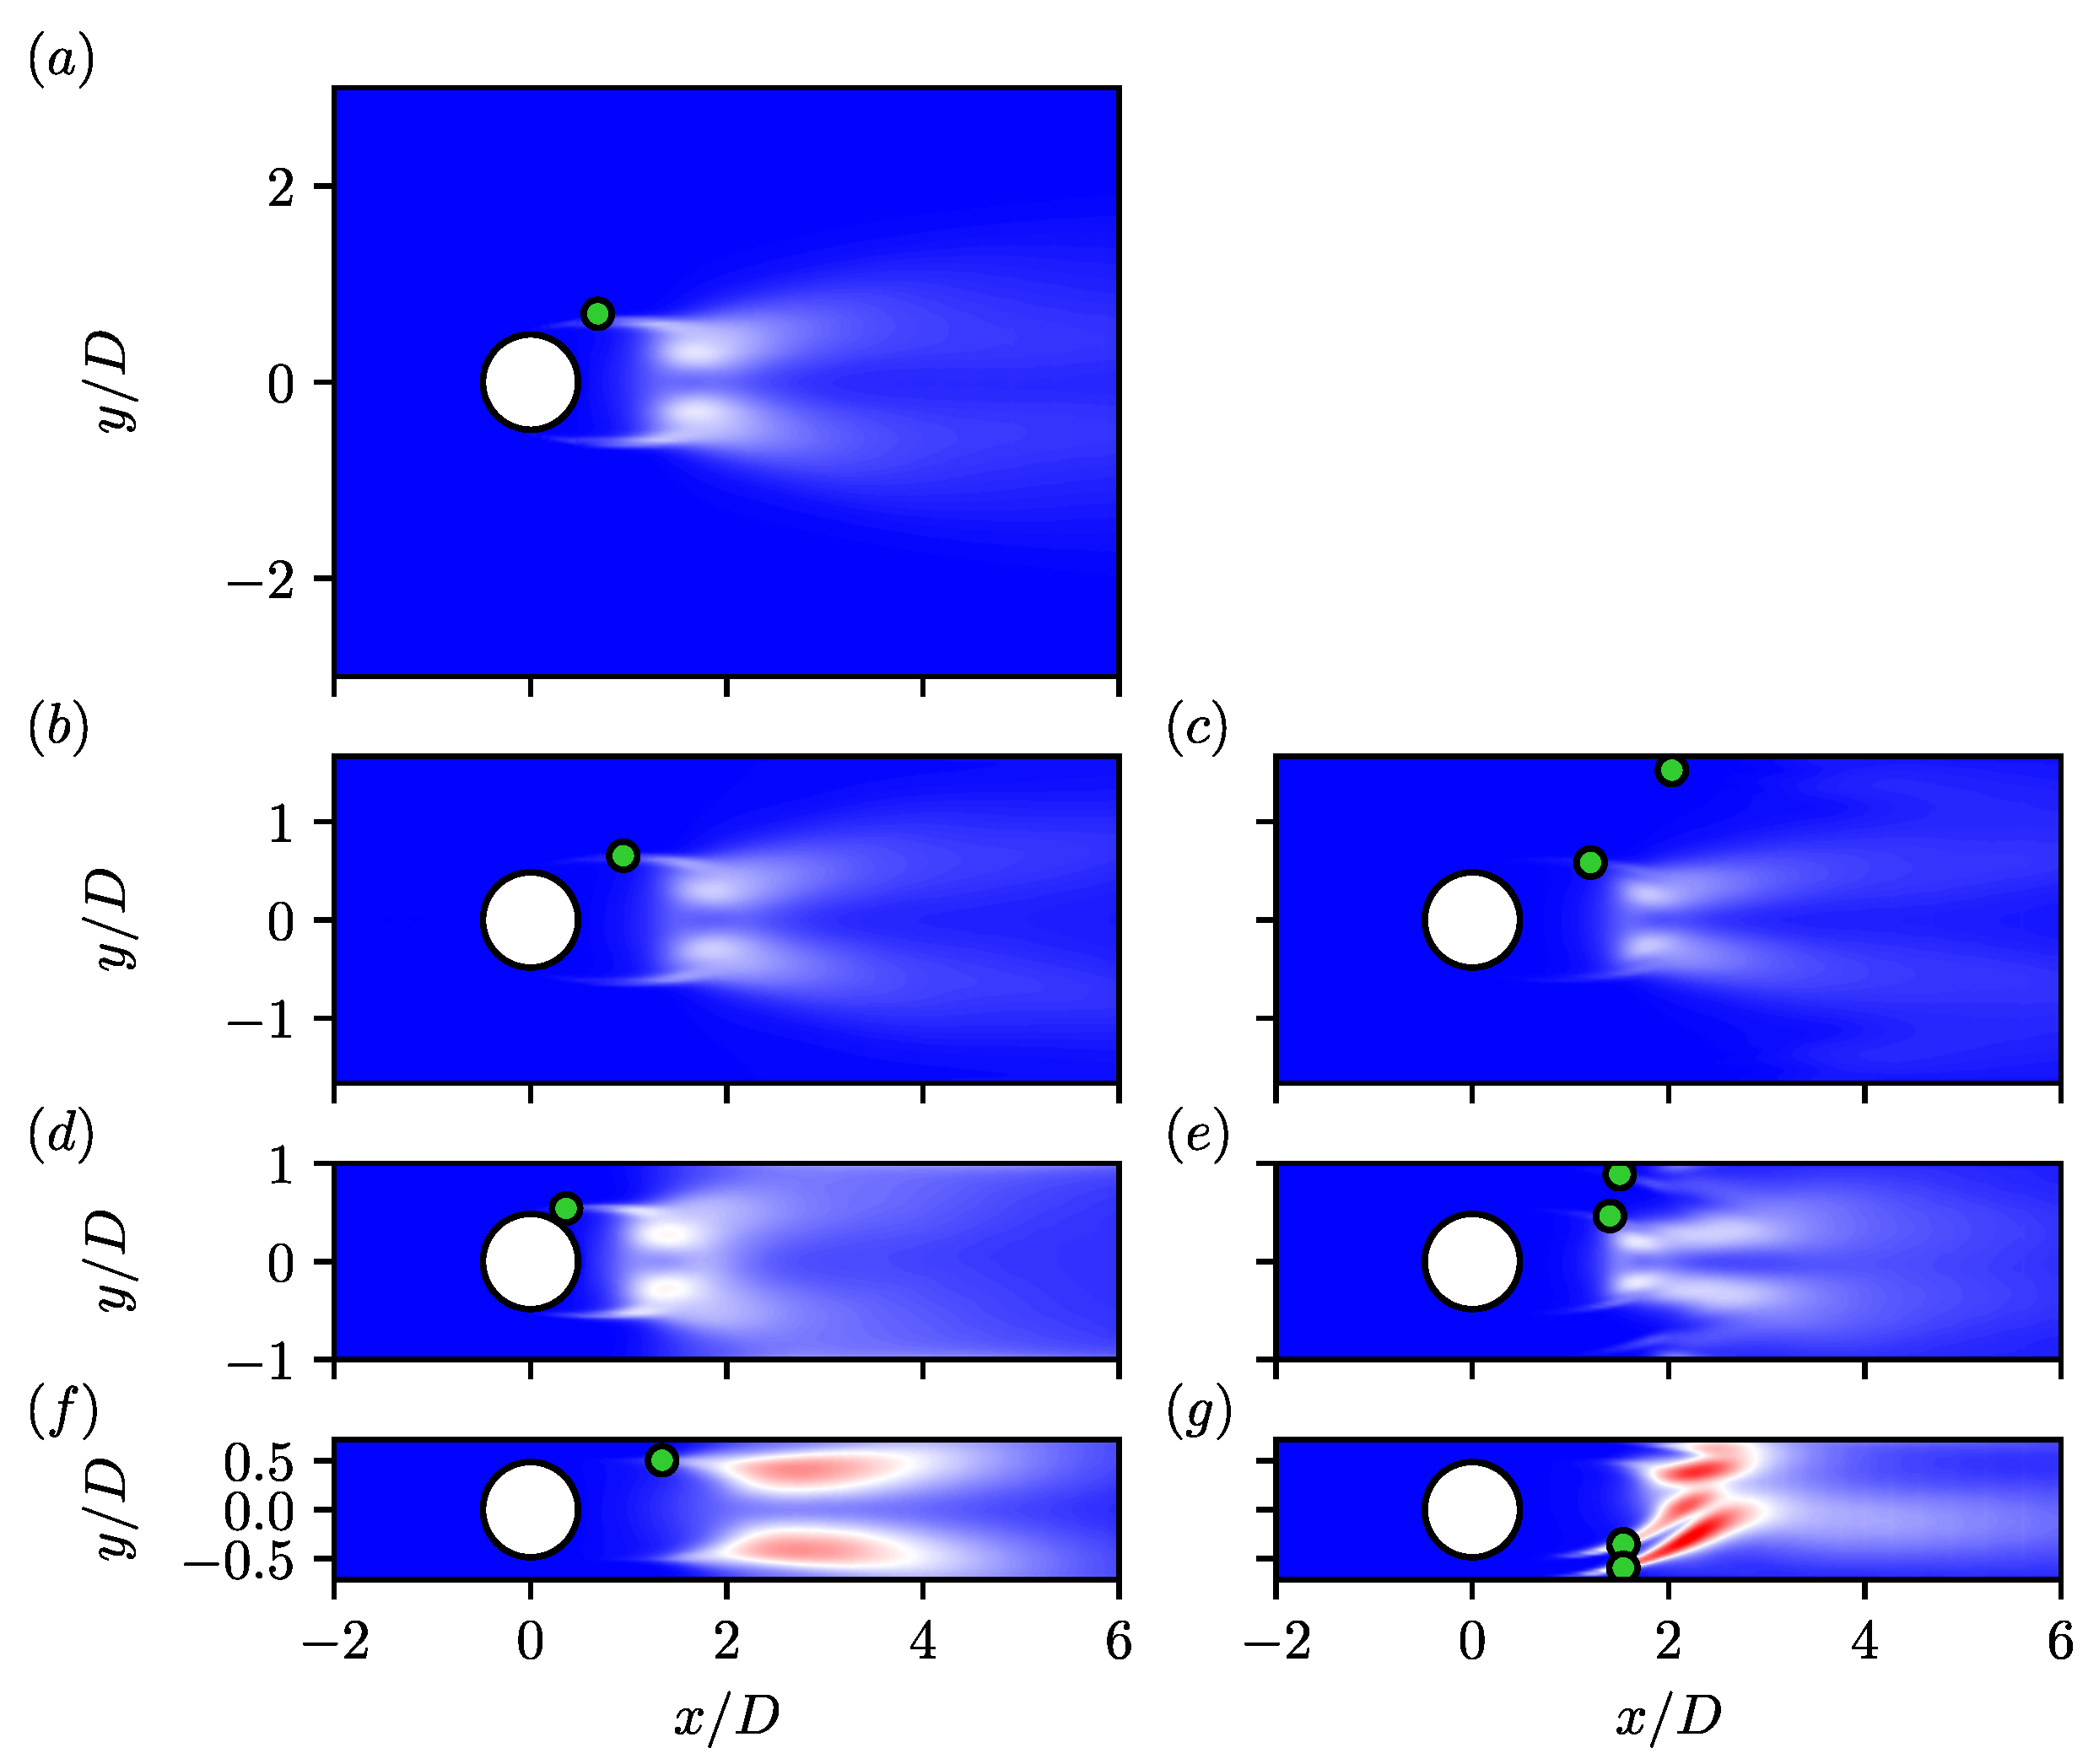
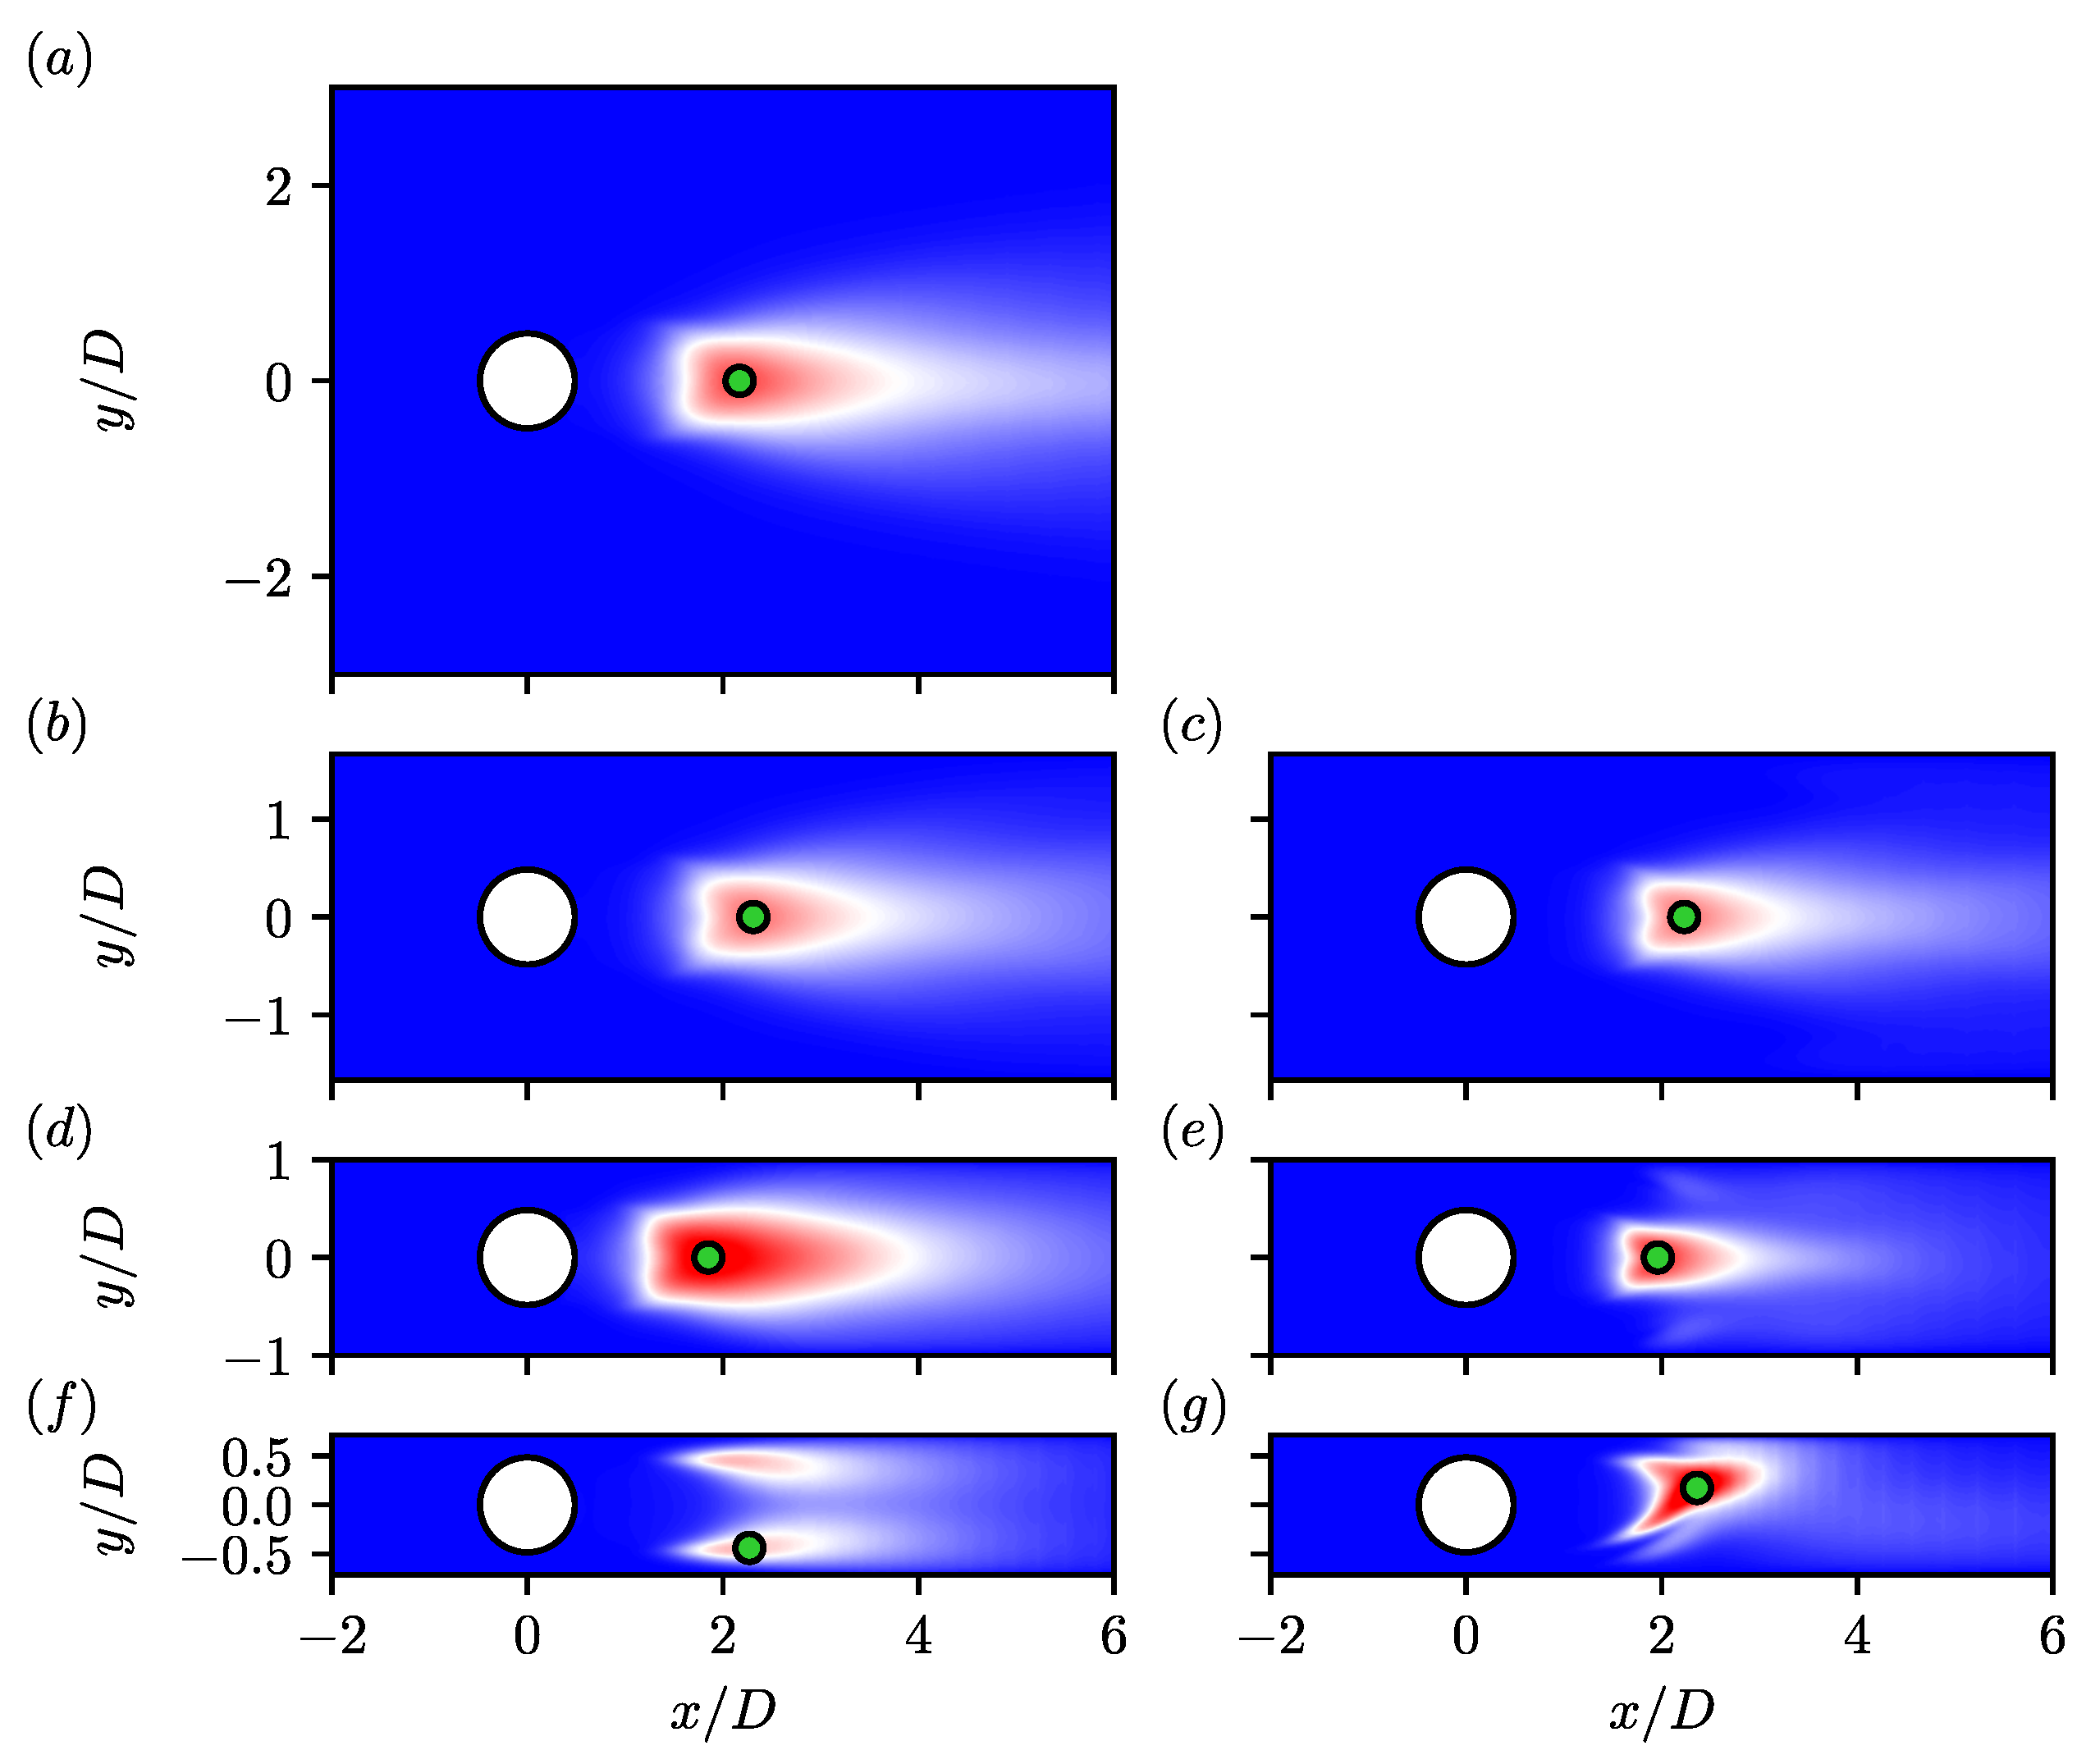
Figure 6. Visualisations of the Reynolds shear stress u u ¯ / U 2 for (a) β = 0.0 , (b,c) β = 0.3 , (d,e) β = 0.5 , and (f,g) β = 0.7 . Simulations with no-slip channel walls are depicted in (c,e,g), and simulations with slip walls in (b,d,f). Contours range from blue to red between 0 u u ¯ / U 2 0.5 . Green dots demarcate the location where streamwise velocity spectra are computed in Figure 8.
Fluids 10 00084 g006
Figure 7. Comparison of mean flow profiles for the unconfined case at R e = 3900 (Fluids 10 00084 i004) and R e = 2600 (Fluids 10 00084 i005, along with β = 0.3 at R e = 3900 with slip (Fluids 10 00084 i006) and no-slip (Fluids 10 00084 i007) boundary conditions. Profiles are taken along (a) the centreline y / D = 0 along with (b) x / D = 1.06 , (c) x / D = 1.54 , (d) x / D = 2.02 , and (e) x / D = 4.04 .
Fluids 10 00084 g007
Figure 8. Energy spectra of streamwise velocity within cylinder (Fluids 10 00084 i008) and wall (Fluids 10 00084 i009) shear layers for slip (left column) and no-slip (right column) walls for (a) β = 0.0 , (b,c) β = 0.3 , (d,e) β = 0.5 , and (f,g) β = 0.7 . Locations where spectra are computed are denoted by the green dots in Figure 6. Vertical lines denote shedding frequency (Fluids 10 00084 i010), second harmonic (Fluids 10 00084 i011), and shear layer frequency (Fluids 10 00084 i012).
Fluids 10 00084 g008
Moving onto the Reynolds stresses, we consider streamwise normal u u ¯ / U 2 and crossflow v v ¯ / U 2 stresses in Figure 6 and Figure 9, respectively. Again, for reference, the unconfined case has been plotted in ( a ) , and u u ¯ / U 2 shows the typical “butterfly” shape [6,14,17], while v v ¯ / U 2 shows strong crossflow fluctuations along the centreline due to the shedding of Kármán vortices. Fluctuations are observed to be strongest in the wake where Kármán vortices form, and where the CSLs break down via Kelvin–Helmholtz instabilities.
At the lowest blockage β = 0.3 , we find the general structure remains similar between both sets of boundary conditions, with the classical butterfly shape observed in u u ¯ / U 2 . Likewise, v v ¯ / U 2 shows a virtually identical distribution downstream of the cylinder. However, we find in Figure 6b,c that the CSLs are more energetic with slip walls compared with no-slip walls. This suggests that interactions between the CSLs and WSLs have a tendency to suppress instabilities forming in the CSLs. Fluctuations from the separated WSLs are near indistinguishable in Figure 6c, which is expected given the generally weaker vortical structures observed in Figure 4c, due to the weak coupling with the CSLs at this blockage. At a higher blockage of β = 0.5 , we find in Figure 6d,e that the topology of u u ¯ / U 2 changes quite drastically between the two cases. The lack of a separating WSL with slip walls implies there are no fluctuations near the wall. Whereas, with no-slip walls, the breakdown of the WSLs post separation again results in non-zero u u ¯ / U 2 observed near the wall. Unlike with β = 0.3 , the intensity of u u ¯ / U 2 in the WSLs is of a similar magnitude to the CSLs due to a strong coupling at this blockage. Now, comparing the general structure of u u ¯ / U 2 , we find strong similarities between the two, with the no-slip case being a compressed version of the slip case, likely due to the gap flow being redirected towards the centreline. The fluctuations in the CSLs are also more muted, again likely due to the WSLs suppressing the formation of instabilities. However, for v v ¯ / U 2 , Figure 9d,e shows that fluctuations are more intense downstream with slip walls compared with no-slip walls. This reflects observations of larger Kármán vortices observed in the instantaneous field (Figure 4d,e). It is possible the the strong interactions between the CSLs and the wake partially inhibits Kármán vortex formation. Finally, at β = 0.7 , Figure 6f,g shows that u u ¯ / U 2 changes significantly from the “butterfly” profile at lower blockages due to changes in flow topology. Without Kármán shedding, the main source of Reynolds stress is from the breakdown of the CSLs with slip walls, and both the CSLs and WSLs for no-slip walls. For the crossflow fluctuations, Figure 9f,g shows the regions of the strongest fluctuations within the CSLs for slip walls and above the centreline downstream with no-slip walls. As the CSLs break down and do not merge with slip walls, fluctuations are largest in this region. Meanwhile, with no-slip walls, the CSLs merge off centre from the flow asymmetry, resulting in a large blob of v v ¯ / U 2 .

5. Spectral Analysis of the near Wake

5.1. Fourier Analysis

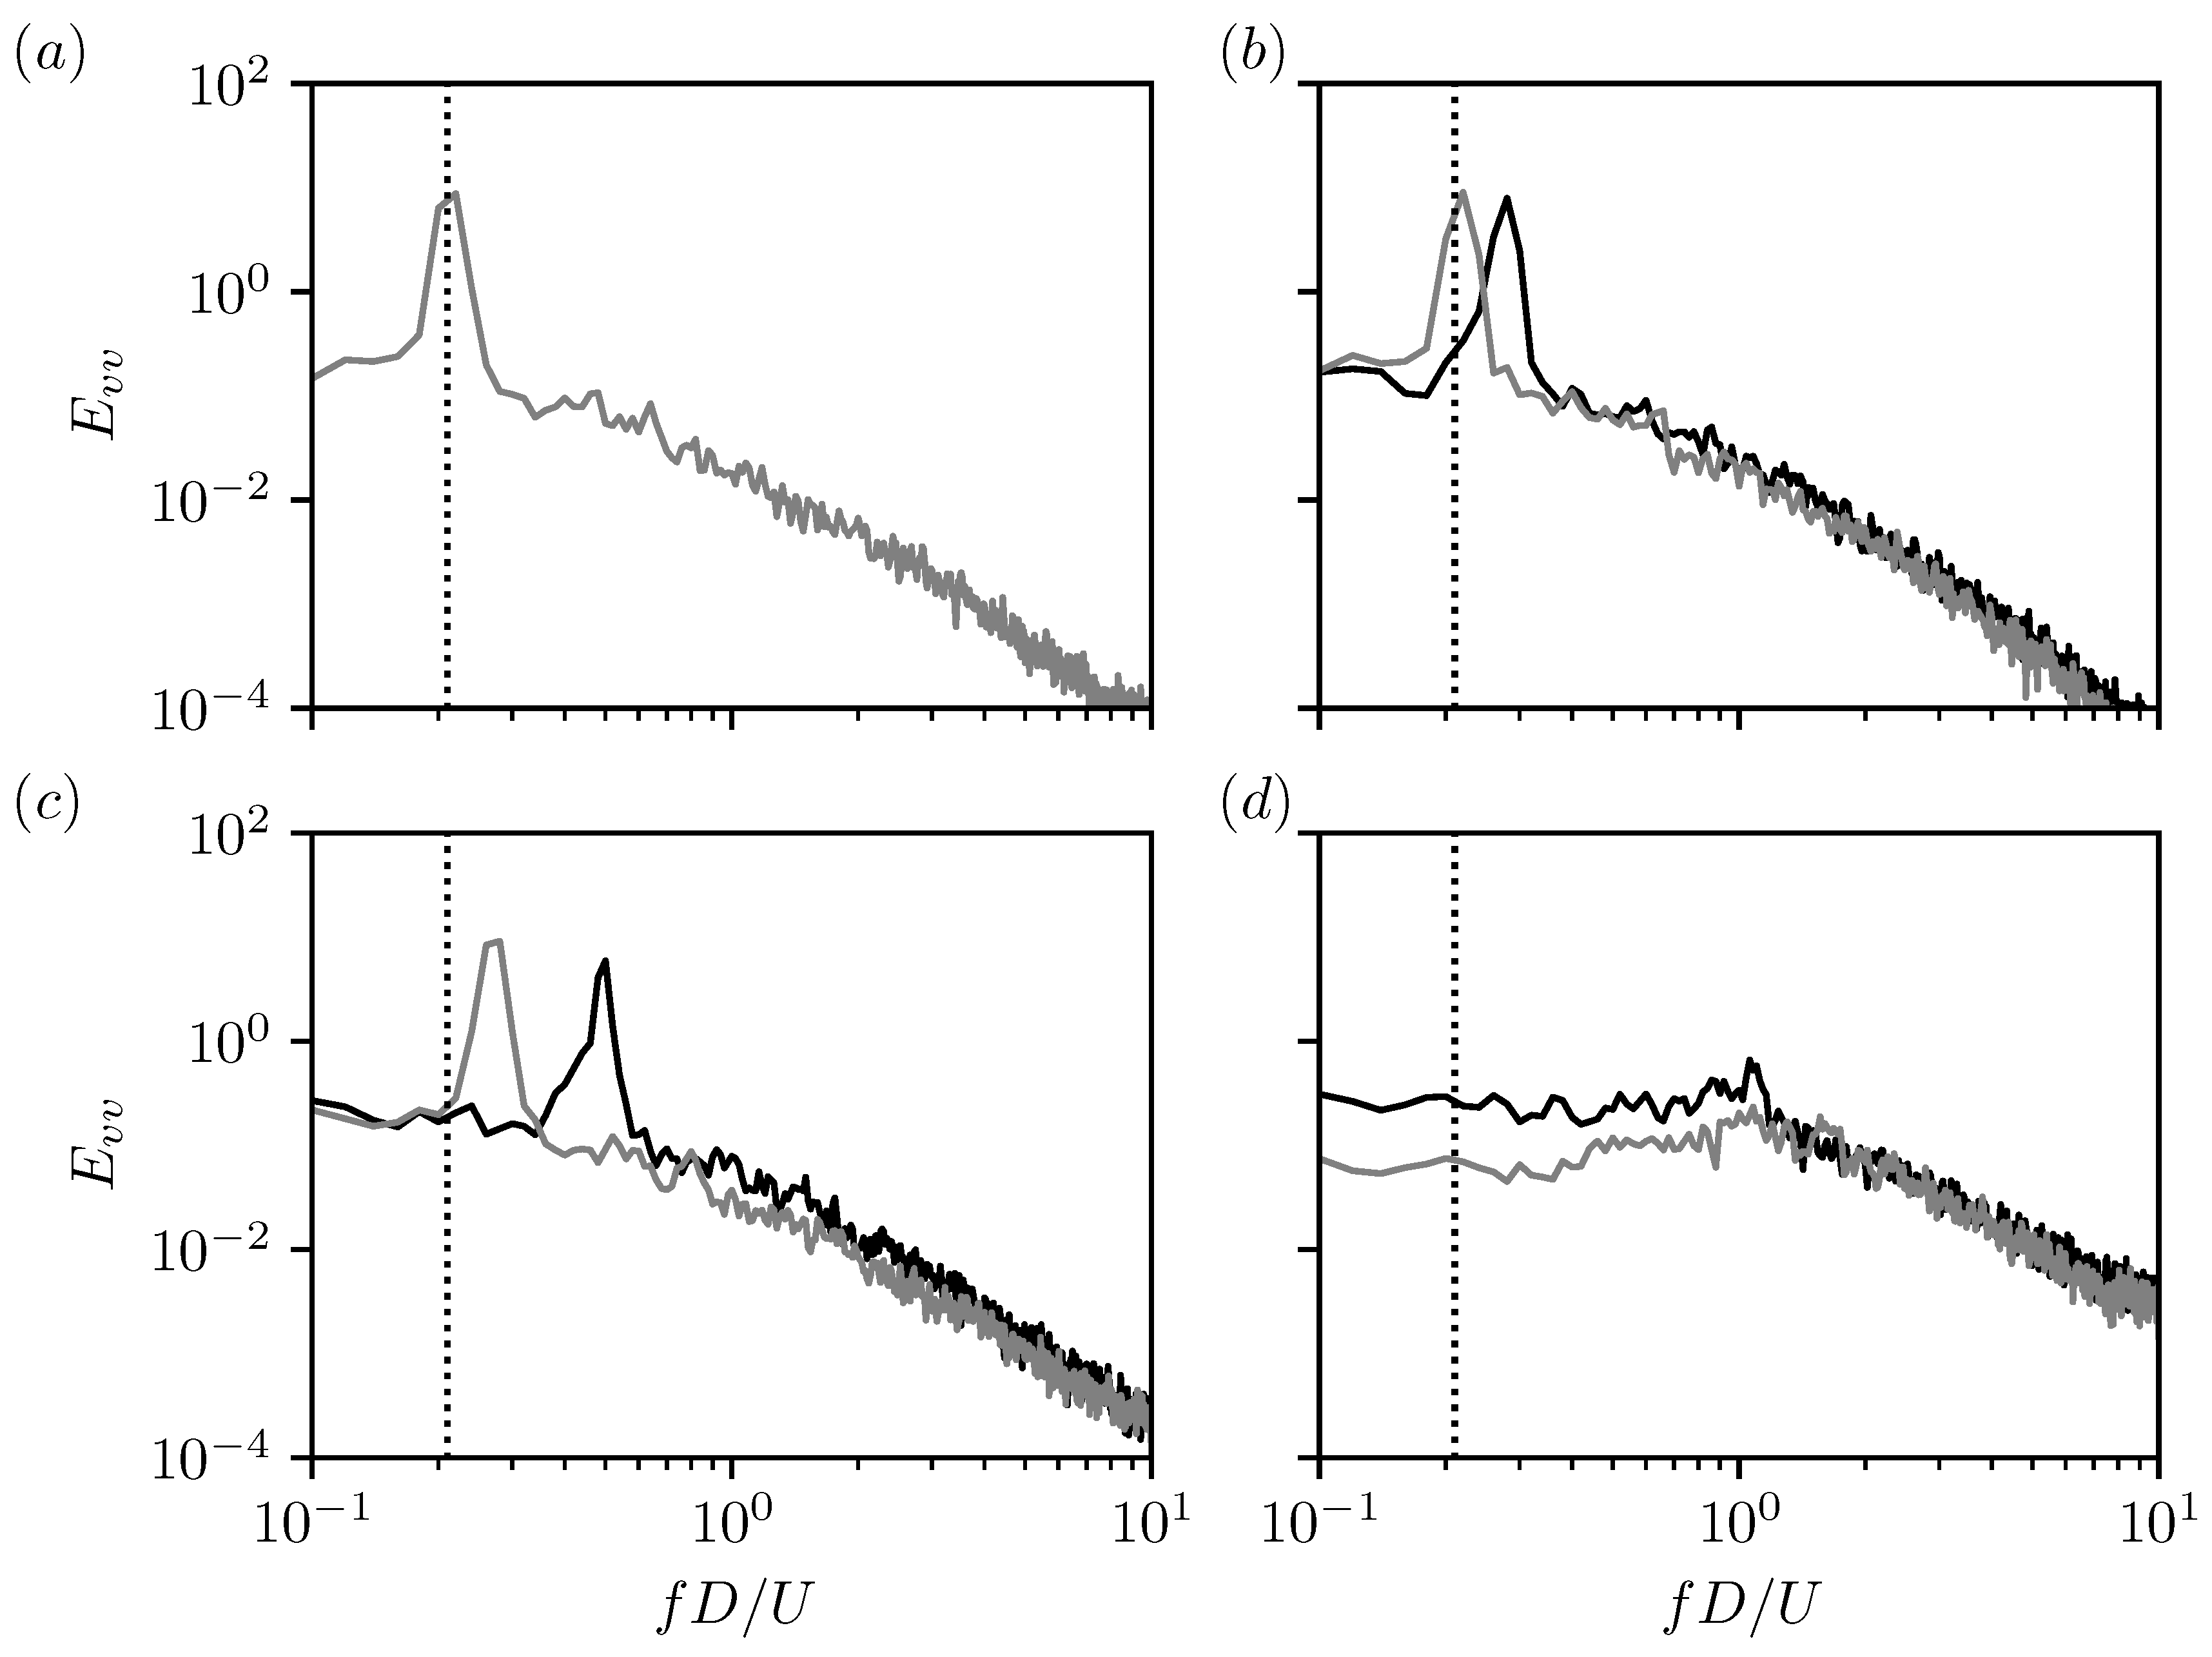
Fourier analysis of large scale wake structures is typically conducted by placing probes near points of maximised crossflow velocity fluctuations [17]. We have therefore plotted in Figure 10 energy spectra of the crossflow velocity signal at locations demarcated by dots in Figure 9 for both slip (grey line) and no-slip (black line) boundary conditions. Clear peaks are evident in Figure 10a–c for blockages of β = 0.0 , 0.3 , and 0.5 , respectively, corresponding to the shedding frequency S t K = f K D / U . While for β = 0.7 , a significantly damped peak occurs at around f D / U = 1.1 for both sets of boundary conditions. For the case with no-slip walls, given the lack of coherent shedding observed in the instantaneous field, Ooi et al. [17] concluded that Kármán shedding was not responsible for this peak. Rather, as the frequency was approximately half the shear layer frequency, they hypothesised that the peak was a subharmonic peak caused by the merging of Kelvin–Helmholtz vortices. Also superposed is a dotted line denoting the shedding frequency for the unconfined case S t K = 0.21 , which matches well with the prior literature [6,17,52]. In general, with increasing blockage, there is a shift in S t K to higher frequencies for both sets of boundary conditions, which is given in Table 2. With slip boundaries, these changes are somewhat small, increasing S t K by around 30 % as blockage is increased to β = 0.5 . Confinement effects due to the placement of crossflow boundaries have been previously shown to increase shedding frequency [53,54,55,56,57,58]. It would be remiss not to mention the change in bulk Reynolds number for cases with crossflow boundaries due to the parabolic upstream profile. Hence, scaling by bulk velocity, the bulk Reynolds number is R e b = U b D / ν = 2600 . In the unconfined case, this should not significantly affect the Strouhal number within the subcritical regime [59]. An additional simulation of the unconfined case with uniform boundary conditions at R e = R e b = 2600 finds a Strouhal number of S t K = 0.21 .
Meanwhile, with the introduction of no-slip walls, shedding frequencies are observed to increase more quickly, with a 250 % difference found between the unconfined and β = 0.5 cases. Thus, increases in Strouhal number with blockage observed in the open literature [17,20,60] can be decomposed into a component caused by wake confinement due to crossflow boundaries, as well as interactions with WSLs. We will refer to the first effect as wake confinement and the second as wall–wake interaction.
At β = 0.3 , we observe changes in S t K due to slip walls that are quite small, approximately 5 % compared with the unconfined case, while with no-slip walls, the change is much larger, increasing S t K by over 30 % . Physically, with slip walls, crossflow boundaries do not have much effect on the formation of wake vortices, while for no-slip walls, Figure 4c shows wake vortices interacting with the WSLs slightly downstream at x / D 3 after shedding off the cylinder. As vortex shedding is a primary feature of cylinder flows and may be observed for unconfined flows, we posit that the shedding of wake vortices drives instability in the shear layer through interaction downstream of the wake. Meanwhile, as vorticity within the WSLs is an order of magnitude weaker than the CSLs and wake vortices, only minor effects on the shedding frequency occur the other way. Thus, the coupling between the two is predominantly one-way.
Moving up to a blockage of β = 0.5 , we now find that both wake confinement and wall–wake interaction affect the Strouhal number. In the absence of WSLs, the proximity of crossflow boundaries was shown to have an effect on wake formation, which appears to extend to the shedding frequency as well, with a minor increase from 0.21 to 0.27 . Meanwhile, when the WSL is reintroduced, interaction between the CSLs and WSLs almost doubles S t from 0.27 to 0.5 between the slip and no-slip cases, greater than for β = 0.3 . This effect is a consequence of the highly coupled nature of the WSLs and CSLs, a result of their proximity to one another. Unlike with β = 0.3 , where vortex shedding drove the instability in the WSL, the large change in S t K by removing shear layer interaction implies there is a strong modulating effect being imposed on the CSL by the WSL as well, and hence interaction is two-way in this case.

5.2. Spectral Proper Orthogonal Decomposition

To further investigate the wake behaviours associated with these peak frequencies, we now apply SPOD to the near wake region within the subdomain 2 x / D 10 and y w y / D y w , such that it encompasses the entire recirculation region. To begin with, we plot in Figure 11 the eigenvalue spectra for each of the blockages considered. Clear peaks are identifiable in the first mode at similar frequencies to the Fourier spectra, along with their harmonics, for both sets of boundary conditions at β = 0.0 , 0.3 , and 0.5 , as well as β = 0.7 with no-slip conditions. Differences between the two are caused by the coarser frequency bins used for SPOD, resulting in energy bleeding to neighbouring frequencies. Meanwhile, for slip boundaries at β = 0.7 , energy is observed over a wide range of frequencies with no clear peak observable. For the second mode, the eigenvalues are significantly dampened, indicating that oscillations at these frequencies are much more energetic in the first mode compared to the others. Such a phenomenon is indicative of low-rank behaviour [48,61], where the separation between the modes highlights the prevalence of a physical mechanism in the first mode.
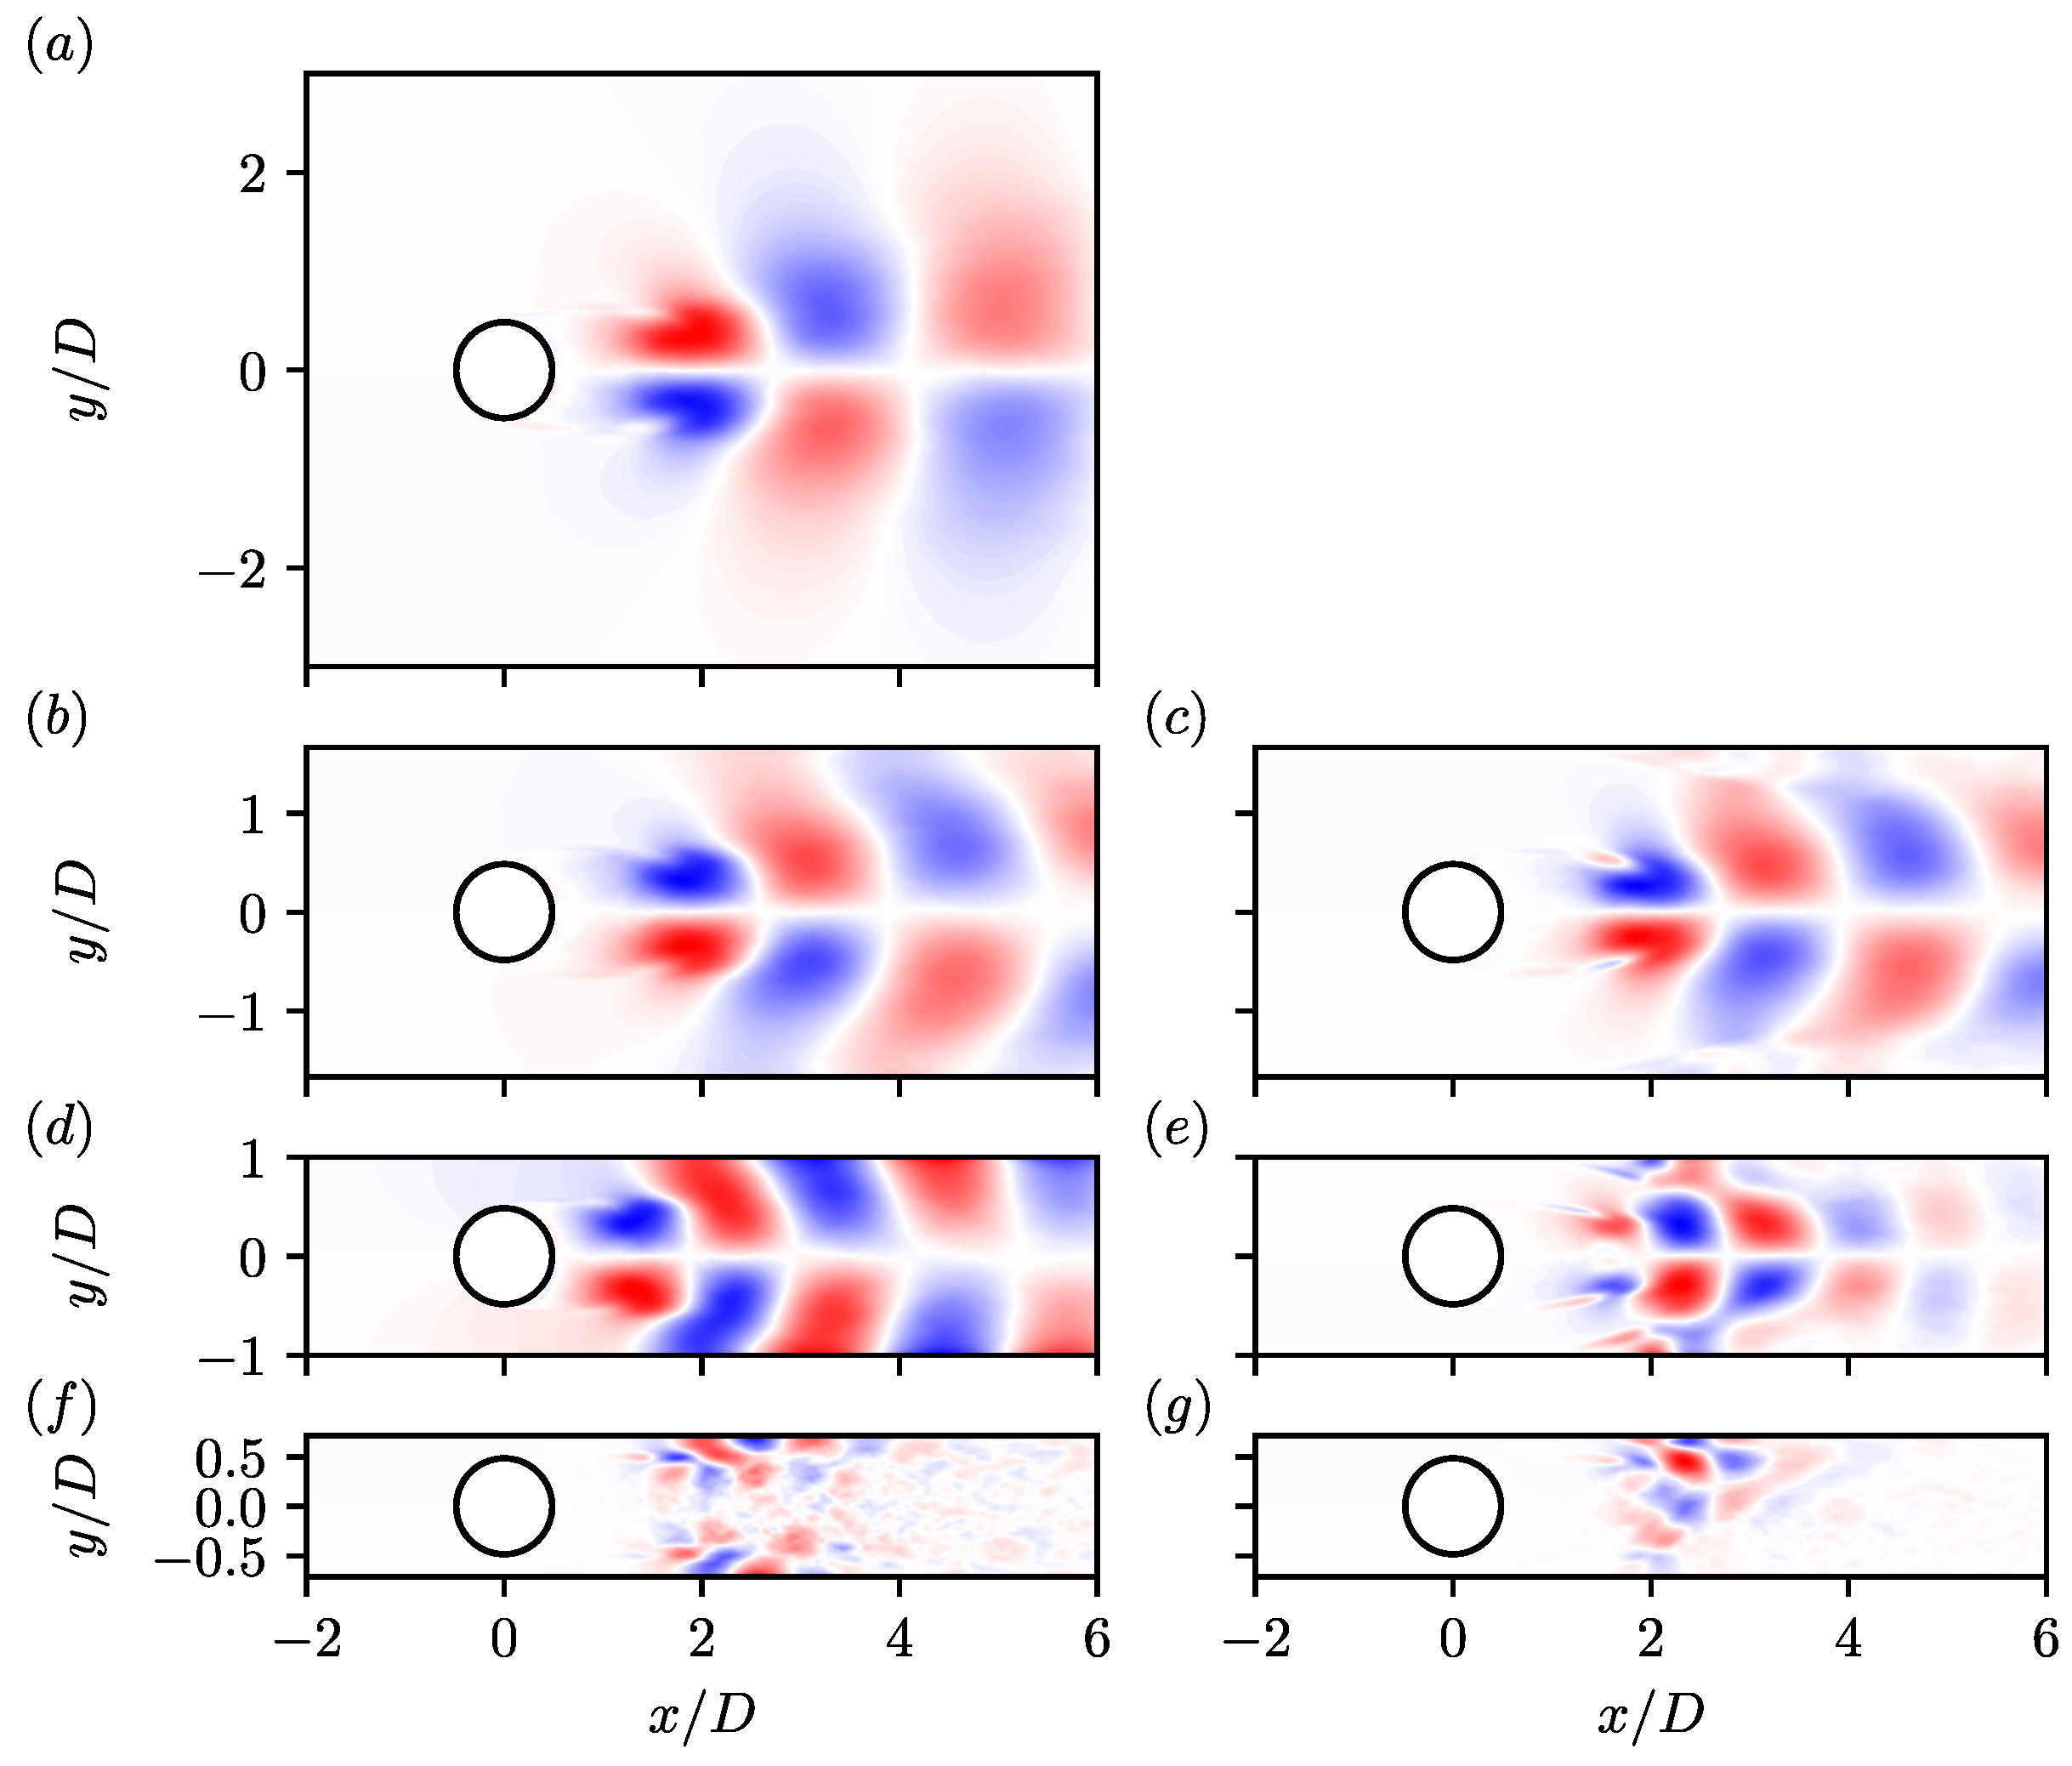
As such, we now visualise in Figure 12 the spatial structure of the leading streamwise SPOD mode at the primary peak S t K for slip (left) and no-slip (right) walls, demarcated by the dotted lines in Figure 11. Beginning with the modes at the main peak, we find the spatial structure for blockage ratios of β = 0.0 , 0.3 , and 0.5 to be quite similar, while differing significantly from the mode at β = 0.7 . In Figure 12a, we see the spatial pattern at the shedding frequency for the unconfined case is antisymmetric about the centreline y / D = 0 and consists of a spatially alternating pattern which extends far downstream. The pattern is typical in dimensional reduction methods for bluff body flows [62,63,64,65,66,67] and represents Kármán shedding in the wake. Increasing the blockage to β = 0.3 and 0.5 in Figure 12b–e, we see that the general structure of the mode remains unchanged, due to the presence of vortex shedding. However, the change in flow configuration does alter finer details of these structures quite significantly. At β = 0.3 , the shape of these structures is similar for both sets of boundary conditions, reflecting the minor effect of confinement at this blockage. Specifically, with slip walls, Figure 12b shows that unlike the unconfined case, where the mode diffuses out in the far field, confinement prevents this, and there are oscillations near the wall due to Kármán vortices disturbing the fluid. The size of the structures is reduced compared with an unconfined flow. Similar observations were made by Kumar and Mittal [57] in linear modes at the onset of vortex shedding. With no-slip walls, in Figure 12c, structures are also present along the channel walls, indicative of shedding in the WSLs, as was observed in the instantaneous flow. The magnitude of these structures is significantly smaller than in the wake, supporting observations that shedding drives instability in the WSLs.
Meanwhile, for β = 0.5 , Figure 12d shows that slip walls again yield similar shedding modes to the unconfined case. The magnitude of the mode near the cylinder is similar to that along the slip walls. This does indicate that Kármán vortices are hitting the boundary and convecting downstream, consistent with instantaneous visualisations in Figure 4. With no-slip walls, Figure 12e shows large differences in the leading SPOD mode for x / D > 2 . The structures forming from the separated WSLs are of a similar magnitude to wake structures, consistent with observations of Kármán vortices forming synchronously with vortices in the WSLs. Such observations further enforce the prior observation of a two-way coupling between Kármán vortices and WSLs. Furthermore, these interactions result in more rapid decay of the structures in Figure 12e, giving a more turbulent structure downstream in the instantaneous visualisations. The size of the structures has also shrunken, suggesting that confinement reduces the size of shed vortices. Relating back to the increase in Strouhal number with blockage, there appears to be a strong correlation between the wavelength of these structures’ modes and the Strouhal number. If we assume Taylor’s frozen eddy hypothesis, these vortices are convected along by the mean flow at a higher frequency. Thus, a possible interpretation of the effect may be that confinement restricts the size wake vortices, which allows for faster formation and thus a higher frequency.
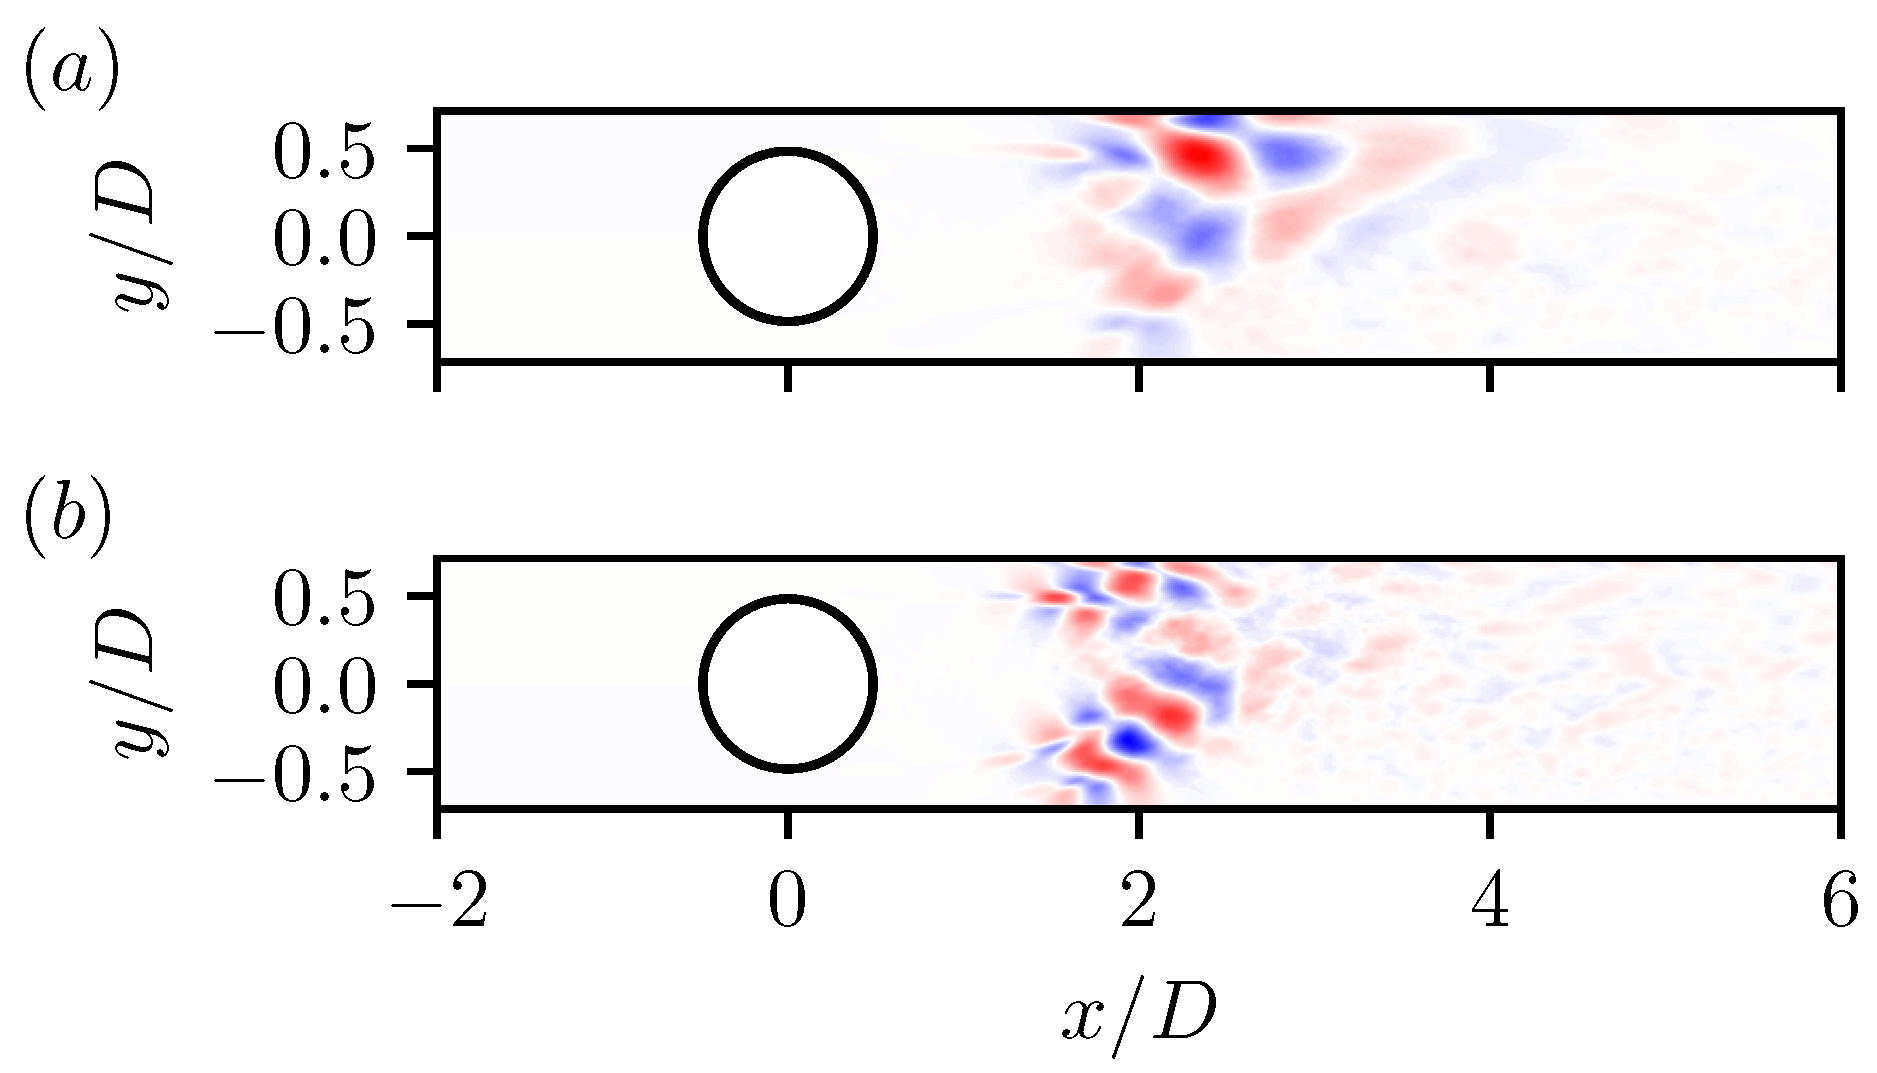
Moving up to the largest blockage considered β = 0.7 , we find the structure of the first mode to be significantly different to the previous three cases, being spatially localised in the shear layers. The result is not surprising, given the lack of vortex shedding observed in the instantaneous flow (Figure 4f,g). In the case of slip walls, Figure 11f shows a spread of energy over a large range of frequencies. Meanwhile, with no-slip walls, Figure 11g finds a second peak at f D / U = 2.2 . Ooi et al. [17] made similar findings by looking at the frequency spectra within the shear layer, and found that breakdown occurred via a Kelvin–Helmholtz-type mechanism, although the exact determination of the physical mechanisms corresponding to each spectral peak observed was inconclusive. We therefore look at the leading SPOD modes associated with both peaks in Figure 13 to gain further insight. In Figure 13b, for the larger frequency f D / U = 2.2 , we find that the mode is concentrated in the shear layers, indicating strong vortices form in this region. The structure of the mode is reminiscent of Kelvin–Helmholtz-type wave packets [48], suggesting that this peak is associated with the shear layer frequency. Meanwhile, for the mode at f D / U = 1.1 (Figure 13a), the wavelength of the structures is more elongated compared with higher frequencies, which occurs as a result of vortex merging. Importantly, the growth of these structures occurs slightly downstream of the growth region at f D / U = 2.2 and reaches their maximum amplitude at the tail of the wake. The effect is a natural consequence of the time it takes Kelvin–Helmholtz vortices to merge once formed.

6. Spectral Analysis of the Shear Layers

Fourier Analysis

To more deeply interrogate instabilities originating within the shear layer, we now consider probing streamwise velocity within regions of strong streamwise fluctuations [17]. To capture the shear layer frequency, we consider points where the instability begins to grow, demarcated by the green dots in Figure 6. Fourier spectra of the streamwise velocity signal are presented in Figure 8. We find that for β 0.5 , a prominent peak occurs at S t K , demarcated by the dotted line, a result of vortex shedding being a global phenomena [1,68,69]. Additional peaks also occur at higher frequencies, which, for the unconfined case, correspond with higher harmonics of the shedding frequency as well as the fundamental frequency of shear layer vortex formation.
Beginning with the unconfined case β = 0.0 , distinct peaks are observed at the dotted and dashed dotted lines for S t K = 0.21 and 0.42 , corresponding to vortex shedding, while at higher frequencies, a smaller broadbanded peak is found for S t S L 1.4 . The spread of energy in the spectrum is a consequence of the intermittent formation of shear layer vortices. As Fourier basis functions are not temporally localised, this intermittency results in the bleed-through of energy to neighbouring frequencies [70]. We therefore base our estimate on the visual centre of the peak, which does introduce slight uncertainty in estimates of S t S L . Nonetheless, there is quite a large amount of scatter in S t S L / S t K within the existing literature (Table 3), the results of which lie within.
Moving to β = 0.3 , we see for slip walls in Figure 8b that there is little difference between the unconfined cases, with a primary and secondary peak at S t K = 0.22 and 0.44 , respectively. Meanwhile, the broad peak occurs at approximately S t S L = 1.2 . Comparison with the no-slip data finds the same shear layer frequency. Surprisingly, this is slightly lower than the unconfined case. The computation of the ratio S t S L / S t K gives a value of approximately 5.9 . A possible explanation may lie in the differences in bulk Reynolds number between β = 0.0 and 0.3 due to the use of a parabolic profile. Using data from the previous section for an unconfined cylinder at R e b = 2600 , we evaluate S t S L / S t K , yielding a slightly smaller value of 5.12 . Similarly, the empirical formula of Prasad and Williamson [71] also yields a slightly smaller value of S t S L / S t K = 4.56 . It is therefore likely that this increase in S t S L is caused by confinement effects.
With further increases in blockage, we find that there is an increase in the shear layer frequency as previously reported by Ooi et al. [17]. Much like with β = 0.3 , there also appears to be no variation in the shear layer frequency for both slip and no-slip walls. Hence, interactions between the WSL and CSL do not appear to affect the formation of shear layer vortices. To further interrogate the interactions between CSLs with WSLs, the analysis of Bloor [59] found the shear layer frequency scales as,
f S L U b l θ s ,
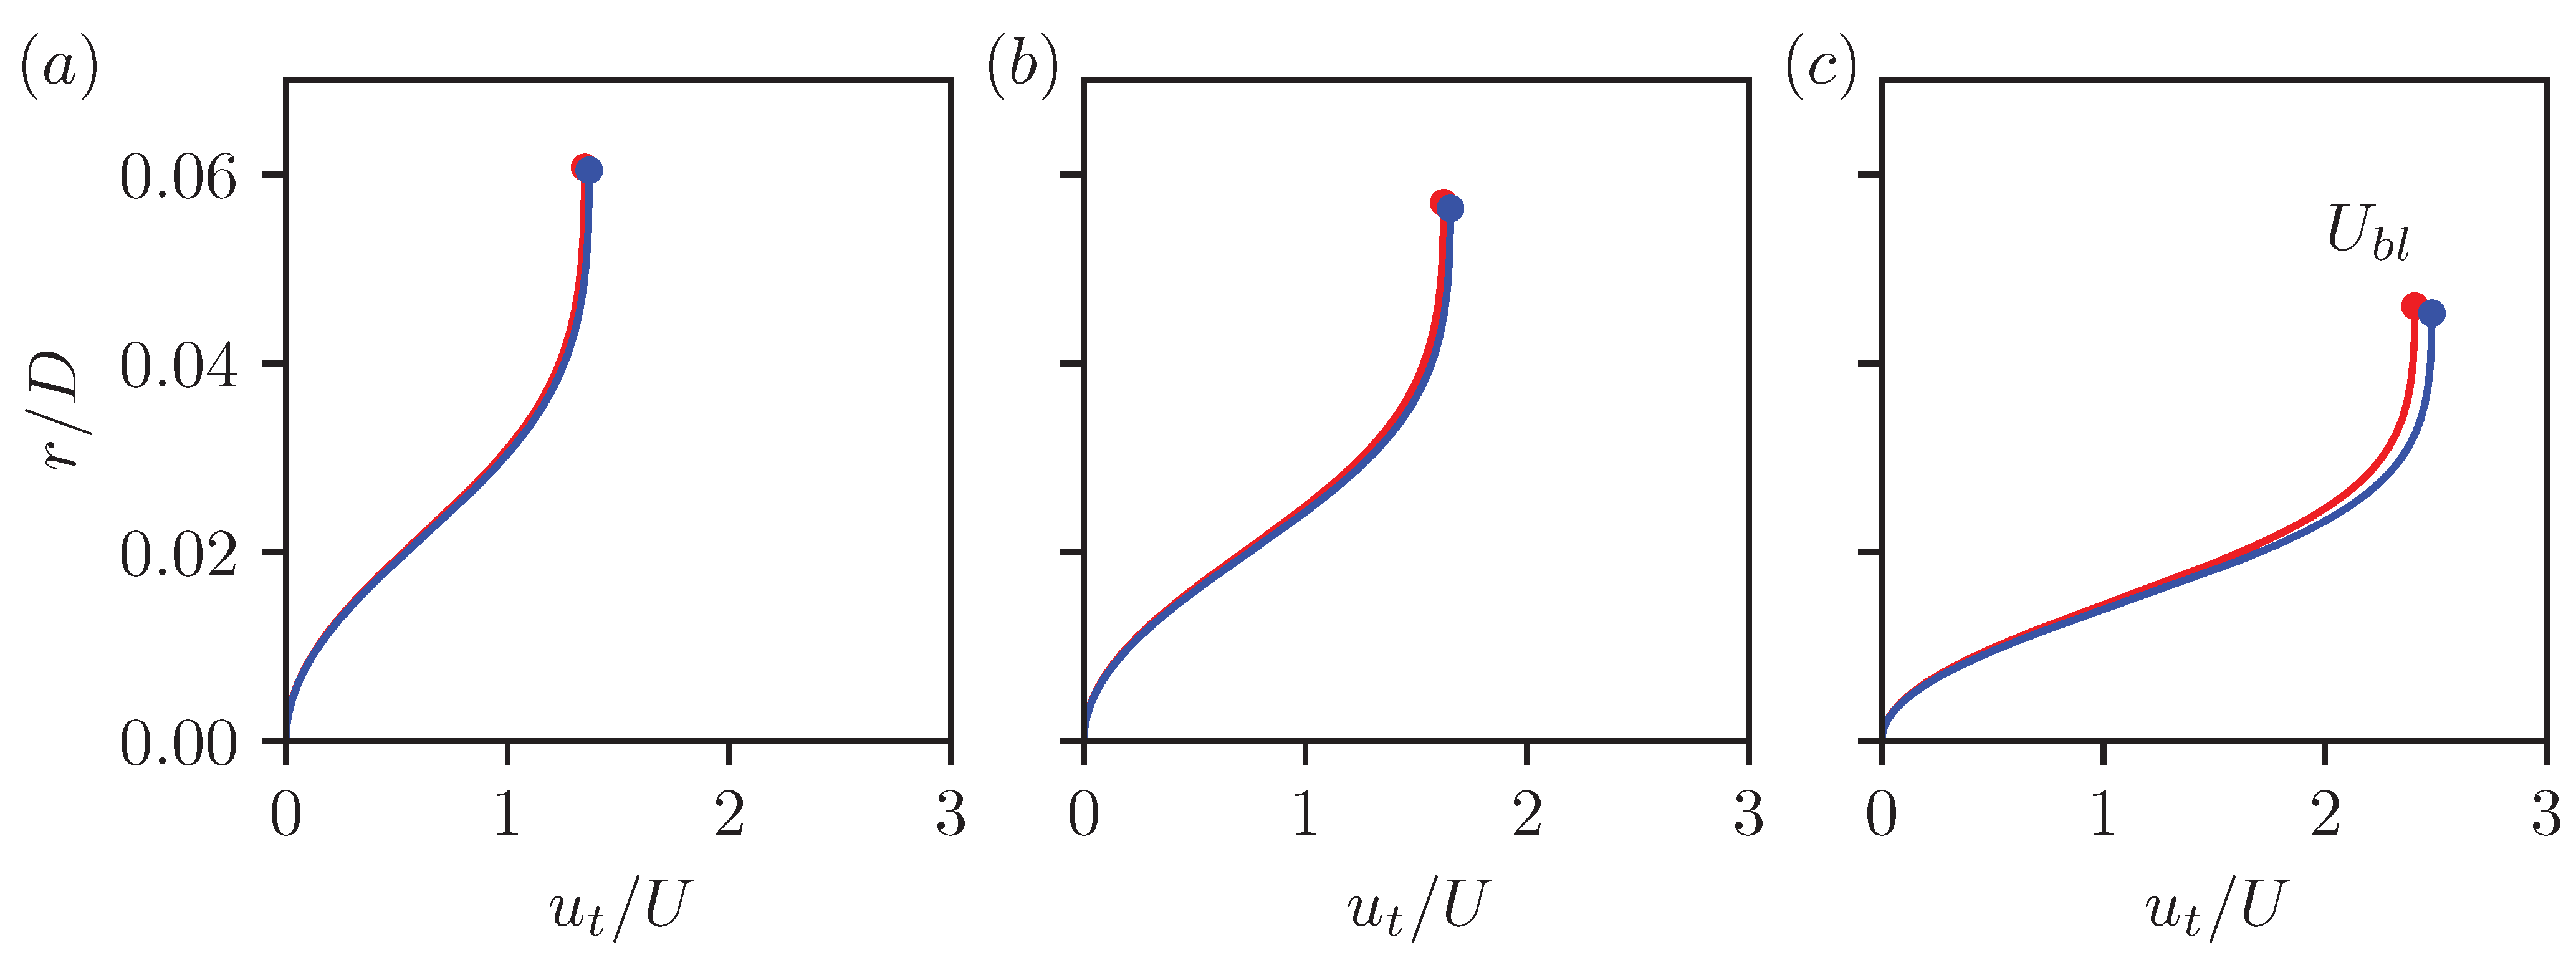
where U b l is the velocity at the edge of the boundary layer and θ s is the boundary layer thickness at the point of separation. We therefore consider plots of the tangential velocity profile along the cylinder at the point of separation in Figure 14.
The velocity at the edge of the boundary layer U b l naturally scales with β due to mass conservation. Therefore, we expect a general increase in f S L with β , as observed in Figure 8 excluding β = 0.3 with slip walls. However, as mentioned previously, the bulk velocity with crossflow boundaries is lower than the unconfined case. Using a consistent bulk Reynolds number gives an estimate of the shear layer frequency of S t S L 0.96 , consistent with the observed trend.
Now, looking at the differences between slip and no-slip walls, Figure 14 shows that the boundary layer profiles at separation are virtually identical between the two cases. Hence, from Equation (8), the shear layer frequency would not change between both sets of boundary conditions, as observed in Table 4. It is of note that the profiles with no-slip walls are slightly thicker than those with slip walls, and may explain any secondary differences between values of S t S L . However, given the uncertainty in computing S t S L , particularly in the identification of the peak frequency and the discrete nature of the frequency bins, we refrain from further discussion of this effect.
We conclude this section by looking at the coupling between the wake and WSLs when the walls are no-slip. Strong streamwise fluctuations are observed in the WSLs as well, thus the spectra have also been plotted in Figure 10c,e,g. Beginning with β = 0.3 , we find that the most prominent peak occurs at the same frequency as the shedding frequency, with smaller peaks at the second 2 S t K and third 3 S t K harmonics. However, little energy is contained near the shear layer frequency, indicating that vortices that form within the WSLs have a characteristic frequency of S t K . In this case, Kármán vortices coupled with the WSL, hence fixing this frequency to the shedding frequency. A similar effect also occurs for β = 0.5 , although, as discussed in the prior section, the WSL influences the shedding frequency, thus we see a higher value of S t K shared between the CSLs and WSLs. Moving to the largest blockage, β = 0.7 , we find the WSL frequency is tied to the frequency of the shear layer instability of the CSL, consistent with observations in Figure 12g. Surprisingly though, given the findings in this section of S t S L not being influenced by interactions with the walls, this does imply that the instability in the CSLs drives corresponding instabilities in the WSLs, meaning there is no modulating effect from the WSLs in this case.

7. Conclusions

The turbulent wake of an isolated cylinder is a canonical flow problem that has been studied quite extensively over many years. The presence of nearby walls affects this wake in at least two ways. Firstly, the walls enhances the acceleration of fluid past the cylinder (confinement effects), creating a more intense shear layer from the cylinder. Secondly, further downstream, the interaction between the cylinder wake and the channel walls creates an adverse pressure gradient situation, causing the boundary layer on the channel walls to separate (wall shear layer (WSL)) and interact with the cylinder wake (wall–wake interactions). In this paper, we try to study these two effects separately by performing novel direct numerical simulation (DNS) of flow past a cylinder placed symmetrically within a channel. Both no-slip and slip boundary conditions were used on the confining walls to isolate the effects of confinement and wall–wake interactions. Observations of the flow field find that Kármán shedding occurs for blockages β 0.5 for both sets of boundary conditions, whereas, for the largest blockage ratio considered, β = 0.7 , shedding is suppressed. Unlike the case with no-slip walls, where the wake is asymmetric (in the mean), the wake with slip walls recovers its symmetry. The difference between boundary conditions suggests that the asymmetry in the no-slip case is caused by the interactions between the wake and WSLs.
Spectral analysis has also been conducted to investigate the coupling between the wake and WSLs. For β = 0.3 , the effect of the WSL does not significantly affect vortex shedding, with little change to the shedding frequency and leading SPOD mode. In this case, vortex shedding drives instabilities in the WSL. For the β = 0.5 case, a two-way coupling occurs between wake and WSLs. Wake confinement only slightly increases the shedding frequency, while wall–wake interactions made up the increase in S t K at this blockage. Similarly, strong modifications were also found in the leading SPOD mode when wall–wake interactions were introduced.
For β = 0.7 , where vortex shedding has been suppressed, vortices forming in the WSLs are instead one-way coupled to Kelvin–Helmholtz vortices in the CSLs. The shear layer frequency was ascertained to be primarily influenced by the confinement, with little influence from the wall–wake interactions. In fact, this observation was determined to hold for all blockage ratios considered.

Author Contributions

Conceptualization, W.L. and A.O.; methodology, W.L., L.C. and A.O.; software, W.L.; validation, W.L.; formal analysis, W.L., L.C. and A.O.; investigation, W.L., L.C. and A.O.; resources, L.C. and A.O.; writing—original draft preparation, W.L. and A.O.; writing—review and editing, W.L., L.C. and A.O.; funding acquisition, A.O. All authors have read and agreed to the published version of the manuscript.

Funding

W.L. was partially funded by the Defence Science Insititute (DSI) RHD Student Grant.

Data Availability Statement

The dataset is available on request from the authors.

Acknowledgments

This research was supported by The University of Melbourne’s Research Computing Services, the Petascale Campus Initiative, and the assistance of resources and services from the National Computational Infrastructure (NCI), which is supported by the Australian Government.

Conflicts of Interest

The authors declare no conflicts of interest.

Abbreviations

The following abbreviations are used in this manuscript:
CFLCourant–Friedrichs–Lewy number
CSLCylinder shear layer
DNSDirect numerical simulation
GLLGauss–Lobatto–Legendre
OIFSOperator-integration-factor-splitting
SPODSpectral proper orthogonal decomposition
TKETurbulent kinetic energy
WSLWall shear layer

References

  1. Williamson, C.H.K. Vortex Dynamics in the Cylinder Wake. Annu. Rev. Fluid Mech. 1996, 28, 477–539. [Google Scholar] [CrossRef]
  2. Derakhshandeh, J.; Alam, M.M. A review of bluff body wakes. Ocean. Eng. 2019, 182, 475–488. [Google Scholar] [CrossRef]
  3. Jackson, C. A finite-element study of the onset of vortex shedding in flow past variously shaped bodies. J. Fluid Mech. 1987, 182, 23–45. [Google Scholar] [CrossRef]
  4. Barkley, D.; Henderson, R.D. Three-dimensional Floquet stability analysis of the wake of a circular cylinder. J. Fluid Mech. 1996, 322, 215–241. [Google Scholar] [CrossRef]
  5. Kravchenko, A.G.; Moin, P. Numerical studies of flow over a circular cylinder at ReD = 3900. Phys. Fluids 2000, 12, 403–417. [Google Scholar] [CrossRef]
  6. Parnaudeau, P.; Carlier, J.; Heitz, D.; Lamballais, E. Experimental and numerical studies of the flow over a circular cylinder at Reynolds number 3900. Phys. Fluids 2008, 20, 085101. [Google Scholar] [CrossRef]
  7. Lysenko, D.A.; Ertesvåg, I.S.; Rian, K.E. Large-eddy simulation of the flow over a circular cylinder at Reynolds number 3900 using the OpenFOAM toolbox. Flow Turbul. Combust. 2012, 89, 491–518. [Google Scholar] [CrossRef]
  8. Pereira, F.; Vaz, G.; Eça, L.; Girimaji, S. Simulation of the flow around a circular cylinder at Re = 3900 with Partially-Averaged Navier-Stokes equations. Int. J. Heat Fluid Flow 2018, 69, 234–246. [Google Scholar]
  9. Molochnikov, V.; Mikheev, N.; Mikheev, A.; Paereliy, A.; Dushin, N.; Dushina, O. SIV measurements of flow structure in the near wake of a circular cylinder at Re = 3900. Fluid Dyn. Res. 2019, 51, 055505. [Google Scholar]
  10. Lehmkuhl, O.; Rodríguez, I.; Borrell, R.; Oliva, A. Low-frequency unsteadiness in the vortex formation region of a circular cylinder. Phys. Fluids 2013, 25, 085109. [Google Scholar] [CrossRef]
  11. Franke, J.; Frank, W. Large eddy simulation of the flow past a circular cylinder at ReD = 3900. J. Wind. Eng. Ind. Aerodyn. 2002, 90, 1191–1206. [Google Scholar]
  12. D’Alessandro, V.; Montelpare, S.; Ricci, R. Detached–eddy simulations of the flow over a cylinder at Re = 3900 using OpenFOAM. Comput. Fluids 2016, 136, 152–169. [Google Scholar]
  13. Lysenko, D.A. Free stream turbulence intensity effects on the flow over a circular cylinder at Re = 3900: Bifurcation, attractors and Lyapunov metric. Ocean. Eng. 2023, 287, 115787. [Google Scholar]
  14. Dong, S.; Karniadakis, G.E.; Ekmekci, A.; Rockwell, D. A combined direct numerical simulation–particle image velocimetry study of the turbulent near wake. J. Fluid Mech. 2006, 569, 185–207. [Google Scholar] [CrossRef]
  15. Jiang, H.; Cheng, L. Large-eddy simulation of flow past a circular cylinder for Reynolds numbers 400 to 3900. Phys. Fluids 2021, 33, 034119. [Google Scholar] [CrossRef]
  16. Sahin, M.; Owens, R.G. A numerical investigation of wall effects up to high blockage ratios on two-dimensional flow past a confined circular cylinder. Phys. Fluids 2004, 16, 1305–1320. [Google Scholar] [CrossRef]
  17. Ooi, A.; Lu, W.; Chan, L.; Cao, Y.; Leontini, J.; Skvortsov, A. Turbulent flow over a cylinder confined in a channel at Re = 3900. Int. J. Heat Fluid Flow 2022, 96, 108982. [Google Scholar] [CrossRef]
  18. Nguyen, Q.D.; Lei, C. Hydrodynamic characteristics of a confined circular cylinder in cross-flows. Ocean. Eng. 2021, 221, 108567. [Google Scholar] [CrossRef]
  19. Nguyen, Q.D.; Lei, C. A particle image velocimetry measurement of flow over a highly confined circular cylinder at 60% blockage ratio. Phys. Fluids 2021, 33, 104111. [Google Scholar] [CrossRef]
  20. Nguyen, Q.D.; Lei, C. A PIV study of blockage ratio effects on flow over a confined circular cylinder at low Reynolds numbers. Exp. Fluids 2023, 64, 10. [Google Scholar]
  21. Lu, W.; Nguyen, Q.D.; Chan, L.; Lei, C.; Ooi, A. Flows past cylinders confined within ducts. Effects of the duct width. Int. J. Heat Fluid Flow 2023, 104, 109208. [Google Scholar]
  22. Lu, W.; Aljubaili, D.; Zahtila, T.; Chan, L.; Ooi, A. Asymmetric wakes in flows past circular cylinders confined in channels. J. Fluid Mech. 2023, 958, A8. [Google Scholar] [CrossRef]
  23. Lu, W.; Chan, L.; Ooi, A. Influence of upstream turbulence on flow past a confined circular cylinder. Submitted to Phys. Rev. Fluids, 2025; under review. [Google Scholar]
  24. Nguyen, Q.D.; Lu, W.; Chan, L.; Ooi, A.; Lei, C. A state-of-the-art review of flows past confined circular cylinders. Phys. Fluids 2023, 35, 071301. [Google Scholar]
  25. Ooi, A.; Chan, L.; Aljubaili, D.; Mamon, C.; Leontini, J.; Skvortsov, A.; Mathupriya, P.; Hasini, H. Some new characteristics of the confined flow over circular cylinders at low reynolds numbers. Int. J. Heat Fluid Flow 2020, 86, 108741. [Google Scholar] [CrossRef]
  26. Aljubaili, D.; Chan, L.; Lu, W.; Ooi, A. Numerical investigations of the wake behind a confined flat plate. Int. J. Heat Fluid Flow 2022, 94, 108924. [Google Scholar]
  27. Fischer, P.; Kerkemeier, S.; Min, M.; Lan, Y.H.; Phillips, M.; Rathnayake, T.; Merzari, E.; Tomboulides, A.; Karakus, A.; Chalmers, N.; et al. NekRS, a GPU-accelerated spectral element Navier–Stokes solver. Parallel Comput. 2022, 114, 102982. [Google Scholar] [CrossRef]
  28. Fischer, P.F.; Lottes, J.W.; Kerkemeier, S.G. nek5000 Web Page. 2008. Available online: https://nek5000.mcs.anl.gov/ (accessed on 12 April 2023).
  29. Zahtila, T.; Lu, W.; Chan, L.; Ooi, A. A systematic study of the grid requirements for a spectral element method solver. Comput. Fluids 2023, 251, 105745. [Google Scholar] [CrossRef]
  30. Zahtila, T.; Chan, L.; Ooi, A.; Philip, J. Particle transport in a turbulent pipe flow: Direct numerical simulations, phenomenological modelling and physical mechanisms. J. Fluid Mech. 2023, 957, A1. [Google Scholar] [CrossRef]
  31. Zahtila, T.; Chan, L.; Ooi, A.; Liu, K.; Benjamin, M.; Iaccarino, G. Influence of Miura-origami shapes on drag in turbulent flows. In Proceedings of the Summer Program 2022, Center for Turbulence Research, Bures-sur-Yvette, France, 11–29 July 2022. [Google Scholar]
  32. Chan, L.; Skvortsov, A.; Ooi, A. Effect of straight riblets of the underlying surface on wall bounded flow drag. Int. J. Heat Fluid Flow 2023, 102, 109160. [Google Scholar] [CrossRef]
  33. Chan, L.; Skvortsov, A.; Ooi, A. Flow over a confined mounted fence at low and moderate Reynolds number: A numerical study. Int. J. Heat Fluid Flow 2022, 96, 109001. [Google Scholar] [CrossRef]
  34. Lee, J.; Chan, L.; Zahtila, T.; Lu, W.; Iaccarino, G.; Ooi, A. Surrogate models for multiregime flow problems. Phys. Rev. Fluids 2025, 10, 024703. [Google Scholar] [CrossRef]
  35. Cui, G.; Cao, Y.; Yan, Y.; Wang, W. Hydrodynamic performance improvement on the hydrofoil using slotted configurations. Ocean. Eng. 2024, 299, 117350. [Google Scholar] [CrossRef]
  36. Cui, G.; Cao, Y.; Yan, Y.; Wang, W. Numerical study on high-fidelity flow field around vanes of a Francis turbine. Phys. Fluids 2024, 36, 045137. [Google Scholar] [CrossRef]
  37. Cao, Y.; Philip, J.; Ooi, A. Characteristics of a buoyant plume in a channel with cross-flow. Int. J. Heat Fluid Flow 2022, 93, 108899. [Google Scholar] [CrossRef]
  38. Zahtila, T.; Lam, W.K.; Chan, L.; Sutherland, D.; Moinuddin, K.; Dai, A.; Skvortsov, T.A.; Manasseh, R.; Ooi, A. On the propagation of planar gravity currents into a stratified ambient. Phys. Fluids 2024, 36, 036601. [Google Scholar] [CrossRef]
  39. Lam, W.K.; Chan, L.; Sutherland, D.; Manasseh, R.; Moinuddin, K.; Ooi, A. Effect of Stratification on the Propagation of a Cylindrical Gravity Current. J. Fluid Mech. 2024, 983, A43. [Google Scholar] [CrossRef]
  40. Lam, W.K.; Chan, L.; Cao, Y.; Sutherland, D.; Manasseh, R.; Moinuddin, K.; Ooi, A. Mixing of a Cylindrical Gravity Current in a Stratified Ambient. Int. J. Heat Fluid Flow 2024, 107, 109410. [Google Scholar] [CrossRef]
  41. Lu, W.; Ooi, A.; Thomas, L.; Zahtila, T.; Iaccarino, G. Application of multi-fidelity methods to prediction of gravity currents for uncertainty quantification. In Proceedings of the Summer Program, Center for Turbulence Research, Stanford University, Stanford, CA, USA, 19 June–23 July 2024. [Google Scholar]
  42. Cao, Y.; Ooi, A.; Philip, J. Characteristics of planar buoyant jets and plumes in a turbulent channel crossflow from direct numerical simulations. Environ. Fluid Mech. 2024, 24, 1047–1074. [Google Scholar] [CrossRef]
  43. Maday, Y.; Patera, A.T. Spectral element methods for the incompressible Navier-Stokes equations. In State-of-the-Art Surveys on Computational Mechanics (A90-47176 21–64); Amer Society of Mechanical: New York, NY, USA, 1989; pp. 71–143. [Google Scholar]
  44. Maday, Y.; Patera, A.T.; Rønquist, E.M. An operator-integration-factor splitting method for time-dependent problems: Application to incompressible fluid flow. J. Sci. Comput. 1990, 5, 263–292. [Google Scholar] [CrossRef]
  45. Lumley, J.L. The structure of inhomogeneous turbulent flows. Atmos. Turbul. Radio Wave Propag. 1967, 166–178. [Google Scholar]
  46. Lumley, J.L. Stochastic Tools in Turbulence; Courier Corporation: North Chelmsford, MA, USA, 2007. [Google Scholar]
  47. Towne, A.; Schmidt, O.T.; Colonius, T. Spectral proper orthogonal decomposition and its relationship to dynamic mode decomposition and resolvent analysis. J. Fluid Mech. 2018, 847, 821–867. [Google Scholar] [CrossRef]
  48. Schmidt, O.T.; Colonius, T. Guide to Spectral Proper Orthogonal Decomposition. AIAA J. 2020, 58, 1023–1033. [Google Scholar] [CrossRef]
  49. Thompson, M.C.; Hourigan, K. The shear-layer instability of a circular cylinder wake. Phys. Fluids 2005, 17, 021702. [Google Scholar] [CrossRef]
  50. Unal, M.F.; Rockwell, D. On vortex formation from a cylinder. Part 1. The initial instability. J. Fluid Mech. 1988, 190, 491–512. [Google Scholar] [CrossRef]
  51. Aljure, D.; Lehmkhul, O.; Rodríguez, I.; Oliva, A. Three dimensionality in the wake of the flow around a circular cylinder at Reynolds number 5000. Comput. Fluids 2017, 147, 102–118. [Google Scholar]
  52. Moin, P.; Mahesh, K. DIRECT NUMERICAL SIMULATION: A Tool in Turbulence Research. Annu. Rev. Fluid Mech. 1998, 30, 539–578. [Google Scholar] [CrossRef]
  53. Posdziech, O.; Grundmann, R. Numerical simulation of the flow around an infinitely long circular cylinder in the transition regime. Theor. Comput. Fluid Dyn. 2001, 15, 121–141. [Google Scholar]
  54. Posdziech, O.; Grundmann, R. A systematic approach to the numerical calculation of fundamental quantities of the two-dimensional flow over a circular cylinder. J. Fluids Struct. 2007, 23, 479–499. [Google Scholar] [CrossRef]
  55. Persillon, H.; Braza, M. Physical analysis of the transition to turbulence in the wake of a circular cylinder by three-dimensional Navier–Stokes simulation. J. Fluid Mech. 1998, 365, 23–88. [Google Scholar] [CrossRef]
  56. Karniadakis, G.E.; Triantafyllou, G.S. Three-dimensional dynamics and transition to turbulence in the wake of bluff objects. J. Fluid Mech. 1992, 238, 1–30. [Google Scholar] [CrossRef]
  57. Kumar, B.; Mittal, S. Effect of blockage on critical parameters for flow past a circular cylinder. Int. J. Numer. Methods Fluids 2006, 50, 987–1001. [Google Scholar]
  58. Behr, M.; Hastreiter, D.; Mittal, S.; Tezduyar, T. Incompressible flow past a circular cylinder: Dependence of the computed flow field on the location of the lateral boundaries. Comput. Methods Appl. Mech. Eng. 1995, 123, 309–316. [Google Scholar]
  59. Bloor, M.S. The transition to turbulence in the wake of a circular cylinder. J. Fluid Mech. 1964, 19, 290–304. [Google Scholar] [CrossRef]
  60. Wang, X.; Chen, J.; Zhou, B.; Li, Y.; Xiang, Q. Experimental investigation of flow past a confined bluff body: Effects of body shape, blockage ratio and Reynolds number. Ocean. Eng. 2021, 220, 108412. [Google Scholar] [CrossRef]
  61. Schmidt, O.T.; Towne, A.; Rigas, G.; Colonius, T.; Brès, G.A. Spectral analysis of jet turbulence. J. Fluid Mech. 2018, 855, 953–982. [Google Scholar] [CrossRef]
  62. Siegel, S.G.; Seidel, J.; Fagley, C.; Luchtenburg, D.; Cohen, K.; McLaughlin, T. Low-dimensional modelling of a transient cylinder wake using double proper orthogonal decomposition. J. Fluid Mech. 2008, 610, 1–42. [Google Scholar]
  63. Thacher, E.; Van Ruymbeke, B.; Gabillet, C.; Jacques, N.; Mäkiharju, S.A. Flow topology changes with bubbly flow around a circular cylinder. Int. J. Multiph. Flow 2024, 179, 104917. [Google Scholar]
  64. Chu, S.; Xia, C.; Wang, H.; Fan, Y.; Yang, Z. Three-dimensional spectral proper orthogonal decomposition analyses of the turbulent flow around a seal-vibrissa-shaped cylinder. Phys. Fluids 2021, 33, 025106. [Google Scholar]
  65. Janocha, M.J.; Yin, G.; Ong, M.C. Modal analysis of wake behind stationary and vibrating cylinders. J. Offshore Mech. Arct. Eng. 2021, 143, 041902. [Google Scholar]
  66. Wu, J.; Xiao, D.; Luo, M. Deep-learning assisted reduced order model for high-dimensional flow prediction from sparse data. Phys. Fluids 2023, 35, 103115. [Google Scholar]
  67. Li, S.; Yang, J.; Teng, P. Data-driven prediction of cylinder-induced unsteady wake flow. Appl. Ocean. Res. 2024, 150, 104114. [Google Scholar]
  68. Provansal, M.; Mathis, C.; Boyer, L. Bénard-von Kármán instability: Transient and forced regimes. J. Fluid Mech. 1987, 182, 1–22. [Google Scholar]
  69. Henderson, R.D. Nonlinear dynamics and pattern formation in turbulent wake transition. J. Fluid Mech. 1997, 352, 65–112. [Google Scholar] [CrossRef]
  70. Brun, C.; Aubrun, S.; Goossens, T.; Ravier, P. Coherent structures and their frequency signature in the separated shear layer on the sides of a square cylinder. Flow Turbul. Combust. 2008, 81, 97–114. [Google Scholar]
  71. Prasad, A.; Williamson, C.H.K. The instability of the shear layer separating from a bluff body. J. Fluid Mech. 1997, 333, 375–402. [Google Scholar] [CrossRef]
Figure 1. Two-dimensional slice of the geometry considered presently. Blue dashed line demarcates the region where boundary conditions are varied between slip and no-slip conditions.
Fluids 10 00084 g001
Figure 2. Distribution of the quantity Δ / η for (a) β = 0.3 , (b) β = 0.5 , and (c) β = 0.7 with slip walls.
Fluids 10 00084 g002
Figure 3. Distribution of Δ y w + values of the first grid point along the cylinder surface for β = 0.3 (Fluids 10 00084 i001) β = 0.5 (Fluids 10 00084 i002), and β = 0.7 (Fluids 10 00084 i003) with slip walls.
Fluids 10 00084 g003
Figure 4. Visualisations of the instantaneous spanwise vorticity ω z D / U for (a) β = 0.0 , (b,c) β = 0.3 , (d,e) β = 0.5 , and (f,g) β = 0.7 . Simulations with no-slip channel walls are depicted in (c,e,g), and simulations with slip walls in (b,d,f). Contours range from blue to red between 20 ω z D / U 20 .
Fluids 10 00084 g004
Figure 9. Visualisations of the Reynolds shear stress v v ¯ / U 2 for (a) β = 0.0 , (b,c) β = 0.3 , (d,e) β = 0.5 , and (f,g) β = 0.7 . Simulations with no-slip channel walls are depicted in (c,e,g), and simulations with slip walls in (b,d,f). Contours range from blue to red between 0 v v ¯ / U 2 0.5 . Green dots demarcate the location where crossflow velocity spectra are computed in Figure 10.
Fluids 10 00084 g009
Figure 10. Power spectra of the crossflow velocity signal for slip (grey line) and no-slip (black line) boundary conditions at locations denoted by the green dots in Figure 9 for (a) β = 0.0 , (b) β = 0.3 , (c) β = 0.5 , and (d) β = 0.7 . Dotted lines demarcate the shedding frequency for β = 0.0 .
Fluids 10 00084 g010
Figure 11. SPOD eigenvalue spectra for (a) β = 0.0 , (b,c) β = 0.3 , (d,e) β = 0.5 , and (f,g) β = 0.7 . (a) β = 0.0 and f D / U = 0.21 , (b) β = 0.3 and f D / U = 0.21 , (c) β = 0.3 and f D / U = 0.22 , (d) β = 0.5 and f D / U = 0.28 , (e) β = 0.5 and f D / U = 0.49 , (f) β = 0.7 and f D / U = 1.1 , and (g) β = 0.7 and f D / U = 1.1 . Left column depicts SPOD modes with slip walls, and right column, no-slip walls. Dark to light lines denote increasing SPOD mode. Dotted lines demarcate shedding frequency computed from Figure 10.
Fluids 10 00084 g011
Figure 12. Leading SPOD modes at the peak frequency given by dotted lines in Figure 11. (a) β = 0.0 and f D / U = 0.21 , (b) β = 0.3 and f D / U = 0.21 , (c) β = 0.3 and f D / U = 0.22 , (d) β = 0.5 and f D / U = 0.28 , (e) β = 0.5 and f D / U = 0.49 , (f) β = 0.7 and f D / U = 1.1 , and (g) β = 0.7 and f D / U = 1.1 . Left column depicts SPOD modes with slip walls, and right column, no-slip walls.
Fluids 10 00084 g012
Figure 13. Leading SPOD mode for β = 0.7 and no-slip walls at frequencies of (a) f D / U = 1.1 and (b) f D / U = 2.2 .
Fluids 10 00084 g013
Figure 14. Tangential velocity profile along the cylinder at the point of separation for slip (Fluids 10 00084 i013) and no-slip (Fluids 10 00084 i014) walls. Profiles are compared for blockages of (a) β = 0.3 , (b) β = 0.5 , and (c) β = 0.7 . Dots denote the edge of the boundary layer, defined by the point of maximum velocity.
Fluids 10 00084 g014
Table 1. Mesh statistics of cases considered in the present study.
CaseWall BCs β Re b Re EGrid Points
SB0p0Re3900Slip 0.0 39003900 37,200 37.2 × 10 6
SB0p0Re2600Slip 0.0 2600260037,200 37.2 × 10 6
NB0p3Re3900No-Slip 0.3 2600390042,600 42.6 × 10 6
SB0p3Re3900Slip 0.3 2600390037,020 37.0 × 10 6
NB0p5Re3900No-Slip 0.5 2600390039,780 39.8 × 10 6
SB0p5Re3900Slip 0.5 2600390039,930 39.9 × 10 6
NB0p7Re3900No-Slip 0.7 2600390085,120 85.1 × 10 6
SB0p7Re3900Slip 0.7 2600390033,600 33.6 × 10 6
Table 2. Shift in Strouhal number S t K through switching of wall boundary conditions. For β > 0.0 , the flow the bulk velocity is chosen such that R e b = 2600 . Whereas, for β = 0.0 , slip and no shear semantically refer to flows at R e = R e b = 3900 and 2600, respectively.
β No-SlipSlipNo Shear
0.0 0.21   0.21  
0.3 0.28 0.22
0.5 0.5 0.27
0.7
Table 3. Shedding and shear layer frequencies for flow past an unconfined cylinder at R e = 3900 .
Method St K St SL / St K
Present, Ooi et al. [17]DNS 0.21 7.18
Dong et al. [14]DNS 7.33
Lysenko et al. [7]LES 0.19 0.209 7 8
Lehmkuhl et al. [10]DNS 0.2145 6.2471
Jiang and Cheng [15]LES 0.209 0.211 6.2 6.3
Prasad and Williamson [71]Empirical Fit 5.985
Table 4. Variation of shear layer frequencies with blockage for slip and no-slip walls at R e = 3900 .
β No-SlipSlip
0.0 1.51
0.3 1.20 1.20
0.5 1.85 1.85
0.7 2.25 2.25
Disclaimer/Publisher’s Note: The statements, opinions and data contained in all publications are solely those of the individual author(s) and contributor(s) and not of MDPI and/or the editor(s). MDPI and/or the editor(s) disclaim responsibility for any injury to people or property resulting from any ideas, methods, instructions or products referred to in the content.