Review

Volume Kinetic Analysis in Living Humans: Background History and Answers to 15 Questions in Physiology and Medicine

Anesthesia & Intensive Care, Karolinska Institutet at Danderyds Hospital (KIDS), 152 86 Stockholm, Sweden
Fluids 2025, 10(4), 86; https://doi.org/10.3390/fluids10040086
Submission received: 7 January 2025 / Revised: 13 March 2025 / Accepted: 20 March 2025 / Published: 28 March 2025
(This article belongs to the Special Issue Biological Fluid Dynamics, 2nd Edition)

Abstract

:
Volume kinetics is a pharmacokinetic method for analysis of the distribution and elimination of infusion fluids. The approach has primarily been used to improve the planning of fluid therapy during surgery but is also useful for answering physiological questions. The kinetics is based on 15–35 serial measurements of the blood hemoglobin concentration during and after the fluid is administered intravenously. Crystalloid fluid, such as isotonic saline and Ringer’s lactate, distributes between three compartments that are filled in succession depending on how much fluid is administered. The equilibration of fluid between these three compartments is governed by five rate constants. The compartments are the plasma (Vc), and a fast-exchange (Vt1) and a slow-exchange interstitial compartment (Vt2). The last compartment operates like an overflow reservoir and, if filled, markedly, prolongs the half-life of the fluid. By contrast, the volume of a colloid fluid distributes in a single compartment (Vc) from where the expansion is reduced by capillary leakage and urinary excretion. This review gives 15 examples of physiological or medical questions where volume kinetics has provided answers. These include why urine flow is low during general anesthesia, the inhibitory effects of anesthetics on lymphatic pumping, the influence of dopamine and phenylephrine on urine output, fluid maldistribution in pre-eclampsia, plasma volume oscillations, and issues related to the endothelial glycocalyx layer.

1. Drug Kinetics Versus Volume Kinetics

Pharmacokinetics for infusion fluids is called volume kinetics. The name indicates that the approach is inspired by using mathematics to guide drug therapy. The dose and dosing interval of drugs are always derived based on knowledge about how the drug behaves in the body. This is carried out by repeatedly measuring the concentration of the drug in a body fluid, usually the plasma, and fitting a kinetic model to these data. The fitting procedure estimates how well data created by the model agree with the measured data, and the goal is to find a model that offers as close agreement as possible. The typical model involves the distribution of the drug between two or three compartments. The parameters that are derived by fitting the model to the data can then be used to simulate the outcome of experiments not performed. The goal is to predict a dose and dose interval that maintain the drug concentration within the “therapeutic range”, i.e., when the drug has the desired effect while still not elicit adverse effects. Series of drug experiments are performed to obtain data on between-subject variability [1].
A challenge for researchers has been a long-lasting lack of theoretical framework for planning and management of fluid therapy. Volume kinetics was invented by Robert G. Hahn in 1990 and has since then been the subject of approximately 100 scientific publications. Volume kinetics shares many concepts with the mathematical handling of drug concentrations, but there are certain distinct differences.
The first difference is that infusion fluids contain 97–98% of water and becomes dissolved in the plasma, which consists of water to 91–92%. Hence, there is no concentration that can be measured. However, the therapeutic effect of an infusion fluid is exerted by expansion of the plasma volume and other body fluid spaces, and that expansion can be quantified by measuring the dilution of substances already present in the blood, such as hemoglobin (Hb) and albumin.
The second difference is that drugs are not expected to occupy space, i.e., the walls of the drug compartments do not change their volume during an experiment. By contrast, the therapeutic effect of infusion fluids is due to the compartment walls expanding.

2. History

Work on the kinetics of infusion fluids in the 1980s was applied only to colloid fluids. They contain a molecule that can be measured, such as dextran or starch, although these concentrations were flawed by dilution effects caused by the infusion. No method existed for quantifying the concentration of crystalloid fluid, such as Ringer’s lactate and isotonic saline.
This was soon to change. Robert G. Hahn had a collaboration with forensic scientist Alan W. Jones in the late 1980s. They studied alcohol pharmacokinetics to validate a method for the early detection of fluid absorption in transurethral surgery by using an irrigating fluid that contained 1% of ethanol, which was followed by asking the patients to provide perioperative expired breath tests at regular intervals [2]. Jones used a labor-intensive desiccation method to assess the alcohol concentration in different body fluids (blood, plasma, serum, urine, etc.) [3], and Hahn had the idea to capture the concentration of crystalloid fluid by quantifying the increase in water concentration of whole blood during and after an infusion. The first series of experiments were performed on hospital staff members by Dr. Dan Drobin in early 1991. Excellent curves were obtained as desiccation can be performed very accurately. Measurements started at a water concentration of approximately 80%, whereafter it increased to 85%. The data were sufficient to calculate pharmacokinetic parameters, and it was soon noticed that they corresponded well to a serial analysis of the hemodilution. In fact, the kinetic outputs were virtually identical.
Theoretical considerations plagued the following years. Experiments were performed with measurements of Hb that were initially re-calculated to water concentrations before analysis. Volume kinetics were only reported via posters at scientific congresses [4].
A breakthrough was a collaboration with the Swedish clinical pharmacologist Lars Ståhle, who created the well-known kinetic model with expandable walls. He also wrote the first computer programs designed for the analysis and simulation of volume kinetic data.
It was realized that whatever biomarker measured, we always quantified dilution and not a concentration change. When these theoretical issues had been solved, the first papers were published in 1997 based on the experiments performed several years earlier [5].
A concern was that hemodilution produces an exponential curve. If the baseline Hb level is Hbo and a later concentration Hb1, the hemodilution is normally written (Hb1/Hbo) and corresponds to the percentage change in Hb. By contrast, the equation should be written in the inverse way, i.e., (Hbo/Hb1), if we want the Hb to change in direct proportion to the volume of added fluid [6]. This calculation should start at zero, which is obtained if we subtract 1 from this ratio. Finally, infusion fluids distribute in the plasma, and it is the plasma that equilibrates with the other body fluid volumes. Therefore, the hemodilution must be converted into plasma dilution, and the final input equation for the calculations is then
[(Hbo/Hb1) − 1]/(1 − Hcto)
Of note, only the baseline hematocrit (Hcto) should be used, although this variable decreases over time along with Hb. A serial analysis of Hct provides the same output as Hb but the measurement is less precise than Hb which, if carefully sampled and analyzed, can be reported with a coefficient of variation of 1%. Adding other parameters to this equation, like the red cell count and red cell size, offers minimal or no benefit over a single high-quality analysis of Hb.
Volume kinetics is currently performed by Robert G. Hahn in Sweden and Byung-Moon Choi and Gyujeong Noh in South Korea [7,8]. Xiu Ting Yiew, Shane Bateman, and William Muir in Canada are veterinarians who perform volume kinetic studies on animals. A limitation for its spread is that the active researcher must be able to handle both pharmacokinetics and fluid therapy issues, which is a rare combination. Finally, there is still an opinion among pharmacologists that infusion fluids are not drugs.

3. Procedure

The subjects are studied in the lying position. An intravenous cannula is placed in the cubital vein of each arm for infusing fluid and blood sampling, respectively. The Hb sampling technique and the assay used must be well standardized, as the maximum change, in the absence of vasodilatation, rarely exceeds 10%. A coefficient of variation of 1% for the Hb analysis is achievable. The number of Hb samples taken depends on how complex the kinetics is. Crystalloid fluid is usually studied based on 20–35 samples collected over 2–4 h and colloid fluid by 15–20 samples over 4–6 h. The measured urine output is used to stabilize the model when crystalloid fluid is studied because co-variance problems may be an issue. Volunteers can void whenever they experience urgency, but they need to remain in the lying position. A bladder catheter is used in anesthetized patients.
The kinetic analysis provides a whole-body view of the how the subjects handle the infusion. The output is dependent on their physiological situation. Variability over time and between the subjects is studied by covariates. For example, the modifying influence of the arterial pressure and vasopressor drugs on the fluid kinetics can be quantified by covariance analysis. A larger number of covariates can be estimated with good confidence at the same time when many subjects are analyzed by using the population (mixed models) methodology.

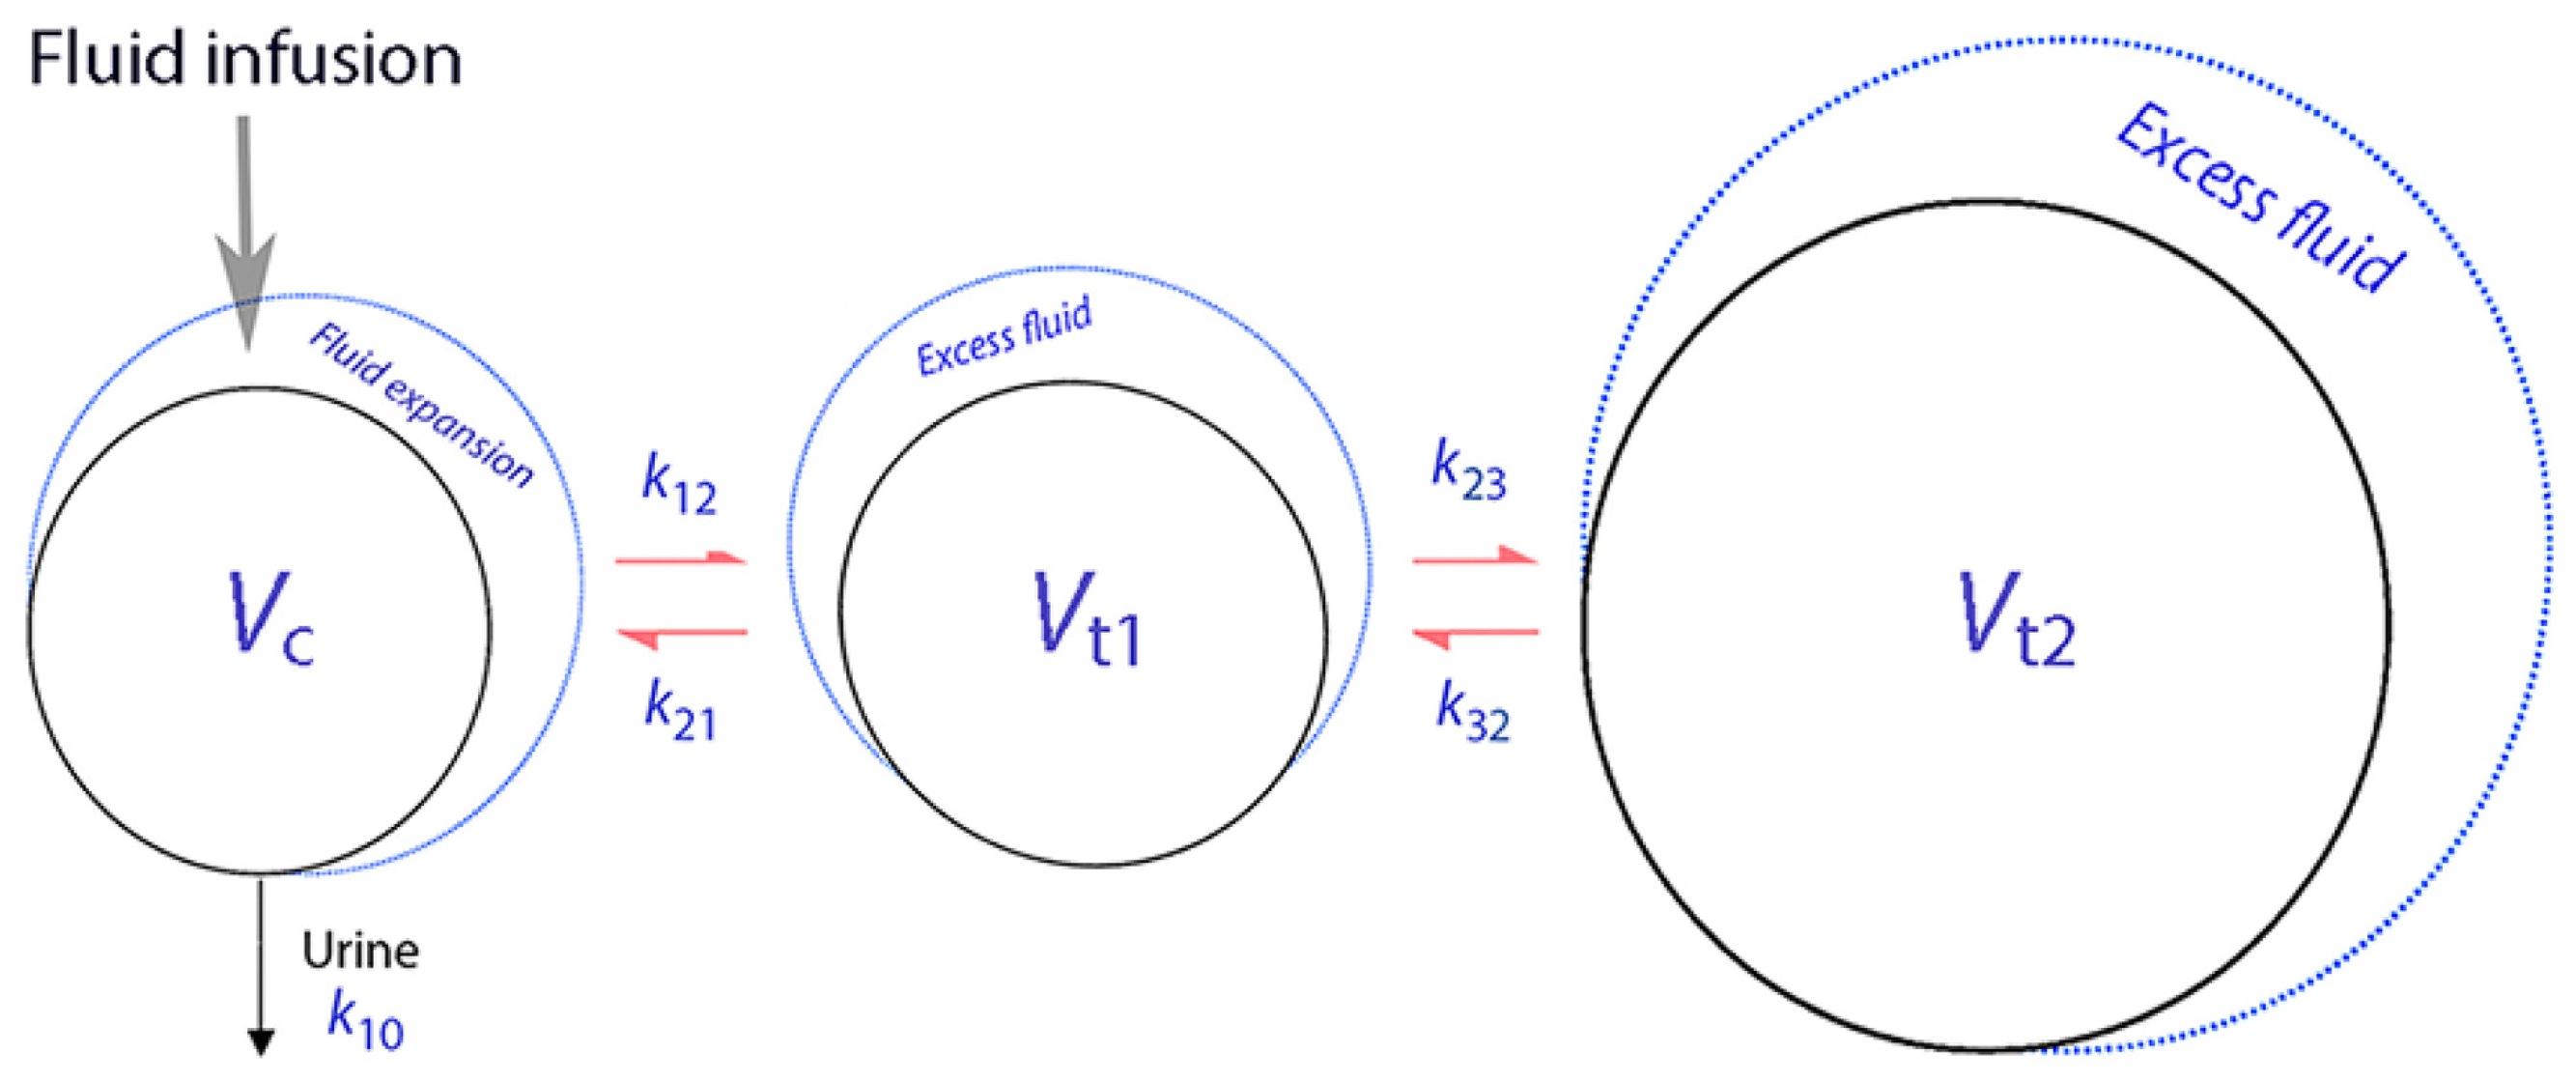
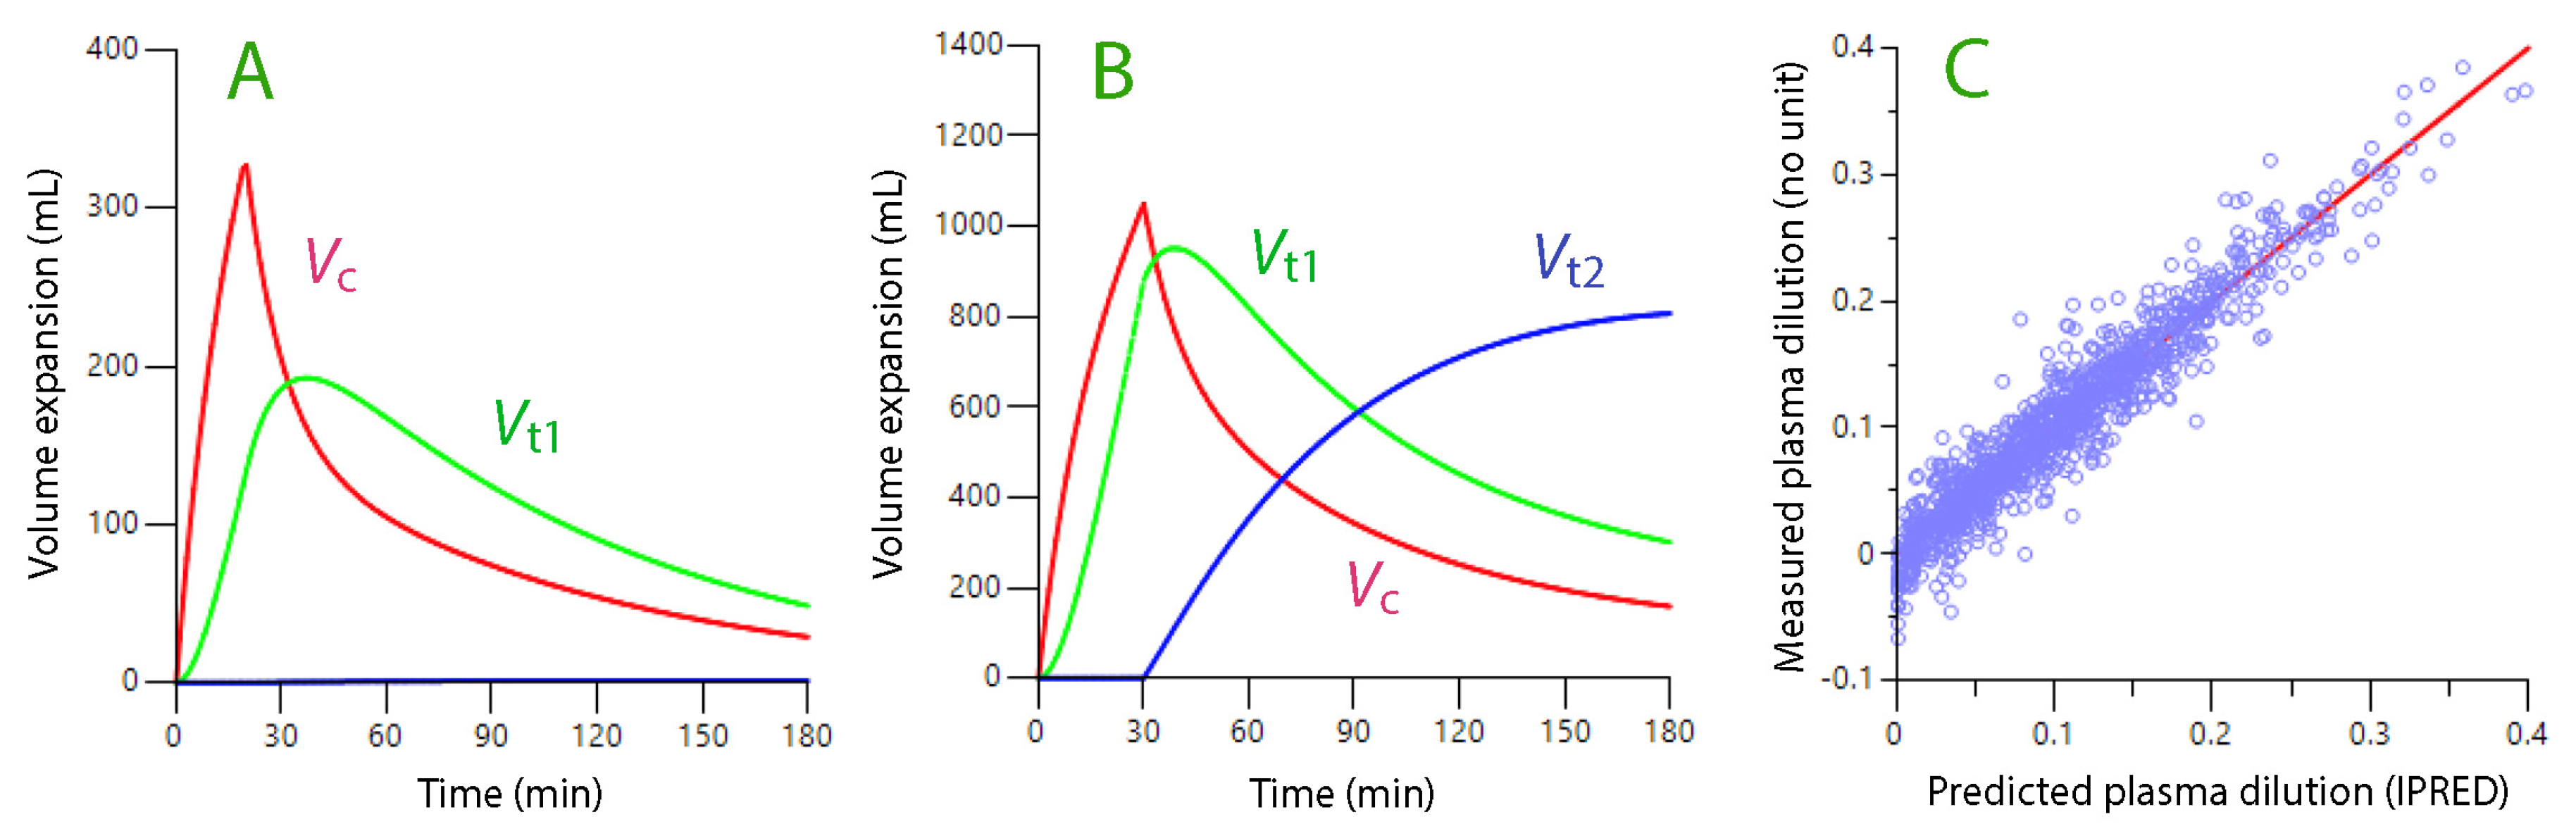
4. Crystalloid Fluid Model

Crystalloid electrolyte solutions include isotonic saline, Ringer’s lactate, Ringer’s acetate, and Plasma-Lyte. In the perioperative period, these fluids are used to compensate for anesthesia-induced vasodilatation, small-to-moderate blood loss, and urinary excretion. The full model for crystalloid fluid is composed of three compartments with expandable walls. These fluid compartments are called Vc (central, quasi-measure of the plasma volume), Vt1 (peripheral fast-exchange interstitial space), and Vt2 (slow-exchange interstitial space). The flow rates between them are governed by five rate constants (Figure 1). Each rate constant gives the flow in mL/min if multiplied by the volume expansion of the compartment from which the flow originates. The two interstitial compartments are attached to Vc in series, which means that fluid must enter Vt1 before it can reach Vt2 [9].
A recent study divided 326 infusion experiments in subgroups and explored the differences between them depending on the infused volume, infusion rate, and other factors like general anesthesia, bleeding, and inflammation [10]. The results showed that fluid compartments are recruited gradually when increasing amounts of crystalloid fluid are infused. Small volumes (250–500 mL; N = 37) distributed only in Vc, intermediate volumes (500–1000 mL; N = 23) in both Vc and Vt1, while larger volumes (>1000–2000 mL, N = 96; 2000–2700 mL; N = 38) also become distributed in Vt2. These conclusions are based on an infusion time of 15–30 min. Long infusion times (80 min; N = 17) in volunteers do not open up Vt2 for fluid accumulation because a greater proportion of the infused fluid has more time to become excreted, thereby limiting the maximum expansion of Vt1.
It seems like the degree of volume expansion of Vt1 is crucial to when Vt2 opens for fluid accumulation (Figure 2). Studies performed to date conclude that the needed expansion amounts to 600–800 mL. The opening of Vt2 is abrupt and probably corresponds to when the interstitial pressure exceeds that of the surrounding air. This view is based on laboratory studies by Guyton et al. from the 1960s, which demonstrated that a sudden increase in interstitial compliance occurs when volume expansion raises the interstitial pressure from slightly negative values to zero [11,12]. In volume kinetics, the hypothesis of pressure dependency is supported by the greater volume needed to fill Vt1 before Vt2 opens during general anesthesia (975 mL) [10]; here, the interstitial pressure starts at a lower level because general anesthesia initially redistributes fluid from Vt2 to Vc to compensate for reduced arterial pressure [13].
A good guess is that Vt2 corresponds to the interstitial gel fraction, which is known to restrict fluid movements [14,15], while Vt1 probably represents the free water fraction of the interstitial space and the lymphatics.
The half-life of a crystalloid fluid is 30–40 min if only a small amount of fluid is infused but becomes longer when Vt1 and Vt2 are also filled. The prolongation amounts to several multiples if Vt2 opens because the turnover of fluid in this compartment is very slow. The filling of this “third fluid space” probably explains why patients who receive much crystalloid fluid during major surgery can have an increased body weight for several days postoperatively [16].

5. Colloid Fluid Model

Colloid fluids are crystalloid electrolyte solutions that contain a macromolecule which binds water by its colloid osmotic pressure. Macromolecules are filtered through the capillary wall with difficulty, which gives the resulting plasma volume expansion a duration of many hours. Clinically used colloid fluids include albumin, hydroxyethyl starch, gelatine, and dextran [17]. The colloids are more expensive than crystalloid fluids, have a potential for allergic reactions, and slightly affect the blood coagulation. Therefore, they are used as second-line infusion fluids but may be preferred when the amount of infused crystalloid is so large that there is a risk for adverse effects (>3 L) [18].
The kinetics of colloid fluids is usually described according to a one-volume model. Hence, the infused fluid expands only a single fluid space (Vc), from which the elimination of the volume occurs according to a rate constant, which is the inverse of the half-life. A difference from crystalloid fluid is that the reduction in plasma volume expansion cannot be accurately predicted by the collected urine because the degradation of the macromolecules, which is a key element for maintaining the volume expansion, is a complex process. Small molecules are excreted rapidly, others are lost by capillary leakage, while large molecules undergo sequential breakdown by enzymes. As the colloid pressure depends on the number of molecules and not on their weight, the plasma oncotic pressure might increase from the enzymatic cleavage. This issue does not exist with crystalloid fluids as they lack oncotic pressure.
The colloid fluids are usually composed so that the entire volume should remain in the circulation, but this is not fully true. Albumin 5% is hypo-oncotic, and 1/5 of the fluid volume quickly leaves the bloodstream. Hydroxyethyl starch 130/0.4 (Voluven) is slightly hyper-oncotic, which balances out the increased intravascular hydrostatic pressure that develops when the fluid is infused intravenously [19]. Gelatine 4% (Gelofusine) is even a bit more hyper-oncotic and is likely to recruit 5% of its volume from the extravascular space.
The strongly hyper-oncotic albumin 20% increases to plasma volume by approximately twice the infused volume [20].
The oncotic strength of a colloid fluid can be understood from the size of Vc. If the fluid is hypo-oncotic, the size of Vc becomes larger than the expected size of the plasma volume of (perhaps) 3 L, and instead amounts to 4–5 L. Conversely, a slightly hyper-oncotic colloid fluid attracts interstitial fluid and creates a size of Vc that is smaller than the expected size of the plasma volume. However, the high oncotic pressure of albumin 20% necessitates that the fluid kinetics is handled by a special model.

6. Fifteen Issues Studied by Volume Kinetics

6.1. Why Are Anesthetized Patients Oliguric?

Oliguria frequently occurs during general anesthesia and surgery. Various hormones have been suggested to be the cause of the low urine output, but volume kinetics analyses show that most of the decrease can be explained by the anesthesia-induced reduction in the mean arterial pressure (MAP). The exponential relationship between MAP and urine output is steep for crystalloid fluid, but less steep than for albumin 20% which is even more effective as a diuretic at low arterial pressures [21]. The better effect of albumin 20% at low MAPs is probably due to better blood rheology resulting from maintained plasma viscosity [22,23].

6.2. Urine Creatinine and Urine Output

Concentrated urine before surgery, i.e., high urine osmolality and a high concentration of creatinine, is a sign of the low habitual ingestion of water [24]. This impairs the urine output resulting from volume loading with the Ringer solution [25] and albumin 20% [20]. Hence, the kidneys require time to adjust from being set to conserve water to excrete water, which is a process that probably involves a decrease in the plasma vasopressin concentration [26]. The strength and time frame of the adjustment can be quantified using volume kinetics.

6.3. Oncotic Fluid Withdrawal by Albumin 20%

The so-called “revised Starling mechanism” was popularized 15 years ago and included the “no absorption rule” which implies that hyper-oncotic fluids cannot withdraw extravascular fluid and is, therefore, pointless to give [27]. However, volume kinetic studies show that albumin 20% does recruit fluid (Figure 3) and that it primarily occurs by the lymphatic route [28]. Several studies show that the plasma volume increases approximately twice as much as the infused volume. The urine output is markedly increased as well [20,21].

6.4. Capillary Filtration Is Increased During Anesthesia

Cardiac output and MAP decrease during general anesthesia. The slow flow in the macro-circulation suggests that the flows in the low-pressure circulation (interstitial fluid and the lymphatics) would be slow, too. However, volume kinetic analysis shows that the opposite is the case [32]. Possible explanations include that relaxation of the pre-capillary sphincters increase the capillary hydrostatic pressure and that impairment of the adrenergic system opens more capillaries for exchange of water and solutes with the interstitial fluid space.

6.5. Inhibitory Effect of General Anesthetics

Experimental laboratory studies show that both intravenous and inhalational anesthetic agents (propofol, isoflurane, sevoflurane) inhibit lymphatic pumping [33,34,35]. It has long been unknown if this is the case also in clinical patients. However, volume kinetic analysis has quantified these effects during ongoing surgery to be −49% for propofol, −62% for sevoflurane, and −69% for isoflurane [36]. This inhibition promotes edema during general anesthesia [37]. It also implies that autonomous restoration of hypovolemia operates poorly during anesthesia [36] as capillary refill mainly occurs by increased lymphatic flow [38].

6.6. Capillary Filtration in Spinal Anesthesia

The arterial blood Hb concentration was measured along with venous blood in both the arm and the femoral area. The analysis showed that the systemic reduction of MAP occurring during spinal anesthesia decreases the capillary filtration, although only half as much in the anesthetized region [39]. Hence, the filtration decreased most in the arm vein, which is subject to compensatory vasoconstriction.

6.7. Fluid Distribution in Pre-Eclampsia

Toxicosis in pregnancy is a serious disorder of pregnancy that is characterized by hypertension, hypovolemia, peripheral edema, and hypoalbuminemia. The maldistribution of fluid is usually believed to be due to an increased capillary leakage of fluid, but volume kinetics shows that the immediate cause of the development of edema is due to poor return of fluid from the interstitial space to the plasma (i.e., low k21, slow lymphatic flow) [40]. Simulations performed later show the that all clinical signs listed above, except hypertension, can be explained by the low k21 [37]. The mechanism for the poor return flow is probably a reduction in the interstitial pressure by fibroblast–matrix interactions due to the presence of vasoactive molecules [41,42].

6.8. Adrenergic Effect on the Kidneys

Animal studies show that alpha1-receptors increase urine output, while beta1-receptors decrease it [43]. An attempt was made to increase urine output during gynecological surgery by a continuous infusion of low doses of phenylephrine (an alpha1-stimulating drug, 0.01 µg/kg/min) and esmolol (a beta1-blocking drug, 50 µg/kg/min). The purpose was to keep the dose so low that the arterial pressure would not be markedly increased. The results show that the low urine output in a control group of 20 women was doubled in those who received phenylephrine or esmolol [44]. However, one question remained: was this a direct effect on the kidneys or was it, after all, mediated by the rise in MAP induced by these drugs (“pressure diuresis”)? A secondary volume kinetic analysis challenged these options in a scenario session, where the drug effect can be compared to an effect of MAP. This showed that MAP was the main factor, and that a direct effect of the drug is likely to add only a small change, if any (Table 1).

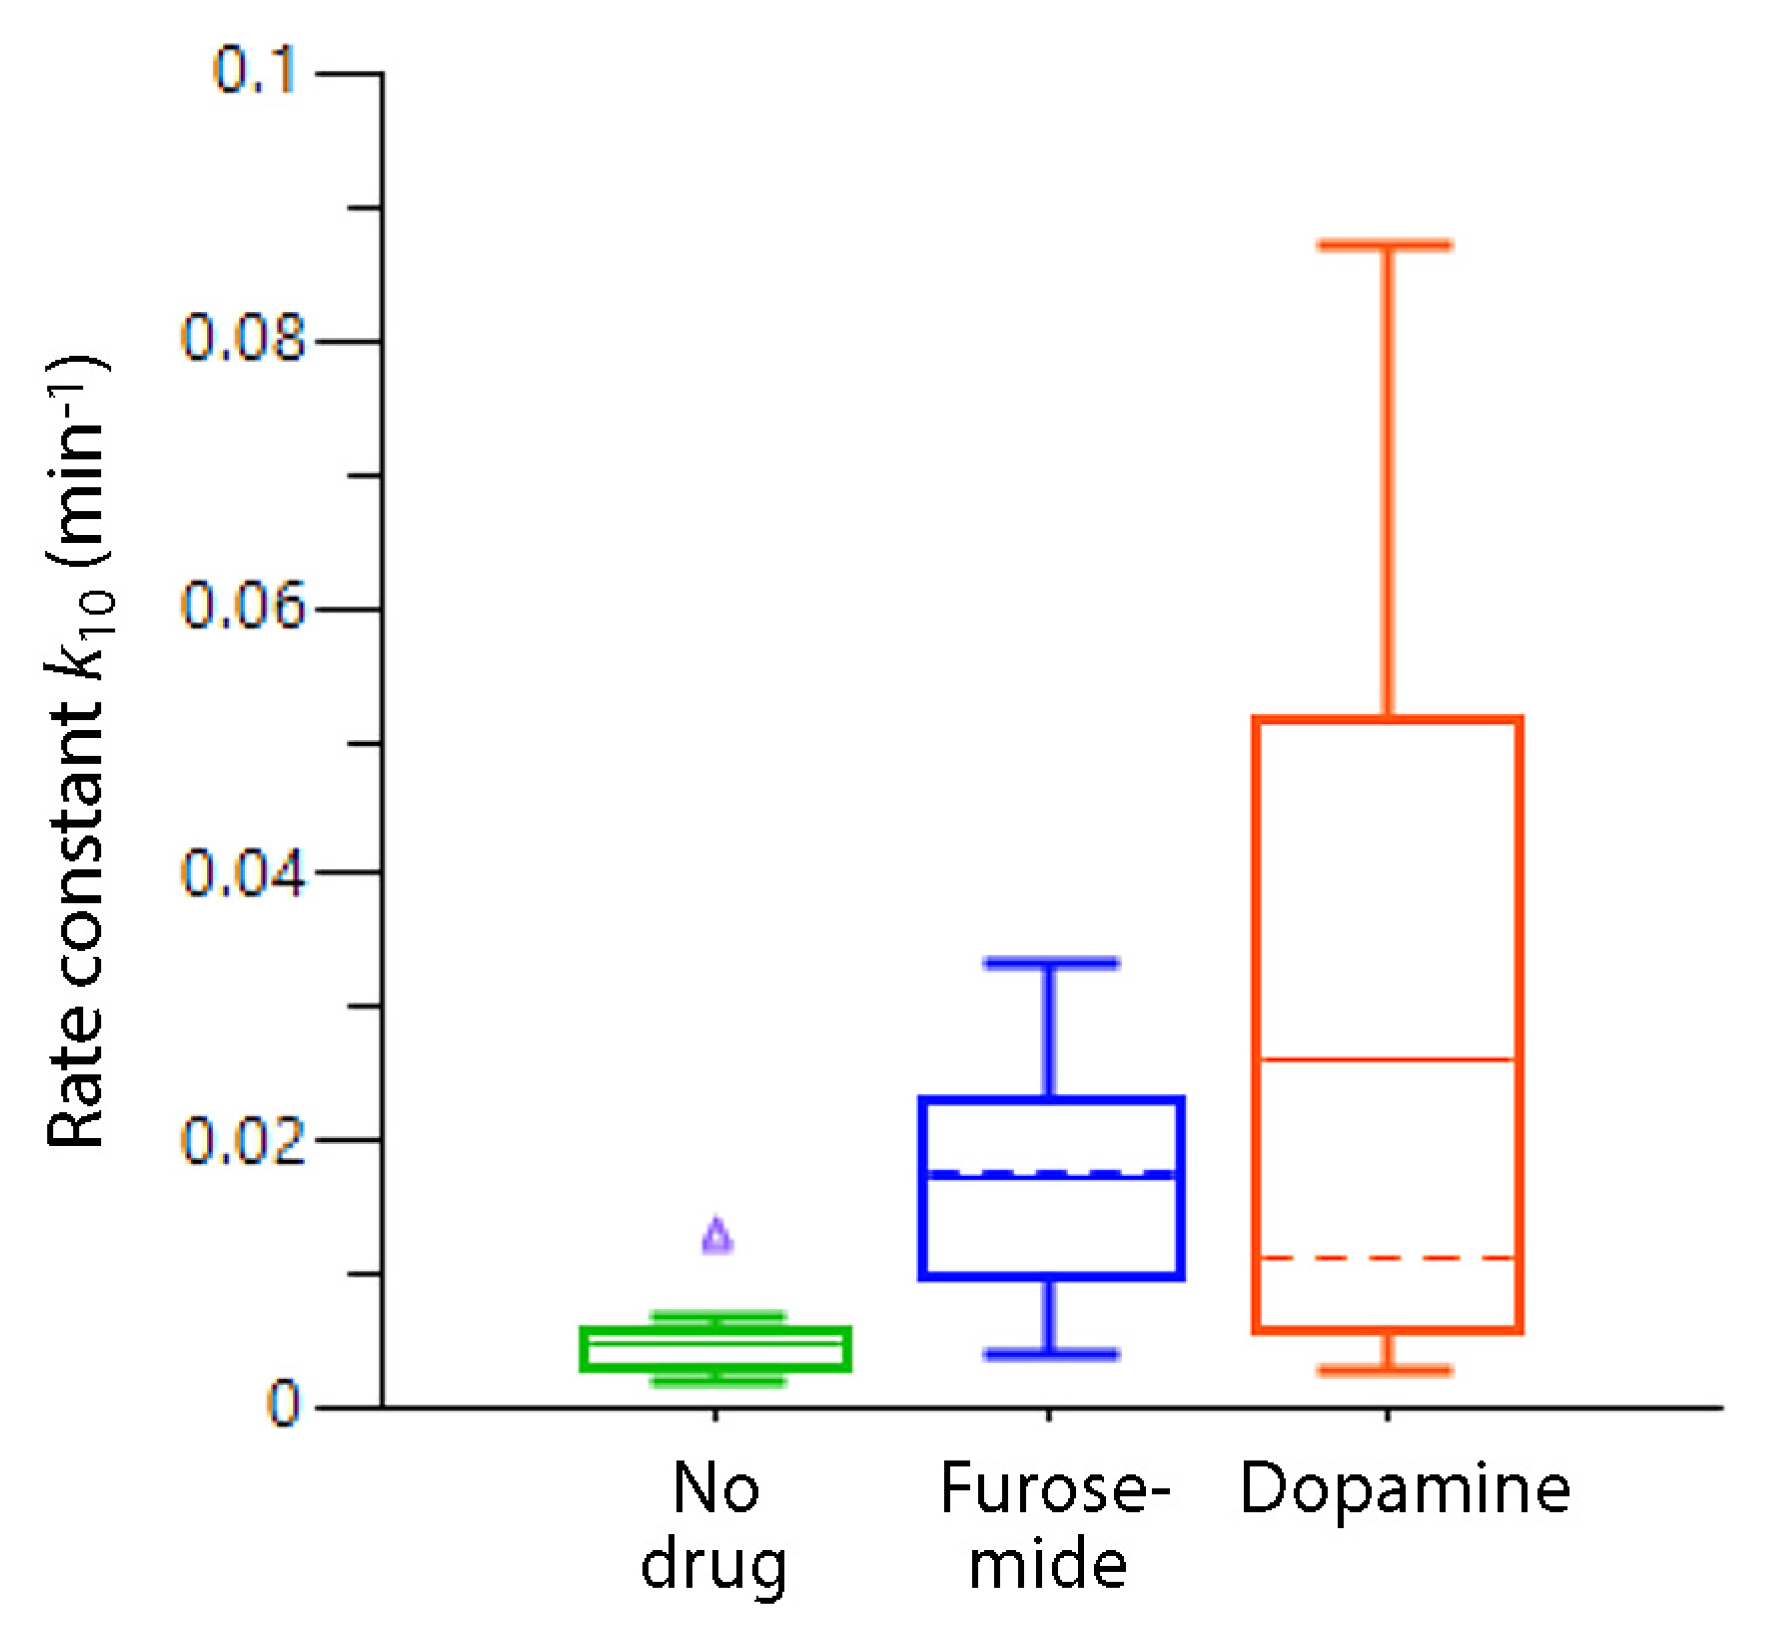
6.9. Dopamine as a Diuretic During Surgery

Women undergoing gynecological surgery received placebo, furosemide 1 mg/kg/h, or dopamine 2 µg/kg/h during laparoscopic gynecological surgery (each group N = 12). Both drugs increased the excretion of an ongoing volume load with crystalloid fluid but the response to dopamine was more variable (Figure 4). Interestingly, there was an inverse correlation between plasma aldosterone and k23, which is the rate constant for the filling of Vt2.

6.10. Dehydration and Blood Loss

Experiments were performed in volunteers dehydrated with furosemide (1.7 L). Volunteers in another group were made hypovolemic by withdrawal of blood (0.45 and 0.9 L). Kinetic analysis showed that dehydration modestly decreased urine output and increased the return flow from the interstitium to the plasma (k21). Hemorrhage also decreased urine output and Vc but, surprisingly, increased the flow of fluid through the interstitium, i.e., acted on both k12 and k21 [45].

6.11. Plasma Volume Oscillations

Fourier analysis of the Hb measurements used for volume kinetic analysis frequently shows oscillations with a period of approximately 1 h. The amplitudes may amount to as much as 240 mL, which is large enough to confound hemodynamic measurements. Volume kinetic analysis showed that the oscillations correlate with fast passage through the interstitial fluid space and that they are probably due to lymphatic bursts [46].

6.12. Redistribution of Fluid

Volume kinetic analysis performed on data collected during the early parts of surgery typically yields a Vc that is markedly smaller than the estimated size of the plasma volume. A comparison between the dilution of Hb and plasma albumin, which indicates the balance between capillary filtration and lymphatic flow, shows that the low Vc is due to volume equilibration between the plasma and the interstitial space that occurs in response to anesthesia-induced reduction in MAP. The redistributed volume to the plasma that is due to the change in MAP is within the range of 300 mL [13].

6.13. Volume Kinetics and the Glycocalyx

The current view of the microcirculation holds that the glycocalyx layer on the luminal side of the capillaries maintains the plasma inside the bloodstream; injury to this layer, which raises the plasma concentration of syndecan-1 molecules, increases the capillary leakage and would theoretically cause hypovolemia [27]. Contrary to this view, volume kinetic studies disclose an inverse correlation between syndecan-1 and capillary leakage after an infusion of Ringer [25] and albumin 20% [29,47].

6.14. Females Excrete Fluid Efficiently

An analysis of 111 volunteers, of whom 44 were females, showed that females have a faster elimination of the infused Ringer solution than males [48]. Volume kinetics offers the most scientific measure of “diuretic response”, as the rate parameter k10 is free from between-subject differences in body weight, infused volume, and variations in plasma volume expansion.

6.15. How Much Water Is Present in the Glycocalyx?

The water content of the glycocalyx is believed to become released when this layer is injured in traumatic situations, whereby the circulating plasma volume is markedly increased [27]. Using tracers, the amount of “hidden” plasma has been found to be 0.7 L [49] and 1.7 L [50], but these used methodologies have been questioned [51]. Volume kinetic analysis suggests that the glycocalyx layer is hydrated to the same degree as the plasma when crystalloid fluid is infused, and that its volume in an adult amount to 0.43 L or 0.51 L, depending on how the cohort for the volume kinetic analysis is selected [52].

7. Discussion

Volume kinetics is a whole-body approach that separates the compartments by a time delays interpreted as fictitious “walls”. These time delays are often discussed in quasi-physiological terms, although they may or may not correspond to known physiological entities. Although there are exceptions [13], the size of the central fluid space usually correlates closely with the plasma volume [52] and the flow pattern in the thoracic duct agrees well with what is found in volume kinetics [53]. A benefit compared to radioisotope tracers is that dynamic events can be studied and simulated, and that the data is obtained with minimal invasiveness.
Volume kinetics has been used to characterize the distribution and elimination of all commercially available infusion fluids. As shown above, many works have also focused on the physiological adaptation to general anesthesia and how the hemodynamics can be supported by volume therapy in that setting. Another field that has been explored is fluid physiology, i.e., how the body fluid spaces are filled when the plasma volume is expanded.
Volume kinetics has the potential to disclose the level of the disturbance in diseases characterized by the maldistribution of fluid [40]. This possibility has been poorly utilized so far, and the reasons are mainly ethical concerns and limited availability of sick patients. A volume kinetic study of untreated hypertension would be of great interest. Moreover, no study so far has included patients treated in an intensive care unit.
Limitations of previous works include that certain settings should ideally have been studied for a longer period than 5–6 h. This would be needed for adequately capturing k32 over time when large crystalloid volumes are infused [9,10] and when the central volume expansion is quantified during experiments with hyper-oncotic albumin [20,21]. However, longer experiments are difficult to perform on volunteers due to the need to ingest food and water, which confuses the results. Surgeries with an operating time exceeding 6 h without confounding large-scale hemorrhage are hard to find, although it is technically possible to distinguish between the intra- and postoperative periods by covariate analysis [54].
When surgery is studied, operations with minor hemorrhage have been chosen. The bled volume can be considered in the kinetic analysis, but major bleeding might be associated with switches between hyper- and hypovolemia, which is not currently modeled. If this occurs, the mass balance approach is recommended as an alternative method to handle the collected data [55].
Another limitation is that the “therapeutic window” for infusion fluids might not be consistent in a population, as it depends on the pre-infusion hydration status. This is a concern in acute surgery and intensive care.

8. Conclusions

Volume kinetics is method for quantifying the distribution and elimination of infusion fluids that is based on a serial analysis of blood dilution resulting from by intravenous volume loading. The method has existed for 30 years and has been proven useful for studies of fluid turnover in volunteers and anesthetized patients. The method has also been used to answer physiological questions in living humans that are sometimes possible to study only in highly controlled laboratory settings.

9. Future Directions

Possibilities with volume kinetics include the simulation of fluid programs that create steady-state situations regarding plasma volume expansion, and strategies to accurately compensate for various kinds of fluid losses can be formulated. A calculator for the dosing of fluid aimed for goal-directed fluid therapy during surgery will be marketed. The need for such a calculator is highlighted by volume kinetics which show that the amount of fluid that should be administered to obtain a pre-specified increase in blood volume during surgery is dependent on several factors, including previously administered fluid. Volume kinetics is the only method that can make such predictions.

Funding

There were no specific fundings for this manuscript.

Acknowledgments

The author is grateful to many collaborators who helped to collect the data in the original studies.

Conflicts of Interest

R.G.H. received a grant from Grifols for studies on 20% albumin.

Abbreviations

Hbhemoglobin
MAPmean arterial pressure
Vccentral fluid space
Vt1fast-exchange interstitial fluid space
Vt2slow-exchange interstitial fluid space
k10rate constant for urine output

References

  1. Owen, J.S.; Fiedler-Kelly, J. Introduction to Population Pharmacokinetic/Pharmacodynamic Analysis with Nonlinear Mixed Effects Models; Wiley & Sons: Hoboken, NJ, USA, 2014. [Google Scholar]
  2. Hahn, R.G. Early detection of the TUR syndrome by marking the irrigating fluid with 1% ethanol. Acta Anaesthesiol. Scand. 1989, 33, 146–151. [Google Scholar] [CrossRef] [PubMed]
  3. Jones, A.W.; Hahn, R.G.; Stalberg, H.P. Distribution of ethanol and water between plasma and whole-blood; inter- and intra-subject variations after administration of ethanol by intravenous infusion. Scand. J. Clin. Lab. Investig. 1990, 50, 775–780. [Google Scholar] [CrossRef]
  4. Hahn, R.G.; Drobin, D. Volume kinetics of Ringer’s acetate in human volunteers. Acta Anaesthesiol. Scand. 1995, 39 (Suppl. S105), 155. [Google Scholar]
  5. Hahn, R.G.; Drobin, D.; Ståhle, L. Volume kinetics of Ringer’s solution in female volunteers. Br. J. Anaesth. 1997, 78, 144–148. [Google Scholar] [CrossRef] [PubMed]
  6. Hahn, R.G. Volume kinetics for infusion fluids (review). Anesthesiology 2010, 113, 470–481. [Google Scholar] [CrossRef]
  7. Yi, J.M.; Bang, J.Y.; Choi, B.; Cho, C.; Lee, Y.H.; Lee, E.K.; Choi, B.M.; Noh, G.J. Population-based volume kinetics of crystalloids and colloids in healthy volunteers. Sci. Rep. 2019, 9, 18638. [Google Scholar] [CrossRef]
  8. Lee, J.H.; Choo, Y.J.; Lee, Y.H.; Rhim, J.H.; Lee, S.H.; Choi, B.M.; Oh, S.T.; Choi, K.T.; Noh, G.J. Population-based volume kinetics of Ringer’s lactate solution in patients undergoing open gastrectomy. Acta Pharmacol. Sin. 2019, 40, 710–716. [Google Scholar] [CrossRef]
  9. Hahn, R.G. Evidence of serial connection between the plasma volume and two interstitial fluid compartments. Microvasc. Res. 2023, 151, 104599. [Google Scholar] [CrossRef]
  10. Hahn, R.G. Sequential recruitment of body fluid spaces for increasing volumes of crystalloid fluid. Front. Physiol. 2024, 15, 1439035. [Google Scholar] [CrossRef]
  11. Guyton, A.C.; Scheel, K.; Murphree, D. Interstitial fluid pressure. 3. Its effect on resistance to tissue fluid mobility. Circ. Res. 1966, 19, 412–419. [Google Scholar] [CrossRef]
  12. Guyton, A.C.; Granger, H.J.; Taylor, A.E. Interstitial fluid pressure. Physiol. Rev. 1971, 51, 527–563. [Google Scholar] [CrossRef] [PubMed]
  13. Hahn, R.G. Accelerated lymph flow from infusion of crystalloid fluid during general anesthesia. BMC Anesthesiol. 2024, 24, 119. [Google Scholar] [CrossRef] [PubMed]
  14. Haljamäe, H. Anatomy of the interstitial tissue. Lymphology 1978, 11, 128–132. [Google Scholar] [PubMed]
  15. Aukland, K.; Reed, R.K. Interstitial-lymphatic mechanisms in the control of extracellular fluid volume. Physiol. Rev. 1993, 73, 1–78. [Google Scholar] [CrossRef]
  16. Cihoric, M.; Kehlet, H.; Højlund, J.; Lauritsen, M.L.; Kanstrup, K.; Foss, N.B. Perioperative changes in fluid distribution and haemodynamics in acute high-risk abdominal surgery. Crit. Care 2023, 27, 20. [Google Scholar] [CrossRef]
  17. Hahn, R.G. Colloid fluids. In Hemodynamic Monitoring and Fluid Therapy During Surgery; Joosten, A., Cannesson, M., Hahn, R.G., Eds.; Cambridge University Press: Cambridge, UK, 2024; pp. 87–95. [Google Scholar]
  18. Joosten, A.; Delaporte, A.; Ickx, B.; Touihri, K.; Stany, I.; Barvais, L.; Van Obbergh, L.; Loi, P.; Rinehart, J.; Cannesson, M.; et al. Crystalloid versus colloid for intraoperative goal-directed fluid therapy using a closed-loop system: A randomized, double-blinded, controlled trial in major abdominal surgery. Anesthesiology 2018, 128, 55–66. [Google Scholar] [CrossRef]
  19. Hahn, R.G.; Bergek, C.; Gebäck, T.; Zdolsek, J. Interactions between the volume effects of hydroxyethyl starch 130/0.4 and Ringer’s acetate. Crit. Care 2013, 17, R104. [Google Scholar] [CrossRef]
  20. Zdolsek, M.; Sjöberg, F.; Hahn, R.G. Fast versus slow infusion of 20% albumin; a randomized controlled cross-over trial in volunteers. Intensive Care Med. Exp. 2022, 10, 31. [Google Scholar] [CrossRef]
  21. Hahn, R.G.; Zdolsek, M.; Gunnström, M.; Hasselgren, E.; Zdolsek, J.H. Diuretic responses to Ringer’s solution and 20% albumin at different arterial pressures. Physiol Rep. 2024, 12, e70069. [Google Scholar] [CrossRef]
  22. de Wit, C.; Schäfer, C.; von Bismarck, P.; Bolz, S.S.; Pohl, U. Elevation of plasma viscosity induces sustained NO-mediated dilation in the hamster cremaster microcirculation in vivo. Pflug. Arch. 1997, 434, 354–361. [Google Scholar] [CrossRef]
  23. Cabrales, P.; Tsai, A.G.; Martini, J.; Intaglietta, M. The role of plasma viscosity. In Hemodynamic Monitoring and Fluid Therapy During Surgery; Joosten, A., Cannesson, M., Hahn, R.G., Eds.; Cambridge University Press: Cambridge, UK, 2024; pp. 98–104. [Google Scholar]
  24. Hahn, R.G. Effects of diet, habitual water intake and increased hydration on body fluid volumes and urinary analysis of renal fluid retention in healthy volunteers. Eur. J. Nutr. 2021, 60, 691–702. [Google Scholar] [PubMed]
  25. Hahn, R.G. Renal water conservation and the volume kinetics of fluid-induced diuresis; a retrospective analysis of two cohorts of elderly men. Clin. Exp. Pharm. Physiol. 2021, 48, 310–317. [Google Scholar]
  26. Armstrong, L.E.; Muñoz, C.X.; Armstrong, E.M. Distinguishing low and high water consumers—A paradigm of disease risk. Nutrients 2020, 12, 858. [Google Scholar] [CrossRef] [PubMed]
  27. Woodcock, T.E.; Woodcock, T.M. Revised Starling equation and the glycocalyx model of transvascular fluid exchange: An improved paradigm for prescribing intravenous fluid therapy. Br. J. Anaesth. 2012, 108, 384–394. [Google Scholar] [PubMed]
  28. Zdolsek, J.H.; Zdolsek, M.; Hahn, R.G. Recruitment of efferent lymph during infusion of 20% albumin. Microvasc. Res. 2023, 148, 104539. [Google Scholar]
  29. Hahn, R.G.; Zdolsek, M.; Krizhanovskii, C.; Ntika, S.; Zdolsek, J. Elevated plasma concentrations of syndecan-1 do not correlate with the capillary leakage of 20% albumin. Anesth. Analg. 2021, 132, 856–865. [Google Scholar]
  30. Hasselgren, E.; Zdolsek, M.; Zdolsek, J.H.; Björne, H.; Krizhanovskii, C.; Ntika, S.; Hahn, R.G. Long intravascular persistence of 20% albumin in postoperative patients. Anesth. Analg. 2019, 129, 1232–1239. [Google Scholar]
  31. Gunnström, M.; Zdolsek, J.; Hahn, R.G. Plasma volume expansion and fluid kinetics of 20% albumin during general anesthesia and surgery lasting for more than 5 hours. Anesth. Analg. 2022, 134, 1270–1279. [Google Scholar]
  32. Hahn, R.G. Capillary filtration of plasma is accelerated during general anesthesia: A secondary volume kinetic analysis. J. Clin. Pharmacol. 2025. [Google Scholar] [CrossRef]
  33. McHale, N.G.; Thornbury, K.D. The effects of anesthetics on lymphatic contractility. Microvasc. Res. 1989, 37, 70–76. [Google Scholar]
  34. Hattori, J.I.; Yamakage, M.; Seki, S.; Okazaki, K.; Namiki, A. Inhibitory effects of the anesthetics propofol and sevoflurane on spontaneous lymphatic vessel activity. Anesthesiology 2004, 101, 687–694. [Google Scholar] [PubMed]
  35. Bachmann, S.B.; Proulx, S.T.; He, Y.; Ries, M.; Detmar, M. Differential effects of anesthesia on the contractility of lymphatic vessels in vivo. J. Physiol. 2019, 597, 2841–2852. [Google Scholar] [PubMed]
  36. Dull, R.O.; Hahn, R.G.; Dull, G.E. Anesthesia-induced lymphatic dysfunction (review). Anesthesiology 2024, 141, 175–187. [Google Scholar] [PubMed]
  37. Dull, R.O.; Hahn, R.G. Hypovolemia with peripheral edema: What is wrong? Crit. Care 2023, 27, 206. [Google Scholar]
  38. Hahn, R.G. Interstitial washdown during crystalloid loading in graded hypovolemia. Clin. Hemorheol. Microcirc. 2023, 83, 105–116. [Google Scholar]
  39. Hahn, R.G.; Drobin, D. Model-predicted capillary leakage in graded hypotension; extended analysis of experimental spinal anesthesia. Acta Anaesthesiol. Scand. 2021, 65, 1313–1319. [Google Scholar] [CrossRef]
  40. Hahn, R.G. Maldistribution of fluid in preeclampsia; a retrospective kinetic analysis. Int. J. Obstet. Anesth. 2024, 57, 103963. [Google Scholar]
  41. Wiig, H.; Rubin, K.; Reed, R.K. New and active role of the interstitium in control of interstitial fluid pressure: Potential therapeutic consequences. Acta Anaesthesiol. Scand. 2003, 47, 111–121. [Google Scholar]
  42. Reed, R.K.; Rubin, K. Transcapillary exchange: Role and importance of the interstitial fluid pressure and the extracellular matrix. Cardiovasc. Res. 2010, 87, 211–217. [Google Scholar] [CrossRef]
  43. Vane, L.A.; Prough, D.S.; Kinsky, M.A.; Williams, C.A.; Grady, J.J.; Kramer, G.C. Effects of different catecholamines on dynamics and volume kinetics of crystalloid infusion. Anesthesiology 2004, 101, 1136–1144. [Google Scholar] [CrossRef]
  44. Li, Y.; Zhu, H.B.; Zheng, X.; Chen, H.J.; Shao, L.; Hahn, R.G. Low doses of esmolol and phenylephrine act as diuretics during intravenous anesthesia. Crit. Care 2012, 16, R18. [Google Scholar] [CrossRef] [PubMed]
  45. Hahn, R.G.; Drobin, D.; Li, Y.; Zdolsek, J. Kinetics of Ringer’s solution in extracellular dehydration and hemorrhage. Shock 2020, 53, 566–573. [Google Scholar] [PubMed]
  46. Hahn, R.G. Plasma volume oscillations during fluid therapy in humans. J. Vasc. Res. 2024, 61, 16–25. [Google Scholar]
  47. Dull, R.O.; Hahn, R.G. The glycocalyx as a permeability barrier; basic science and clinical evidence. Crit. Care 2022, 26, 273. [Google Scholar] [PubMed]
  48. Hahn, R.G. The elimination half-life of crystalloid fluid is shorter in female than in male volunteers; a retrospective population kinetic analysis. Biol. Sex Differ. 2016, 7, 54. [Google Scholar] [CrossRef]
  49. Rehm, M.; Haller, M.; Orth, V.; Kreimeier, U.; Jacob, M.; Dressel, H.; Mayer, S.; Brechtelsbauer, H.; Finsterer, U. Changes in blood volume and hematocrit during acute perioperative volume loading with 5% albumin or 6% hetastarch solutions in patients before radical hysterectomy. Anesthesiology 2001, 95, 849–856. [Google Scholar]
  50. Nieuwdorp, M.; van Haeften, T.W.; Gouverneur, M.C.L.G.; Mooij, H.L.; van Lieshout, M.H.P.; Levi, M.; Meijers, J.C.M.; Holleman, F.; Hoekstra, J.B.L.; Vink, H.; et al. Loss of endothelial glycocalyx during acute hyperglycemia coincides with endothelial dysfunction and coagulation activation in vivo. Diabetes 2006, 55, 480–486. [Google Scholar]
  51. Michel, C.C.; Curry, F.E. Glycocalyx volume measurements: A critical review of tracer dilution methods for its measurement. Microcirculation 2009, 16, 213–219. [Google Scholar]
  52. Hahn, R.G. Water content of the endothelial glycocalyx layer estimated by volume kinetic analysis. Intensive Care Med. Exp. 2020, 8, 29. [Google Scholar]
  53. Brace, R.A.; Power, G.G. Effects of hypotonic, isotonic and hypertonic fluids on thoracic duct lymph flow. Am. J. Physiol. 1983, 45, R785–R791. [Google Scholar]
  54. Hahn, R.G.; Olsson, J. Diuretic response to Ringer’s solution is normal shortly after awakening from general anaesthesia: A retrospective kinetic analysis. BJA Open 2022, 2, 100013. [Google Scholar] [PubMed]
  55. Jardot, F.; Hahn, R.G.; Engel, D.; Beilstein, C.; Wuethrich, P.Y. Blood volume and hemodynamics during treatment of major hemorrhage with Ringer solution, 5% albumin, and 20% albumin: A single-center randomized controlled trial. Crit. Care 2024, 28, 39. [Google Scholar] [PubMed]
Figure 1. The kinetic model used to analyze the distribution of crystalloid fluids.
Fluids 10 00086 g001
Figure 2. (A) Distribution of 575 mL of Ringer’s acetate when infused over 20 min in volunteers based on kinetics obtained from infusion volumes between 300 and 1000 mL. Here, the amount of infused fluid is not enough to open the Vt2 or the “third fluid space”. (B) Distribution of 2175 mL of Ringer’s acetate when infused over 20 min in volunteers based on kinetics obtained from infusion volumes of between 2 and 2.7 L. Here, the amount of infused fluid is enough to open Vt2 (the “third fluid space”). The difference in scale from subplot A should be noted. (C) Relationship between measured plasma dilution and the model-predicted expansion of Vc when the infused volume of Ringer’s solution varied between 2 and 2.7 L. Unity is indicated by the red line.
Fluids 10 00086 g002
Figure 3. Oncotic-driven withdrawal of volume from the extravascular space in response to an intravenous infusion of 3 mL/kg of albumin 20% over 30 min in various cohorts, each consisting of 15 subjects. The decrease, long after the infusion is completed, is explained by stimulated urine flow which concentrated the plasma and then perpetuated the fluid withdrawal (based on data taken from [29,30,31]).
Fluids 10 00086 g003
Figure 4. Box-plots showing the distribution of the rate constant governing urine output, k10, in the three groups of women undergoing laparoscopic gynecological surgery. Two drugs that increased urine output where compared; furosemide 1 mg/kg/h, or dopamine 2 µg/kg/h.
Fluids 10 00086 g004
Table 1. Scenario session aimed to determine whether the increase in urine flow on infusion of a low dose of phenylephrine and esmolol during gynecologic laparoscopic surgery is a direct effect of the drugs on the kidney or caused indirectly by the drug-induced increase in the mean arterial pressure (MAP). For this purpose, various combinations of the body weight, drug, and MAP were examined as potential covariates to the urine flow (k10 in the model). Greater decreases in the statistical tool values are evidence of a better overall curve fit of the kinetic model. Hence, the preferred explanation is that MAP served as the main factor and that the direct effects of the drug played a minor role, if any. Data from reference [44].
Model−2 log LikelihoodAkaike Criterion
Base model−2940−2920
+ body weight (BW)−2959−2937
+ drug−2951−2927
+ MAP−2989−2967
+ BW + MAP−3009−2985
+ drug + MAP−2994−2968
+ BW + MAP + drug−3014−2986
Disclaimer/Publisher’s Note: The statements, opinions and data contained in all publications are solely those of the individual author(s) and contributor(s) and not of MDPI and/or the editor(s). MDPI and/or the editor(s) disclaim responsibility for any injury to people or property resulting from any ideas, methods, instructions or products referred to in the content.

