Article

Hydrodynamic Resistance Analysis of Large Biomimetic Yellow Croaker Model: Effects of Shape, Body Length, and Material Based on CFD

School of Fisheries, Zhejiang Ocean University, Zhoushan 316000, China
*
Author to whom correspondence should be addressed.
Fluids 2025, 10(5), 107; https://doi.org/10.3390/fluids10050107
Submission received: 23 March 2025 / Revised: 20 April 2025 / Accepted: 21 April 2025 / Published: 24 April 2025
(This article belongs to the Section Mathematical and Computational Fluid Mechanics)

Abstract

:
The marine environment is highly complex, characterized by substantial fluctuations in flow velocity. To enhance the adaptability of robotic large yellow croakers to such conditions, this study takes into account multiple factors, including shape, dimensions, and material properties, and evaluates their hydrodynamic resistance characteristics. A 2D model of large yellow croakers aged 1, 4, 7, 10, and 12 months was established as the bionic object. Based on computational fluid dynamics, the water resistance characteristics of this model were investigated in the same water environment. A 3D model of this species based on the 2D model and three skin materials, PE, PC, and ST, was added, and the effects of these materials on the water resistance of the 3D model were investigated. It was shown that in a water environment with a current speed of 0.1~1 m/s, the water resistance of large yellow croaker models at different ages ranged from 0.1006 to 6.8485 N; that of croakers with different body lengths ranged from 0.1067 to 28.5760 N; and that of croakers with different skin materials ranged from 0.0048 to 0.8672 N. The results showed that in the water environment with a current speed of 0.1–1 m/s, the 12-month-old large yellow croaker model had a lower water resistance range of 0.1006~3.6512 N in the watershed compared with other models of the same age; the large yellow croaker models with body lengths of 20, 30, and 40 cm had a smaller range of water resistance of 0.1125~12.5110 N in the watershed compared with other models of the same body length; and large yellow croaker models made of PE had a smaller range of resistance of 0.0048~0.7523 N in the watershed compared to those made of PC and ST materials. The results of this study are important for the design and fabrication of robotic fish capable of prolonged underwater operations.

1. Introduction

The ocean is rich in resources, and the use and development of marine resources will become a focus in the future. The development of underwater robotic fish with excellent hydrodynamic characteristics is conducive to the utilization and development of marine resources [1,2,3,4]. The marine environment is characterized by substantial variations in flow rate, which present a substantial challenge to the development of robotic fish. The investigation into the water resistance of robotic fish in water and the development of low-energy swimming capabilities represent crucial bottlenecks in the manufacturing process [5,6,7]. The advent of computer science, bionics, and computational fluid dynamics has precipitated a paradigm shift in the field of fluid dynamics. Numerical simulation technology has emerged as a pivotal area of research, and this transformation has stimulated an environment conducive to the exploration of the hydrodynamics of underwater bionic machine fish [8,9,10]. Computational fluid dynamics (CFD) is the application of computer hardware and software to solve the fundamental equations of fluid mechanics. These equations are solved iteratively, and the resulting simulations provide a study of fluid motion [11,12,13,14,15]. M Rostamzadeh et al. [16,17] optimized the design of natural vortex generators (VGs) and flaps based on CFD methods and finally determined the optimal geometrical parameters of VGs and flaps. Olcay et al. [18] investigated the relationship between velocity and flow field based on the CFD method by building a three-dimensional model of the squid as an affine object. In recent years, as CFD technology has advanced, a series of research results have emerged through the use of numerical methods on robotic fish. As Barrett et al. [19] demonstrated in their experiment, the drag reduction effect of streamlined underwater machines is significantly superior to that of rotary underwater vehicles. Xiao Huapan et al. [20] investigated the design method of the streamlined shape of underwater robotic fish. They concluded that the drag characteristics of models built with semi-elliptic and parabolic streamline shapes in the plane are superior. Liu Jixin et al. [21] developed a robotic fish model that resembles a flounder (Bothidae). They concluded that the design of the fish’s body shape significantly impacts its water resistance. Ma Kaidong et al. [22] developed a 3D robotic fish model in the shape of a hammerhead shark (Sphyrnidae). Their findings indicated that this design has a superior drag performance in comparison to rotating-body underwater navigation apparatus. Tian Xiaojie et al. [23] developed a 3D robotic fish model in the shape of a tuna (Thunnus). Their findings indicated that this design could reduce the drag force in the flow field compared to a rotary-body underwater vehicle. Zhou Shuxin [24] developed a model of a carp (Cyprinus carpio), concluding that the water resistance of the head portion of the shape design had a larger effect on the water resistance of the main body. However, extant studies have only addressed the effect of the robotic fish shape on water resistance characteristics, neglecting to consider other factors, including the size and material.
Therefore, a 2D model of large yellow croakers (Larimichthys crocea) aged 1, 4, 7, 10, and 12 months was established as a bionic object. The water resistance characteristics of this model were investigated in the same water environment using computational fluid dynamics. A 3D model of large yellow croaker was also realized based on the 2D model, and three types of skin material, namely PE (polyethylene), PC (polycarbonate), and ST (structural steel), were added to study the effect of these materials on the water resistance of the 3D model, with a particular emphasis on examining the characteristics of the water resistance of the model of large yellow croakers with different ages, body lengths, and materials under the same aquatic environment. The results of this study provide a scientific basis for the design and manufacture of the shape profile of underwater robotic fish. They also play an important role in the improvement of its performance and underwater operation capability. In summary, the results of this study provide a scientific basis for the reduction in water resistance and increase in efficiency of underwater robotic fish.

2. Materials and Methods

2.1. Establishment of the Large Yellow Croaker Model

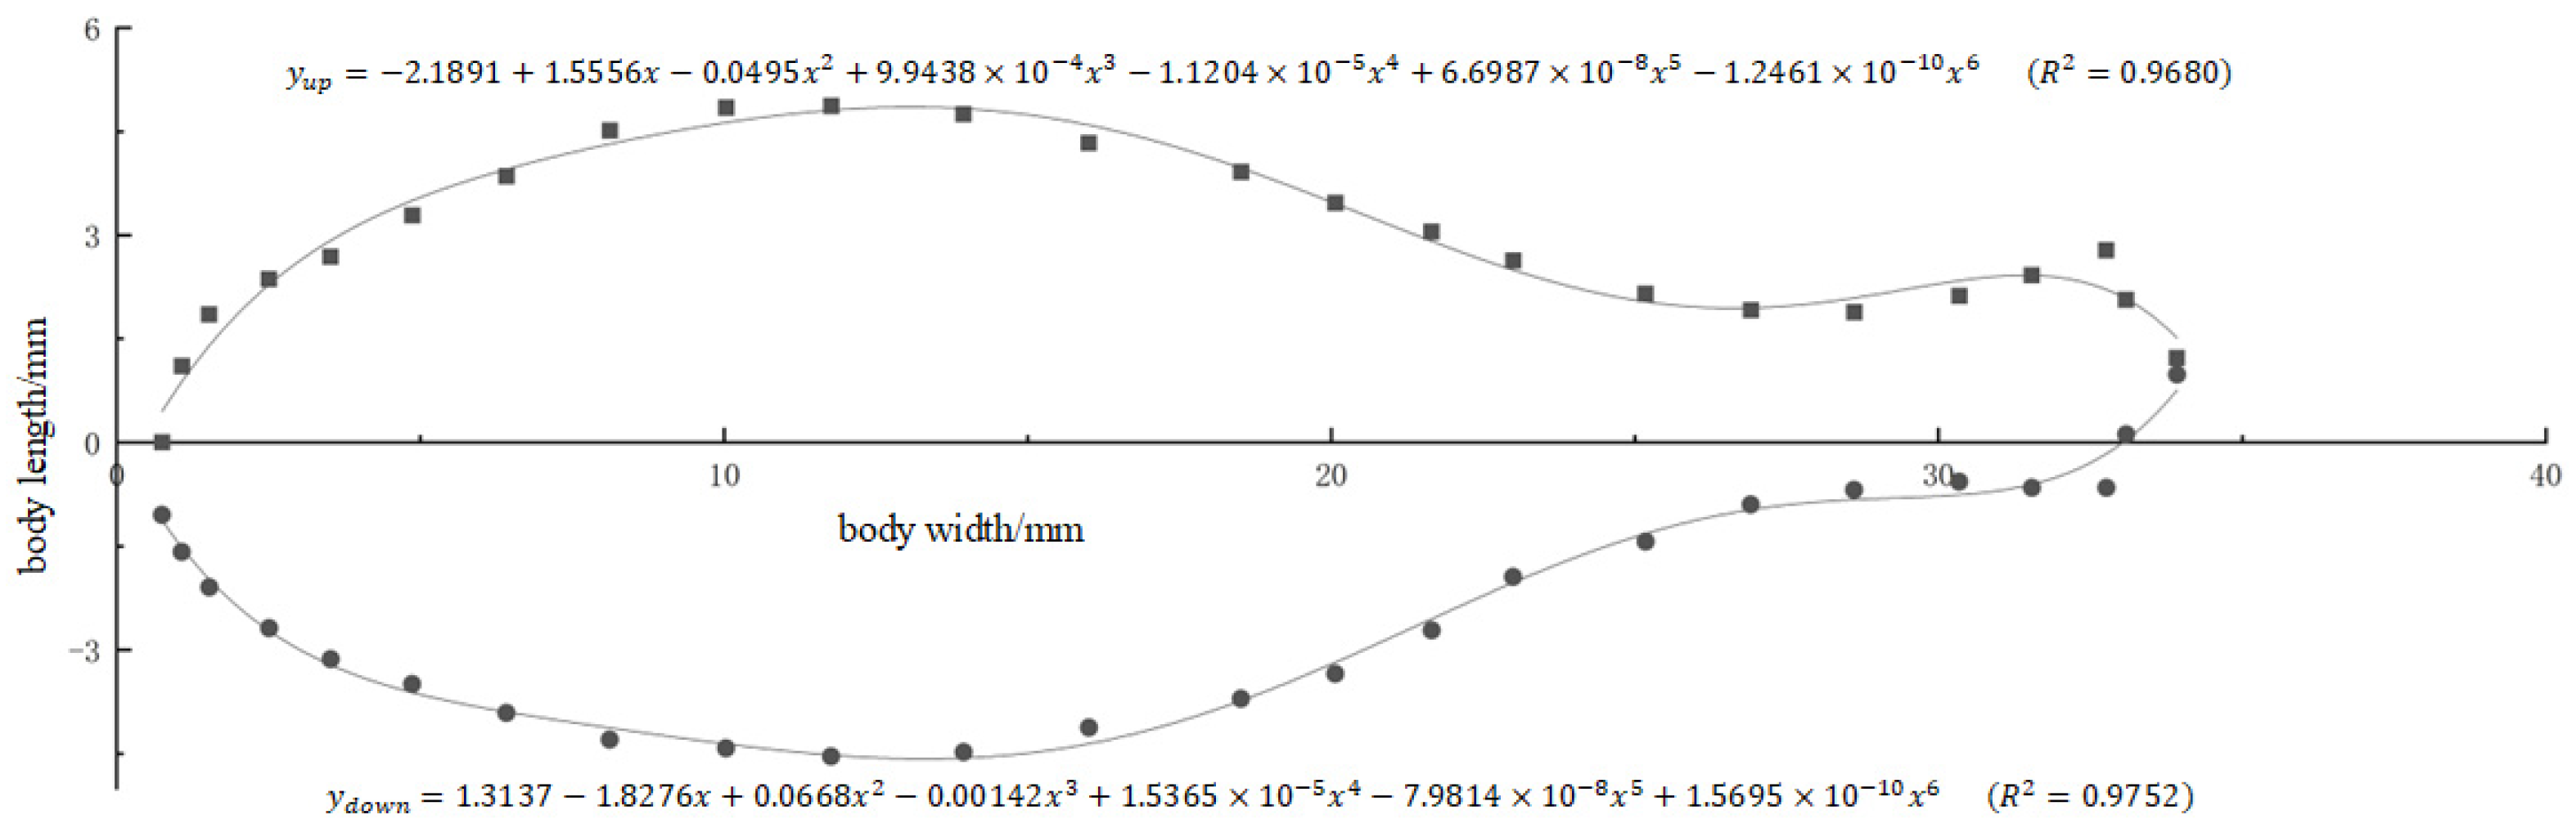
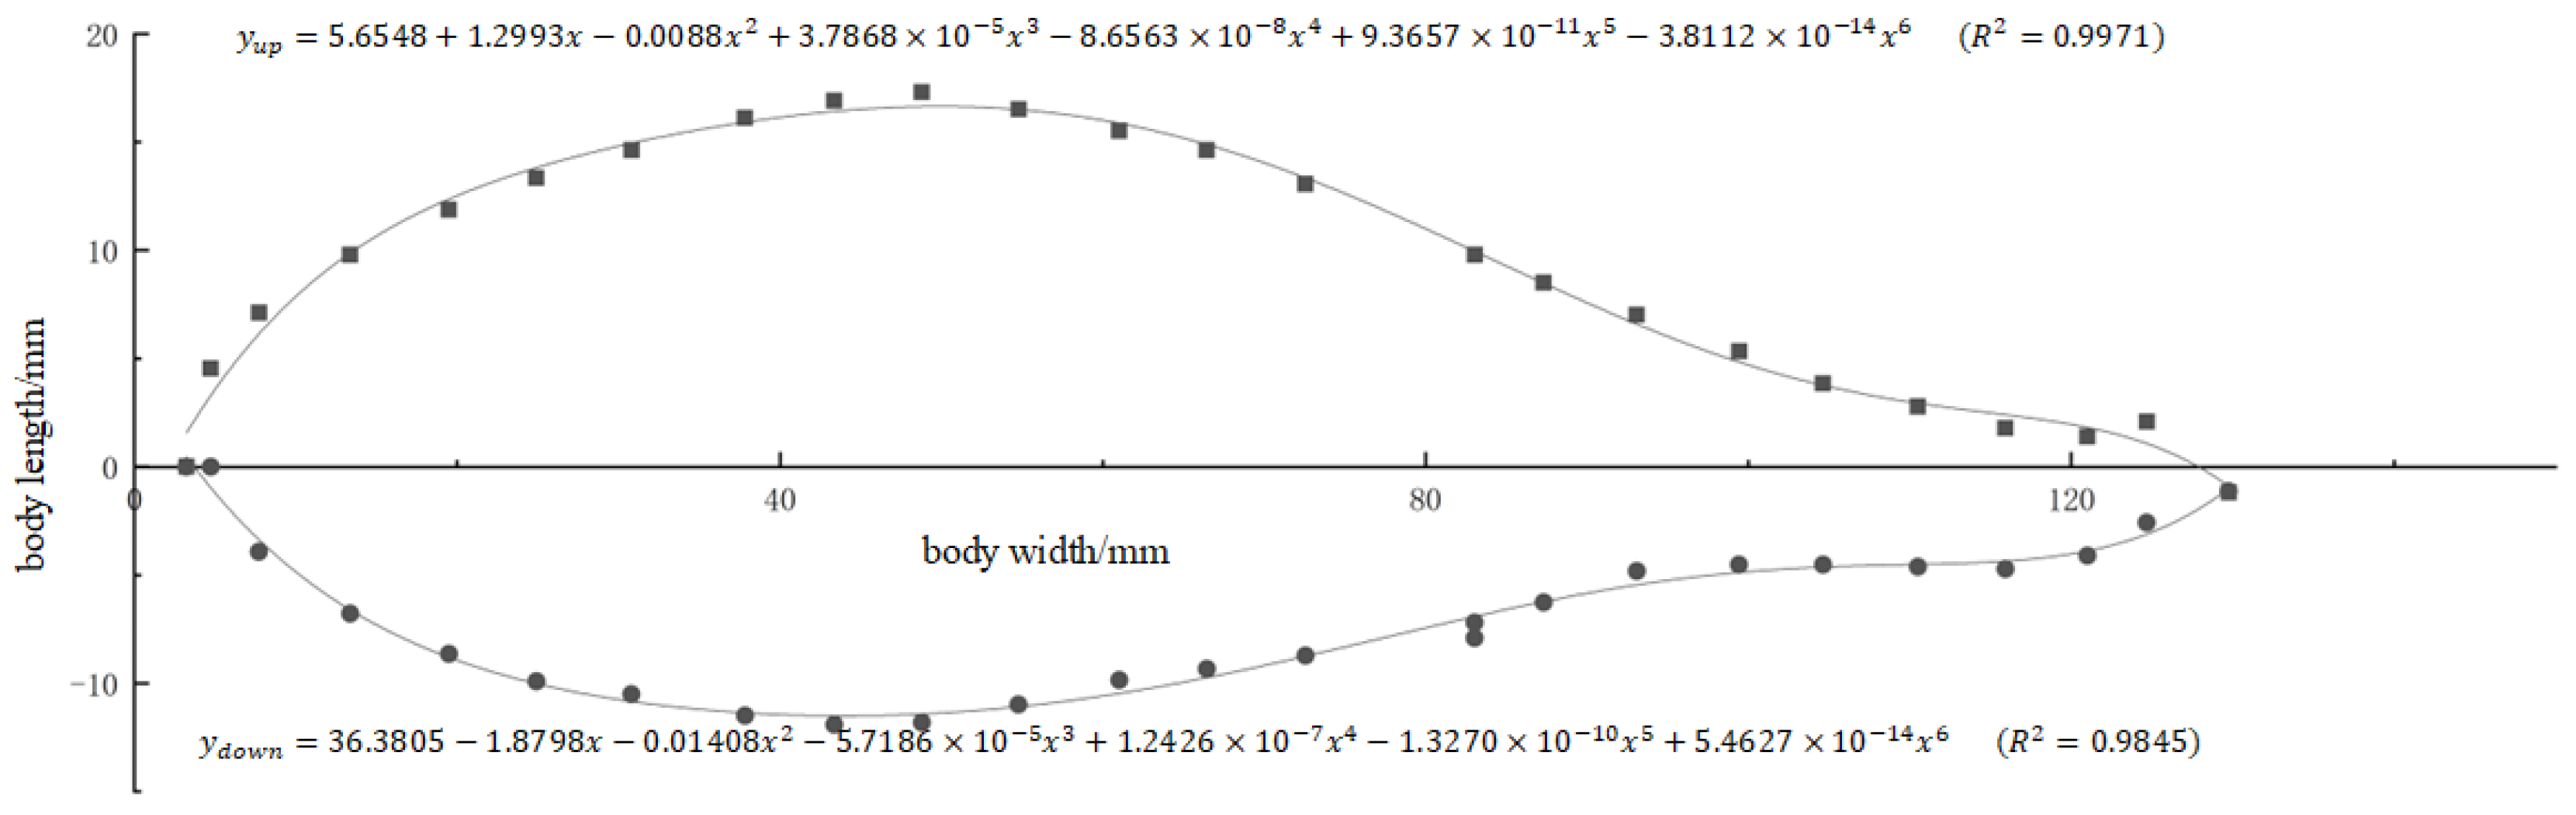
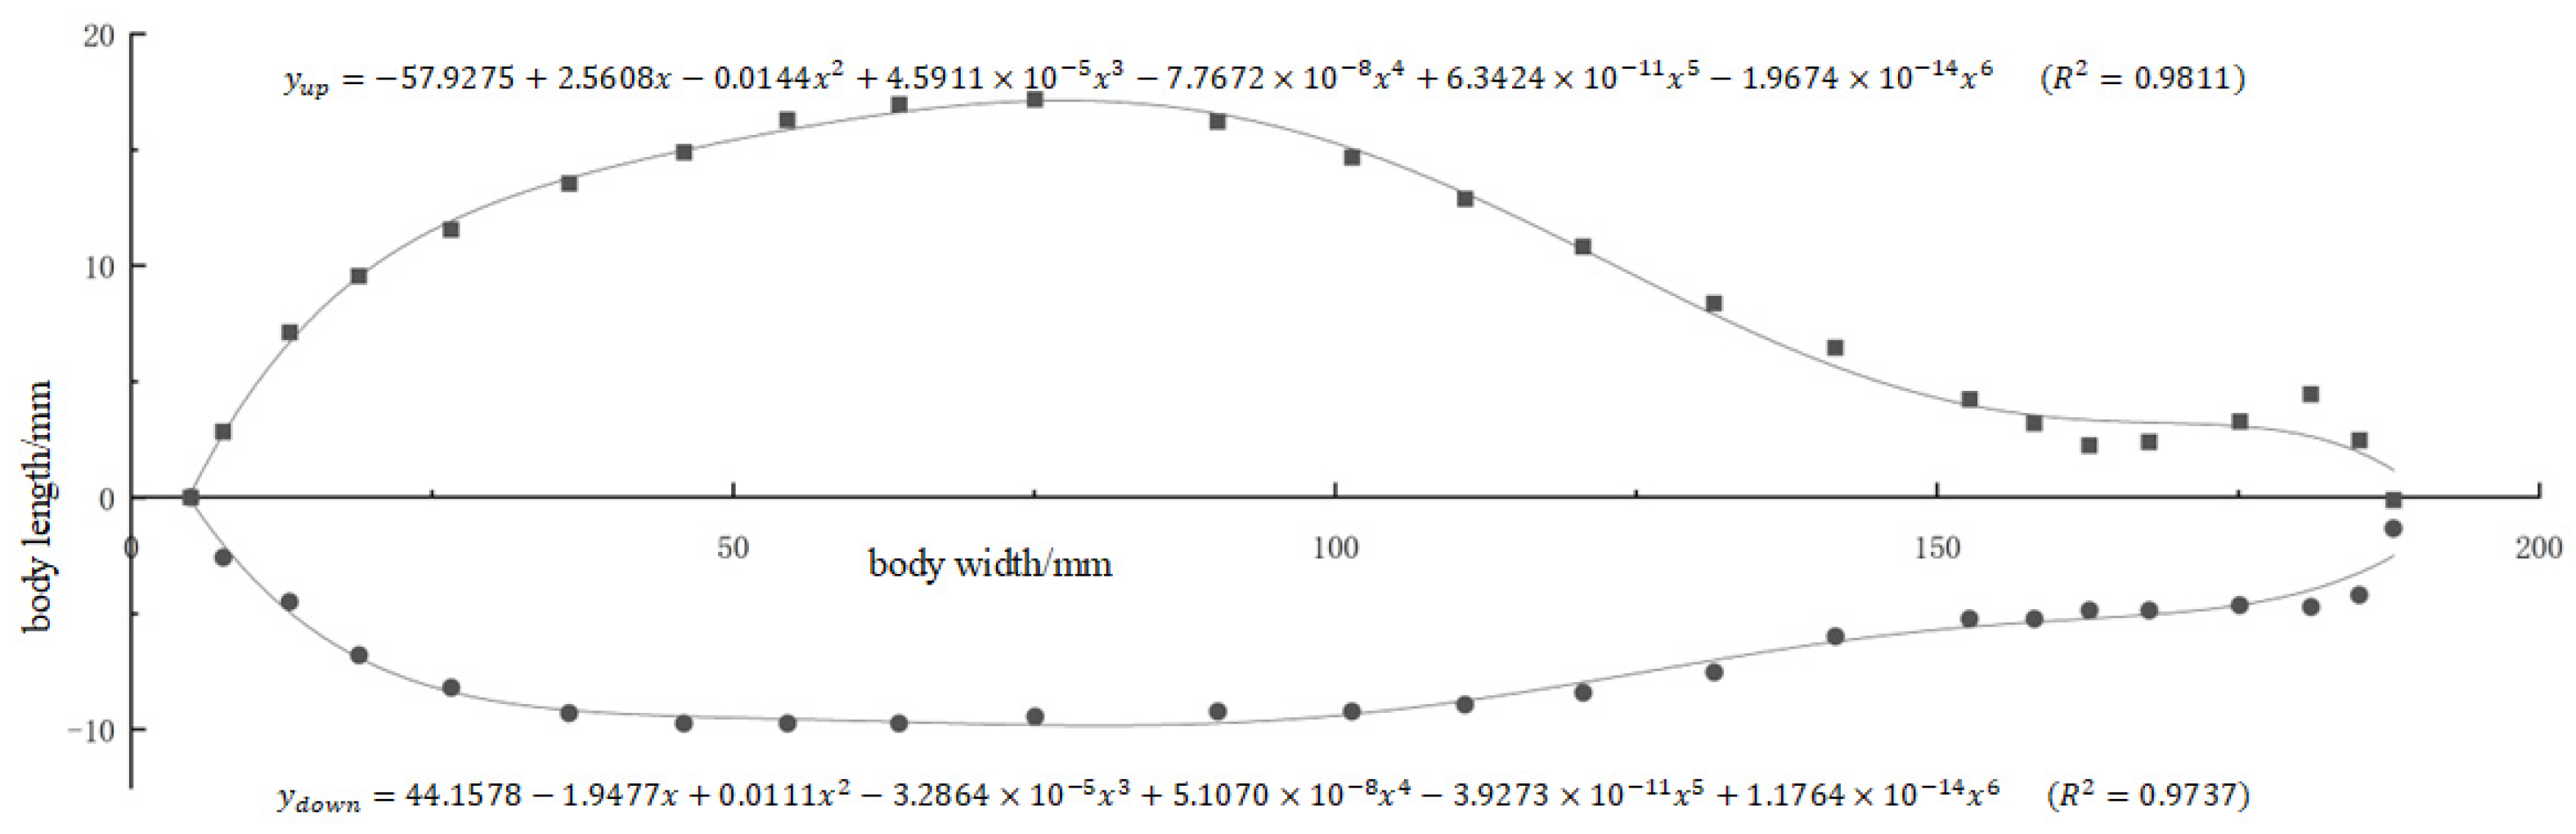
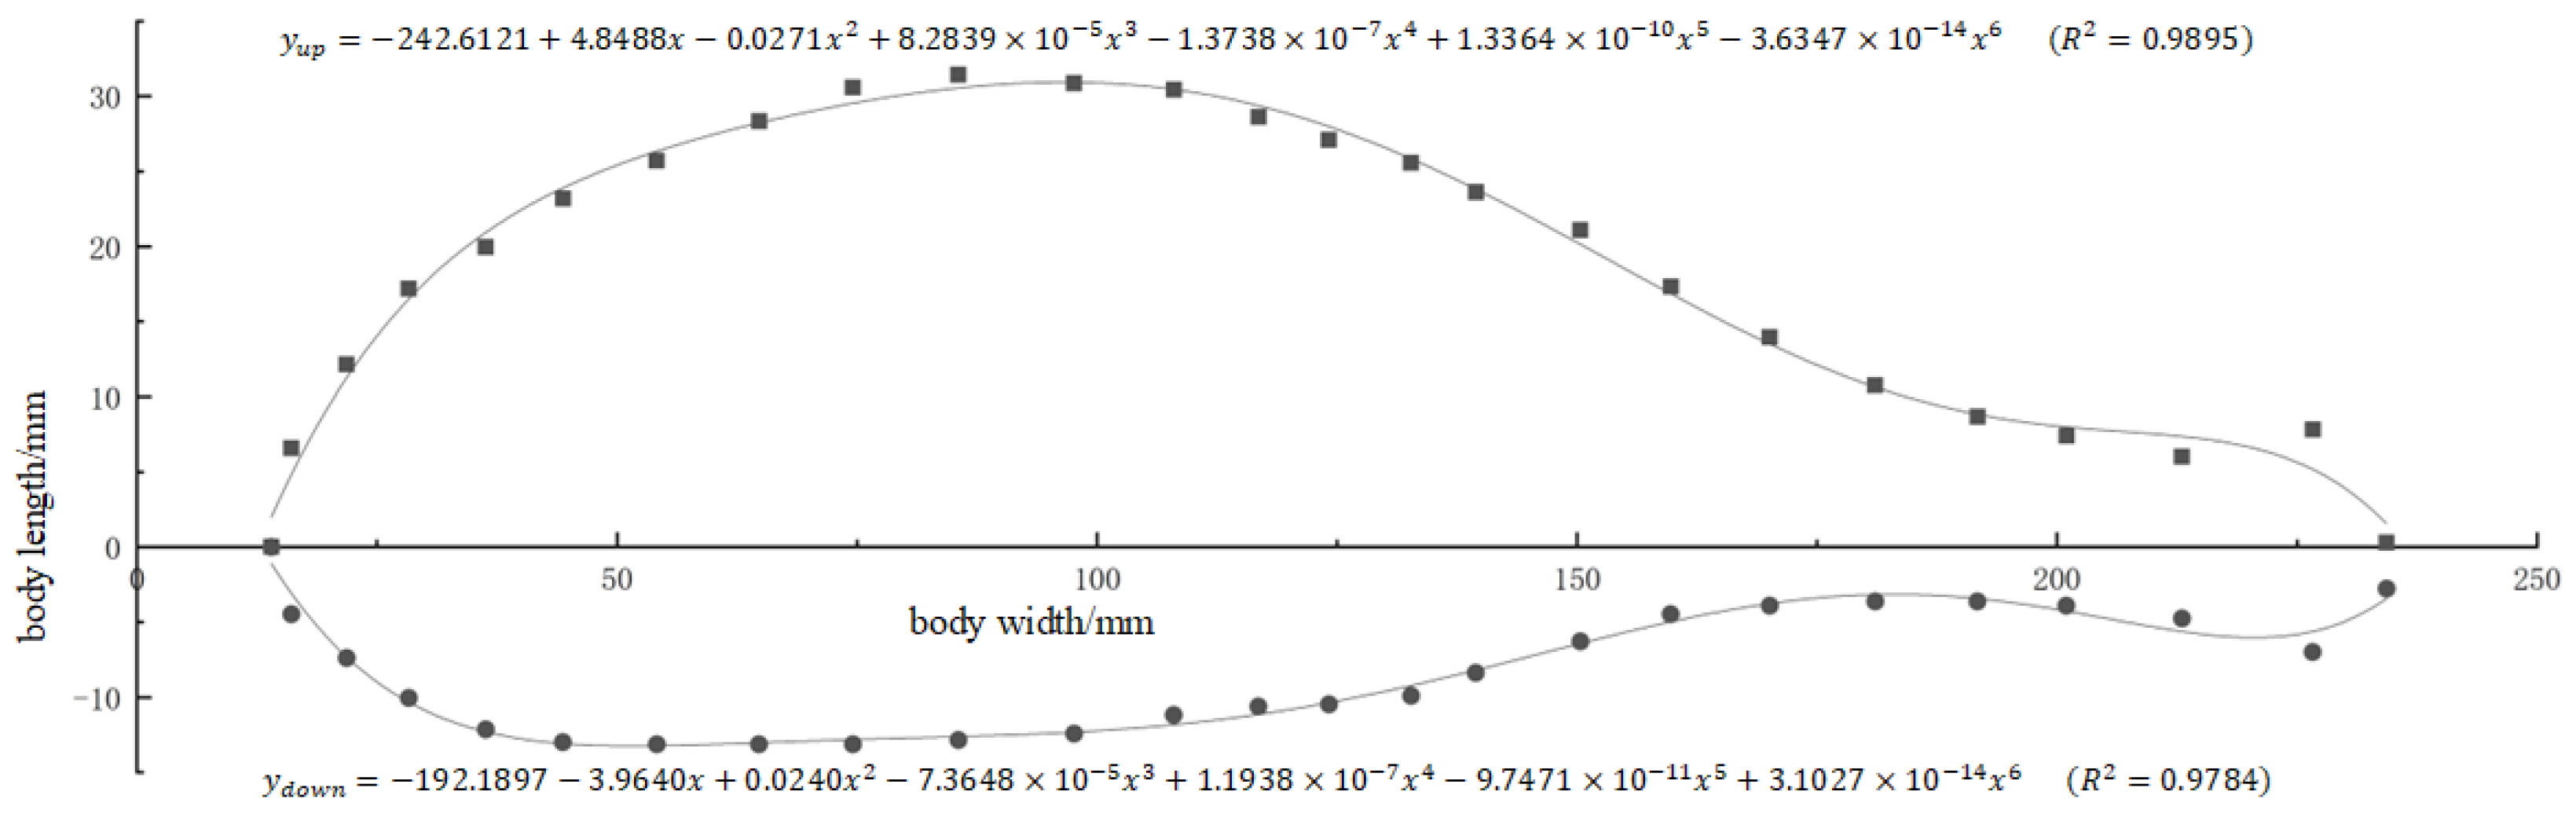
2.1.1. Model Data Processing

The data for the large yellow croaker model were obtained from the Fishery Farm Large Yellow Croaker Farming Specialized Cooperative in Xiangshan County, Zhejiang Province, China. The large yellow croakers to be measured were meticulously positioned on a standard caliper board, and a series of front- and top-view photographs were taken of 1-, 4-, 7-, 10-, and 12-month-old specimens (Figure 1).
A total of thirty specimens of large yellow croaker were selected for measurement, with each representing a distinct age category. The body length and width data were obtained using ImageJ 64, and the average body length and width of large yellow croakers at each age were calculated using the average method (Table 1). The body length of large yellow croaker was defined as the distance from the tip of the snout to the deepest point of the tail fork, while the body width was measured as the distance from the highest point to the base of the fish. The average body length and width of large yellow croakers at 1 month old were 34.8 and 9 mm, respectively; those of 4-month-old croakers were 119.7 and 25.4 mm, respectively; those of 7-month-old croakers were 181.5 and is 37 mm, respectively; those of 10-month-old croakers were 228.5 and 48.8 mm, respectively; and those of 12-month-old croakers were 290 and 72.8 mm, respectively.
The size data of large yellow croakers at different ages were utilized in Wolfram Mathematica 14 to extract the coordinates of the dorsal and ventral silhouettes. A coordinate system was established with the kissing end of the large yellow croaker as the coordinate origin, and the equation of its contour line was fitted by the least squares method as a nonlinear curve [25]. The following equations are provided for the contour lines of the dorsal and ventral regions of large yellow croaker at different ages.
The following equations delineate the dorsal and abdominal contour lines of large yellow croaker at 1 month old (Figure 2), respectively:
y u p = 2.1891 + 1.5556 x 0.0495 x 2 + 9.9438 × 10 4 x 3 1.1204 × 10 5 x 4 + 6.6987 × 10 8 x 5 1.2461 × 10 10 x 6 R 2 = 0.9680
y d o w n = 1.3137 1.8276 x + 0.0668 x 2 0.00142 x 3 + 1.5365 × 10 5 x 4 7.9814 × 10 8 x 5 + 1.5695 × 10 10 x 6 R 2 = 0.9752
where x is the coordinate of the body length direction of large yellow croaker and yup and ydown are those of the body width direction of its dorsal and abdominal contour lines, respectively.
The following equations delineate croakers at 4 months old (Figure 3), respectively:
y u p = 5.6548 + 1.2993 x 0.0088 x 2 + 3.7868 × 10 5 x 3 8.6563 × 10 8 x 4 + 9.3657 × 10 11 x 5 3.8112 × 10 14 x 6 ( R 2 = 0.9971 )
y d o w n = 36.3805 1.8798 x 0.01408 x 2 5.7186 × 10 5 x 3 + 1.2426 × 10 7 x 4 1.3270 × 10 10 x 5 + 5.4627 × 10 14 x 6 ( R 2 = 0.9845 )
The following equations delineate croakers at 7 months old (Figure 4), respectively:
y u p = 57.9275 + 2.5608 x 0.0144 x 2 + 4.5911 × 10 5 x 3 7.7672 × 10 8 x 4 + 6.3424 × 10 11 x 5 1.9674 × 10 14 x 6 ( R 2 = 0.9811 )
y d o w n = 44.1578 1.9477 x + 0.0111 x 2 3.2864 × 10 5 x 3 + 5.1070 × 10 8 x 4 3.9273 × 10 11 x 5 + 1.1764 × 10 14 x 6 R 2 = 0.973
The following equations delineate croakers at 10 months old (Figure 5), respectively:
y u p = 242.6121 + 4.8488 x 0.0271 x 2 + 8.2839 × 10 5 x 3 1.3738 × 10 7 x 4 + 1.3364 × 10 10 x 5 3.6347 × 10 14 x 6 ( R 2 = 0.9895 )
y d o w n = 192.1897 3.9640 x + 0.0240 x 2 7.3648 × 10 5 x 3 + 1.1938 × 10 7 x 4 9.7471 × 10 11 x 5 + 3.1027 × 10 14 x 6 ( R 2 = 0.9784 )
The following equations delineate croakers at 12 months old (Figure 6), respectively:
y u p = 49.5528 + 1.9689 x 0.0144 x 2 + 3.8453 × 10 5 x 3 7.0068 × 10 8 x 4 + 6.1929 × 10 11 x 5 2.0843 × 10 14 x 6 ( R 2 = 0.9919 )
y d o w n = 46.2167 1.7889 x + 0.0102 x 2 + 3.5326 × 10 5 x 3 + 6.6366 × 10 8 x 4 6.0196 × 10 11 x 5 + 2.0657 × 10 14 x 6 ( R 2 = 0.9924 )

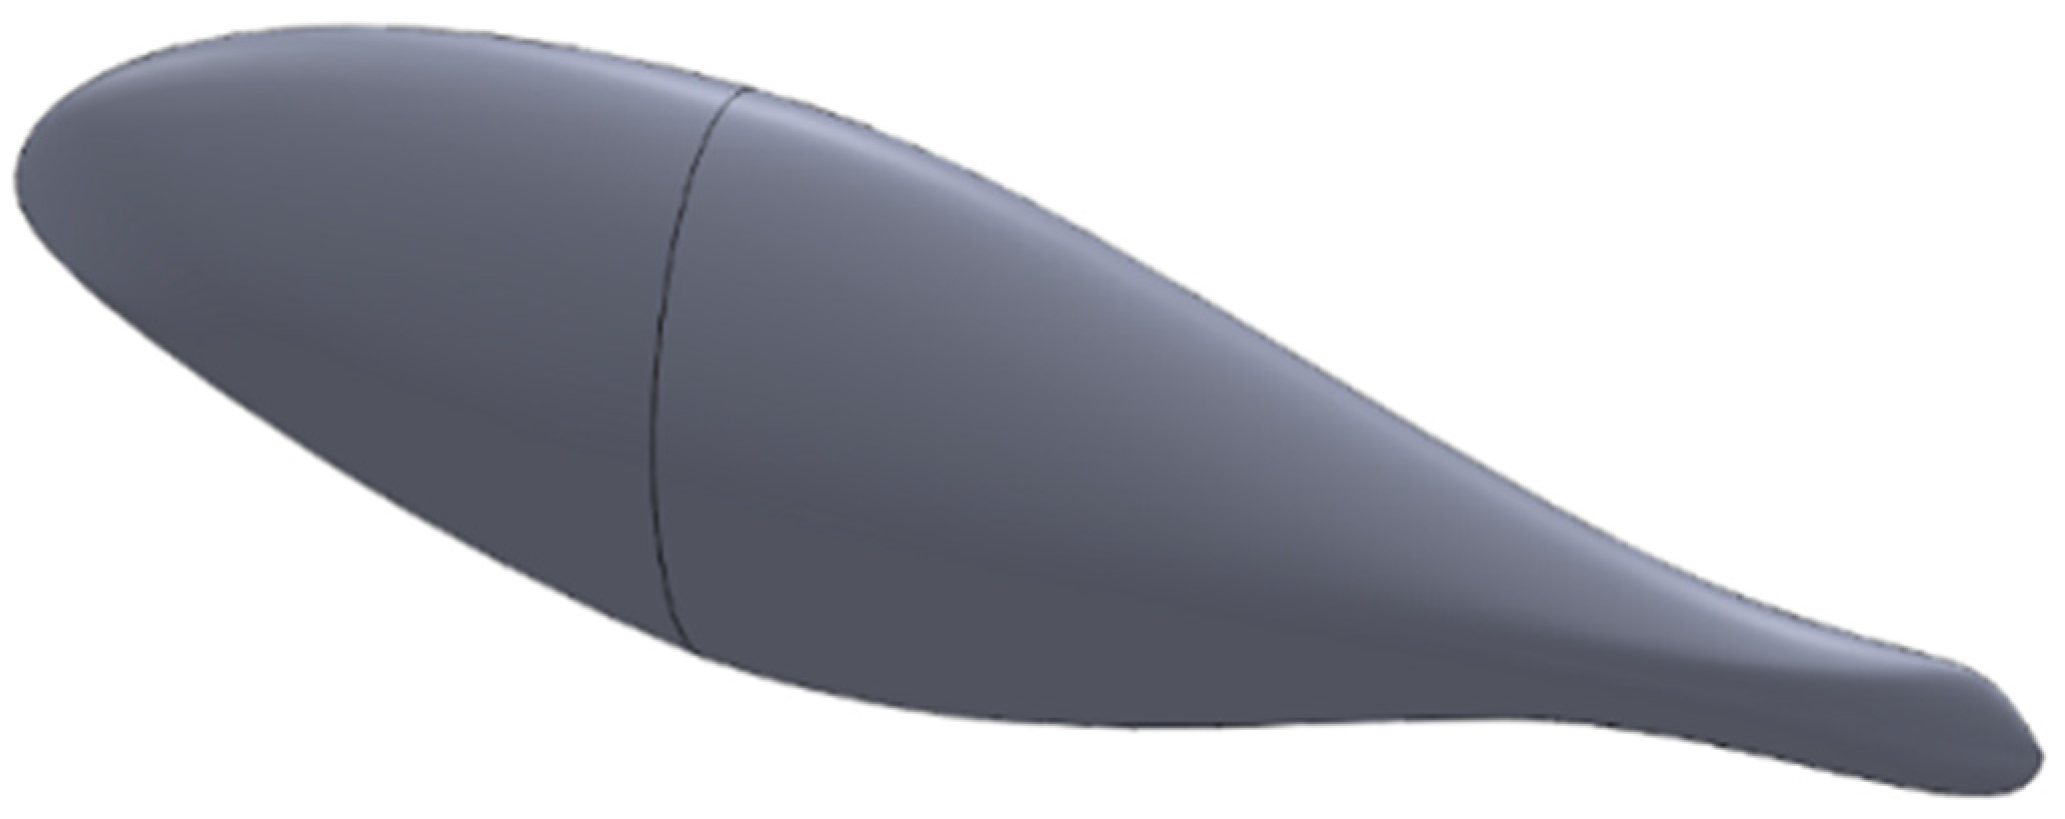
2.1.2. Establishment of the Large Yellow Croaker Model

The dorsal and abdominal contour lines of large yellow croakers at each age were plotted using the equation plotting spline curve in SOLIDWORKS 2022 software. This method involved establishing a 2D model of large yellow croaker. To assess the disparities in water resistance among models at varying ages, the body length of the established large yellow croaker model was normalized through the utilization of the scale scaling method in SOLIDWORKS 2022. Subsequently, the body length was augmented to 10 cm to re-establish the 2D model of the large yellow croaker (Figure 7).
Based on the 2D model of large yellow croaker, using the release operation of SOLIDWORKS 2022 software, the dorsal and abdominal contour lines of large yellow croaker were used as guidelines to add the lateral release curve of large yellow croaker. A 3D model of a large yellow croaker was constructed (Figure 8), and the skin material was changed using the fluid–solid coupling material changer in FLUENT, of which the Young’s moduli of PE, PC, and ST were 5 × 10⁸, 2.32 × 10⁹ and 2 × 10¹¹ Pa, respectively, while their corresponding Poisson’s ratios were 0.42, 0.3, and 0.39, respectively.

2.2. Creation of Fluid Domains and Meshes

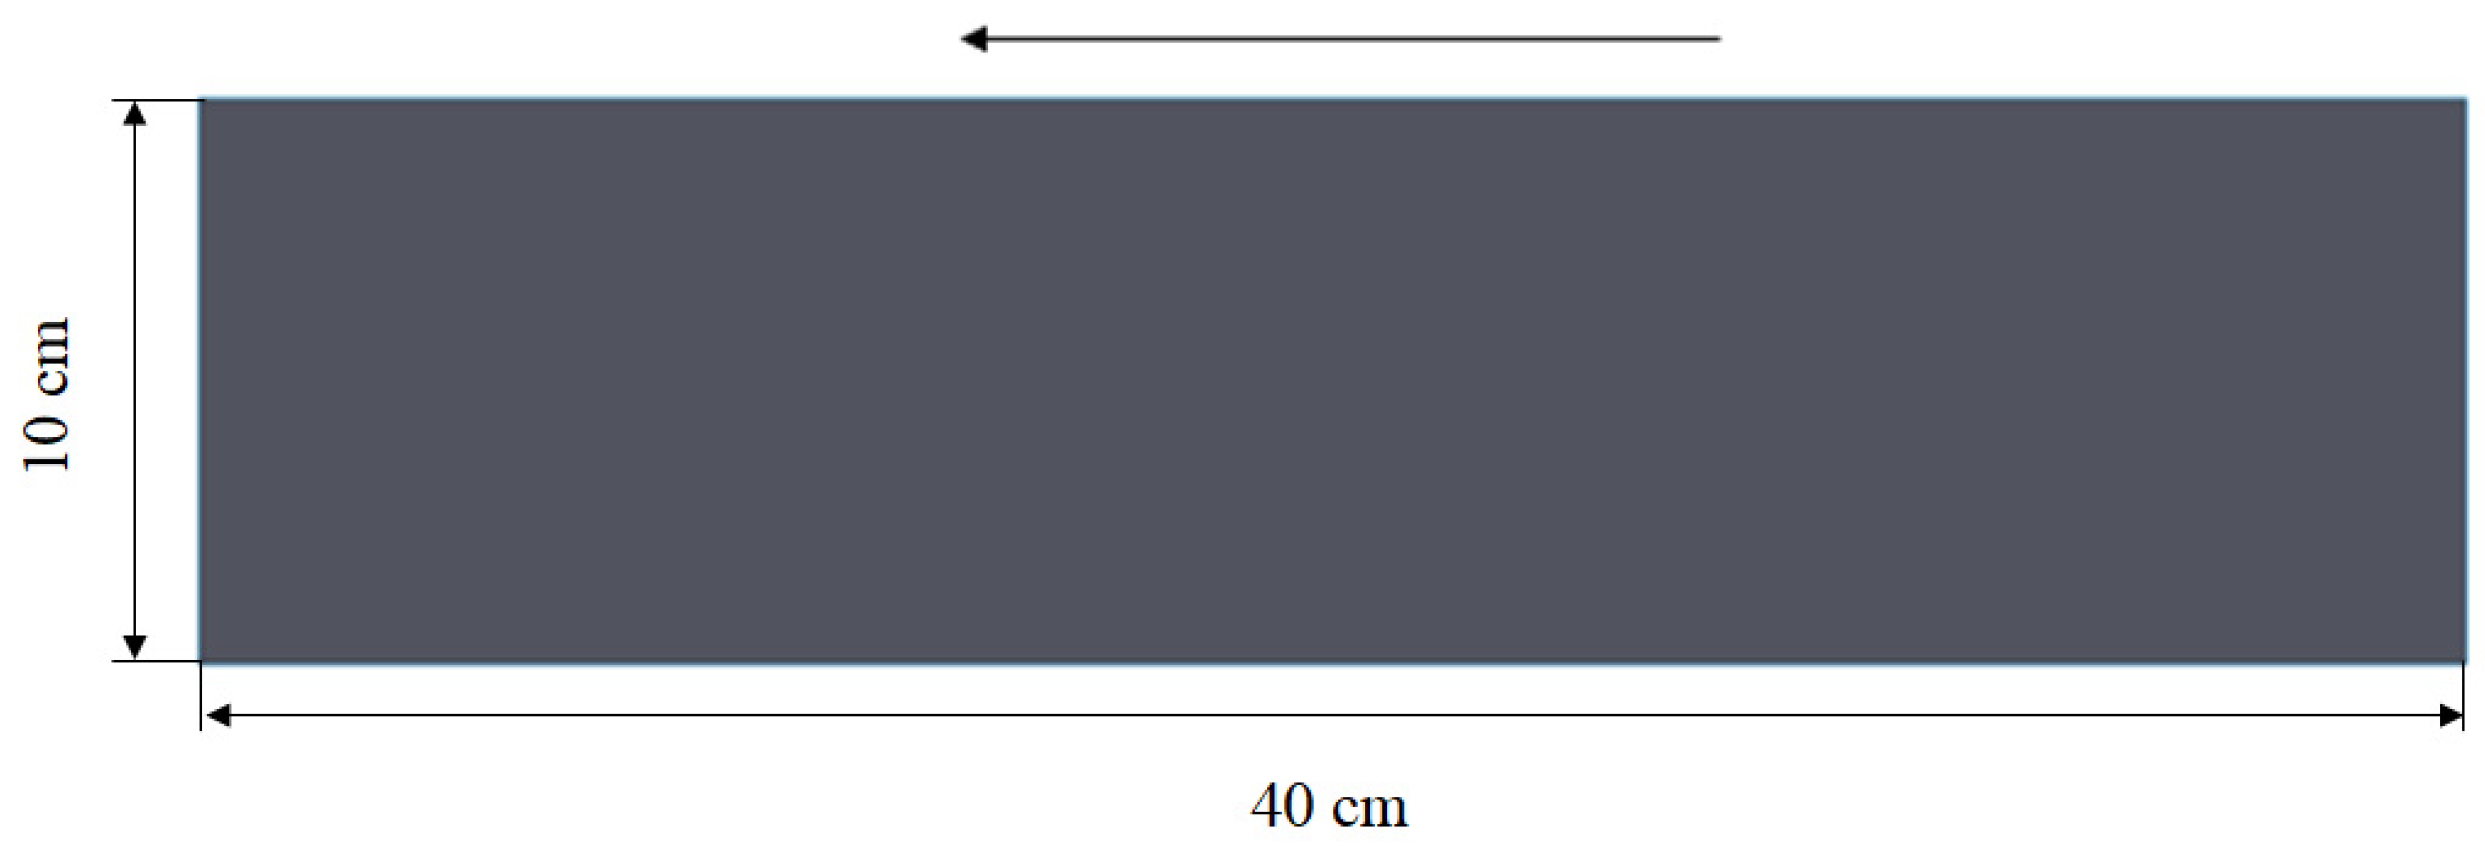
2.2.1. Creation of Fluid Domains

To avoid boundary disturbances and imbalances in computational efficiency [8], the 2D fluid domain model had a length of 40 cm and a width of 10 cm (Figure 9).
The 3D fluid domain model had a length of 70 cm and a width and height of 20 cm (Figure 10).

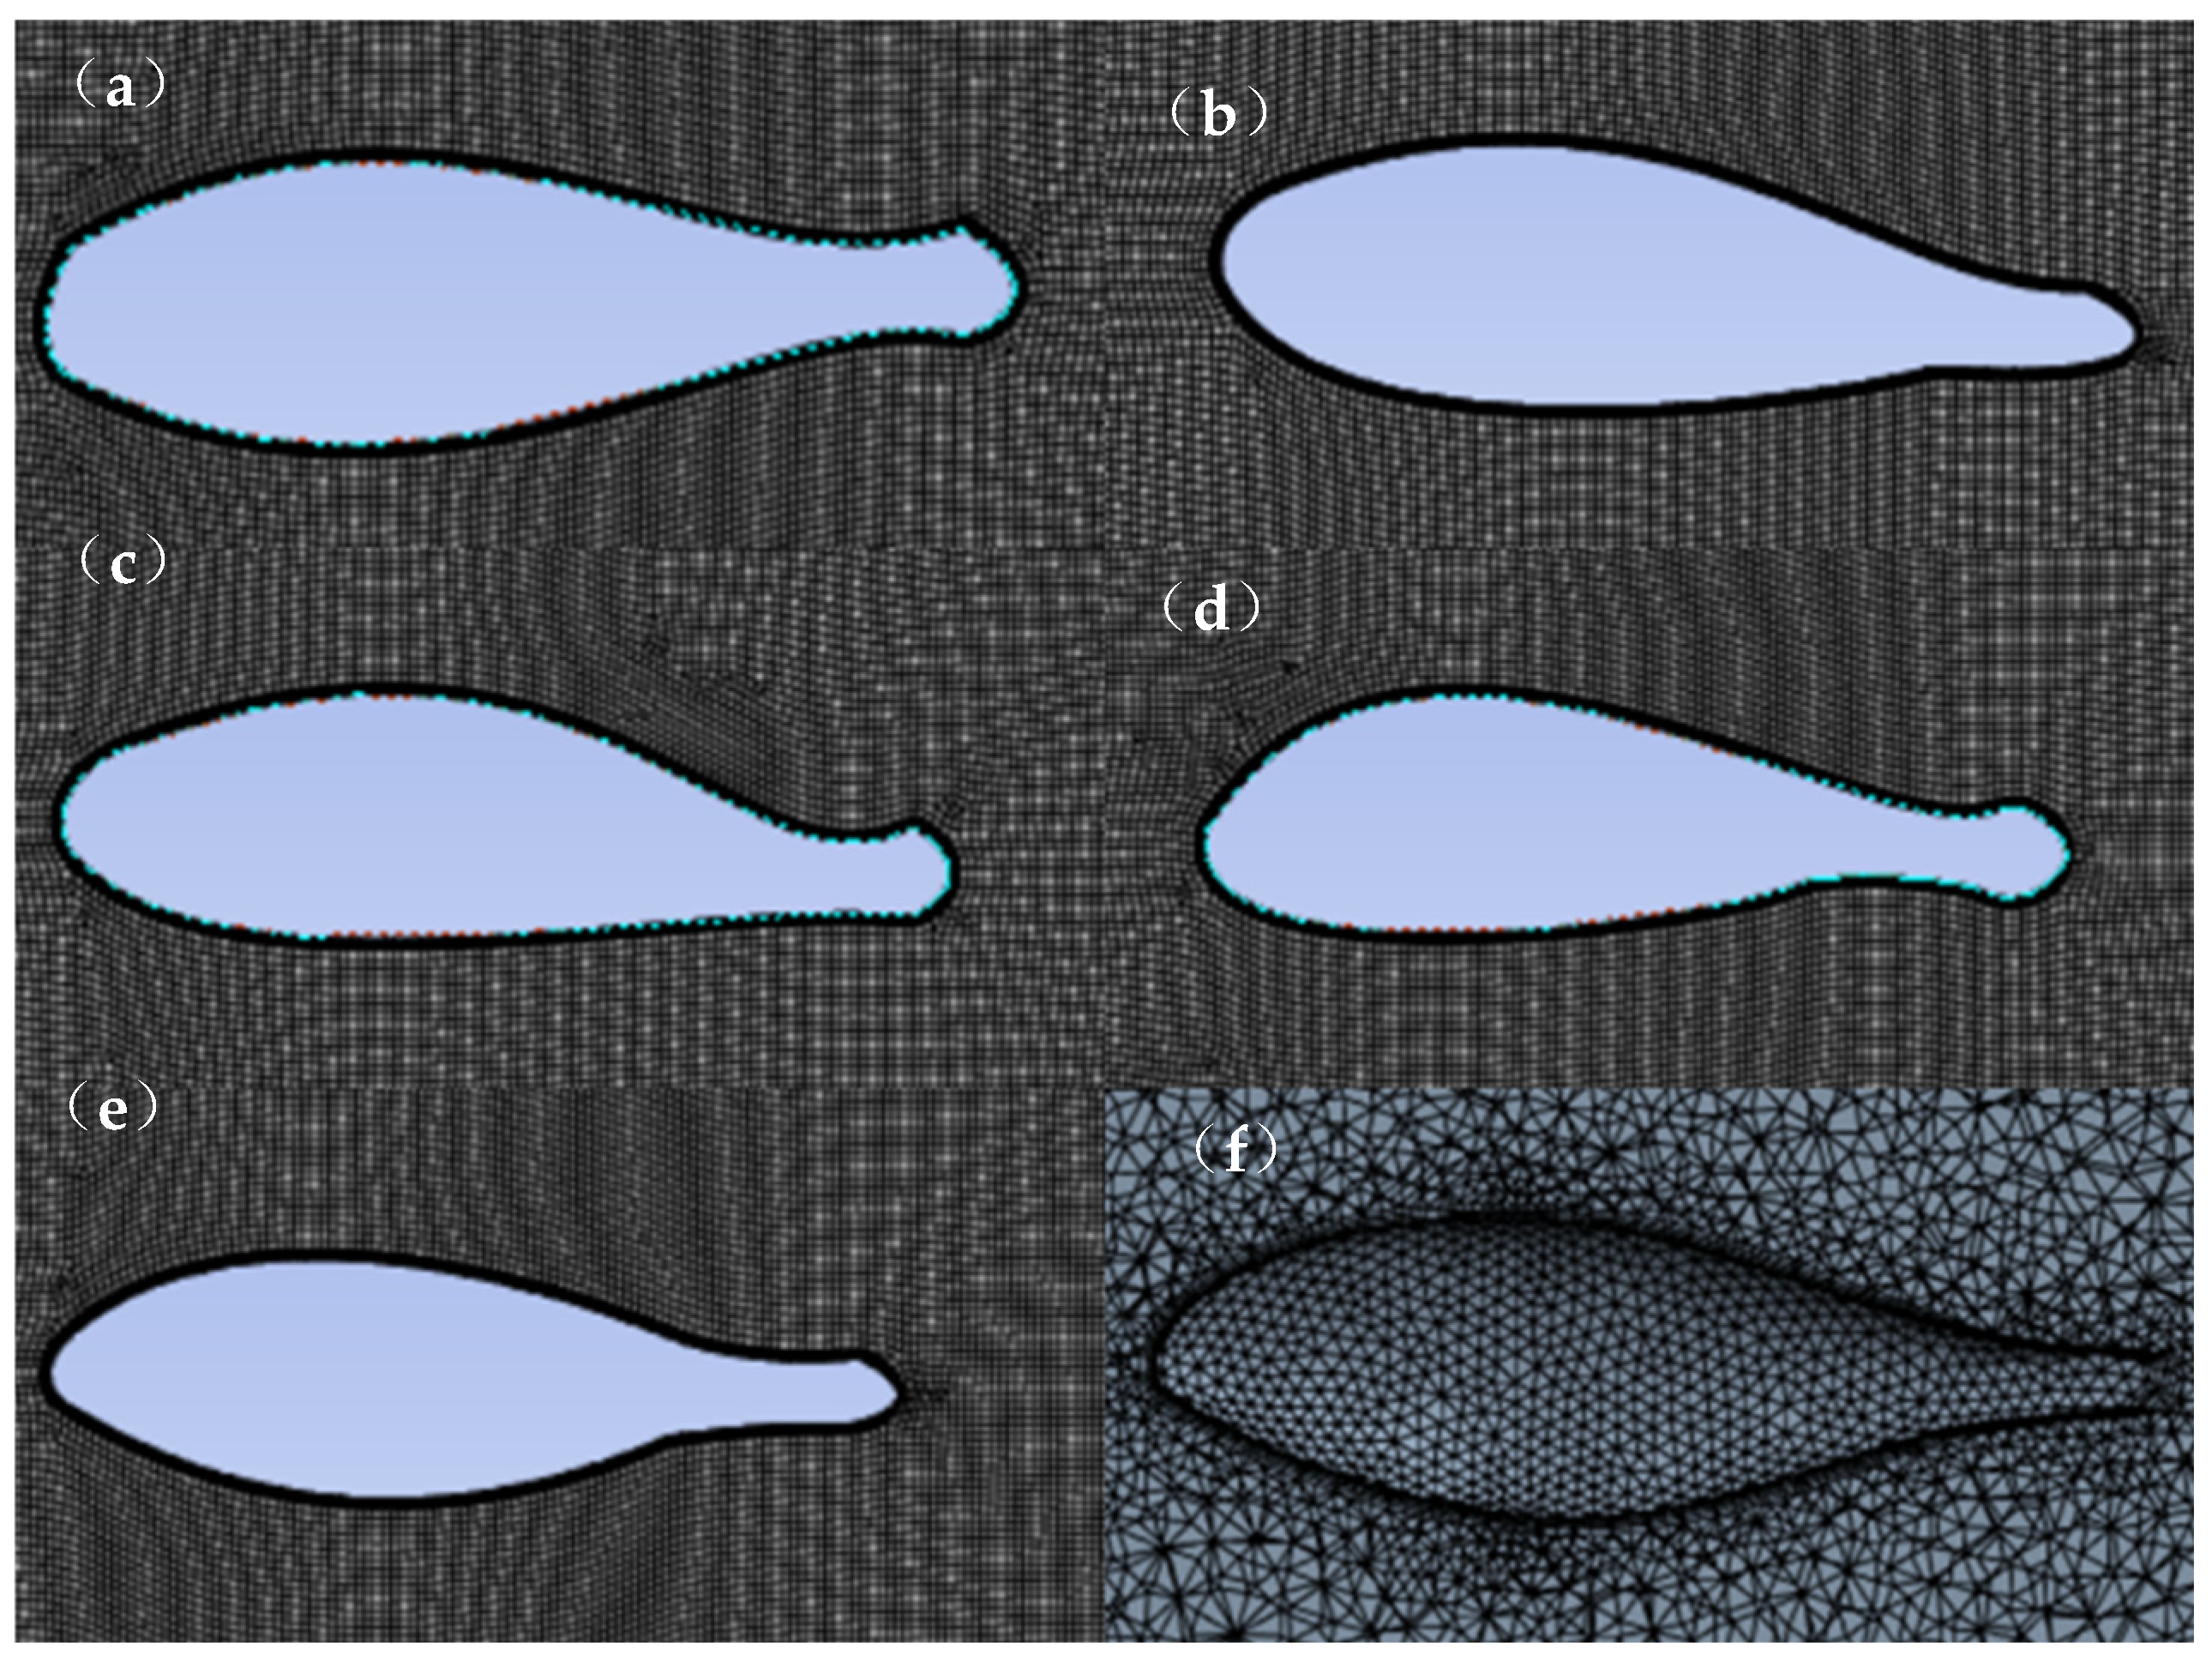
2.2.2. Creation of Fluid Meshes

The fluid domain in the test model was meshed using ICEM-CFD in FLUENT 2023 R1. The meshing method is hybrid meshing, with a structured meshing method for the fluid computational domain and an unstructured meshing method for the fish body model [26]. At the same time, an expansion layer was added to the fluid domain (the number of expansion layers is 10) and a boundary layer was created around the fish body model. To avoid the boundary effect of the external flow field, the boundary cell size for the model meshing in the fluid domain was set to 0.002 and the boundary cell size for the large yellow croaker model was set to 0.001 (Figure 11). The number of meshes for the two-dimensional model is 1,993,071, and the number of meshes for the three-dimensional model is 2,074,298. We verified the grid-independence by comparing relative errors by dividing different number of grids (Table 2). The geometric surface y+ main peak ranges from 50–80, which is consistent with the wall function requirements.

2.3. Test Methods

This study is based on the FLUENT solver, and, in order to make a choice of computational model, it is necessary to incorporate the Reynolds number Re calculation, which is calculated using the following formula:
R e = ρ v L μ
where ρ is the fluid density (the density of water is 998 kg/m3); v is the flow rate; L is the characteristic length; μ is the dynamic viscosity of water (μ = 0.001 Pa-s).
The calculated Re ranges from 4 to 40 × 103, which is in the form of turbulence, and considering the small size of the tail fin model in the simulation test, the computational model is chosen as the RNG k-ε model [27]. The specific form of the RNG k-ε model is as follows:
( p k ) t + p k u i x i = x j α μ e f f k x j + G k + ρ ε
ρ ε t + p ε u i x i = x j α μ e f f ε x j + ε k C 1 ε G k C 2 ε ρ ε 2 k
μ t = C 2 ε ρ ε 2 k
μ e f f = μ + μ t
where μ t is the turbulent viscosity, ε is the turbulence dissipation, k is the turbulent kinetic energy, ρ is the fluid density, G k is the generation term of the turbulent kinetic energy k due to the mean velocity gradient, and C 1 ε and C 2 ε are the empirical coefficients.
The specific form of the defining equation for the drag coefficient is as follows:
C = 2 R ρ A U 2
where C is the drag coefficient, R is the water resistance, ρ is the fluid density, A is the surface area of the large yellow croaker model, and U is the flow velocity at the inlet.
The following Equation (17) shows the equation for the coefficient of variation:
C V = S D M N × 100 %
where SD is the standard deviation and MN is the average value.
The fluid domain where the fish swam in the simulation test was a water domain in the steady state. FLUENT setup for selecting a pressure-based solver for the finite volume method, and the solver model was used as the incompressible flow model. Meanwhile, because the water resistance domain model was selected as the fluid computational domain model and the simulation test studied the fish model in the context of water resistance changes, second-order upwind modeling was adopted as the pressure difference value to improve the accuracy of the determined water resistance. To ensure a fast and stable solving process, we selected the coupled method, which can be used to update the velocity and pressure fields simultaneously during the solving process [28].
In the FLUENT parameter settings, water was added as the fluid in the fluid calculation domain. The boundary entrance is the velocity entrance; the velocity range was 0.1~1 m/s; the flow rate step was 0.1 m/s; the turbulent viscosity ratio was 10; the calculation was in the steady state, taking into account the effect of gravity; and the gravitational acceleration was 9.8 m/s. Default initialization was selected as the initialization scheme, and the calculation reference position of the initialization was set to the velocity input. The reference system was set relative to the unit region and the number of iterations was set to 100 to start the calculation.

2.4. Test Procedure

The water resistance of large yellow croaker models at ages of 1, 4, 7, 10, and 12 months was tested in order to fit the dorsal and abdominal contour line equations, to establish 2D models of this species, and to simulate and emulate the water resistance and drag coefficients of the models under the steady-state condition with the water velocity ranging from 0.1 to 1 m/s.
Based on the results of the water resistance test of large yellow croaker models of different ages, the model with the lowest water resistance compared to the other models was selected. Its body length was proportionally increased to create 10 large yellow croaker models with body lengths ranging from 10 to 100 cm, and the water resistance and water resistance coefficient were simulated in the steady state for water currents ranging from 0.1 to 1 m/s.
Based on the results of the water resistance test of large yellow croaker models with different body lengths, the model with a more stable increase in water resistance compared to other body length models was selected for testing. A large yellow croaker 3D model was established, and three different surface skin materials were selected for the robotic fish—PE, PC and ST—to simulate their effect on water resistance and the water resistance coefficient in the steady state at a water flow velocity of 0.1~1 m/s.

2.5. Method Validation

Liu Qingzhao et al. [29] investigated the hydrodynamic effects of the incoming flow headway angle on the turbine blades at a Reynolds number of 0.4 × 10⁵ by means of flume experiments. In this paper, the correctness of the method is cross-validated by simulating its hydrodynamic comparison through CFD simulation tests (Table 3).
We calculated and verified the results of the hydrodynamic tests of the CFD method compared to the results of the flume experiments with a relative error of 11.09 ± 1.29%, which is less than 15%, and meets the requirements of the analysis.

3. Results

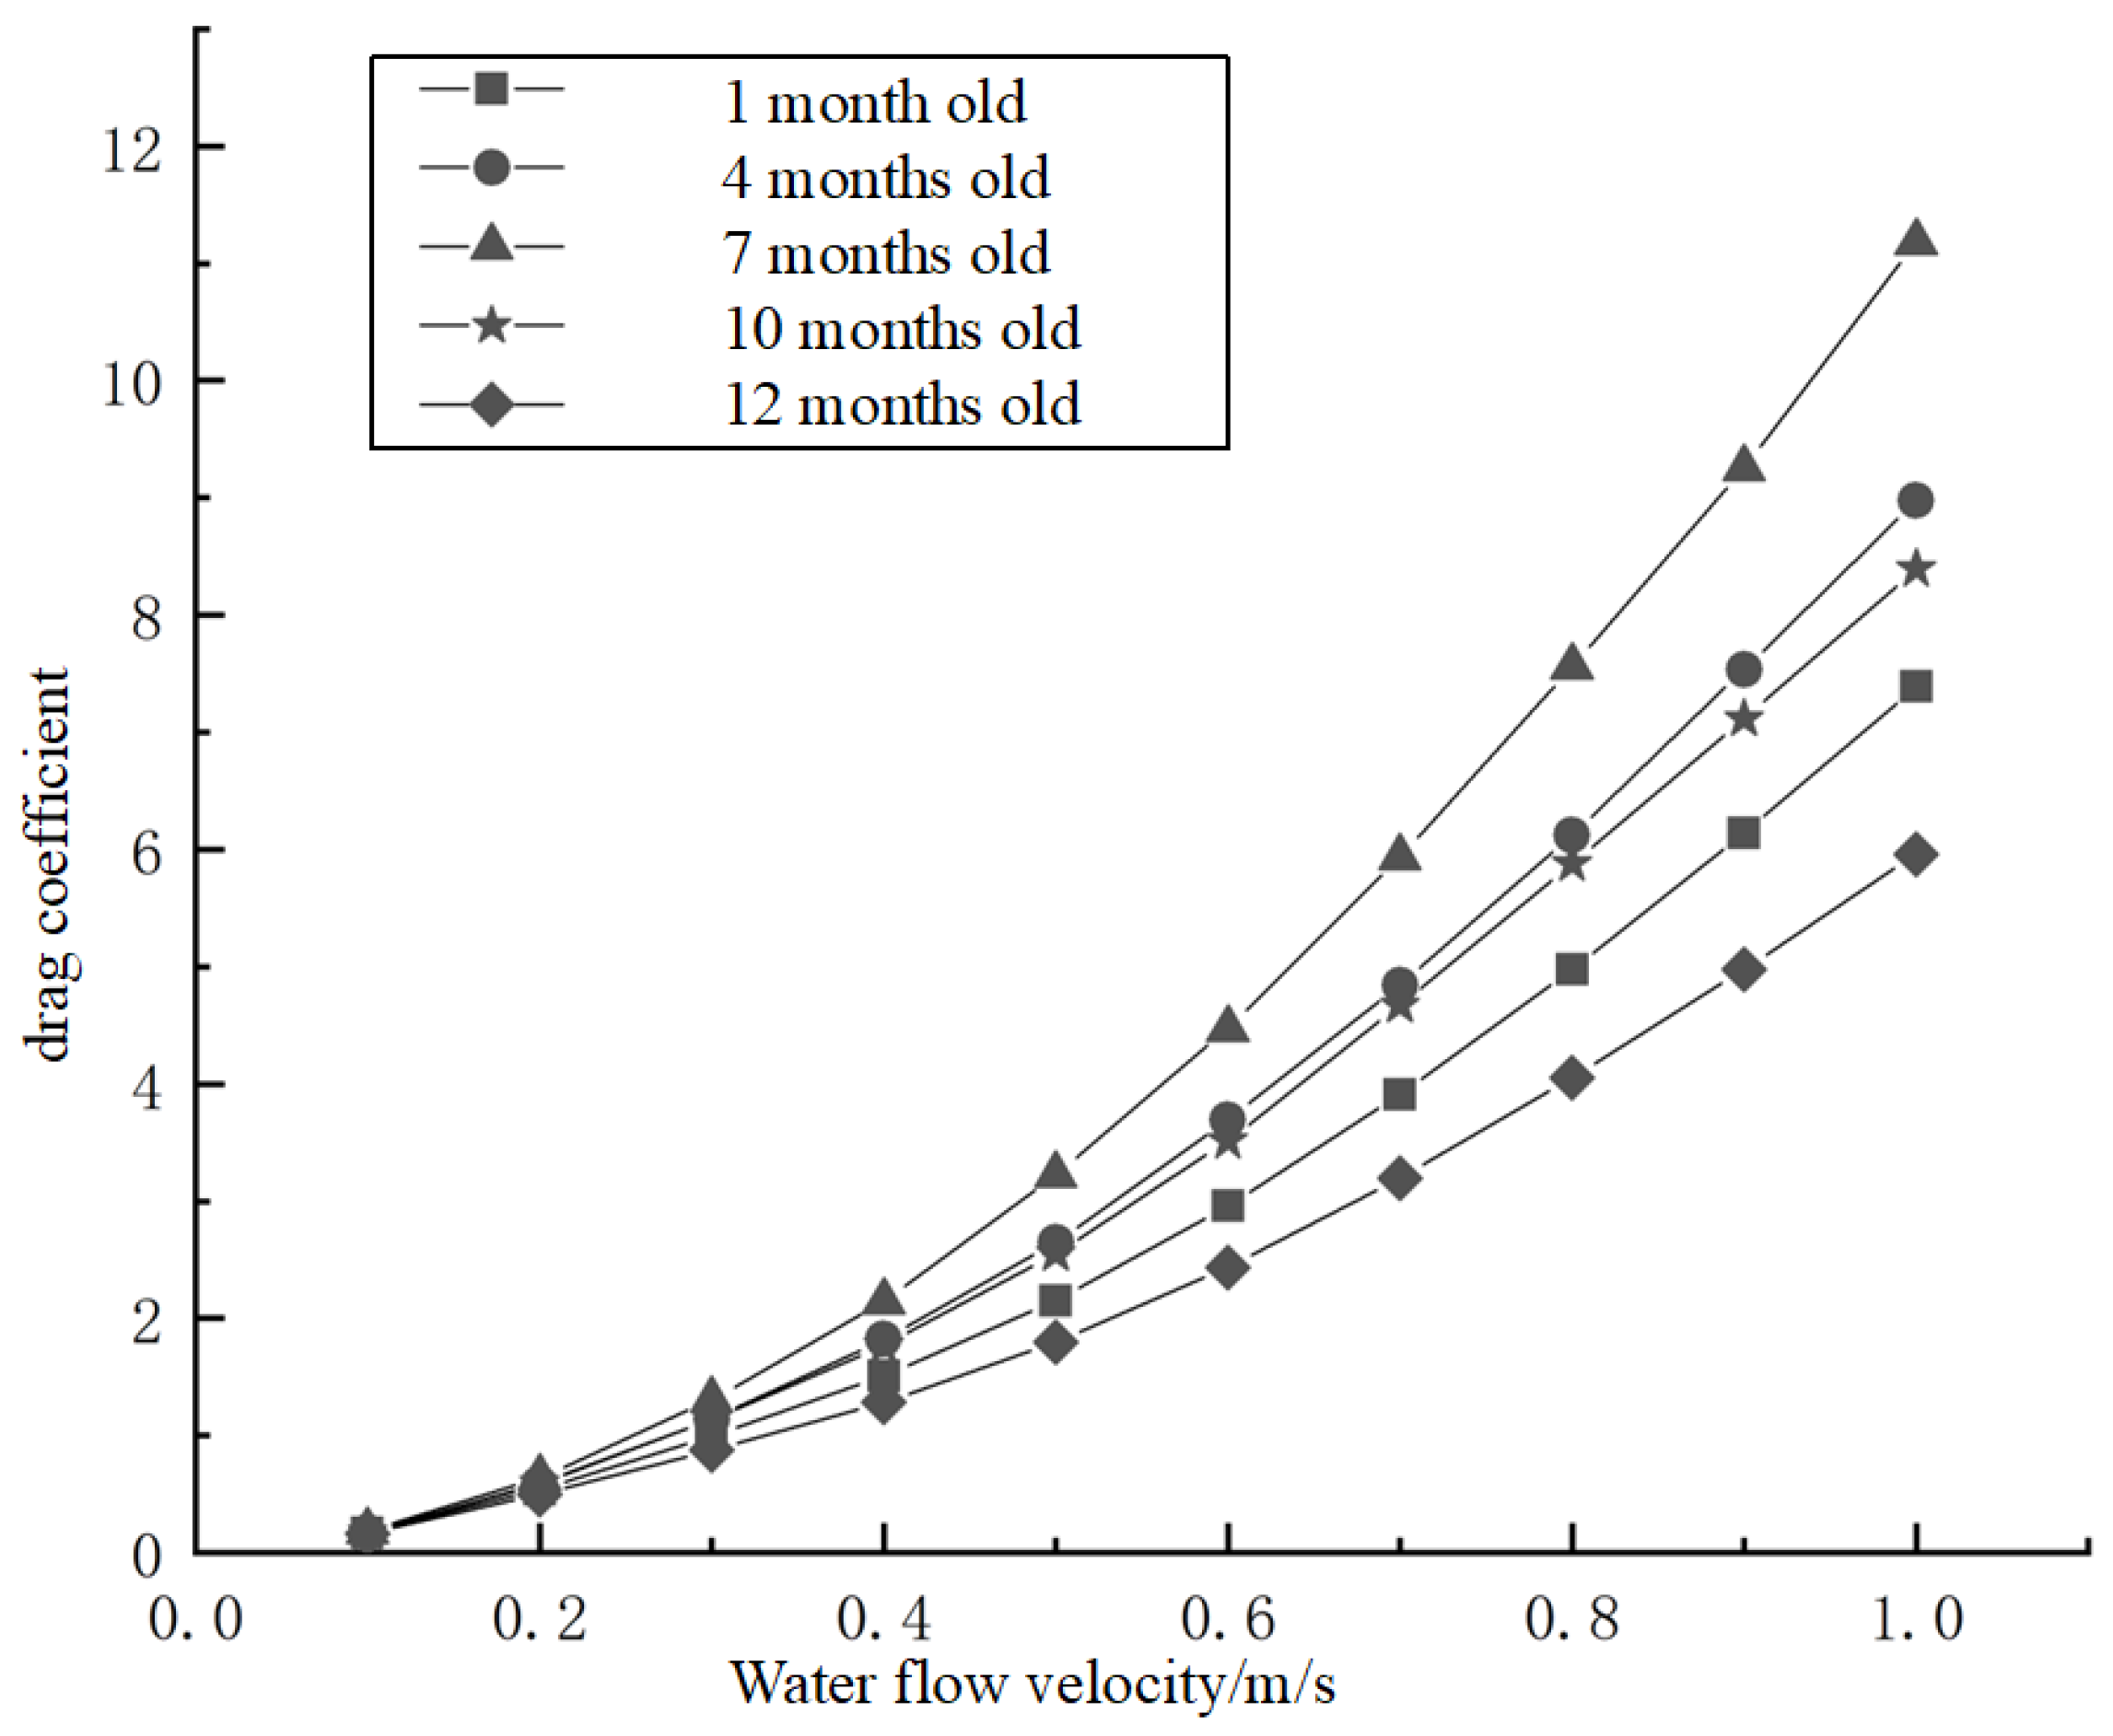
3.1. Differences in Water Resistance in Large Yellow Croaker Models at Different Ages

The water resistance of large yellow croakers of different ages demonstrates an increasing and then decreasing trend (Figure 12). At flow velocities of 0.1~1 m/s, the minimum water resistance increases from 0.1006 N (12-month-old model) to 0.1119 N (7-month-old model), whereas the maximum value rises sharply from 3.6512 to 6.8485 N. For the 12-month-old model, the water resistance spans from 0.1742 to 7.3932 (CV = 78.2%), while the 7-month-old model exhibits an expanded range of 0.7978~46.6540 (CV = 82.6%). A notable local maximum occurs in the 7-month-old model, with its maximum water resistance (8.6465 N) being 24.55% higher than that of the 4-month-old model, and a notable local minimum occurs in the 12-month-old model, with its maximum water resistance (3.6512 N) being 28.97% lower than that of the 10-month-old model.
The drag coefficient of large yellow croakers at different ages demonstrates an increasing and then decreasing trend (Figure 13). At flow velocities of 0.1–1 m/s, the minimum drag coefficient increases from 0.1624 (12-month-old model) to 0.1826 (7-month-old model), whereas the maximum value rises sharply from 5.9612 to 11.1810. For the 7-month-old model, the drag coefficient spans 0.1826~11.1810 (CV = 82.6%), while the 12-month-old model exhibits an expanded range of 0.1642~5.9612 (CV = 78.2%). A notable local maximum occurs in the 7-month-old model, with its maximum drag coefficient (11.1810) being 24.55% higher than that of the 4-month-old model, and a notable local minimum occurs in the 12-month-old model, with its maximum drag coefficient (5.9612) being 28.97% lower than that of the 10-month-old model.

3.2. Differences in Water Resistance in Large Yellow Croaker Models at Different Body Lengths

The water resistance of large yellow croaker models demonstrates a distinct positive size effect (Figure 14). At flow velocities of 0.1–1 m/s, the minimum water resistance increases from 0.1067 N (10 cm model) to 0.4886 N (100 cm model), whereas the maximum value rises sharply from 4.5284 to 28.5760 N. Each 10 cm increase in model length induces a nonlinear increase in water resistance maxima. For the 10 cm model, the water resistance spans 0.1067–4.5284 N (CV = 80.2%), while the 100 cm model exhibits an expanded range of 0.4886–28.5760 (CV = 82.6%). A notable local minimum occurs in the 50 cm model, with its minimum water resistance (0.2415 N) being 3.4% lower than that of the 40 cm model. Beyond 60 cm, the increase in drag coefficient stabilizes, showing an average increase of 21.19 ± 0.21% per 10 cm increment.
The drag coefficient of large yellow croaker models demonstrates a distinct positive size effect (Figure 15). At flow velocities of 0.1–1 m/s, the minimum drag coefficient increases from 0.1742 (10 cm model) to 0.7978 (100 cm model), whereas the maximum value rises sharply from 7.3932 to 46.6540. Each 10 cm increase in model length induces a nonlinear increase in drag coefficient maxima. For the 10 cm model, the drag coefficient spans from 0.1742 to 7.3932 (CV = 80.2%), while the 100 cm model exhibits an expanded range of 0.7978–46.6540 (CV = 82.6%). A notable local minimum occurs in the 50 cm model, with its minimum drag coefficient (0.3944) being 3.4% lower than that of the 40 cm model. Beyond 60 cm, the increase in drag coefficient stabilizes, showing an average increase of 21.19 ± 0.21% per 10 cm increment.

3.3. Differences in Water Resistance in Large Yellow Croaker Models of Different Materials

The water resistance of the tail fin made of the PE material is significantly lower than that of the tail fins made of the PC and ST materials (Figure 16). At flow velocities of 0.1–1 m/s, the minimum water resistance increases from 0.0048 N (20 cm PE model) to 0.8672 N (40 cm ST model), whereas the maximum value rises sharply from 7.3932 to 46.6540 N. For the 20 cm PE model, the water resistance spans from 0.0048 to 0.1934 N (CV = 82.7%), while the 40 cm ST model exhibits an expanded range of 0.0165~0.8672 N (CV = 85.9%).
The drag coefficient of the tail fin made of the PE material is significantly lower than those of the tail fins made of the PC and ST materials (Figure 17). At flow velocities of 0.1–1 m/s, the minimum drag coefficients increase from 0.0078 (20 cm PE model) to 0.0270 (40 cm ST model), whereas the maximum value rises sharply from 0.3158 to 1.4159. For the 20 cm PE model, the drag coefficients span 0.0078~0.3158 (CV = 82.7%), while the 40 cm ST model exhibits an expanded range of 0.0270~1.4159 (CV = 85.9%).

4. Discussion

4.1. Analysis of the Difference in Water Resistance Between Large Yellow Croaker Models of Different Ages

The hydrodynamic characteristics of large yellow croaker models at different ages were analyzed based on simulation experiments of their water resistance. The water resistance was at a minimum at 12 months old. The drag coefficient shows relatively low values at 1 and 12 months old, while those at 7 and 10 months old are higher. The range of increase in the water resistance shows a relatively stable increase in drag at a current speed of 0.1~1 m/s for the models at 1 and 12 months old, basically between 20 and 225%. With increasing water velocity, the water resistance of large yellow croaker models of different ages shows an increasing trend. The increases in water resistance gradually decrease and the drag coefficient gradually increases. This indicates that the drag coefficient of the large yellow croaker model increases relatively little at high water velocities, showing that it is better adapted to the water environment. The drag coefficient increases because the increase in flow velocity leads to an increase in the flow separation phenomenon on the surface of large yellow croaker, which increases the drag coefficient. Geng Wenbao et al. [30] used tuna, dolphin (Delphinidae), and sailfish (Makaira nigricans) as bionic models to create three different robotic fish models. They analyzed the speed of the models in the fluid domain and the force on the fish body and found that the sailfish model experienced less water resistance than the tuna and dolphin models when moving. This shows that robotic fish models with different dorsal and abdominal contour lines experience different water resistances in the fluid domain, which is consistent with the water resistances experienced by the yellow croaker models of different ages in the same water environment in the experiment. Feng Yikun et al. [31] found through research on the hydrodynamics of bionic robotic fish that the closer the robotic fish model is to an elongated body, the less water resistance it experiences from the flow field. This is consistent with the results of this experiment, where the 12-month-old yellow croaker model is closer to an elongated body shape than the other model ages, and its water resistance is minimal. Experiments have confirmed that the shape of the fish’s body contour has a great influence on the water resistance performance of underwater robotic fish, i.e., the closer the model is to the elongated body, the lower the water resistance.

4.2. Analysis of the Difference in Water Resistance Between Large Yellow Croaker Models of Different Body Lengths

As body length increases, the water resistance, range of increase in the water resistance, and drag coefficient of the large yellow croaker model show an upward trend. The test results are consistent with the movement of fish in a real aquatic environment. Larger fish experience greater drag as they move through the water. The drag coefficient is shown to increase as the body length increases. When a larger model moves in the water, its surface area is relatively large, and the water resistance it receives increases accordingly. As the body length increases, the change in model shape may cause the flow velocity distribution on the surface of the model to change, which, in turn, affects the water resistance. Meanwhile, by analyzing the water resistance performance of the large yellow croaker model under different water flow velocities, it was found that the water resistance of the 10 cm yellow croaker model was smallest at a water flow velocity of 0.1 m/s, while that of the 100 cm model was largest. As the water velocity rate increased, the water resistance of all models showed an upward trend, but the rate of increase gradually slowed down. The water resistance of the 10 cm yellow croaker model increased most when the water velocity reached 1 m/s, while the 100 cm yellow croaker model exhibited the lowest increase in water resistance. The results of the relationship between the drag coefficient and body length of the large yellow croaker model show that the drag coefficient increases with increasing body length, but the rate of increase gradually slows down. This shows that the drag coefficient of larger models increases more slowly as they move through the water. This is probably because the shape and surface area of larger models change less as they move through the water, which has a smaller effect on the drag coefficient. The water resistance of the large yellow croaker model is closely related to size. As the size increases, the water resistance, rate of increase in water resistance, and drag coefficient all show an upward trend. The scale ratio of the robotic fish directly affects the drag coefficient of the bionic robotic fish. Li Guanghao et al. [32] proposed a new drag reduction method based on the fish structure. The results show that an increase in the body length, width, and thickness data of the fish model directly affects the water resistance of the bionic robotic fish model, and an increase in the body length and width directly increases the water resistance of the robotic fish. This is consistent with the experimental results, where the water resistance of the large yellow croaker model gradually increases with the increase in body length. He Jianhui et al. [33], based on the tail fin of a bionic robotic fish, analyzed the influence of the tail fin size ratio on the thrust of the biomimetic robotic fish model. The results showed that the tail fin size had a significant influence on the thrust of the biomimetic robotic fish model, indicating that the water resistance experienced by tail fins of different sizes is different, which directly affects the thrust of the robotic fish model. This is consistent with the experimental results showing that the size ratio of the large yellow croaker model directly affects the magnitude of water resistance.

4.3. Analysis of the Difference in Water Resistance Between Large Yellow Croaker Models of Different Materials

According to the analysis of the results of the water resistance simulation test of the three large yellow croaker models made with different materials and body lengths, it can be seen that their water resistances all show an increasing trend with the increase in the flow velocity. At a water flow velocity of 0.1 m/s, the water resistances of the PE, PC, and ST materials for the 20 cm model are 0.0048, 0.0052, and 0.0057 N, respectively, and these increase to 0.1934, 0.2065, and 0.2453 N, respectively, at a water flow velocity of 1 m/s. The 30 and 40 cm models also show similar trends. The range of increase in the water resistance is seen to gradually decrease as the water flow velocity increases for the three different-sized large yellow croaker models. Taking the 30 cm model as an example, at a water velocity of 0.1 m/s, the ranges of water resistance increase for PE, PC, and ST materials are 176.71, 166.69, and 165.01%, respectively, while at a water velocity of 1 m/s, they decrease to 22.30, 22.16, and 23.04%, respectively. This shows that the influence of the different skin materials on the range of increased water resistance is relatively small at higher water velocities. Judging by the change in drag coefficient with increasing water flow velocity, the drag coefficient of the three sizes of large yellow croaker models shows an upward trend. Taking the 40 cm model as an example, at a water flow velocity of 0.1 m/s, the drag coefficients of the PE, PC, and ST materials are 0.0242, 0.0264, and 0.0270, respectively, while at a water flow velocity of 1 m/s, they increase to 1.2282, 1.2824, and 1.4159, respectively. This shows that the drag coefficient is strongly influenced by the material at higher water flow rates. Analysis of large yellow croaker models of different body lengths showed that the water resistance, range of increase in the water resistance, and drag coefficient of the PE material were relatively small, indicating better hydrodynamic performance. The PC material was second, and the ST material had a larger water resistance, range of increase in the water resistance, and drag coefficient, and a relatively poor hydrodynamic performance. There is a certain regularity in the hydrodynamic characteristics of the large yellow croaker model at different water velocities. At low water velocities, the effects of different shell materials on the water resistance, range of increase in the water resistance, and drag coefficient are significant; however, at high water velocities, this effect gradually decreases. Ge Feifei et al. [34] studied the effect of different materials on the tail fin of a bionic robot fish swinging in the water on the propulsion force based on the tail fin. The study showed that the propulsion force of the PE material was greater than that of the PC material, which was greater than that of the ST material. In other words, the water resistance generated by the PE material bionic robot fish in the pool was smaller, which was consistent with the experiment where the large yellow croaker model made of the PE material had less water resistance than those made of the PC and ST materials. Zhao Dongsheng [35] used tuna as a bionic object to study the hydrodynamic performance of soft and rigid body models. The results showed that the soft body model produced better dynamics in the pool than the rigid body model. Xie Ou et al. [36] studied the hydrodynamic characteristics of the artificial lateral line of a bionic fish coupled with an underwater moving target to achieve the perception of underwater dynamic targets by the flexible lateral line. The results show that the power generated by flexible motion is higher than that of rigid motion. The above results show that when designing and manufacturing robotic fish, models made of flexible materials have better dynamic properties than those made of rigid materials.

5. Conclusions

In this study, the large yellow croaker was used as a bionic model to investigate the effects of shape contour, size ratio, and skin material on water resistance. This research shows the following:
(1)
Under the same size ratio, for each of the large yellow croaker models at different ages, as the water velocity increases, the total water resistance gradually increases and the rate of increase in water resistance gradually decreases.
(2)
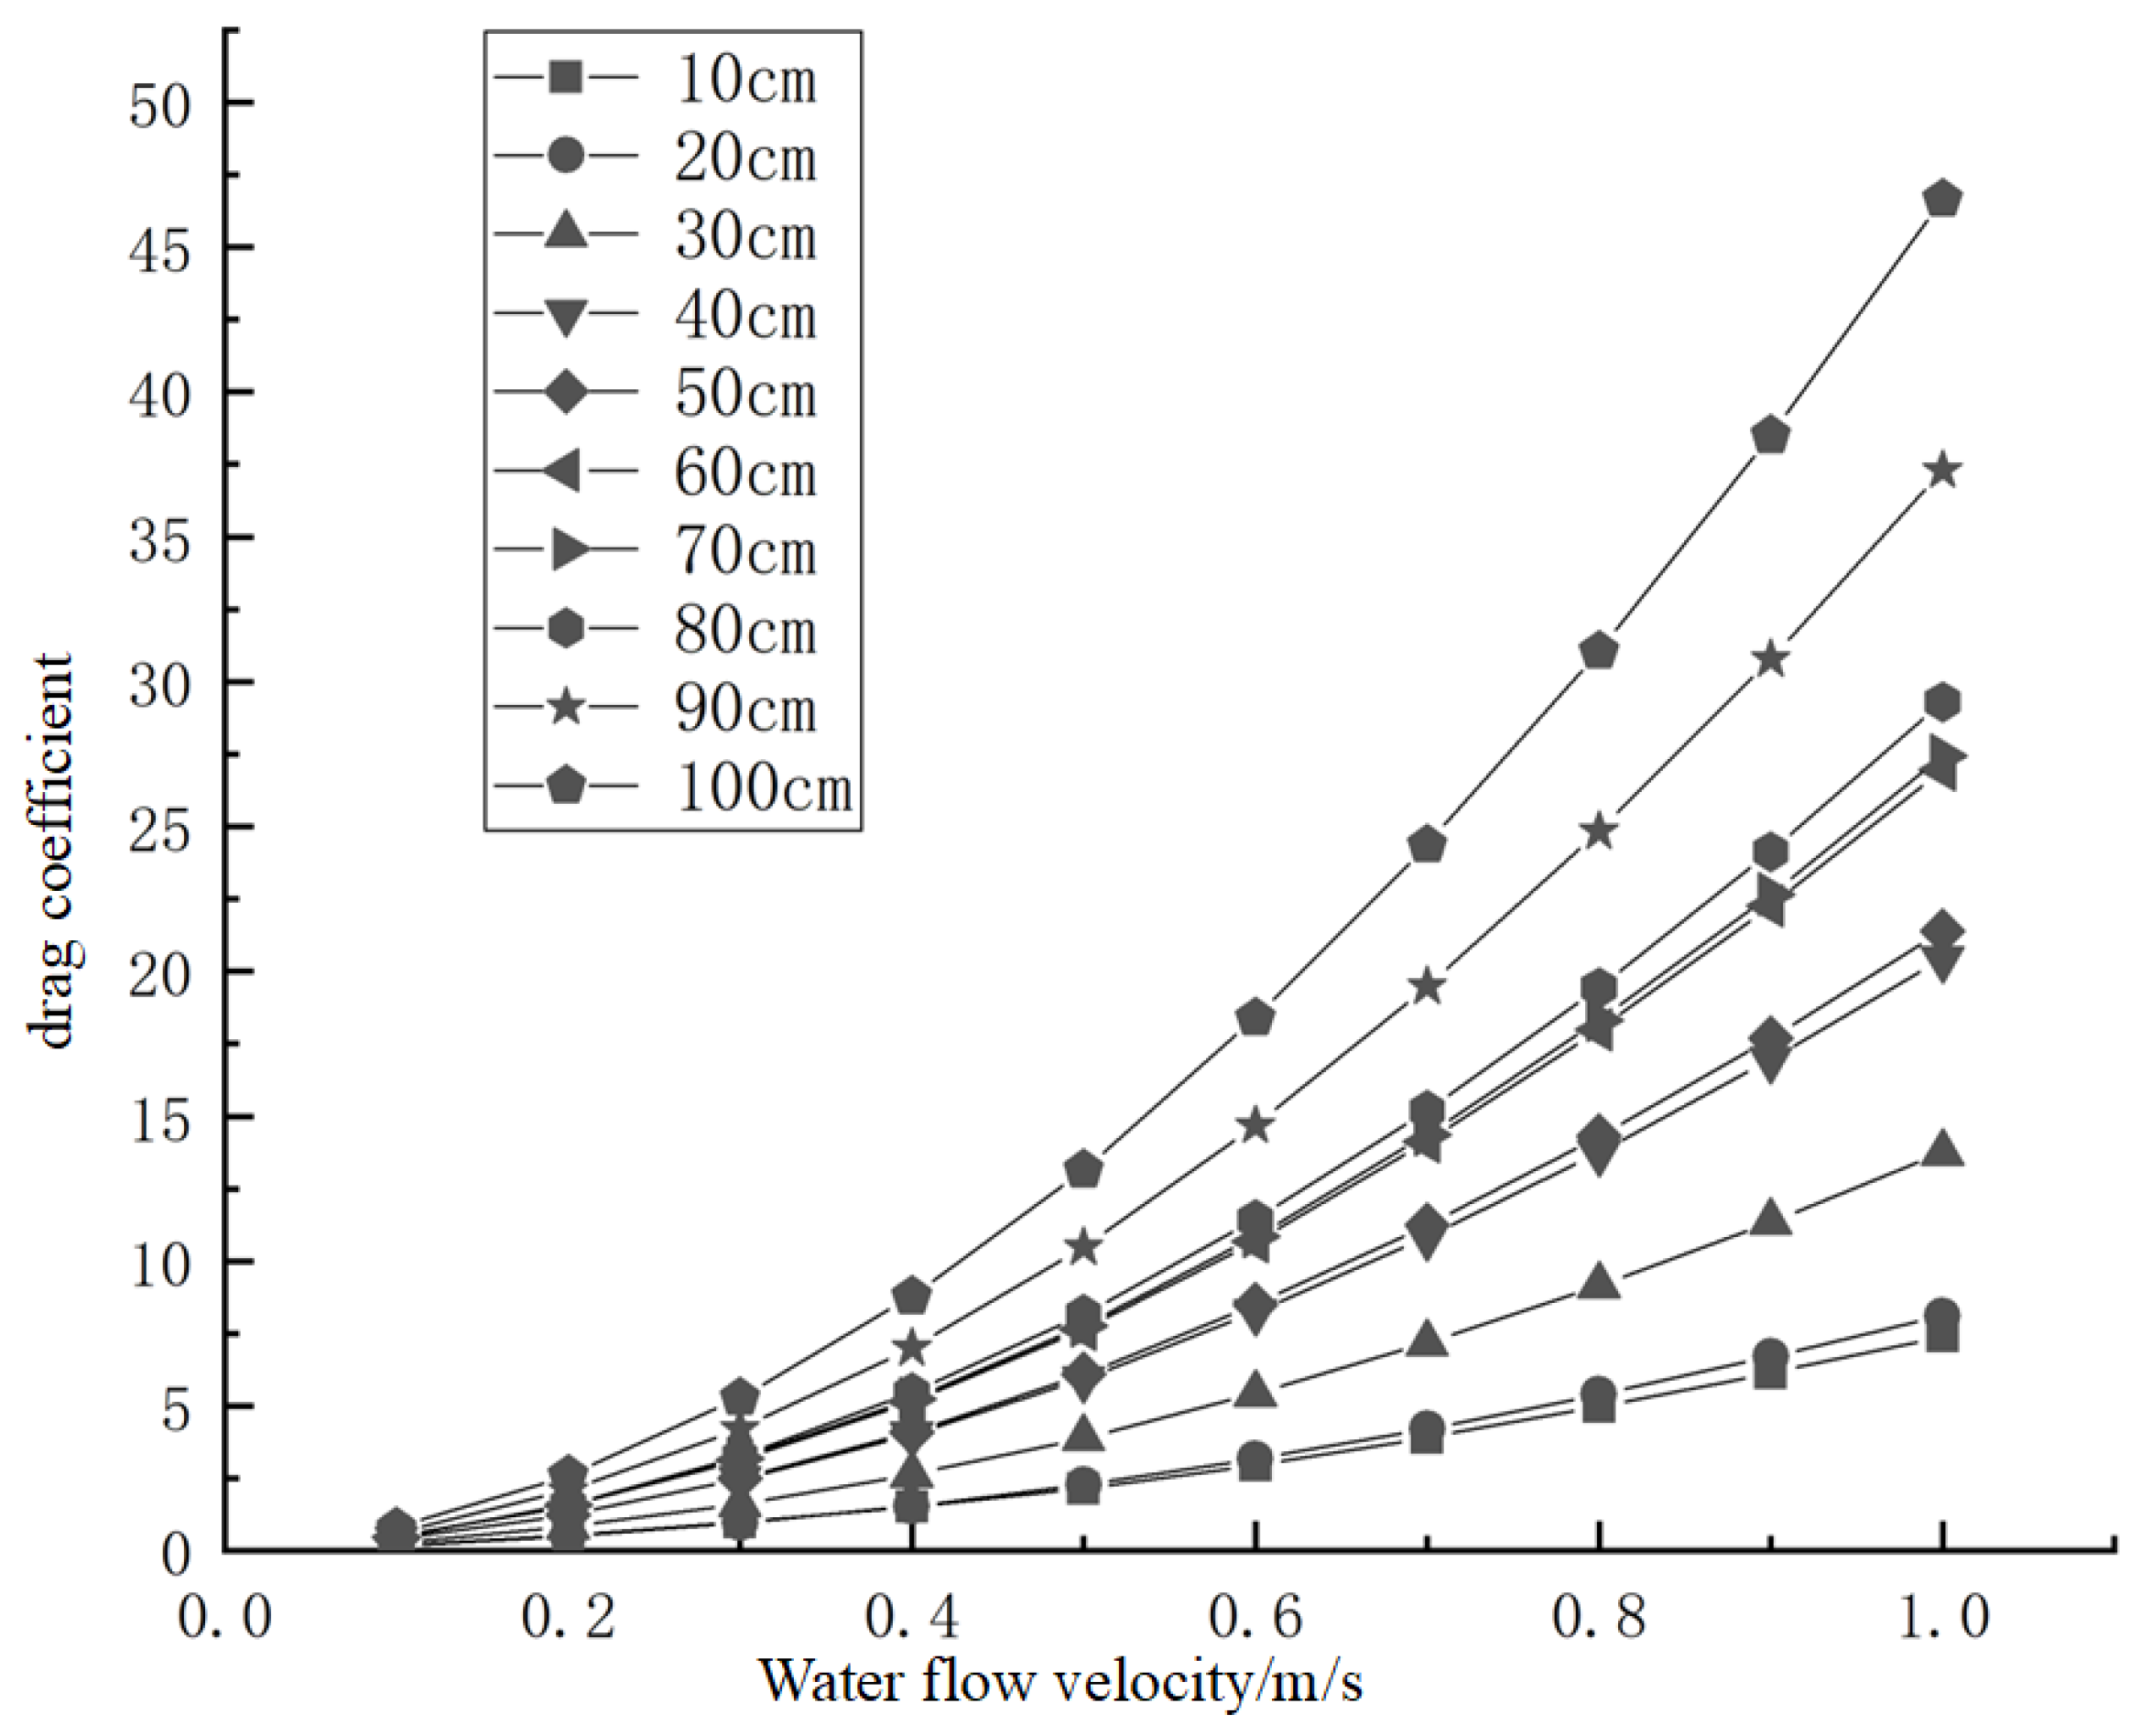
Under different size ratios, the water resistance, rate of increase in water resistance, and drag coefficient increase as the body length ratio increases.
(3)
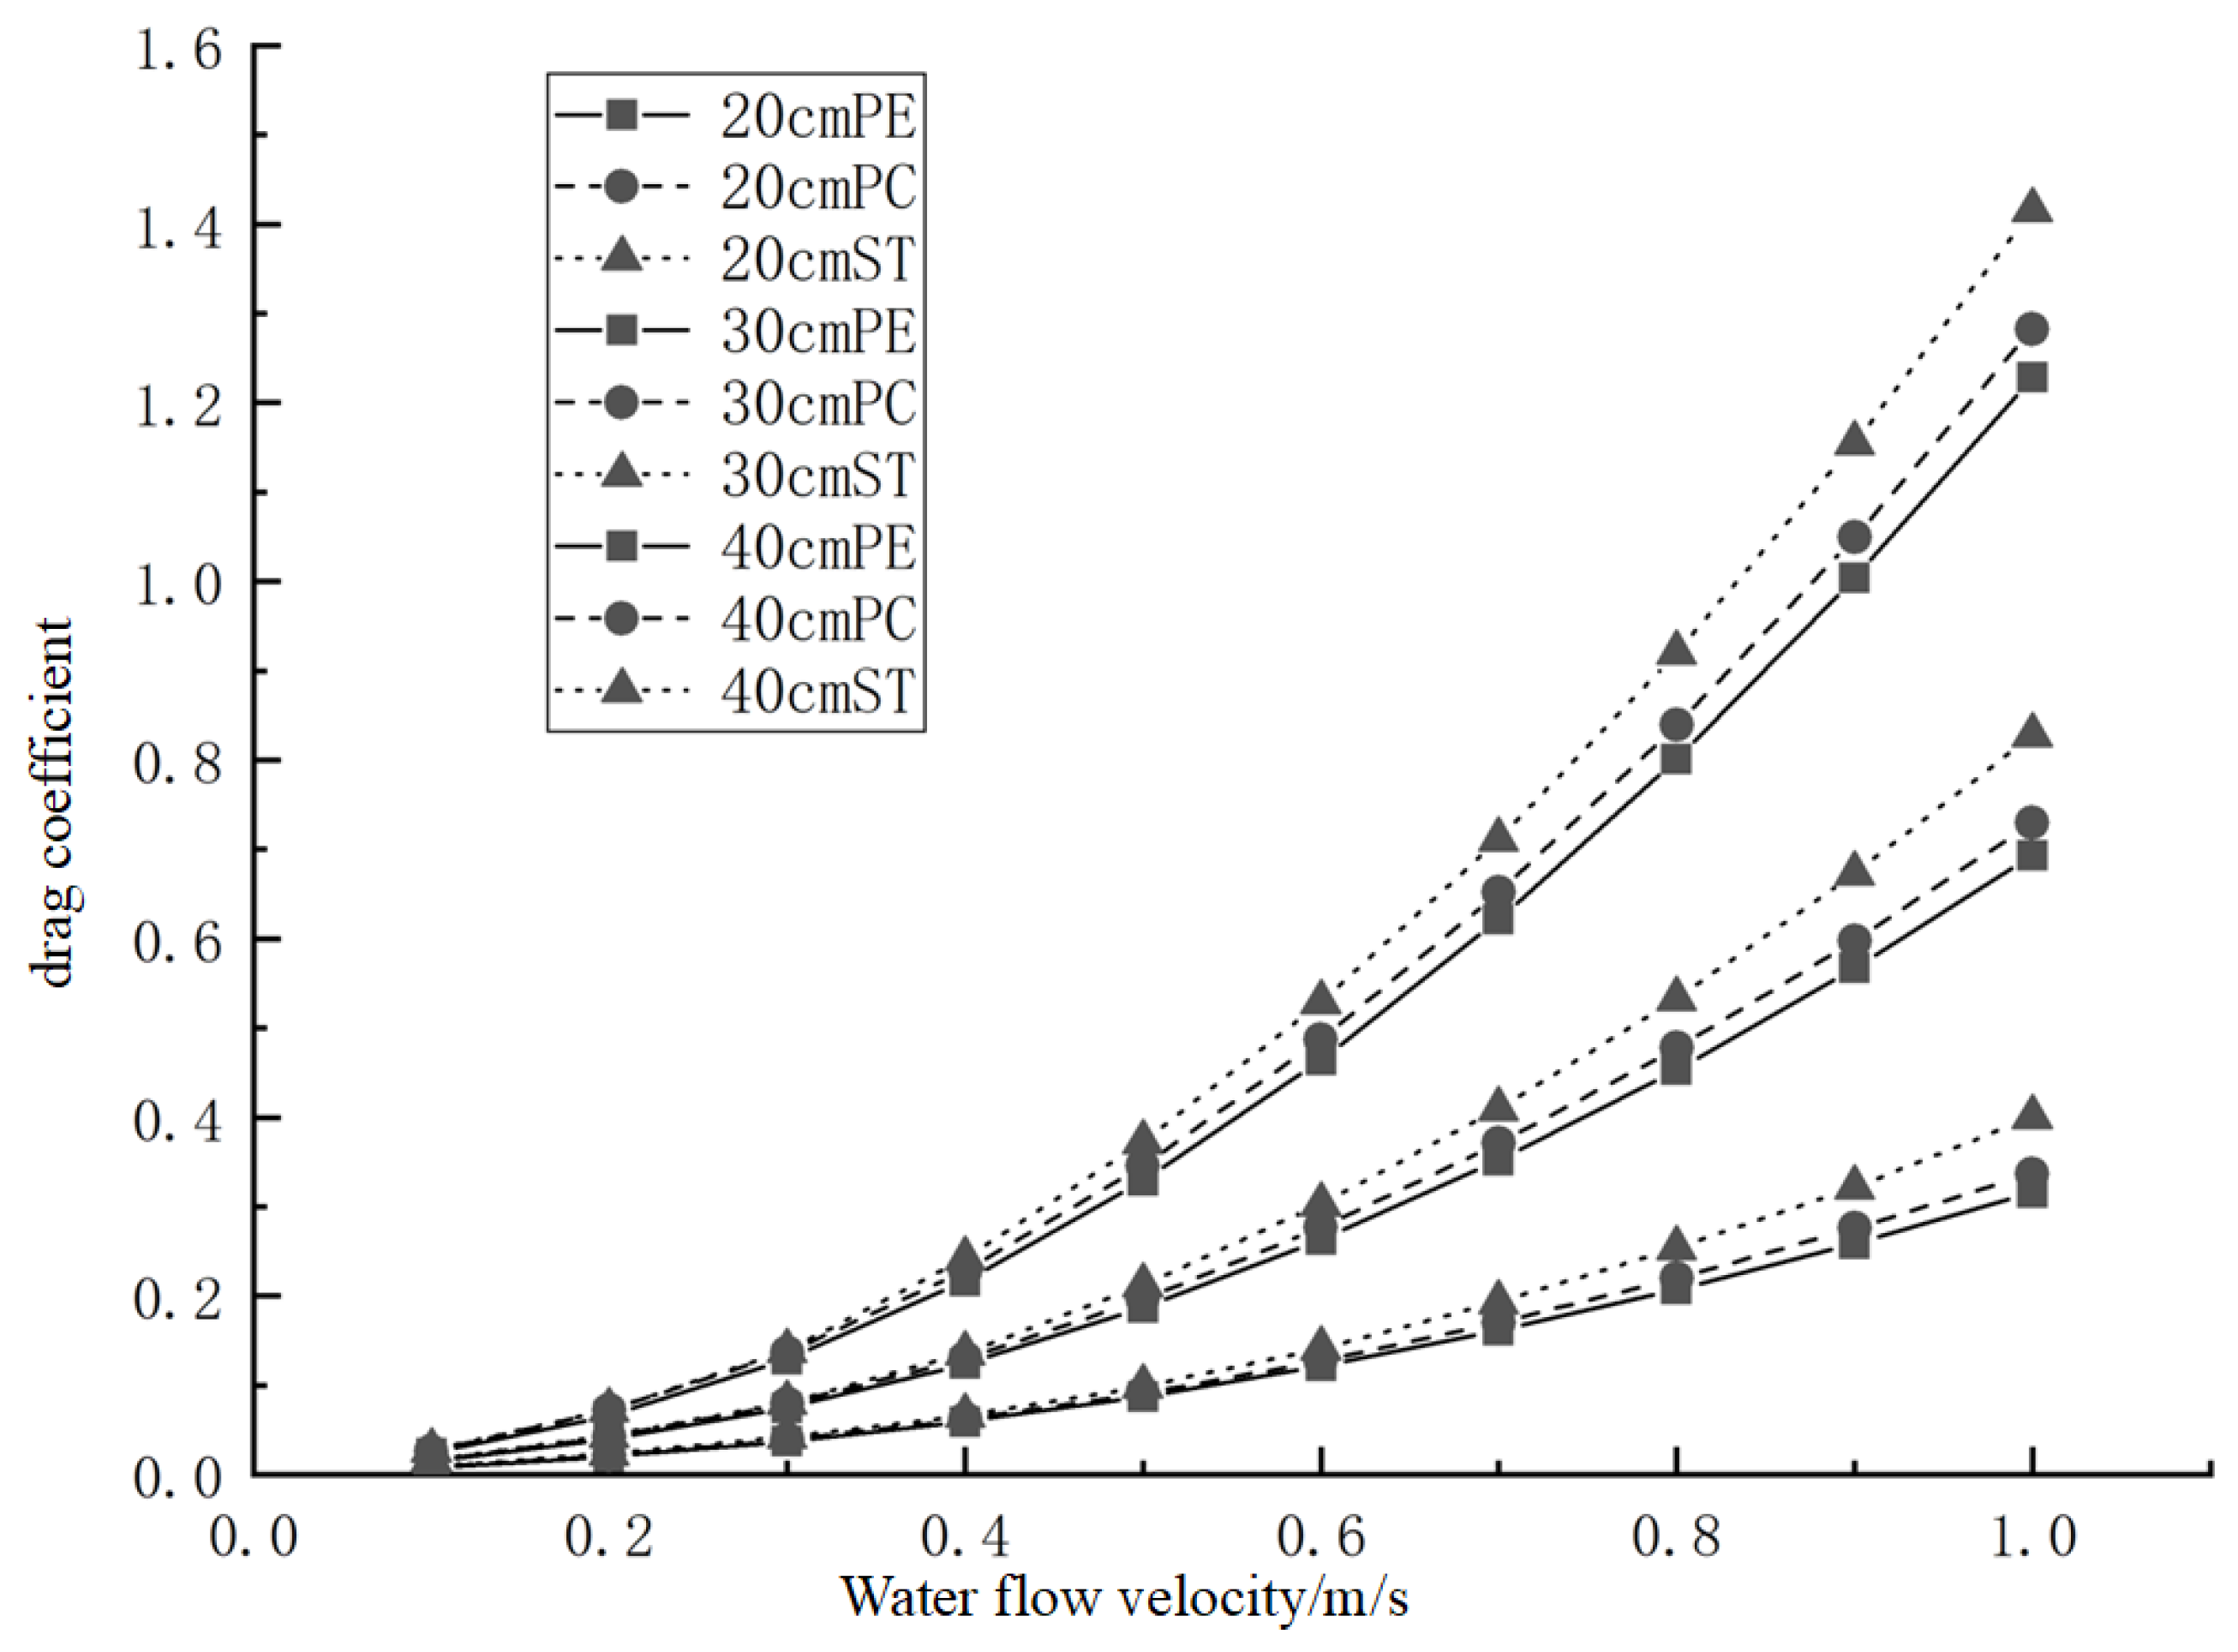
For the skin material of the large yellow croaker model, the water resistance of the PE material is better than those of the PC and ST materials. At low water velocities, the influence of the different skin materials on the water resistance, range of increase in the water resistance, and drag coefficient is significant; at high water velocities, this influence gradually decreases.

Supplementary Materials

The following supporting information can be downloaded at: https://www.mdpi.com/article/10.3390/fluids10050107/s1.

Author Contributions

Conceptualization, D.Z. and K.L.; methodology, D.Z.; software, D.Z.; validation, D.Z., K.L. and W.Q.; formal analysis, D.Z.; investigation, D.Z.; resources, D.Z.; data curation, D.Z.; writing—original draft preparation, D.Z.; writing—review and editing, D.Z.; visualization, D.Z.; supervision, W.Q.; project administration, W.Q.; funding acquisition, W.Q. All authors have read and agreed to the published version of the manuscript.

Funding

This research was funded by National Key Research and Development Program of China (NKRP), grant number 2024YFD2400605.

Data Availability Statement

Thesis-related research data have been uploaded as a Supplementary File S1.

Acknowledgments

I would like to express my heartfelt thanks to my advisor, Weiguo Qian. I would like to thank you for your careful guidance in the academic field and your care in life. From the topic selection to the final draft of the thesis, you have always shown me the right direction with your rigorous attitude and profound knowledge. I have benefited a lot from your teaching and patient guidance, which not only enhanced my scientific research ability but also cultivated my spirit of independent thinking and innovative exploration.

Conflicts of Interest

The funders had no role in the design of the study; in the collection, analysis, or interpretation of data; in the writing of the manuscript; or in the decision to publish the results.

Abbreviations

CFDComputational fluid dynamics
PEPolyethylene
PCPolycarbonate
STStructural steel
2DTwo-dimensional
3DThree-dimensional

References

  1. Lu, Q.; Fang, Z.; Chen, X.J. Evaluation of Sustainable Utilization of Fishery Resources in the Indian Ocean Based on Grey Relational Analysis. J. Guangdong Ocean Univ. 2021, 41, 61–66. [Google Scholar]
  2. Li, J.L.; Shen, M.H.; Ma, R.F.; Yang, H.S.; Chen, Y.N.; Sun, C.Z.; Liu, M.; Han, X.Q.; Hu, Z.D.; Ma, X.G. Marine resource economy and strategy under the background of marine ecological civilization construction. J. Nat. Resour. 2022, 37, 829–849. [Google Scholar] [CrossRef]
  3. Shi, K.W. The current situation and prospects of the development of ocean science popularization in China under the strategy of building a maritime power. Public Commun. Sci. Technol. 2024, 16, 35–37. [Google Scholar]
  4. Fang, N.; Huang, Z.; Zhao, T.Q.; Wang, S.H.; Chen, H.Q.; Han, G.D.; Sun, Y.Q. Dynamic Characteristic of Anti-swing Hook on Quad-rotor of Marine Crane. J. Guangdong Ocean Univ. 2024, 44, 129–138. [Google Scholar]
  5. Wang, Y.W.; Wang, Z.L.; Li, J. Research progress and development trend of biomimetic robotic fish. Mach. Des. Res. 2011, 27, 22–25. [Google Scholar]
  6. Sun, W.; Liu, S.P.; Wu, G.; Zhou, Y.X.; Ren, X.Z. Research progress and prospect of fish swimming mechanism: A review. J. Dalian Fish. Univ. 2024, 39, 698–707. [Google Scholar]
  7. Liu, J.K.; Chen, Z.L.; Chen, W.S.; Wang, L. A new type of underwater turbine imitating fish fin for underwater robot. Robot 2000, 22, 427–432. [Google Scholar]
  8. de Sousa, J.V.N.; De Macêdo, A.R.L.; de Amorim Junior, W.F.; De Lima, A.G.B. Numerical Analysis of Turbulent Fluid Flow and Drag Coefficient for Optimizing the AUV Hull Design. Open J. Fluid Dyn. 2014, 4, 263–277. [Google Scholar] [CrossRef]
  9. Kramer, M.O. Boundary Layer Stabilization by Distributed Damping. Nav. Eng. J. 2010, 72, 25–34. [Google Scholar]
  10. Divsalar, K. Improving the hydrodynamic performance of the SUBOFF bare hull model: A CFD approach. Acta Mech. Sin. 2019, 36, 44–56. [Google Scholar] [CrossRef]
  11. Yan, C. Computational Fluid Dynamics Methods and Applications; Beihang University Press: Beijing, China, 2006. [Google Scholar]
  12. Mao, H.F.; He, Y.L.; Yuan, J.P.; Pan, X.X.; Jia, B.Z. Hydrodynamic Coefficients of a Horizontal Circular Cylinder near Free Surface under Wave Action. J. Guangdong Ocean Univ. 2020, 40, 109–115. [Google Scholar]
  13. Huang, X.S.; Liu, F.; Sun, W.J.; Kong, X.H.; Liu, B.L.; Chen, X.J. Numerical simulation of hydrodynamics of bionic squid in pitching posture. J. Shanghai Ocean Univ. 2021, 30, 884–892. [Google Scholar]
  14. Yang, J.L.; Deng, Z.P.; Hou, L.; Shang, Y.L. Propulsive Performance of High Rotation Speed Paddlewheels with Different Numbers of Paddles. J. Guangdong Ocean Univ. 2024, 44, 136–142. [Google Scholar]
  15. Zhang, Z.; Wang, Q.; Zhang, S. Review of Computational Fluid Dynamics Analysis in Biomimetic Applications for Underwater Vehicles. Biomimetics 2024, 9, 79. [Google Scholar] [CrossRef]
  16. Rostamzadeh-Renani, M.; Rostamzadeh-Renani, R.; Baghoolizadeh, M.; Azarkhavarani, N.K. The effect of vortex generators on the hydrodynamic performance of a submarine at a high angle of attack using a multi-objective optimization and computational fluid dynamics. Ocean. Eng. 2023, 282, 114932. [Google Scholar] [CrossRef]
  17. Rostamzadeh-Renani, M.; Baghoolizadeh, M.; Sajadi, S.M.; Rostamzadeh-Renani, R.; Azarkhavarani, N.K.; Salahshour, S.; Toghraie, D. A multi-objective and CFD based optimization of roof-flap geometry and position for simultaneous drag and lift reduction. Propuls. Power Res. 2024, 13, 26–45. [Google Scholar] [CrossRef]
  18. Bahadir Olcay, A.; Tabatabaei Malazi, M.; Okbaz, A.; Heperkan, H.; Fırat, E.; Ozbolat, V.; Gokhan Gokcen, M.; Sahin, B. Experimental and numerical investigation of a longfin inshore squid’s flow characteristics. J. Appl. Fluid Mech. 2017, 10, 21–30. [Google Scholar]
  19. Barrett, D.S.; Triantafyllou, M.S.; Yue, D.K.P.; Grosenbaugh, M.A.; Wolfgang, M. Drag Reduction in Fish-Like Locomotion. J. Fluid Mech. 1999, 392, 183–212. [Google Scholar] [CrossRef]
  20. Xiao, H.P.; Fang, Z.F.; Zhu, C.; He, K.D.; Yang, W.H.; Ding, H.Z. Structural Drag Characteristic and Application Research of Underwater Streamlined Body. J. China Three Gorges Univ. (Nat. Sci.) 2013, 35, 92–96. [Google Scholar]
  21. Liu, J.X.; He, B.; Yan, T.H. Study on Hydrodynamic of Flounder Dual-Drive Bionic Robotic Fish. Ship Eng. 2023, 45, 84–90. [Google Scholar]
  22. Kaidong, M.; Ruirong, Z.; Xin, G.; Mingyang, X.; Yuxue, P. Shape design and flow field characteristics of a robotic fish imitating the head of a hammerhead. Chin. J. Theor. Appl. Mech. 2021, 53, 3389–3398. [Google Scholar]
  23. Tian, X.J.; Liu, Y.X.; Liu, G.J. Tuna 3D-Modeling and Stress Calculation in Flow Field. Period. Ocean Univ. China 2019, 49, 139–144. [Google Scholar]
  24. Zhou, P.X.; Hu, Q.S. Carp 3D-modeling and stress calculation in flow field. J. Shanghai Ocean Univ. 2013, 22, 855–861. [Google Scholar]
  25. Chen, H.K. Mechanism Research on the Swimming and Maneuvering of Robot Fish; University of Science and Technology of China: Hefei, China, 2006. [Google Scholar]
  26. Han, Z.Z.; Wang, J.; Lan, X.P. Fluent: Fluid Engineering Simulation Calculation Examples and Applications; Beijing Institute of Technology Press: Beijing, China, 2004. [Google Scholar]
  27. Wang, F.X. Computational Fluid Dynamics Analysis: Principles and Applications of CFD Software; Qinghua University Press: Beijing, China, 2004. [Google Scholar]
  28. Candelier, F.; Boyer, F.; Leroyer, A. Three-dimensional extension of Lighthill’s large-amplitude elongated-body theory of fish locomotion. J. Fluid Mech. 2011, 674, 196–226. [Google Scholar] [CrossRef]
  29. Liu, Q.Z. Research on Hydrodynamics of Tidal Turbine Bionic Blades; Dalian University of Technology: Dalian, China, 2018. [Google Scholar]
  30. Geng, W.B.; Wei, Y.K.; Hong, S.F.; Huang, J.J. Shape Design and Numerical Analysis of Flow Field Resistance of Bionic Robot Fish. Digit. Ocean Underw. Warf. 2024, 7, 318–325. [Google Scholar]
  31. Feng, Y.K.; Liu, H.X.; Su, Y.Y.; Su, Y.M. Numerical simulation on hydrodynamic preformance of fast-start for bionic robotic fish. J. Huazhong Univ. Sci. Technol. 2020, 48, 33–39. [Google Scholar]
  32. Li, G.H.; Feng, N.; Liu, G.J. Flat Drag Reduction Method Based on Biomimetic Fish-body Structure. J. Unmanned Undersea Syst. 2021, 029, 80–87. [Google Scholar]
  33. He, J.H.; Zhang, Y.H.; Dong, S.W. Design and Thrust Analysis of Bionic Caudal Fin with Variable Area. Light Ind. Mach. 2022, 40, 8–16. [Google Scholar]
  34. Ge, F.F.; Shen, C.; Xie, O. Research on hydrodynamic characteristics of crescent-shaped tail fins based on bidirectional fluid-structure coupling simulation. J. Suzhou Univ. Sci. Technol. Eng. Technol. Ed. 2023, 36, 74–80. [Google Scholar]
  35. Zhao, D.S. Design and Realization of Tuna-like Software Robot; Shenyang University of Technology: Shenyang, China, 2021. [Google Scholar]
  36. Xie, O.; Sun, Z.G.; Shen, C.; Ge, F.F. The Underwater Dynamic Targets Coupled Hydrodynamic Field Characteristics of Flexible Motion Lateral Line Sensing. J. Detect. Control 2024, 46, 131–137. [Google Scholar]
Figure 1. Sampling diagram of large yellow croaker.
Fluids 10 00107 g001
Figure 2. Dorsal and abdominal contour lines of 1-month-old large yellow croakers.
Fluids 10 00107 g002
Figure 3. Dorsal and abdominal contour lines of 4-month-old large yellow croakers.
Fluids 10 00107 g003
Figure 4. Dorsal and abdominal contour lines of 7-month-old large yellow croakers.
Fluids 10 00107 g004
Figure 5. Dorsal and abdominal contour lines of 10-month-old large yellow croakers.
Fluids 10 00107 g005
Figure 6. Dorsal and abdominal contour lines of 12-month-old large yellow croakers.
Fluids 10 00107 g006
Figure 7. Two-dimensional models of large yellow croakers at (ae) 1, 4, 7, 10, and 12 months old, respectively.
Fluids 10 00107 g007
Figure 8. Three-dimensional model of a large yellow croaker.
Fluids 10 00107 g008
Figure 9. Two-dimensional fluid domain model.
Fluids 10 00107 g009
Figure 10. Three-dimensional fluid domain model.
Fluids 10 00107 g010
Figure 11. Meshes of experimental models at (ae) 1, 4, 7, 10, and 12 months old, respectively; (f) 3D experimental model mesh.
Fluids 10 00107 g011
Figure 12. Water resistance of different age models.
Fluids 10 00107 g012
Figure 13. Drag coefficient of different age models.
Fluids 10 00107 g013
Figure 14. Water resistance of different body length models.
Fluids 10 00107 g014
Figure 15. Drag coefficient of different body length models.
Fluids 10 00107 g015
Figure 16. Water resistance of different material models.
Fluids 10 00107 g016
Figure 17. Drag coefficient of different material models.
Fluids 10 00107 g017
Table 1. Body length and width of large yellow croakers by age.
Age of Large Yellow Croaker (Months)Body Length (mm)Body Width (mm)
134.89
4129.725.4
7181.537
10228.548.8
1229072.8
Table 2. Grid-independent verification.
Two-DimensionalThree-Dimensional
Number of GridsRelative Error/%Number of GridsRelative Error/%
2,107,8911.7793,098,3221.697
3,298,7711.3114,289,1321.233
4,683,9820.9715,447,6550.879
Table 3. Cross-validation of test methods.
Attack Angle/°Drag Coefficient
Sink ExperimentSimulation Test
00.01630.01467
30.03460.02975
60.05650.04955
90.08140.07505
120.09830.08818
150.22620.19880
Disclaimer/Publisher’s Note: The statements, opinions and data contained in all publications are solely those of the individual author(s) and contributor(s) and not of MDPI and/or the editor(s). MDPI and/or the editor(s) disclaim responsibility for any injury to people or property resulting from any ideas, methods, instructions or products referred to in the content.

