Article

A Qualitative Numerical Study on Catalytic Hydrogenation of Nitrobenzene in Gas-Liquid Taylor Flow with Detailed Reaction Mechanism

1
Institute of Catalysis Research and Technology, Karlsruhe Institute of Technology (KIT), Engesserstr. 20, 76131 Karlsruhe, Germany
2
Institute for Chemical Technology and Polymer Chemistry, Karlsruhe Institute of Technology (KIT), Engesserstr. 20, 76131 Karlsruhe, Germany
*
Author to whom correspondence should be addressed.
Present Address: National Energy Technology Laboratory, Morgantown, WV 26505, USA.
Fluids 2020, 5(4), 234; https://doi.org/10.3390/fluids5040234
Submission received: 2 November 2020 / Revised: 30 November 2020 / Accepted: 3 December 2020 / Published: 8 December 2020
(This article belongs to the Special Issue Recent Advances in Single and Multiphase Flows in Microchannels)

Abstract

:
While the number of computational studies considering two-phase flows in microfluidic systems with or without mass transfer is increasing, numerical studies incorporating chemical reactions are still rare. This study aims to simulate the catalytic hydrogenation of nitrobenzene in gas-liquid Taylor flow by combining interface-resolving numerical simulations of two-phase flow and mass transfer by a volume-of-fluid method with detailed modeling of the heterogeneous chemical reaction by software package DETCHEMTM. Practically relevant physical properties are utilized for hydrodynamic and mass transfer simulations in combination with a preliminary reaction mechanism based on density functional theory. Simulations of mass transfer are conducted using a predetermined velocity field and Taylor bubble shape. At the beginning of the simulation when liquid nitrobenzene is not saturated by hydrogen, axial profiles of surface species concentrations and reaction rates show local variations. As hydrogen dissolves in nitrobenzene, the concentration profiles of surface species at the wall become uniform, eventually reaching an equilibrium state. Neglecting the local variation in a short initial period will allow further simplification of modeling surface reactions within a Taylor flow.

Graphical Abstract

1. Introduction

Microfluidic systems operating with continuous multiphase flows have emerged as an attractive technology characterized by fast heat (and mass) transfer, efficient mixing, short residence time and an absence of hydrodynamic dispersion [1]. The predominant two-phase flow pattern in microchannels at sufficiently low gas and liquid superficial velocities is segmented flow, which consists of a sequence of elongated gas bubbles (Taylor bubbles [2]) separated by liquid slugs. Segmented flow (also known as Taylor flow) significantly improves chemical reaction rates and efficiency [3] and is beneficial for multiphase monolith reactors [4] by means of a very thin liquid film between bubbles and catalytic wall as well as large interfacial area [5]. Several studies report that the interfacial mass transfer within Taylor flow that governs the reaction efficiency depends on liquid phase diffusion coefficient [6], linear velocity [7], gas superficial velocity [8] or channel size [9]. Recent reviews provide detailed insight on the subject [10,11,12].
The hydrogenation of nitrobenzene is a designated reaction within the framework of the Helmholtz-Energy-Alliance (HEA) project “Energy-efficient chemical multiphase processes” [13]. The first mechanism proposed for this reaction is the Haber mechanism [14] composed of multiple steps of electrochemical reductions accompanying nitrosobenzene and phenylhydroxylamine intermediates. Despite this pioneering reaction mechanism, most early studies [15,16] are focused on empirical kinetic models that consist of simple functions of the fractional order of reactants without definite relation to the reaction mechanism. A few studies [17,18] have established a system of reduced differential equations to determine the rates of elementary reactions from the experimental observation. Gelder et al. [19] suggest a new mechanism with Pd-hydroxyamino being a common surface intermediate instead of nitrosobenzene. Although the reaction has long been studied in a wide range of conditions with respect to phase, solvent and catalysts, many studies conclude that its mechanism has not been fully elucidated yet. Thus, simplified global reaction mechanisms such as the Langmuir-Hinshelwood type mechanism have been widely used in the optimization of reaction processes dictated by, for example, liquid-gas or liquid-solid mass transfer, solubility, operating pressure and stirring speed [20,21,22,23]. Recently, models based on the density functional theory enable the reaction path analysis and determination of activation energies for the constituent elementary steps [24,25].
Although Taylor flow is an attractive gas-liquid flow pattern for hydrogenation of nitrobenzene [26,27], the established reaction mechanisms are mostly employed to the numerical studies on simple zero-dimensional batch reactor models due to the computational complexity, especially for resolving the interface. In the same context, early studies mostly assume a fixed shape of single or multiple bubbles instead of solving the bubble shapes depending on full interaction among the inertial force, viscous force and surface tension. With the prescribed bubble shape, only the flow in the continuous liquid phase is solved [28,29,30,31] in combination with mass transfer calculations [32,33] in the frame of reference moving with the bubble. With the growth of computational power, interface-resolving simulations with the volume-of-fluid (VOF) and level-set methods became more popular as these enable accurate prediction of the realistic shape of the bubble as a part of the solution [34]. Numerical studies that do not assume a given bubble shape employ either a moving frame of reference [35,36] or a fixed frame of reference. In the latter case, a single bubble is placed in the computational domain in combination with periodic boundary conditions in flow direction, the so-called unit-cell concept [37,38]. In addition, the adaptive mesh refinement technique that aligns the grid with the interface benefits from its immanently accurate computation of interfacial heat [39] and mass transfer [40,41]. Recent reviews by Gupta et al. [42] and Talimi et al. [43] provide an overview of the state-of-the-art techniques and limitations of numerical modeling on the hydrodynamic and mass transfer within a Taylor flow. Most of these studies are interested in flow and mass transfer patterns and overall mass transfer coefficients. The consumption and production of species as results of reactions have been very rarely investigated due to the lack of information required to consider practically relevant conditions. Detailed reaction mechanisms, which play a key role in exploring the underlying reaction characteristics, have not yet been applied in simulations of Taylor flows.
The objective of this study is to combine interface-resolving numerical simulations of gas-liquid Taylor flow with detailed modeling of surface reactions occurring at the solid catalytic wall. For this purpose, a computational model has been accomplished by coupling two computer codes, TURBIT-VOF [38,44] and DETCHEMTM [45]. TURBIT-VOF is an interface-resolving solver based on geometric VOF method computing hydrodynamics of gas-liquid flows and mass transfer of dilute species in both phases. DETCHEMTM (for DETailed CHEMistry) is a software package for modeling multiphase reactive flows designed to handle detailed reaction mechanisms. A recent study in the same context provides a useful step toward modeling catalytic gas-liquid Taylor flows at practically pertinent conditions [46]. The previous work is focused on the determination of physical properties and test conditions to set up practically applicable simulations with a simplified one-step global reaction mechanism ( C 6 H 5 NO 2 + 3 H 2 C 6 H 5 NH 2 + 2 H 2 O ). Using an identical computational configuration, the present study extends the capability of the solver with a view of applying detailed reaction mechanisms. The coupled solver employs two-dimensional (planar) isothermal flow within a single unit-cell. The Taylor flow hydrodynamics is assumed to be unaffected by solutes or reaction products, as usual for many other studies regarding two-phase mass transfer [38,47,48,49,50]. Therefore, the velocity field and bubble shape of fully developed quasi-steady Taylor flow are predetermined and employed as frozen fields when solving unsteady two-phase mass transfer and catalytic reactions to reduce computational efforts without sacrificing accuracy. The catalytic hydrogenation of nitrobenzene consists of a series of elementary reaction steps of intermediate surface species, which highly depend on the catalyst utilized in the process, and no detailed mechanism for this reaction is available in the literature. Thus, a preliminary reaction mechanism based on the activation energies from density functional theory is modified for this study. Although the reaction mechanism is not validated, it is useful to demonstrate the proof of concept of our numerical approach. To our knowledge, this is the first time that an interfacial CFD computation of gas-liquid Taylor flow is combined with a detailed mechanism for heterogeneous catalytic reactions. As a feasibility study, the bulk and intermediate surface species alongside the progress of mass transfer from the gas bubble to the catalyst wall are qualitatively analyzed.

2. Numerical Methodology

This section introduces some general assumptions followed by the governing equations for hydrodynamics and mass transfer. Finally, the coupling methodology between the computer codes TURBIT-VOF and DETCHEMTM is explained.

2.1. General Assumptions

The solution procedure of the coupled computer code consists of several consecutive steps based on the assumptions, applying with a view to efficient computation. Firstly, the coupled solver assumes that mass transfer and reactions do not affect the hydrodynamics of gas-liquid flow. This assumption allows significant reduction of the computation time by decoupling hydrodynamic and mass transfer calculations. During the physical time span of 5 ms in this study, the produced aniline concentration in the previous numerical study [46] is less than 0.001% of nitrobenzene concentration. This agrees with the results from an experimental study [21] which shows that it takes about 50 min to completely convert half a liter of nitrobenzene. Thus, the assumption is only valid for the simulations covering a short physical time for which negligible influence of mass transfer and reactions on liquid composition is presumed. In the same context, the solver employs constant fluid properties (density, viscosity, surface tension) corresponding to given pressure (p) and temperature (T). Potential effects of the heat of reaction and any phase change are thus neglected. Due to the small channel size, gravity/buoyancy forces are neglected as well.
With these assumptions, the mass transfer and reactions are computed on the predetermined Taylor bubble shape at the quasi-steady flow field in the moving reference frame. The decoupled solution procedure is beneficial for mass transfer computation by omitting the calculation of momentum equations including the time-consuming solution of the pressure Poisson equation. The Taylor bubble consists of pure hydrogen gas and its volume is kept constant. Further details on the solution procedure upon the moving reference frame and estimation of physical properties are described in Woo et al. [46].
The two immiscible and incompressible fluids are modeled by non-dimensional locally volume-averaged single-field conservation equations [38,51]. The reference quantities for normalization are denoted by subscript ref (ref) and the non-dimensional variables and differential operators are denoted by superscript *, i.e., t * = ( L ref / U ref ) t and   * = L ref .

2.2. Hydrodynamic Equations

The governing equations for hydrodynamic simulations consist of non-dimensional continuity and momentum conservation equations given by:
u m * = 0 ,
t * ( ρ m * u m * ) + ( ρ m * u m * u m * ) = P * + L ref ρ ref U ref 2 Δ p UC L UC e ^ axial + f μ L + ( 1 f ) μ G ρ ref U ref L ref [ u m * + ( u m * ) T ] + L ref ρ ref U ref 2 σ a int V κ n ^ int ,
where the subscript m denotes the mixture properties of two phases. ρ m and u m are the non-dimensional mixture density and velocity, defined as:
ρ m * : = f ρ L + ( 1 f ) ρ G ρ ref , u m * : = f ρ L u ¯ L V L + ( 1 f ) ρ G u ¯ G V G ρ m U ref
Here, ρ L and ρ G denote the density of each phase, u ¯ L V L and u ¯ G V G are the intrinsic mean velocities of the phases within a mesh cell, and f is the liquid volume fraction.
The specific form of the momentum Equation (2) is suitable for computation of the immiscible two-phase flow in the unit cell configuration. The meaning of the non-dimensional terms on the right-hand side is as follows. The first term corresponds to the gradient of the reduced (periodic) pressure, P * , while the second term represents the pressure gradient along the unit cell that drives the flow in axial direction ( e ^ axial ). The third and fourth terms represent viscous forces and surface tension forces containing the properties, μ L and μ G —viscosities of each phase, σ —the surface tension coefficient, a int V —the volume-specific interfacial area within a mesh cell, κ —the interface curvature and n ^ int —the unit normal vector to the interface pointing into the liquid phase.
The liquid volume fraction is solved by a geometric VOF method to ensure the sharpness of the interface while taking advantage of the excellent mass conservation properties of VOF methods. The transport equation of liquid volume fraction is defined by:
t * f + f u m * = 0
The mesh cells either with f = 1 or with f   =   0 correspond to the cells completely consisting of liquid or gas, respectively. In each mesh cell with 0 < f < 1 where both phases coexist, the exact plane interface reconstruction algorithm (EPIRA) determines the orientation (normal vector) and location of the plane interface therein. Interface curvature is computed as divergence of the unit normal vector, see References [44,51] for details. The set of hydrodynamic Equations (1), (2) and (4) is solved by a finite-volume pressure correction method using a structured, staggered Cartesian grid, in combination with an explicit third-order time integration Runge-Kutta method.
By this procedure, the velocity field in both phases is obtained in the fixed frame of reference in combination with the quasi-steady bubble shape. By subtracting the bubble velocity, the velocity field is transformed into the moving frame of reference. Using this pre-determined phase distribution and velocity field, the concentration Equation (5) is solved for a number of species to determine mass transfer with heterogeneous reactions in a moving reference frame, as detailed below.

2.3. Mass Transfer Equations

The single-field non-dimensional species transport equations in the absence of homogeneous reactions are represented as:
t * c m , i * + ( c m , i * u m * ) = j m , i *
where i denotes the index of species [38]. The non-dimensional mixture concentration is given by:
c m , i * : = f c ¯ L , i V L + ( 1 f ) H i cc c ¯ G , i V G c ref
where c ¯ L , i V L and c ¯ G , i V G are the intrinsic mean concentrations of species i in the liquid and the gas within a mesh cell volume. Here, the term “mixture” refers not to the mixture of different species but is consistently used for the mixture of two phases. The definition of the mixture concentration enables converting the discontinuous two-phase physical concentration fields to a single-field continuous concentration that is favorable for numerical computation [52,53]. H i cc is the dimensionless Henry number corresponding to the ratio of concentrations in both continuous phases (therefore, superscript cc) dictated by thermodynamic equilibrium:
H i cc : = c L , i c G , i
The non-dimensional diffusive flux on the right-hand side of Equation (5) is defined by:
j m , i * = D m , i * c m , i *
where D m , i * is the dimensionless two-phase mixture diffusivity, defined as:
D m , i * : = f D L , i + ( 1 f ) D G , i U ref L ref
The transformation of concentration fields by Equation (6) necessitates the continuous concentration diffusivity model (CCDM) [38,54] to ensure the continuity of species mass fluxes across the phase interface. Under highly diluted conditions, the composition-dependent diffusivity almost equals the binary diffusion coefficient [54]. Thus, the diffusivities of species i in the liquid and gas phase D L , i and D G , i in Equation (9) in this study are approximated by the binary diffusion coefficient of species i in nitrobenzene. The catalytic surface reactions are implemented as reactive fluxes boundary conditions at the wall, as explained in the next subsection.

2.4. Coupling Mass Transfer Simulation and Surface Chemistry

Within the present approach, the computer code TURBIT-VOF solves for mass transfer in the two-phase flow, while DETCHEMTM handles heterogeneous chemical reactions. Both solvers are coupled via the reactive wall where the catalytic reactions take place.
The rates of surface reactions are computed as:
s ˙ i = j = 1 N r ν i , j k j i = 1 N s c s , i
Here, N r is the number of surface reactions, N s is the number of surface species, ν i , j is the stoichiometric coefficient of the i -th component in the j -th reaction and k j is the rate constant. Concentrations of surface species c s , i are given in units of mol   m 2 . In DETCHEMTM [45], concentrations of surface species are determined by:
c s , i = Γ s θ i ψ i
where θ i denotes the surface coverage fraction and Γ s is the surface site density. Furthermore, ψ i is the number of sites occupied by one particle of the species i , which is assumed to be unity in this study. In addition to a reaction mechanism, DETCHEMTM also requires thermodynamic properties (e.g., polynomial coefficients) and transport properties (e.g., Lennard-Jones parameters) as additional inputs.
An Arrhenius expression with pre-exponential factor A j is used to describe kinetic rate constants for surface reactions:
k j = A j exp ( E a , j R T ) i = 1 N s exp ( ν i , j ε i θ i R T )
Equation (12) accounts for coverage-dependent changes in the activation barrier E a , j . The corresponding contributions, ε i , are incorporated in the calculation of the activation energy according to the repulsive self-interactions of adsorbed species i on the surface. The stoichiometric coefficient ν i , j accounts for the molecularity of the considered species i with coverage dependency ε i , in step j .
Rate constants for the adsorption of bulk species are modeled through sticking coefficients [45,55]. In this case, the surface reaction rates are computed as:
s ˙ i = s i 0 R T 2 π M i c b , i
Here, s i 0 is the initial sticking coefficient, c b , i is the bulk concentration in the proximity of the wall and M i is the molar weight.
Figure 1 schematically illustrates the data exchange procedure between the two computer codes at the reactive wall. Non-dimensional variables in TURBIT-VOF and dimensional variables in DETCHEMTM are converted via reference values ( c ref , U ref ). At time step N , wall concentrations from TUBBIT-VOF are used as inputs for DETCHEMTM to calculate the surface reaction rates by Equation (10). Since TURBIT-VOF is based on a finite-volume method, (non-dimensional) bulk concentrations c m , i * are associated with mesh cell centers. Values of c m , i * in mesh cells adjacent to the wall are therefore extrapolated to bulk concentrations at the catalytic surface ( c m wall , i * ) and are converted to dimensional values c b , i = c m wall , i * c ref .
The rates by which surface coverages change due to adsorption, surface reaction and desorption are generally much faster than the rate by which the bulk species diffuse. Therefore, the pseudo-equilibrium steady-state surface coverages are internally estimated in DETCHEMTM by:
d c s , i d t = s ˙ i
For each of the N s surface species, Equation (14) is numerically integrated until pseudo-equilibrium, where both sides of the equation become zero. The concentrations of bulk species are kept constant during the integration. The internal integration of surface coverages matches the time scales of changing both bulk species and surface species for Equation (10). The resulting surface reaction rates are reconverted to non-dimensional forms, s ˙ i * , and employed in TURBIT-VOF as a boundary condition at the reactive wall for the next time step:
s ˙ i * F cat / geo = j m wall , i *
Here, F cat / geo is the ratio between catalytic surface area and geometric surface area, while j m wall , i * is the non-dimensional diffusive flux normal to the wall.

3. Chemical Model

This section introduces the preliminary reaction mechanism for surface chemistry. The mechanism is tested for a continuously stirred tank reactor (CSTR), which represents the simplest zero-dimensional reactor in DETCHEMTM, before applying it to Taylor flow in Section 4.

3.1. Reaction Mechanism

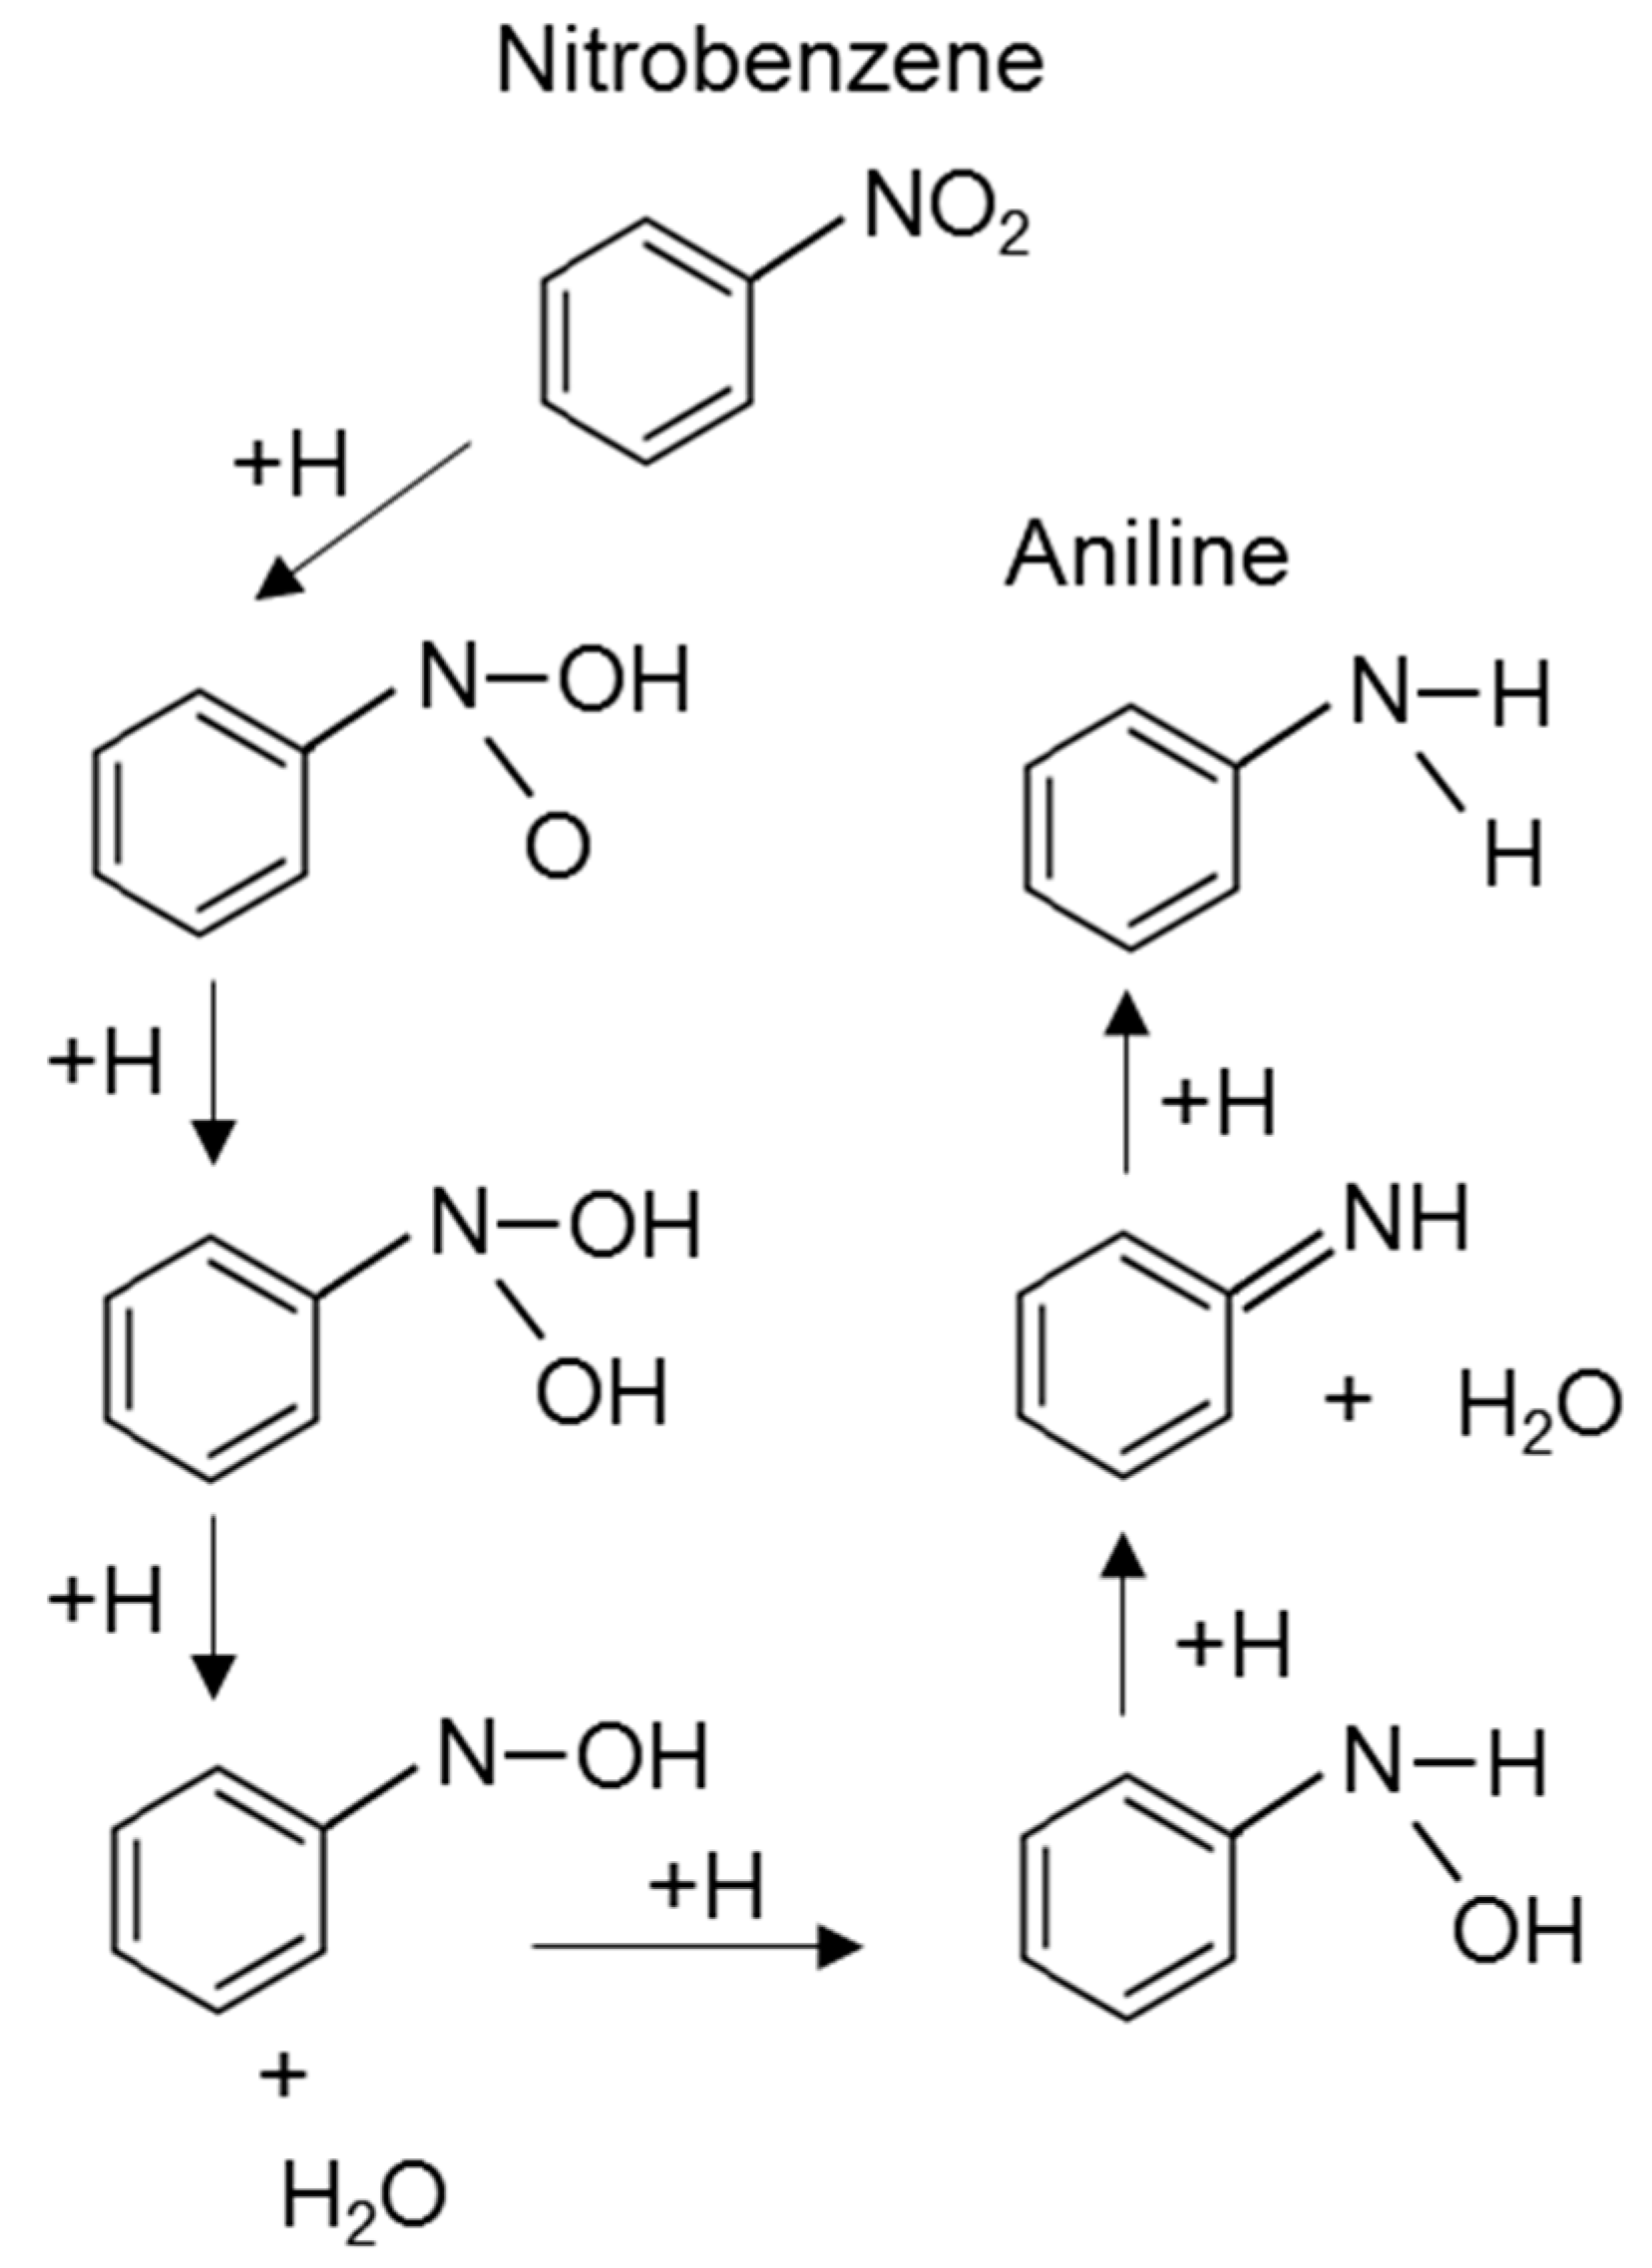
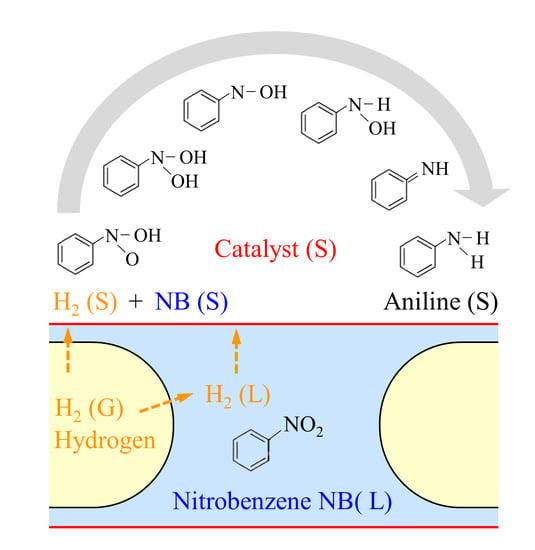
Due to the absence of a detailed reaction mechanism for catalytic hydrogenation of nitrobenzene to aniline in the literature, an unvalidated mechanism proposed by Zhang et al. [24] is used as a starting point for the present study. Zhang et al. [24] performed calculations by density functional theory (DFT) and proposed several potential reaction paths for the nitrobenzene hydrogenation on the bimetallic catalyst of platinum and palladium (Pd). Here, the simplest mechanism B shown in Figure 2 with six consecutive surface reactions is selected.
Based on the reaction path in Figure 2, the reaction mechanism listed in Table 1 has been developed, which considers N r = 20 surface reactions involving N s = 9 surface species, including H ( s ) and H 2 O ( s ) . Species names with a suffix (s) refer to surface species, which can be either adsorbed bulk species or intermediates of the heterogeneous reaction. Reactions R1–R8 correspond to adsorption and desorption of hydrogen, nitrobenzene, aniline and water, respectively. The activation energies of desorption for hydrogen and water over Pd surface were taken from Stotz et al. [55]. Reactions R9–R20 correspond to the six surface reactions of Figure 2 with both forward and backward directions. The density function theory provides the activation energies, E a , j , for each elementary reaction step shown. The pre-exponential factors, A j , in Table 1 are assumed by transition state theory [56]. Rate constants for adsorption reactions (R1, R3, R5, R7) are modeled through sticking coefficients, s i 0 [55]. It should be noted that the reaction mechanism displayed in Figure 2 in combination with the parameters given in Table 1 is a preliminary estimation and in no way validated by experiments.

3.2. Continuously Stirred Tank Reactor

As a first study of the ad hoc reaction mechanism given in Table 1, the test case of a continuously stirred tank reactor is computed. The pressure for this calculation is 0.4 MPa. The initial temperature is 400 K, which is the minimum valid temperature for the mechanism. The reactor volume and catalytic surface area are 1 m 3 and 1 m 2 , respectively. Initial species composition (in terms of mole fractions) consists of 14% of nitrobenzene, 50% of hydrogen and the rest being nitrogen as an inert species. Surface sites are initially vacant and free of any surface species represented by the unity site fraction of Pd, θ ( s ) = 1 . With these conditions, DETCHEMCSTR [45] computes zero-dimensional species and energy equations. Thermodynamic properties for the species employed in this reaction mechanism are estimated by the set of polynomial coefficients from Burcat and Ruscic [57].
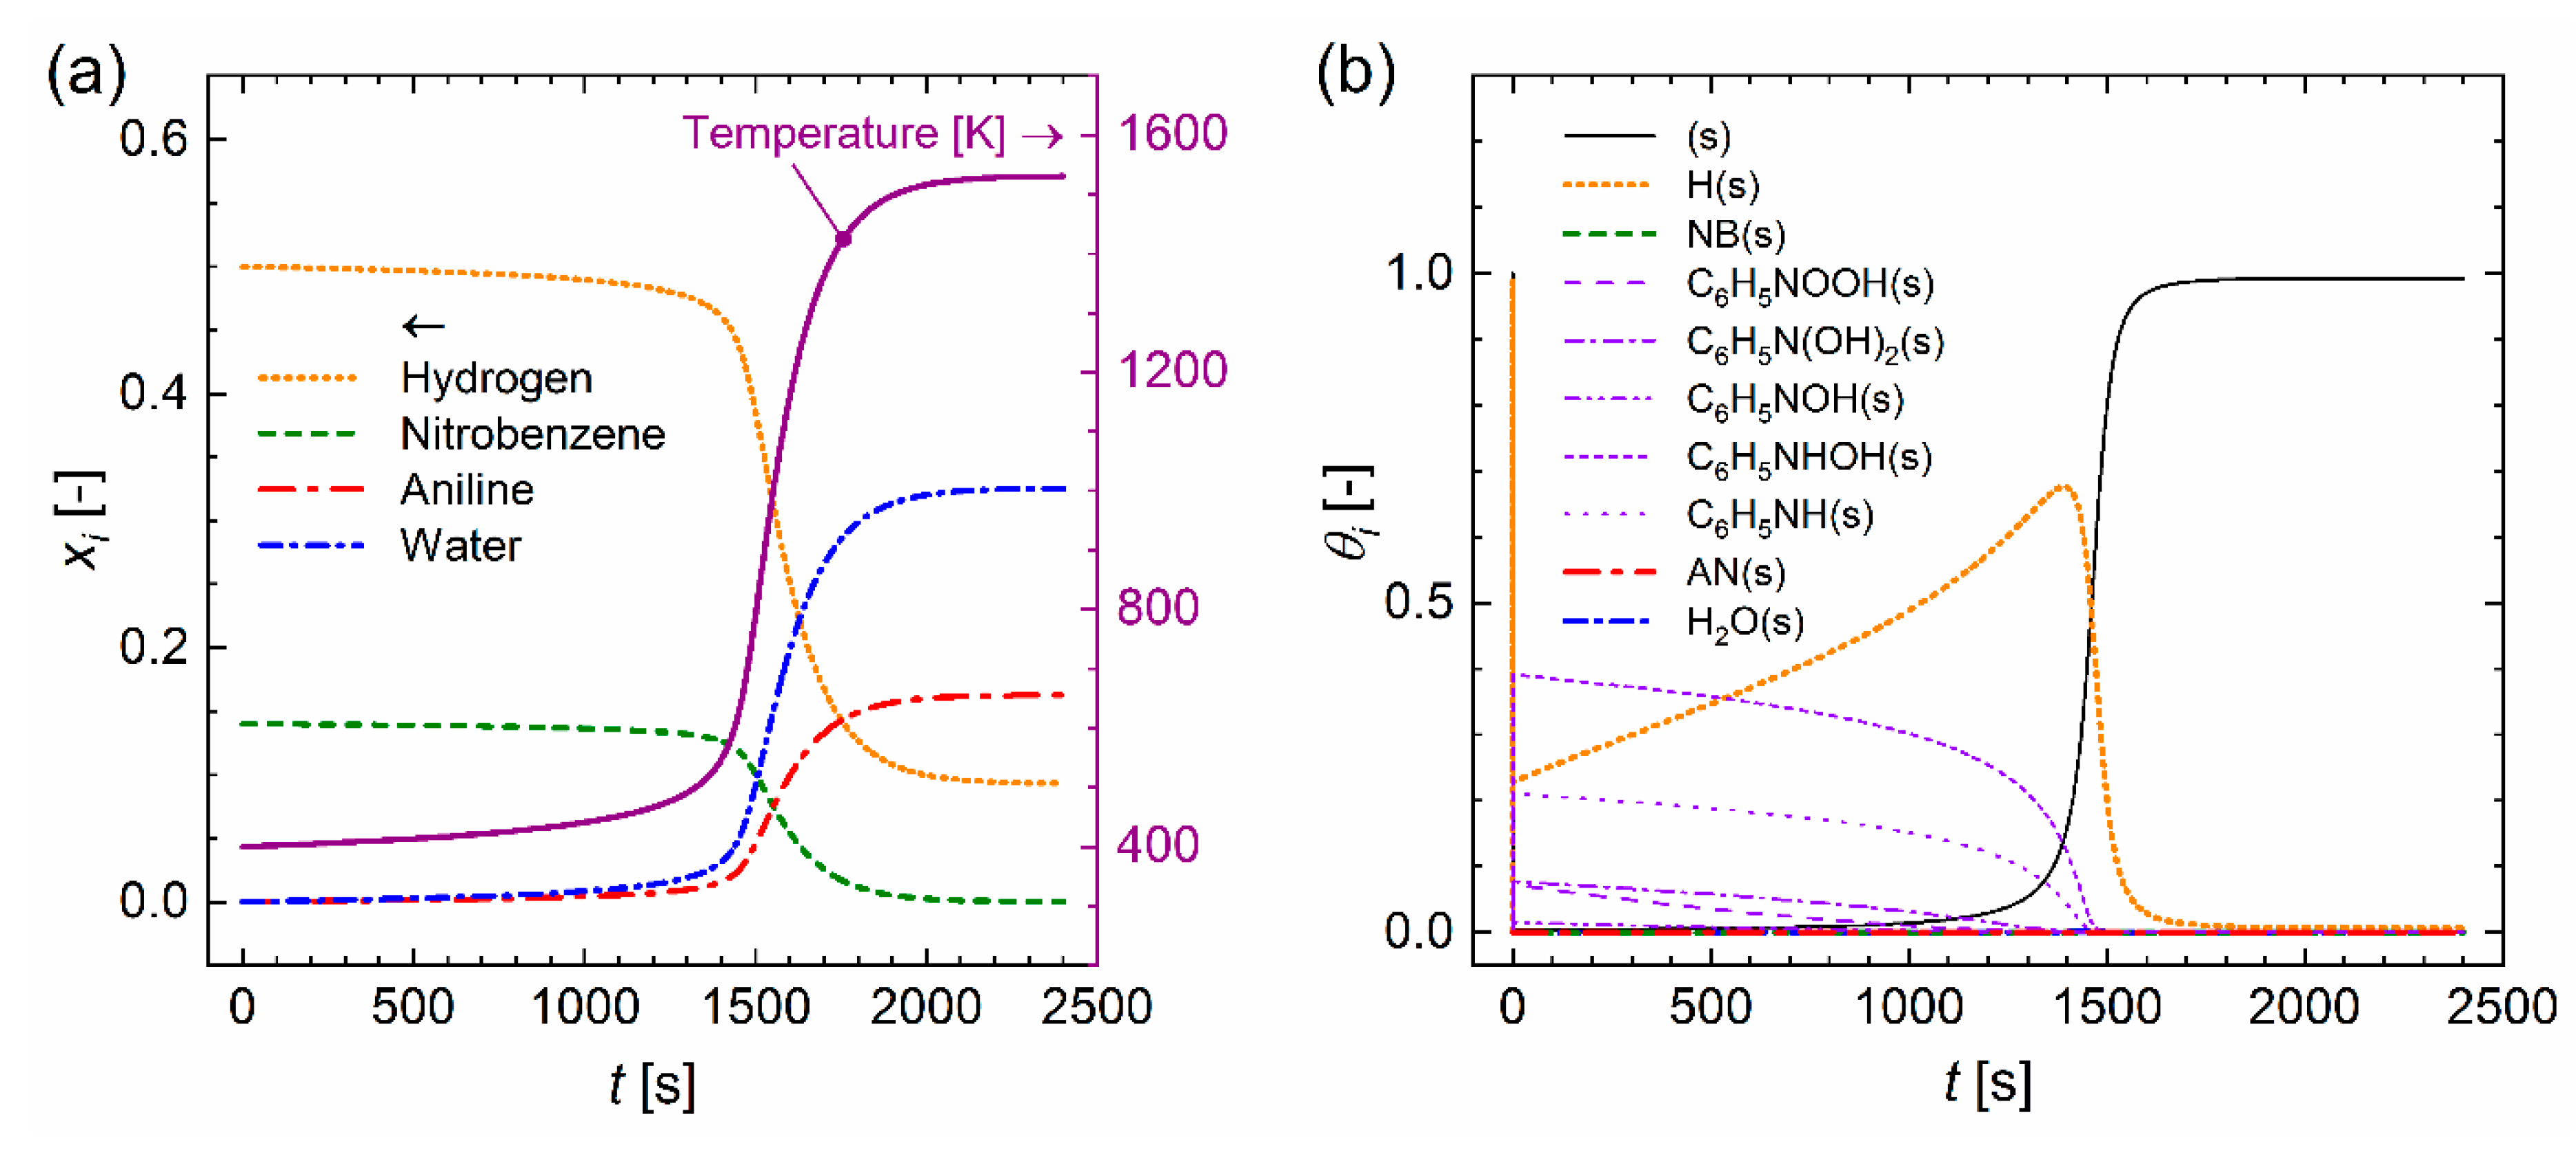
Figure 3 shows the time evolution of temperature, bulk species and surface site fractions from the CSTR example. Until approximately 1400 s, the temperature and mole fractions are almost constant due to the low reaction rate at low T . After the reaction ignites, temperature increases drastically, and rapid species conversion occurs. The reaction ends after exhaustion of nitrobenzene.

4. Hydrogenation of Nitrobenzene in Taylor Flow

This section introduces the computational set-up for Taylor flow, followed by a description and discussion of results concerning hydrodynamics and mass transfer.

4.1. General Set-Up for Taylor Flow

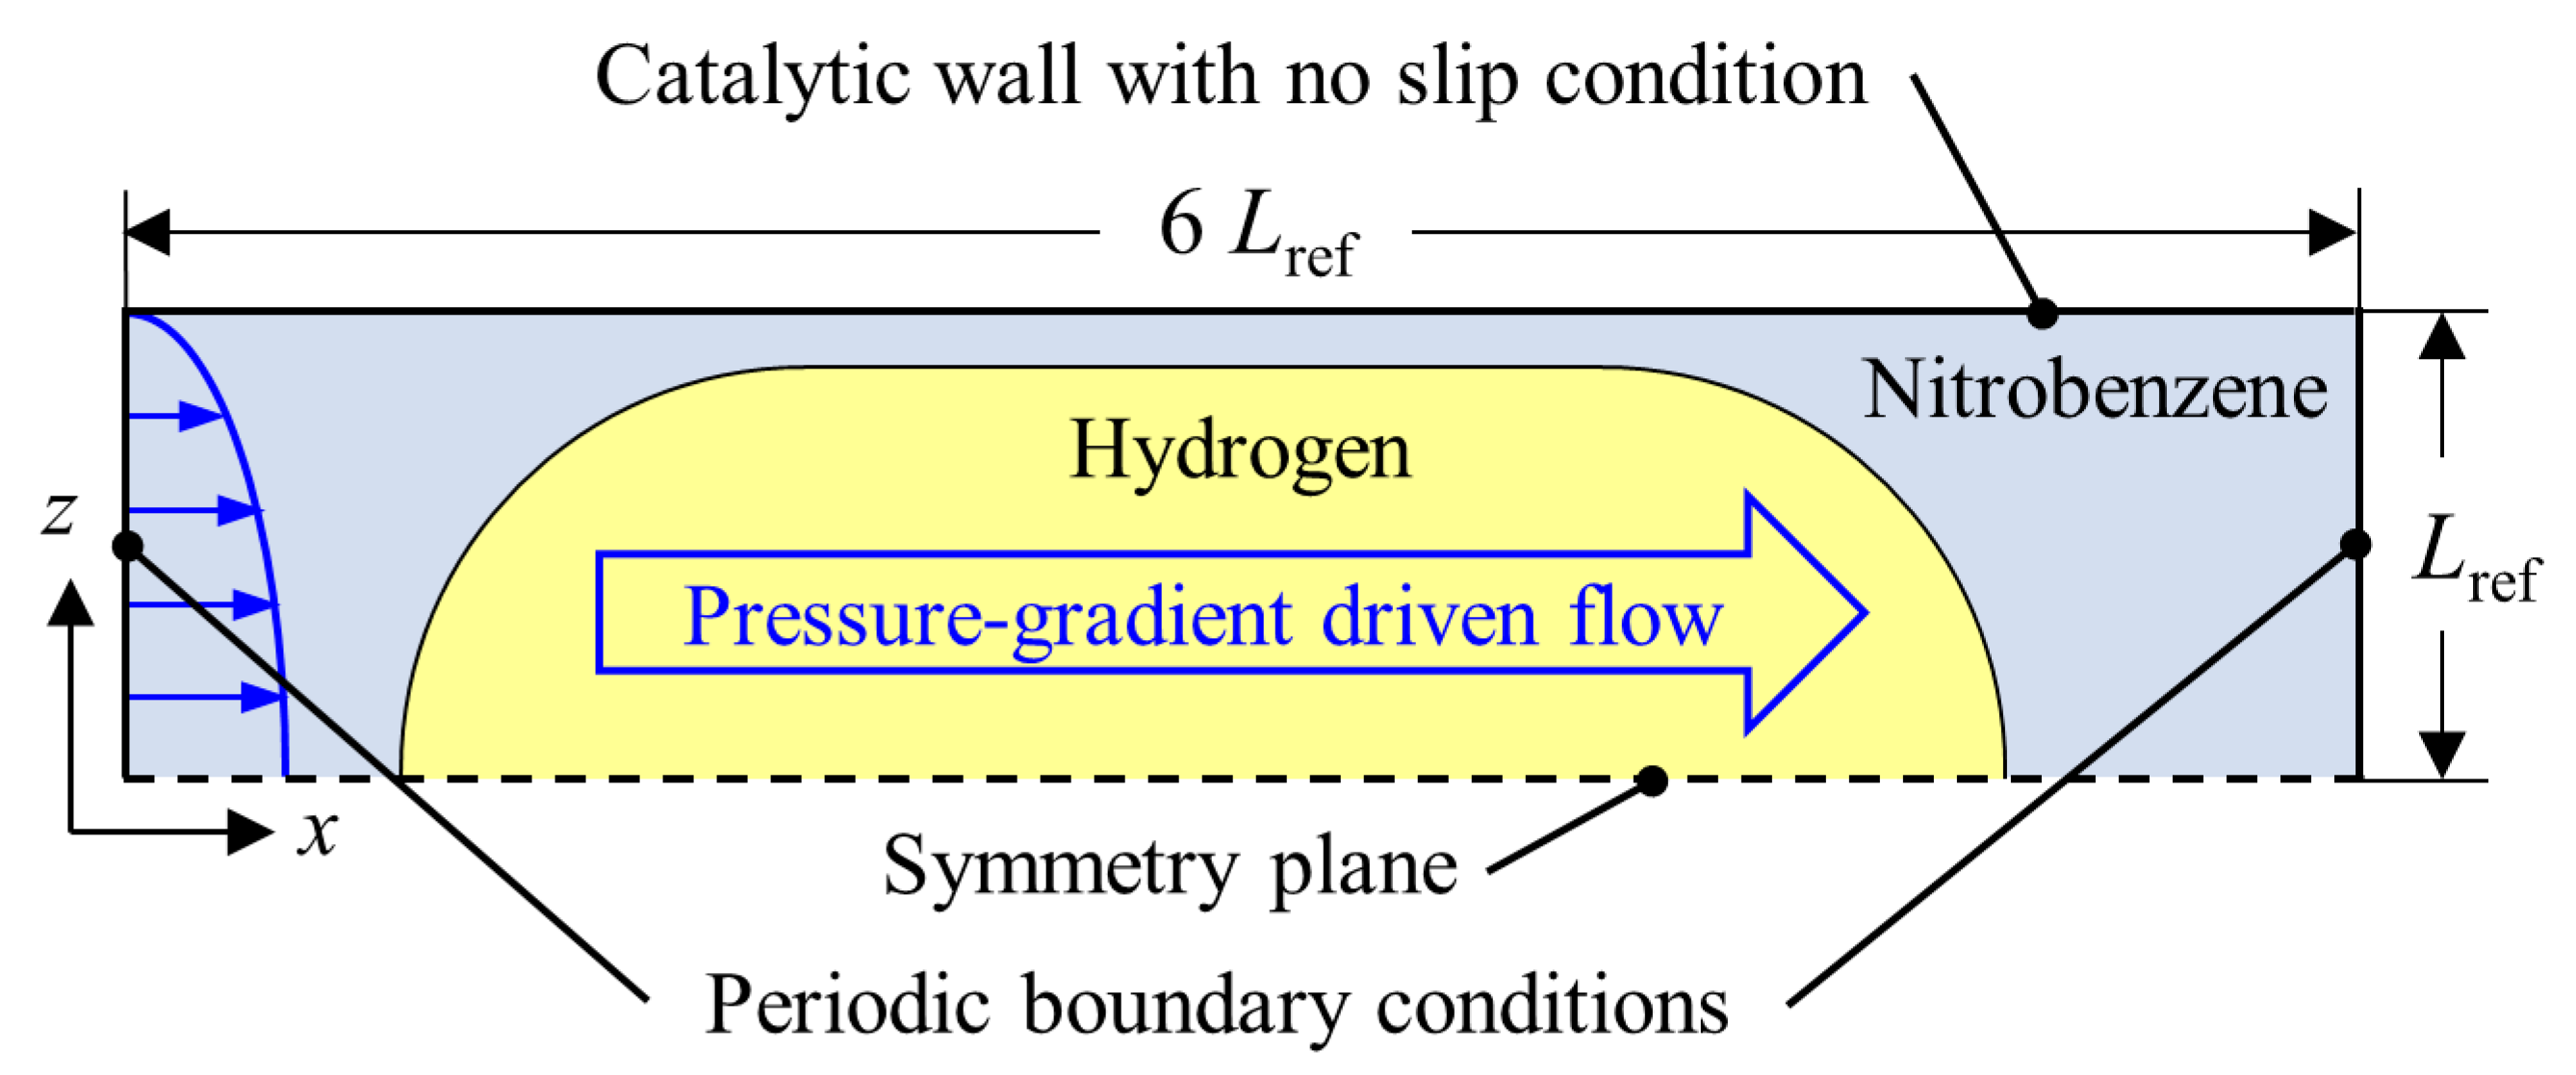
The computational domain of hydrodynamic and mass transfer simulations for a gas-liquid Taylor flow corresponds to a two-dimensional unit cell with a single Taylor bubble, as presented in Figure 4. The planar geometry mimics the situation in the mid-plane of a square or rectangular microchannel where the Taylor bubble cross-section is not axisymmetric for low values of the capillary number and a thin flat lateral liquid film exists. The height of the domain in z direction is a half of the actual channel height and is used as the reference length ( L ref = 50   µ m ) in this study. The length of the domain in x direction is 6 L ref . The lower boundary is a symmetry plane, which allows computing only the upper half of the Taylor bubble. To mimic the influence of the leading and trailing Taylor bubbles, periodic conditions apply at the left and right boundaries. The upper boundary is a no-slip wall where diffusive flux equals either consumptive or productive flux due to the catalytic reactions according to Equation (15). The grid resolution is selected on the basis of a grid refinement study [58]. The computational mesh in x and z directions consists of 200 × 37 uniform cells ( Δ x = Δ z = 0.03 L ref ), including five non-uniform boundary layer cells ( Δ z = 0.003 0.013 L ref ) near the upper wall. This is the same grid as used in our previous study [46], though cell sizes were given by factor 10 lower by mistake. Simulation results on a finer grid ( Δ x = Δ z = 0.02 L ref ) show differences up to 0.8% and 4.6% for hydrodynamics and mass transfer, respectively [58]. The dimensionless time step is 10 5 , corresponding to 0.5 ns.

4.2. Hydrodynamic Simulation

A fully developed parabolic velocity profile is given as initial velocity in the entire domain. The initial shape of the Taylor bubble is a two-dimensional capsule consisting of a rectangular body (length 2 L ref ) with hemi-circular ends (radius 0.8 L ref ), as shown in Figure 4. The gas volume fraction in the unit cell is 43.4%. Table 2 summarizes the test conditions and results for the hydrodynamic simulation. As a preliminary study revealed that the gas density has no notable effect on the quasi-steady bubble shape and velocity field [58], the gas-liquid density ratio is set to unity here for efficient computation. With the current set-up, the bubble velocity ( U B ) is not directly specified but dictated by the prescribed pressure drop across the unit cell ( Δ p UC ) .
Figure 5 shows the quasi-steady bubble shape and velocity field in a fixed (lower half) and a moving (upper half) reference frame corresponding to Case 2 in Woo et al. [46]. Because of the short bubble length, there exists no axial region where the thickness of the liquid film is uniform. With a deviation below 1%, the average value of the liquid film thickness in the undulating region given in Table 2 is in good agreement with the correlation of Halpern and Gaver [59]. The velocity field of the moving reference frame is obtained by subtraction of bubble velocity from the velocity field of the fixed reference frame. In the fixed reference frame, local backflow is observed in the liquid film near the rear part of the bubble where the liquid film is thinnest, while the moving reference frame clearly presents the recirculating flow patterns inside the bubble and in the liquid slug. The mass transfer calculations in the following sections are based on the frozen velocity field in the moving reference frame.

4.3. Mass Transfer Simulation

With the predetermined hydrodynamic solution, the hydrogenation of nitrobenzene in the Taylor flow is qualitatively analyzed by solving Equation (5) for three bulk species in combination with the detailed reaction mechanism described in Section 3. The three bulk species considered are reactant hydrogen and the reaction products aniline and water. Thus, nitrobenzene is not solved by Equation (5) but is considered as a carrier liquid with uniform and constant concentration of 9554   mol   m 3 .
The initial composition of the liquid phase is assumed to correspond to pure nitrobenzene, being free from hydrogen and aniline. The gas bubble consists of pure hydrogen with concentration 325   mol   m 3 corresponding to 323 K and 0.7 MPa. This composition and concentration in the bubble is kept fixed during the simulations. The composition-independent binary diffusion coefficients of the three bulk species in liquid nitrobenzene are estimated by the Wilke-Chang equation [60]. In this study, the values for hydrogen, aniline and water in pure nitrobenzene are 4.27 × 10 9   m 2 s 1 , 1.40 × 10 9   m 2 s 1 and 3.71 × 10 9   m 2 s 1 , respectively. The dimensionless Henry number of hydrogen is H H 2 cc = 0.0389 [46]. Thus, the hydrodynamics and mass transfer are based on the realistic physical properties despite the unverified preliminary reaction mechanism for the purpose of feasibility study. The surface site density employed in this study is Γ s = 1.55 × 10 9   mol   m 2 , which is approximately four orders of magnitude smaller than the value of practical catalytic substrate. Parameter F cat / geo is set to unity. For hydrogenation of nitrobenzene in Taylor flow, a simulation covering 1000 s as done for the CSTR reactor (cf. Figure 3) is not feasible. To maximize the reaction progress, the reaction rates are obtained with the temperature arbitrarily set to 1500 K, corresponding to the period in Figure 3 where the reaction is highly active, which significantly reduces both problem time and computational time. In addition, the time for the internal integration of DETCHEMTM library is set to 10 4   s with initial time step of 10 7   s in the same context to amplify the reaction rates.
Figure 6 shows the bulk species distributions at t = 0.25, 1.25, 2.5 and 5 ms. The hydrogen mass transfer is mostly active at the rear part of the bubble behind the position where the liquid film is thinnest. Accordingly, aniline is mostly produced at the rear bubble where the hydrogen concentration at the wall is highest. In the bypass region, wall-normal species transport occurs mainly by diffusion either towards the catalytic wall or into the recirculation zone. While for t = 0.25 ms, hydrogen and aniline mostly remain in the liquid bypass flow region near the wall, for time t = 1.25 ms, both species have propagated into the recirculation zone of the liquid slug where convective mixing predominates. As results of the combination of convective and diffusive mass transfer in the liquid phase, the concentrations of both species in the recirculation zone gradually increase by time. The concentration at the center of the recirculation zone is relatively low due to the weak convective mass transfer in the direction perpendicular to the streamlines. Concentration fields of water (not shown here) are similar to those of aniline, with almost double the concentration.
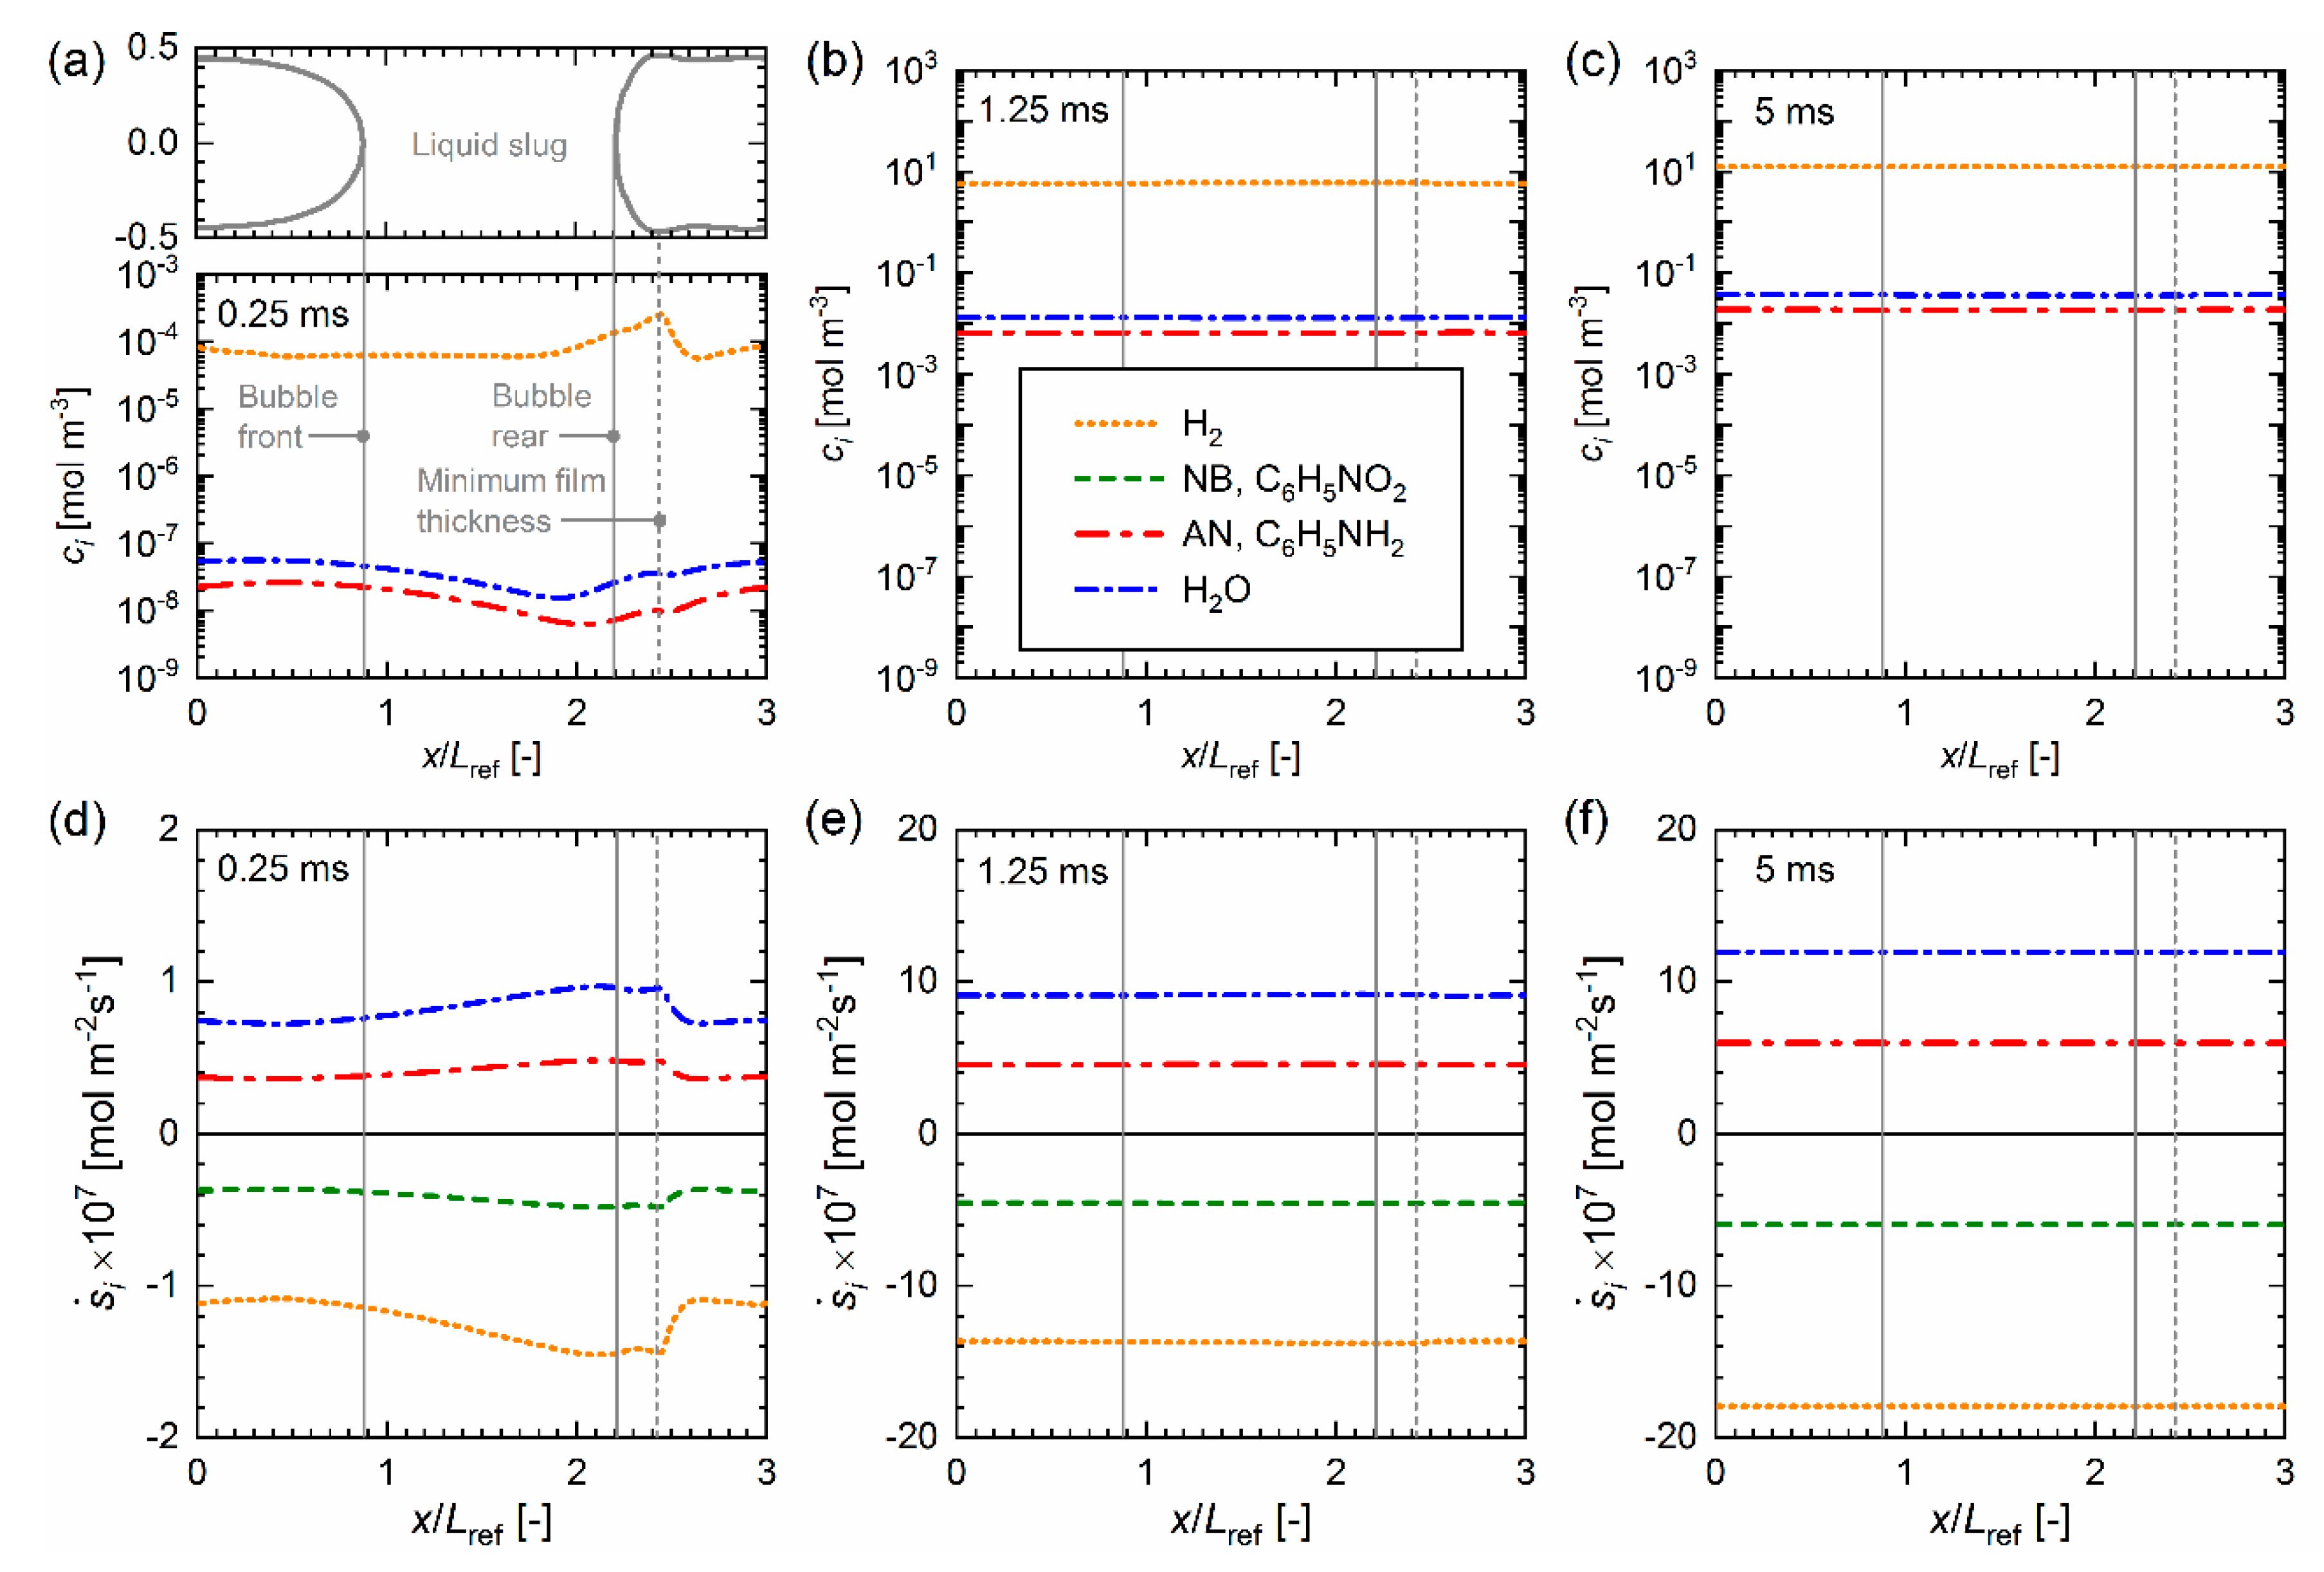
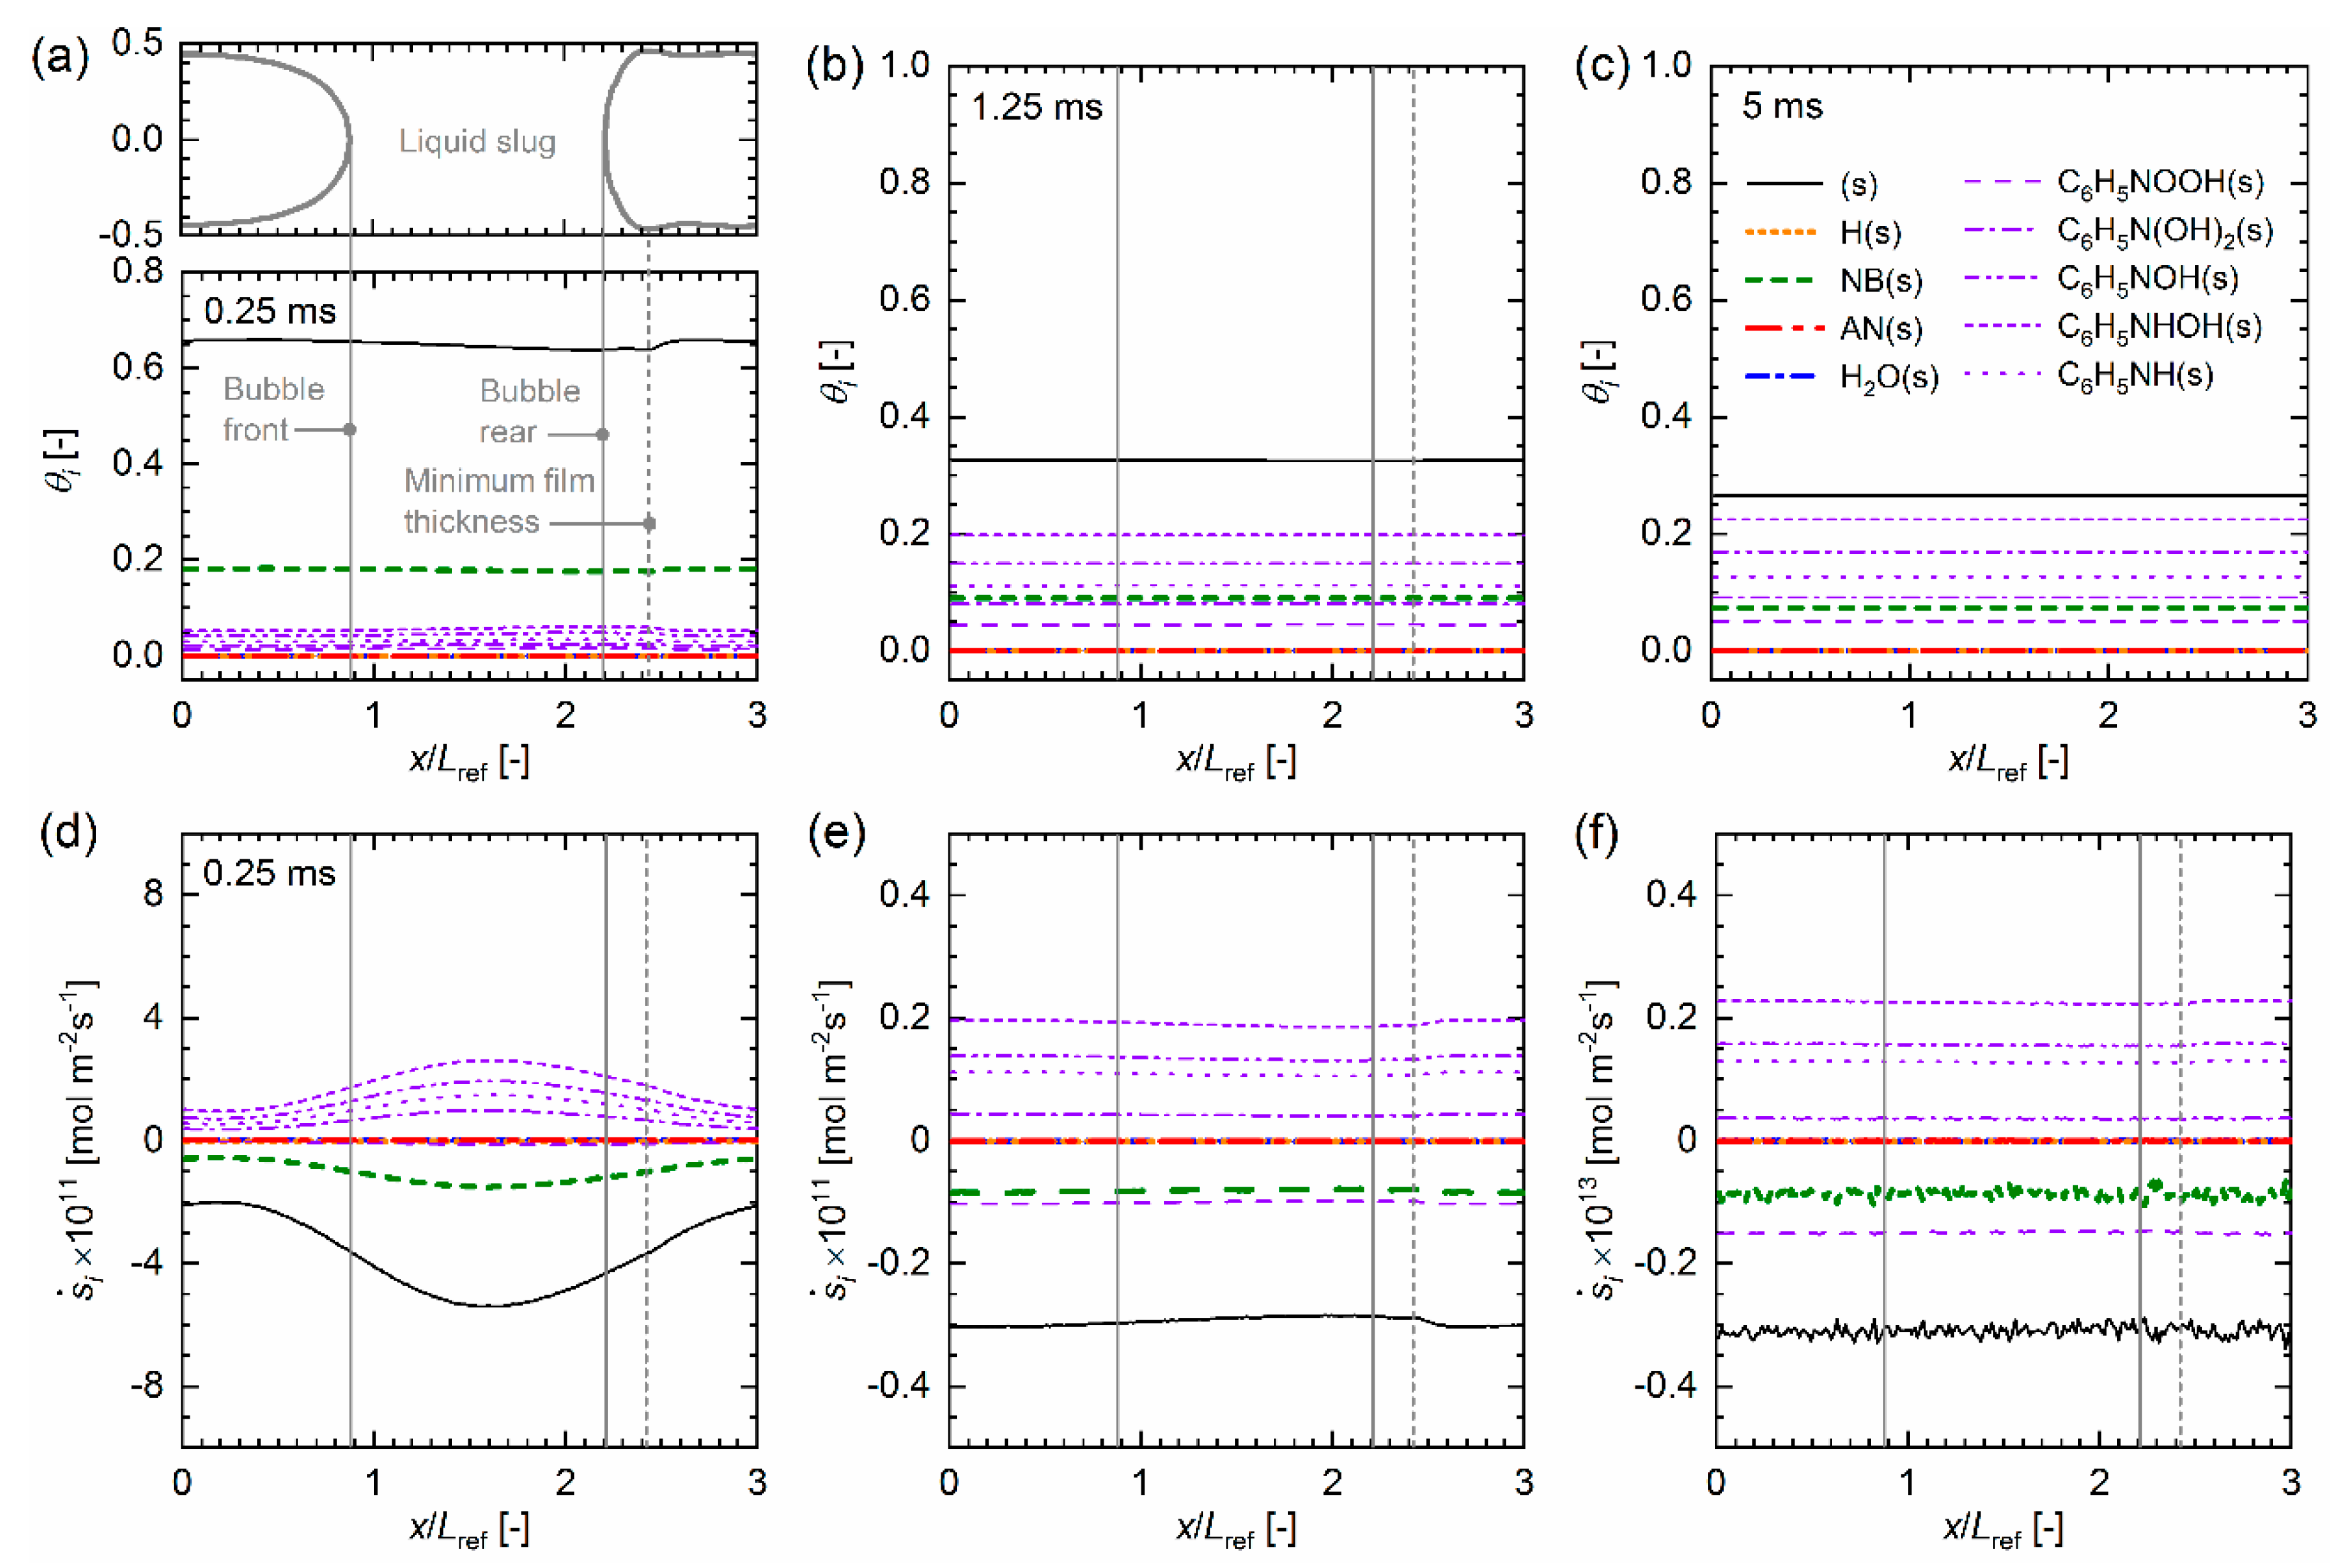
Figure 7 shows the instantaneous distributions of bulk species concentrations at the wall and the production or consumption rates of bulk species as results of surface reactions. As Equation (5) is not solved for bulk nitrobenzene, its concentration is not displayed in Figure 7a–c, while its consumption rates are presented in Figure 7d–f. For t = 0.25   ms , Figure 7a,d clearly show the variation of concentrations depending on the bubble location. At the position of minimum film thickness, the hydrogen concentration in Figure 7a is highest due to the shortest diffusion path, and the production/consumption rates for all bulk species in Figure 7d are highest, accordingly. However, the highest concentrations of reaction products in Figure 7a occur at x / L ref 0.5 . The distance is approximately 2.4 L ref = 120   µ m and corresponds to 35.1% of bubble travel distance with the bubble velocity of 1.367 m/s in this case. For t = 1.25   ms , the profiles of concentrations and production/consumption rates are almost independent of the bubble location, while for t = 5   ms , they are uniform. The concentration of hydrogen at the wall gradually increases because of mass transfer from the bubble to the wall. Accordingly, the production/consumption rates and the concentrations of the reaction products increase with increasing hydrogen concentration.
Figure 8 exhibits the distributions of surface site fractions and the production or consumption rates of surface species at the same time instants shown in Figure 7. The curve denoted by (s) represents the vacant fraction of the surface site. The catalytic surface, which is initially set to be vacant ( θ ( s ) = 1 ) , is immediately occupied by approximately 20% of adsorbed nitrobenzene C 6 H 5 NO 2 ( s ) as a result of pseudo-equilibrium in the DETCHEMTM library. According to the profile of the vacant surface site fraction, θ ( s ) , the highest occupancy of surface site at t = 0.25   ms is observed at the position of minimum film thickness, which is consistent with the bulk species production/consumption. However, the position where the highest production or consumption of surface species occurs is near the center of the liquid slug, as shown in Figure 8d. This indicates that the surface site in the liquid slug is initially less occupied due to the absence of hydrogen in the liquid slug at the beginning of calculation. The axial site fraction profiles at t = 1.25   and   5   ms are almost uniform, while the corresponding surface production/consumption rates still show slight location dependency. The site fractions of surface species rapidly increase between 0.25 and 1.25 ms, and then slightly change from 1.25 to 5 ms. Accordingly, the rates of changing surface species at 5 ms are nearly two orders of magnitude smaller than those from previous time instants.
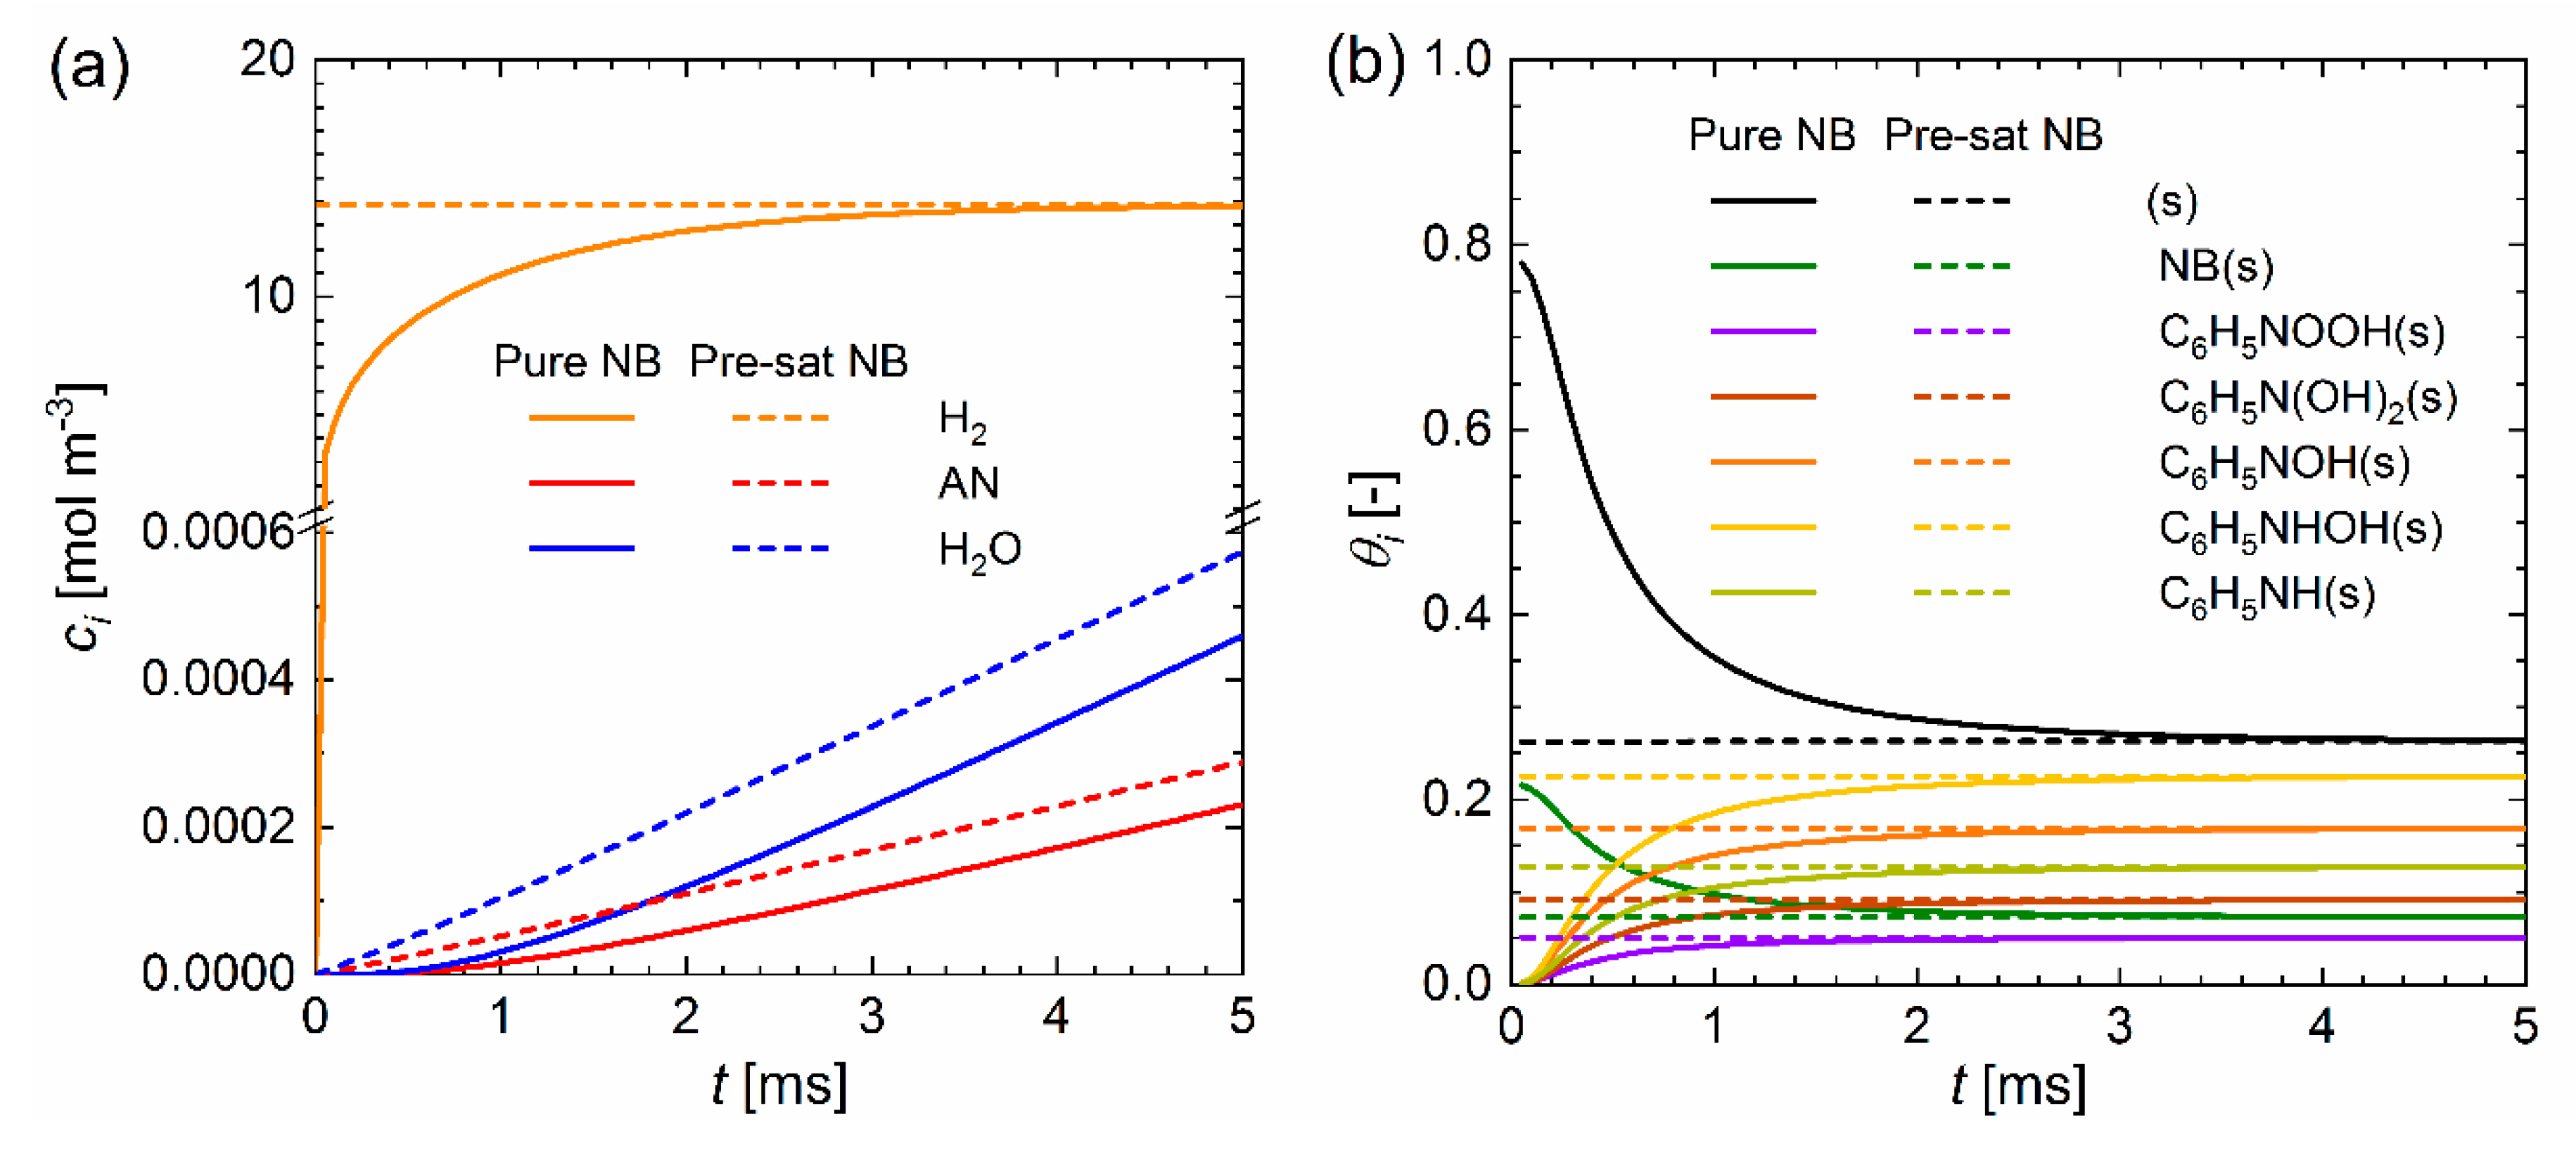
Figure 9 displays the time evolutions of bulk species in liquid phase and site fractions of surface species at the wall. In this figure, the results of mass transfer simulations with initially pure nitrobenzene discussed so far are compared to simulation results where nitrobenzene is initially saturated by hydrogen. For initially pure nitrobenzene, the hydrogen concentration increases from the beginning of the calculation because of mass transfer from the gas bubble into the liquid phase. The hydrogen concentration for the pre-saturated case is, however, almost unchanged from the initial concentration. For both cases, the aniline and water concentrations increase due to the production of the reaction. The amount of produced water is almost double that of produced aniline, which complies with the stoichiometry of the reaction. The case with initially pure nitrobenzene shows a delay of aniline and water production in the beginning of calculation, which corresponds to the time for hydrogen transferring from the bubble to the catalyst wall. After approximately 1 ms, hydrogen is sufficiently provided to the catalyst and the production rates of aniline and water become almost constant. Accordingly, the rates of changing surface sites decrease, and the site fractions finally reach equilibrium. The nitrobenzene surface species C 6 H 5 NO 2 ( s ) mainly appear at the beginning of calculation. As reactions take place, the site is gradually filled with other intermediate surface species with decreasing the site fraction of C 6 H 5 NO 2 ( s ) . For pre-saturated nitrobenzene, the aniline and water production rates become constant immediately. The surface sites are immediately covered by the equilibrium site fractions of pure nitrobenzene. At the equilibrium site coverage, approximately 25% of surface site remains vacant.
Figure 10 compares the rates of production or consumption of surface species varying with respect to the progress of mass transfer starting from the initially pure nitrobenzene and vacant surface sites. Three time-instants, 0.1, 0.45 and 1 ms, representing different characteristics, are chosen. Before 0.1 ms, hydrogen is lacking at the surface. In the period between 0.1 and 0.45 ms, hydrogen reaches the surface, but the site is not sufficiently occupied. After 1 ms, the surface site coverage becomes almost constant in time. At the three time-instants, C 6 H 5 NOOH ( s ) and C 6 H 5 NH 2 ( s ) are most sensitive depending on the variation of surface site coverage—produced in the beginning and switched to consumption after a short period. Adsorbed nitrobenzene C 6 H 5 NO 2 ( s ) is always consumed as a major reactant and the other surface species are always produced in the reaction process. The productions of intermediate surface species are mainly caused as results of forward chain reactions from nitrobenzene, while the consumption of surface aniline C 6 H 5 NH 2 ( s ) at 1 ms is presumably due to the loss by desorption to the bulk. The rates of changing C 6 H 5 NO 2 ( s ) and C 6 H 5 N ( OH ) 2 ( s ) decrease monotonically as reactions progress, while those for the other species are non-monotonic. Most of production/consumption rates are highest near t = 0.45   ms . The magnitudes of production/consumption rates correspond to the extent of activation energy specified in the reaction mechanism.
The series of results presented in this study indicate the capability of a detailed reaction mechanism coupled with the solution of gas-liquid two-phase flow in a way to analyze both bulk and surface species during the reaction progress. Although the reaction mechanism is preliminary and not validated, this study allows qualitative exploration of intermediate species in the catalytic hydrogenation of nitrobenzene within a Taylor flow. The analysis of wall profiles supports the evidence that there is almost no dependency on the location of the Taylor bubble after a short initial period. Although this finding is based on numerous assumptions made in this study, it illustrates potential model simplifications for microreactors operated in Taylor flow.
The production/consumption rates of surface species in Figure 10 indicate that the reaction process might be limited by the process of surface coverage varying with the reaction progress, as shown in Figure 3. The concentration of the product aniline in this computation is very small as compared to the concentration of nitrobenzene, and the reaction rate is, therefore, almost unchanged once it reaches equilibrium. This indicates that the reaction progress is much slower than mass transfer, so that the process is mainly limited by mass transfer. Although this interpretation could be a hasty conclusion given the unverified reaction mechanism, it agrees both with findings in our previous simulations [46] utilizing a verified one-step reaction mechanism and with experimental studies [21,23] where a very long period of time is required to achieve complete conversion of nitrobenzene.

5. Conclusions

The present study aims at a qualitative feasibility study of employing a detailed surface reaction mechanism in interface-resolving simulations of a gas-liquid Taylor flow. To that end, the computer codes TURBIT-VOF and DETCHEMTM have been coupled for intercommunication between multiphase computational fluid dynamics and reaction kinetics. Due to the lack of an applicable detailed reaction mechanism for catalytic hydrogenation of nitrobenzene in the literature, a reaction mechanism based on density functional theory is modified by transition state theory. While the detailed reaction mechanism for catalytic hydrogenation of nitrobenzene is preliminary and unverified, the coupled solver utilizes realistic physical properties for hydrodynamic and mass transfer simulations.
Two-dimensional planar Taylor flow in a unit cell is solved by a geometrical volume-of-fluid method with a pair of periodic boundary conditions. Mass transfer of reactants and products is calculated with the predetermined frozen velocity field by a concept of moving reference frame, assuming no feedbacks of mass transfer and reactions on hydrodynamics. In the beginning of the calculation where the amount of hydrogen transferred from the Taylor bubble into liquid nitrobenzene is low, the highest aniline production occurs near the rear meniscus where the liquid film is thinnest. After a short period, mass transfer and reactions proceeds to a state where the local non-uniformities in wall concentration profiles diminish and the concentrations of adsorbed species and surface intermediates reach an equilibrium state. This indicates that there is almost no local dependency in the species concentrations and those reaction rates, despite complex hydrodynamics around the Taylor bubble. Consequently, the modeling of a microreactor operated in Taylor flow can potentially be simplified by neglecting the initial short period required for saturation of gaseous species in liquid. In addition, it was found that the reaction process is mainly mass transfer-limited. So far, these conclusions apply to the preliminary consecutive reaction mechanism considered here, and should be confirmed by a validated, detailed, potentially non-consecutive (branched) reaction mechanism when available.
The findings of this study establish the foundation for further research on modeling Taylor flow reactor employing detailed reaction mechanisms. Validation of reaction mechanisms that are applicable to the computational fluid dynamics is a prerequisite for a reasonable quantitative analysis. These will allow comprehensive modeling of Taylor flow reactors, focusing more on the reaction mechanism rather than hydrodynamics and mass transfer.

Author Contributions

M.W. (Mino Woo): Conceptualization, Methodology, Software, Investigation, Validation, Writing—original draft, Writing—review and editing, Visualization. L.M.: Methodology, Software, Writing—review and editing. S.T.: Methodology, Software, Writing—review and editing. O.D.: Software, Resources, Supervision. M.W. (Martin Wörner): Conceptualization, Software, Validation, Writing—review and editing, Supervision, Project administration, Funding acquisition. All authors have read and agreed to the published version of the manuscript.

Funding

This research was funded by Helmholtz Energy Alliance “Energy-Efficient Chemical Multiphase Processes”, grant number HA-E-0004.

Acknowledgments

The authors thank the Steinbeis GmbH for a cost-free license of DETCHEMTM.

Conflicts of Interest

The authors declare no conflict of interest.

Nomenclature

A i Pre-exponential factor ( cm ,   mol ,   s )
a int - V Specific interfacial area m 1
C a Capillary number, C a = μ L U B / σ -
c b , i Molar bulk concentration of species i mol   m 3
c m , i * Non-dimensional bulk concentration-
c s , i Molar surface concentration of species i mol   m 2
D i Diffusivity of species i in solvent m 2   s 1
E a , i Activation energy kJ   mol 1
F cat / geo Ratio of catalytic to geometric surface area-
f Liquid volume fraction-
H i cc Henry number-
j Molar flux, j   = ( j x , j z ) T mol   m 2   s 1
k i Arrhenius-type rate factor( cm ,   mol ,   s )
L ref Reference length, L ref = 50   µ m m
M i Molecular weight g   mol 1
N r Number of surface reactions-
N s Number of surface species-
P * Reduced pressure-
p PressurePa
R Gas constant J   mol 1   K 1
R e Reynolds number, R e = ρ L U B L ref / μ L -
s i 0 Initial sticking coefficient-
s ˙ i Surface reaction rate mol   m 2   s 1
T TemperatureK
t Times
U ref Reference velocity, U ref = 1   m   s 1 m   s 1
u Velocity field, u   = ( u x , u z ) T m   s 1
x i Mole fraction-
x Axial coordinate m
z Wall-normal coordinate m
Greek symbols
Γ S Surface site density mol   m 2
θ i Surface site fraction-
κ Interface curvature-
μ Dynamic viscosityPa s
ν Stoichiometric coefficient-
ρ Density kg   m 3
σ Surface tension coefficient N   m 1
Subscripts
BBubble
bBulk
GGas phase
i Species index
j Reaction index
intInterface
LLiquid phase
mTwo-phase mixture
refReference value
sSurface
UCUnit cell
Superscripts
*Dimensionless quantity
Abbreviations
ANAniline, C 6 H 5 NH 2
CSTRContinuously stirred tank reactor
NBNitrobenzene, C 6 H 5 NO 2

References

  1. Shui, L.; Eijkel, J.C.T.; van den Berg, A. Multiphase flow in microfluidic systems—Control and applications of droplets and interfaces. Adv. Colloid Interface Sci. 2007, 133, 35–49. [Google Scholar] [CrossRef]
  2. Taylor, G.I. Deposition of a Viscous Fluid on the Wall of a Tube. J. Fluid Mech. 1961, 10, 161–165. [Google Scholar] [CrossRef]
  3. Ahmed, B.; Barrow, D.; Wirth, T. Enhancement of reaction rates by segmented fluid flow in capillary scale reactors. Adv. Synth. Catal. 2006, 348, 1043–1048. [Google Scholar] [CrossRef]
  4. Kreutzer, M.T.; Kapteijn, F.; Moulijn, J.A.; Heiszwolf, J.J. Multiphase monolith reactors: Chemical reaction engineering of segmented flow in microchannels. Chem. Eng. Sci. 2005, 60, 5895–5916. [Google Scholar] [CrossRef]
  5. Irandoust, S.; Andersson, B. Mass-Transfer and Liquid-Phase Reactions in a Segmented Two-Phase Flow Monolithic Catalyst Reactor. Chem. Eng. Sci. 1988, 43, 1983–1988. [Google Scholar] [CrossRef]
  6. Irandoust, S.; Ertle, S.; Andersson, B. Gas-Liquid Mass-Transfer in Taylor Flow through a Capillary. Can. J. Chem. Eng. 1992, 70, 115–119. [Google Scholar] [CrossRef]
  7. Dessimoz, A.L.; Cavin, L.; Renken, A.; Kiwi-Minsker, L. Liquid-liquid two-phase flow patterns and mass transfer characteristics in rectangular glass microreactors. Chem. Eng. Sci. 2008, 63, 4035–4044. [Google Scholar] [CrossRef] [Green Version]
  8. Roudet, M.; Loubiere, K.; Gourdon, C.; Cabassud, M. Hydrodynamic and mass transfer in inertial gas-liquid flow regimes through straight and meandering millimetric square channels. Chem. Eng. Sci. 2011, 66, 2974–2990. [Google Scholar] [CrossRef] [Green Version]
  9. Kastens, S.; Hosoda, S.; Schlüter, M.; Tomiyama, A. Mass Transfer from Single Taylor Bubbles in Minichannels. Chem. Eng. Technol. 2015, 38, 1925–1932. [Google Scholar] [CrossRef]
  10. Haase, S.; Murzin, D.Y.; Salmi, T. Review on hydrodynamics and mass transfer in minichannel wall reactors with gas-liquid Taylor flow. Chem. Eng. Res. Des. 2016, 113, 304–329. [Google Scholar] [CrossRef]
  11. Abiev, R.; Svetlov, S.; Haase, S. Hydrodynamics and mass transfer of gas-liquid and liquid-liquid Taylor flow in microchannels. Chem. Eng. Technol. 2017, 40, 1985–1998. [Google Scholar] [CrossRef]
  12. Angeli, P.; Gavriilidis, A. Hydrodynamics of Taylor flow in small channels: A review. Proc. Inst. Mech. Eng. Part C 2008, 222, 737–751. [Google Scholar] [CrossRef]
  13. Hampel, U.; Dittmeyer, R.; Patyk, A.; Wetzel, T.; Lange, R.; Freund, H.; Schwieger, W.; Grünewald, M.; Schlüter, M.; Petasch, U. The Helmholtz Energy Alliance “Energy Efficient Multiphase Chemical Processes”. Chem. Ing. Tech. 2013, 85, 992–996. [Google Scholar] [CrossRef]
  14. Haber, F. Über stufenweise Reduktion des Nitrobenzols mit begrenztem Kathodenpotential. Z. Für Elektrochem. 1898, 4, 506–514. [Google Scholar] [CrossRef]
  15. Tong, S.B.; O‘Driscoll, K.F.; Rempel, G.L. Kinetics of nitrobenzene hydrogenation using a gel entrapped palladium catalyst. Can. J. Chem. Eng. 1978, 56, 340–345. [Google Scholar] [CrossRef]
  16. Kushch, S.D.; Izakovich, E.N.; Khidekel, M.L.; Strelets, V.V. Mechanism of Catalytic-Hydrogenation of Nitrobenzene in an Aprotic Medium in the Presence of Quinones. Bull. Acad. Sci. Ussr Div. Chem. Sci. 1981, 30, 1201–1206. [Google Scholar] [CrossRef]
  17. Wisniak, J.; Klein, M. Reduction of Nitrobenzene to Aniline. Ind. Eng. Chem. Prod. Res. Dev. 1984, 23, 44–50. [Google Scholar] [CrossRef]
  18. Petrov, L.; Kumbilieva, K.; Kirkov, N. Kinetic-Model of Nitrobenzene Hydrogenation to Aniline over Industrial Copper Catalyst Considering the Effects of Mass-Transfer and Deactivation. Appl. Catal. 1990, 59, 31–43. [Google Scholar] [CrossRef]
  19. Gelder, E.A.; Jackson, S.D.; Lok, C.M. The hydrogenation of nitrobenzene to aniline: A new mechanism. Chem. Commun. 2005, 522–524. [Google Scholar] [CrossRef]
  20. Turek, F.; Geike, R.; Lange, R. Liquid-phase hydrogenation of nitrobenzene in a slurry reactor. Chem. Eng. Process. 1986, 20, 213–219. [Google Scholar] [CrossRef]
  21. Höller, V.; Wegricht, D.; Yuranov, I.; Kiwi-Minsker, L.; Renken, A. Three-phase nitrobenzene hydrogenation over supported glass fiber catalysts: Reaction kinetics study. Chem. Eng. Technol. 2000, 23, 251–255. [Google Scholar] [CrossRef]
  22. Klemm, E.; Amon, B.; Redlingshofer, H.; Dieterich, E.; Emig, G. Deactivation kinetics in the hydrogenation of nitrobenzene to aniline on the basis of a coke formation kinetics—Investigations in an isothermal catalytic wall reactor. Chem. Eng. Sci. 2001, 56, 1347–1353. [Google Scholar] [CrossRef]
  23. Frikha, N.; Schaer, E.; Houzelot, J.L. Methodology of multiphase reaction kinetics and hydrodynamics identification: Application to catalyzed nitrobenzene hydrogenation. Chem. Eng. J. 2006, 124, 19–28. [Google Scholar] [CrossRef]
  24. Zhang, L.; Jiang, J.; Shi, W.; Xia, S.; Ni, Z.; Xiao, X. Insights into the hydrogenation mechanism of nitrobenzene to aniline on Pd3/Pt(111): A density functional theory study. RSC Adv. 2015, 5, 34319–34326. [Google Scholar] [CrossRef]
  25. Mahata, A.; Rai, R.K.; Choudhuri, I.; Singh, S.K.; Pathak, B. Direct vs. indirect pathway for nitrobenzene reduction reaction on a Ni catalyst surface: A density functional study. PCCP 2014, 16, 26365–26374. [Google Scholar] [CrossRef] [PubMed]
  26. Hatziantoniou, V.; Andersson, B.; Schöön, N.-H. Mass-Transfer and Selectivity in Liquid-Phase Hydrogenation of Nitrocompounds in a Monolithic Catalyst Reactor with Segmented Gas-Liquid Flow. Ind. Eng. Chem. Process Des. Dev. 1986, 25, 964–970. [Google Scholar] [CrossRef]
  27. Machado, R.M.; Broekhuis, R.R.; Nordquist, A.F.; Roy, B.P.; Carney, S.R. Applying monolith reactors for hydrogenations in the production of specialty chemicals—Process and economic considerations. Catal. Today 2005, 105, 305–317. [Google Scholar] [CrossRef]
  28. Irandoust, S.; Andersson, B. Simulation of Flow and Mass-Transfer in Taylor Flow through a Capillary. Comput. Chem. Eng. 1989, 13, 519–526. [Google Scholar] [CrossRef]
  29. Van Baten, J.M.; Krishna, R. CFD simulations of mass transfer from Taylor bubbles rising in circular capillaries. Chem. Eng. Sci. 2004, 59, 2535–2545. [Google Scholar] [CrossRef]
  30. Liu, D.; Wang, S. Gas-Liquid Mass Transfer in Taylor Flow through Circular Capillaries. Ind. Eng. Chem. Res. 2011, 50, 2323–2330. [Google Scholar] [CrossRef]
  31. Shao, N.; Gavriilidis, A.; Angeli, P. Mass transfer during Taylor flow in microchannels with and without chemical reaction. Chem. Eng. J. 2010, 160, 873–881. [Google Scholar] [CrossRef]
  32. Martinez, F.L.D.; Julcour, C.; Billet, A.-M.; Larachi, F. Modelling and simulations of a monolith reactor for three-phase hydrogenation reactions—Rules and recommendations for mass transfer analysis. Catal. Today 2016, 273, 121–130. [Google Scholar] [CrossRef] [Green Version]
  33. Pan, Z.; Zhang, X.; Xie, Y.; Cai, W. Instantaneous Mass Transfer under Gas-Liquid Taylor Flow in Circular Capillaries. Chem. Eng. Technol. 2014, 37, 495–504. [Google Scholar] [CrossRef]
  34. Wörner, M. Numerical modeling of multiphase flows in microfluidics and micro process engineering: A review of methods and applications. Microfluid. Nanofluid. 2012, 12, 841–886. [Google Scholar] [CrossRef]
  35. Taha, T.; Cui, Z.F. CFD modelling of slug flow in vertical tubes. Chem. Eng. Sci. 2006, 61, 676–687. [Google Scholar] [CrossRef]
  36. Taha, T.; Cui, Z.F. CFD modelling of slug flow inside square capillaries. Chem. Eng. Sci. 2006, 61, 665–675. [Google Scholar] [CrossRef]
  37. Ghidersa, B.E.; Wörner, M.; Cacuci, D.G. Exploring the flow of immiscible fluids in a square vertical mini-channel by direct numerical simulation. Chem. Eng. J. 2004, 101, 285–294. [Google Scholar] [CrossRef]
  38. Onea, A.; Wörner, M.; Cacuci, D.G. A qualitative computational study of mass transfer in upward bubble train flow through square and rectangular mini-channels. Chem. Eng. Sci. 2009, 64, 1416–1435. [Google Scholar] [CrossRef]
  39. Talimi, V.; Muzychka, Y.S.; Kocabiyik, S. Numerical simulation of the pressure drop and heat transfer of two phase slug flows in microtubes using moving frame of reference technique. Int. J. Heat Mass Transf. 2012, 55, 6463–6472. [Google Scholar] [CrossRef]
  40. Lei, Z.; Guo, Y.; Dai, C.; Zi, L.; Chen, B. Simulation of hydrodynamic and mass transfer performances in monolith channel. Catal. Today 2016, 276, 150–160. [Google Scholar] [CrossRef]
  41. Heckmann, C.; Kurt, S.K.; Ehrhard, P.; Kockmann, N. Stofftransport in einer Flüssig/Flüssig-Pfropfenströmung im Mikrokapillarreaktor. Chem. Ing. Tech. 2017, 89, 1642–1649. [Google Scholar] [CrossRef]
  42. Gupta, R.; Fletcher, D.F.; Haynes, B.S. Taylor Flow in Microchannels: A Review of Experimental and Computational Work. J. Comput. Multiph. Flows 2010, 2, 1–32. [Google Scholar] [CrossRef]
  43. Talimi, V.; Muzychka, Y.S.; Kocabiyik, S. A review on numerical studies of slug flow hydrodynamics and heat transfer in microtubes and microchannels. Int. J. Multiph. Flow 2012, 39, 88–104. [Google Scholar] [CrossRef]
  44. Sabisch, W. Dreidimensionale Numerische Simulation der Dynamik von Aufsteigenden Einzelblasen und Blasenschwärmen mit Einer Volume-of-Fluid-Methode; Wissenschaftliche Berichte, FZKA 6478; Forschungszentrum Karlsruhe: Karlsruhe, Germany, 2000. [Google Scholar]
  45. Deutschmann, O.; Tischer, S.; Kleditzsch, S.; Janardhanan, V.M.; Correa, C.; Chatterjee, D.; Mladenov, N.; Minh, H.D.; Karadeniz, H.; Hettel, M.; et al. DETCHEM Software Package, 2.8, 2019, Karlsruhe. Available online: http://www.detchem.com (accessed on 1 December 2020).
  46. Woo, M.; Tischer, S.; Deutschmann, O.; Wörner, M. A step toward the numerical simulation of catalytic hydrogenation of nitrobenzene in Taylor flow at practical conditions. Chem. Eng. Sci. 2021, 230, 116132. [Google Scholar] [CrossRef]
  47. Kececi, S.; Wörner, M.; Onea, A.; Soyhan, H.S. Recirculation time and liquid slug mass transfer in co-current upward and downward Taylor flow. Catal. Today 2009, 147S, S125–S131. [Google Scholar] [CrossRef]
  48. Raimondi, D.M.N.; Prat, L. Numerical Study of the Coupling between Reaction and Mass Transfer for Liquid-Liquid Slug Flow in Square Microchannels. AIchE J. 2011, 57, 1719–1732. [Google Scholar] [CrossRef] [Green Version]
  49. Hassanvand, A.; Hashemabadi, S.H. Direct numerical simulation of mass transfer from Taylor bubble flow through a circular capillary. Int. J. Heat Mass Transf. 2012, 55, 5959–5971. [Google Scholar] [CrossRef]
  50. Yang, L.; Nieves-Remacha, M.J.; Jensen, K.F. Simulations and analysis of multiphase transport and reaction in segmented flow microreactors. Chem. Eng. Sci. 2017, 169, 106–116. [Google Scholar] [CrossRef]
  51. Öztaskin, M.C.; Wörner, M.; Soyhan, H.S. Numerical investigation of the stability of bubble train flow in a square minichannel. Phys. Fluids 2009, 21, 042108. [Google Scholar] [CrossRef]
  52. Petera, J.; Weatherley, L.R. Modelling of mass transfer from falling droplets. Chem. Eng. Sci. 2001, 56, 4929–4947. [Google Scholar] [CrossRef]
  53. Yang, C.; Mao, Z.-S. Numerical simulation of interphase mass transfer with the level set approach. Chem. Eng. Sci. 2005, 60, 2643–2660. [Google Scholar] [CrossRef]
  54. Woo, M.; Wörner, M.; Tischer, S.; Deutschmann, O. Validation of a numerical method for interface-resolving simulation of multicomponent gas-liquid mass transfer and evaluation of multicomponent diffusion models. Heat Mass Transf. 2018, 54, 697–713. [Google Scholar] [CrossRef]
  55. Stotz, H.; Maier, L.; Deutschmann, O. Methane Oxidation over Palladium: On the Mechanism in Fuel-Rich Mixtures at High Temperatures. Top. Catal. 2017, 60, 83–109. [Google Scholar] [CrossRef]
  56. Dumesic, J.A.; Rudd, D.F.; Aparicio, L.M.; Rekoske, J.E.; Trevino, A.A. The Microkinetics of Heterogeneous Catalysis; American Chemical Society: Washington, DC, USA, 1993. [Google Scholar]
  57. Burcat, A.; Ruscic, B. Third Millenium Ideal Gas and Condensed Phase Thermochemical Database for Combustion (with Update from Active Thermochemical Tables); ANL-05/20 TAE 960; Argonne National Lab. (ANL): Argonne, IL, USA, 2005. [Google Scholar]
  58. Woo, M. Numerical Simulation of Gas-Liquid Taylor Flow with Catalyzed Heterogeneous Reaction; Karlsruhe Institute of Technology (KIT): Karlsruhe, Germany, 2018. [Google Scholar]
  59. Halpern, D.; Gaver, D.P. Boundary-Element Analysis of the Time-Dependent Motion of a Semi-infinite Bubble in a Channel. J. Comput. Phys. 1994, 115, 366–375. [Google Scholar] [CrossRef]
  60. Wilke, C.R.; Chang, P. Correlation of Diffusion Coefficients in Dilute Solutions. AIchE J. 1955, 1, 264–270. [Google Scholar] [CrossRef]
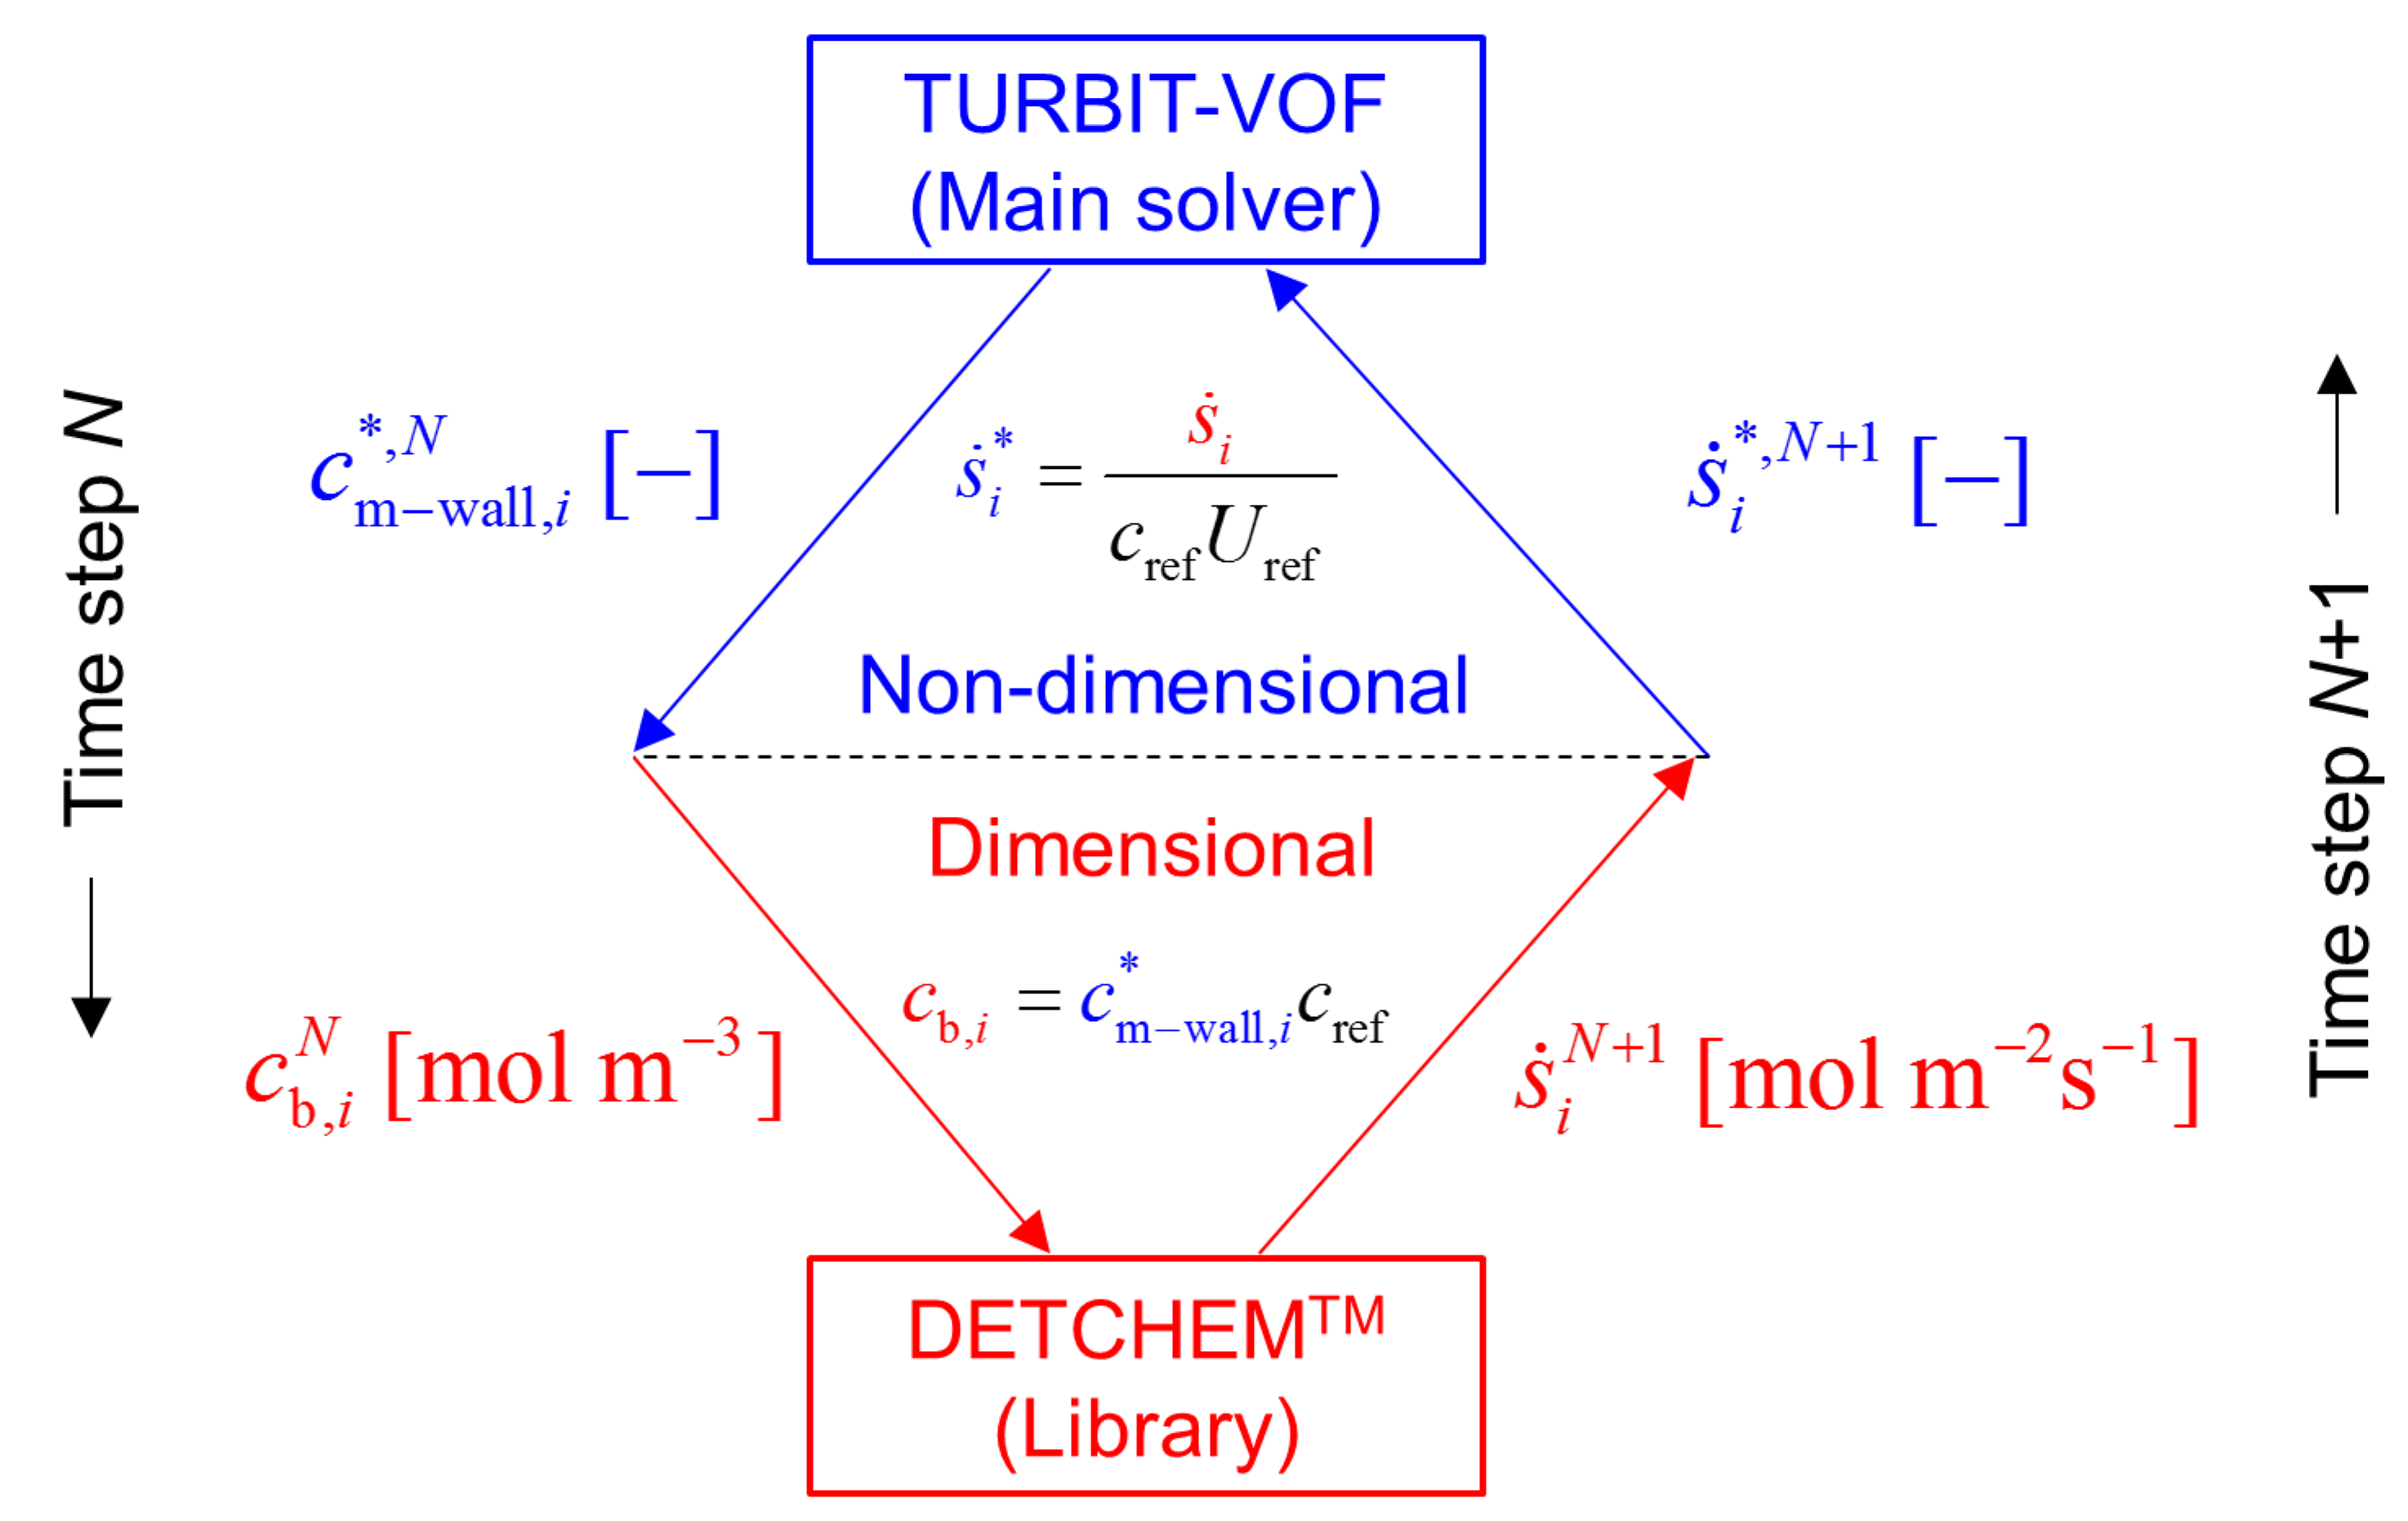
Figure 1. Sketch of coupling TURBIT-VOF and DETCHEMTM at the reactive wall for the current time step N .
Fluids 05 00234 g001
Figure 2. Surface reaction path of nitrobenzene hydrogenation to aniline on the bimetallic catalyst of platinum and palladium (mechanism B of Zhang et al. [24]).
Fluids 05 00234 g002
Figure 3. Results for CSTR test case. (a) Time evolutions of mole fractions of bulk species and temperature. (b) Site fractions of surface species.
Fluids 05 00234 g003
Figure 4. Computational domain and boundary conditions for gas-liquid Taylor flow for hydrogenation of nitrobenzene in a two-dimensional unit cell.
Fluids 05 00234 g004
Figure 5. Computed quasi-steady bubble shapes (thick red lines) and velocity fields (vectors) in the fixed reference frame (lower half) and in the moving reference frame (upper half), identical to Case 2 in Woo et al. [46].
Fluids 05 00234 g005
Figure 6. Concentrations field of bulk species hydrogen (top half of each sub-image) and aniline (bottom half) at different times: (a) 0.25 ms, (b) 1.25 ms, (c) 2.5 ms and (d) 5 ms.
Fluids 05 00234 g006
Figure 7. Concentration distributions of bulk species (ac) and production/consumption rates at the catalytic surface (df) at t = 0.25 (a,d), 1.25 (b,e) and 5 ms (c,f). For legend, see inset in subfigure (b).
Fluids 05 00234 g007
Figure 8. Axial distributions of site fractions (ac) and production/consumption rates (df) of surface species at t = 0.25, 1.25 and 5 ms. For legend see inset in subfigure (c).
Fluids 05 00234 g008
Figure 9. Time evolutions of mean concentrations of bulk species (a) and mean site fractions of surface species (b). Solid lines represent the initial condition of liquid as pure nitrobenzene, while dashed lines represent the case initialized with nitrobenzene pre-saturated with hydrogen.
Fluids 05 00234 g009
Figure 10. Variation of production/consumption rates of surface species from the initially empty surface site.
Fluids 05 00234 g010
Table 1. Surface reaction mechanism for hydrogenation of nitrobenzene on palladium catalyst. Species adsorbed on the surface are indicated by suffix (s). For reactions R11, R13, R15, R17 and R19, the activation energy E a , j depends on coverage ( θ i ) due to the lateral interaction between the adsorbed species. The units of the pre-exponential factors A j (as well as of k j in Equation (12)) vary depending on the exponent of the concentration multiplied to the rate constant and are a combination of cm, mol, and s.
No.Reaction A j   or   s i 0 E a , j   ( kJ   mol 1 )
R1 H 2 H ( s )   +   H ( s ) 5 × 10 4
R2 H ( s )   +   H ( s ) H 2 3 × 10 21 82.8
R3 C 6 H 5 NO 2 C 6 H 5 NO 2 ( s ) 1 × 10 5
R4 C 6 H 5 NO 2 ( s ) C 6 H 5 NO 2 3.5 × 10 13 88.8
R5 C 6 H 5 NH 2 C 6 H 5 NH 2 ( s ) 1 × 10 5
R6 C 6 H 5 NH 2 ( s ) C 6 H 5 NH 2 1 × 10 14 64.0
R7 H 2 O H 2 O ( s ) 2 × 10 1
R8 H 2 O ( s ) H 2 O 3 × 10 13 41.8
R9 C 6 H 5 NO 2 ( s ) +   H ( s ) C 6 H 5 NOOH ( s ) 3 × 10 24 55.9
R10 C 6 H 5 NOOH ( s ) C 6 H 5 NO 2 ( s ) +   H ( s ) 3 × 10 19 20.2
R11 C 6 H 5 NOOH ( s )   +   H ( s ) C 6 H 5 N ( OH ) 2 ( s ) 3 × 10 25 112.9–22 θ C 6 H 5 NOOH ( s )
R12 C 6 H 5 N ( OH ) 2 ( s )   C 6 H 5 NOOH ( s )   +   H ( s ) 3 × 10 20 135.1
R13 C 6 H 5 N ( OH ) 2 ( s )   +   H ( s ) C 6 H 5 NOH ( s )   +   H 2 O ( s ) 3 × 10 25 120.6–118 θ C 6 H 5 N ( OH ) 2 ( s )
R14 C 6 H 5 NOH ( s )   +   H 2 O ( s ) C 6 H 5 N ( OH ) 2 ( s ) + H ( s ) 3 × 10 20 250.9
R15 C 6 H 5 NOH ( s )   +   H ( s ) C 6 H 5 NHOH ( s ) 3 × 10 24 99.4–60 θ C 6 H 5 NOH ( s )
R16 C 6 H 5 NHOH ( s ) C 6 H 5 NOH ( s )     +   H ( s ) 3 × 10 20 159.2
R17 C 6 H 5 NHOH ( s )   +   H ( s ) C 6 H 5 NH ( s )     +   H 2 O ( s ) 5 × 10 26 166.9–104 θ C 6 H 5 NHOH ( s )
R18 C 6 H 5 NH ( s )     +   H 2 O ( s ) C 6 H 5 NHOH ( s )   +   H ( s ) 3 × 10 20 272.1
R19 C 6 H 5 NH ( s )     +   H ( s ) C 6 H 5 NH 2 ( s ) 3 × 10 26 153.4–147 θ C 6 H 5 NH ( s )
R20 C 6 H 5 NH 2 ( s ) C 6 H 5 NH ( s )     +   H ( s ) 3 × 10 20 200.7
Table 2. Test conditions and results of hydrodynamic simulation.
Test ConditionsValueUnit
Reference length, L ref 50µm
Reference velocity, U ref 1 m   s 1
Density ratio (L/G)1-
Viscosity ratio (L/G)138.32-
Surface tension, σ 0.0406 N   m 1
Unit cell pressure drop, Δ p UC 250 N   m 3
Results
Bubble velocity, U B 1.367 m   s 1
Capillary number, C a 0.0425-
Reynolds number, R e 127.6-
Liquid film thickness6.08µm
Bubble length166.4µm
Slug length133.6µm
Publisher’s Note: MDPI stays neutral with regard to jurisdictional claims in published maps and institutional affiliations.