Article

A Comparison of Newtonian and Non-Newtonian Models for Simulating Stenosis Development at the Bifurcation of the Carotid Artery

by
Aikaterini C. Stamou
1,
Jovana Radulovic
2 and
James M. Buick
2,*
1
School of Computing, Mathematics and Data Science (CMD), Faculty of Engineering Environment and Computing, Engineering and Computing Building, Coventry University, 3 Gulson Road, Coventry CV1 2JH, UK
2
School of Mechanical and Design Engineering, University of Portsmouth, Anglesea Building, Anglesea Road, Portsmouth PO1 3DJ, UK
*
Author to whom correspondence should be addressed.
Fluids 2023, 8(10), 282; https://doi.org/10.3390/fluids8100282
Submission received: 1 September 2023 / Revised: 9 October 2023 / Accepted: 18 October 2023 / Published: 20 October 2023
(This article belongs to the Special Issue Biological Fluid Dynamics)

Abstract

:
Blood is a shear-thinning non-Newtonian fluid in which the viscosity reduces with the shear rate. When simulating arterial flow, it is well established that the non-Newtonian nature is important in the smallest vessels; however, there is no consistent view as to whether it is required in larger arteries, such as the carotid. Here, we investigate the importance of incorporating a non-Newtonian model when applying a plaque deposition model which is based on near-wall local haemodynamic markers: the time-averaged near wall velocity and the ratio of the oscillatory shear index to the wall shear stress. In both cases the plaque deposition was similar between the Newtonian and non-Newtonian simulations, with the observed differences being no more significant than the differences between the selected markers. More significant differences were observed in the haemodynamic properties in the stenosed region, the most significant being that lower levels of near-wall reverse flow were observed for a non-Newtonian fluid.

1. Introduction

Blood is a heterogeneous suspension of small deformable red blood cells, white blood cells, platelets and other matter in plasma. Red blood cells characterise the main rheological behaviour of the fluid [1]. Unless flow is sufficient to keep them dispersed, red blood cells tend to adhere to each other due to bridging by plasma proteins [2]. In bulk shear flow, aggregation increases blood viscosity at low shear rates. As the shear rate increases, the progressive breakup of aggregates leads to a decrease in viscosity (“shear thinning”) [3]. Despite this fact, a large body of literature concerning computational haemodynamics characterises blood as a Newtonian fluid under the assumption that this is acceptable in large arteries [4].
A number of studies have compared Newtonian and non-Newtonian models and have suggested that there are significant discrepancies. Gijsen et al. [5] presented both experimental and numerical results for unsteady flow in a 90° curved tube and observed a number of differences which led to the conclusion that a non-Newtonian flow can not be accurately predicted with a Newtonian model, although they also suggest that a Newtonian model can provide reasonable results if the Reynolds number is re-scaled based on the characteristic viscosity. Kumar et al. [6] presented a 3D comparison using the Carreau–Yasuda (C-Y) non-Newtonian model. The simulations were performed in ANSYS using a patient-specific model for a patient with partial arterial narrowing. They concluded that the wall shear stress (WSS), in particular, was highly influenced by the non-Newtonian nature of the blood. Weddell et al. [7] used a finite element to implement the C-Y model. This was compared to a Newtonian model in idealised artery geometries with straight sections of arteries and bifurcations at a pre-defined angle. The results were seen to be highly influenced by the non-Newtonian nature of the blood, although many of the arteries were narrower than the carotid. Wang and Bernsdorf [8] presented a 3D study using the lattice Boltzmann method (LBM) for the idealised situation of steady flow in a cylindrical artery with differing levels of stenosis, where the C-Y model was used for the non-Newtonian simulations. They found significant differences, particularly in the severely stenosed case. Rabby et al. [9] also considered simulations though an axi-symmetric artery model. This was performed using the finite-volume approach with pulsation flow and using the cross non-Newtonian model. They also observed differences between the two fluid models, which were more significant in the most severe stenosis. In contrast, a number of studies have suggested differences are small. Baaijens et al. [10] used the Casson and a power law non-Newtonian model to perform 2D simulations of the carotid bifurcation using a finite-element approach. They concluded that the general flow structure is not influenced by the use of a non-Newtonian model and that where they did observe differences, these were dependent on the non-Newtonian model used. Boyd and Buick [11] considered a 2D carotid artery model using the LBM and a C-Y non-Newtonian model. They considered the velocity and shear, particularly in the near-wall region, and concluded that any differences were small. Morbiducci et al. [12] presented a comparison in a 3D model of carotid bifurcation using a finite-volume simulation and both Carreau and Ballyk shear-thinning models for the blood. They concluded that a Newtonian model is reasonable for bulk flow metrics, such as the WSS. Where differences were observed, they were seen to be dependent on the bifurcation model being used. Perktold et al. [13] performed 3D simulations using the finite-element method and a Casson non-Newtonian method. They observed features such as reverse flow, flow separation and recirculation zones and concluded that the resulting WSS were predominantly determined by the bifurcation angle.
These contrasting observations can in some way be reconciled in terms of differences between the physical and numerical models. Gijsen et al. [5] performed simulations at the carotid bifurcation which showed significant difference between the Newtonian and non-Newtonian models; however, when the simulations were repeated [5] for slightly different physical parameters (those used in [13]), the differences were less significant. This was similarly observed by Abugatta et al. [14] were differences were observed between a C-Y and a power law non-Newtonian model. Although some authors recommend using a non-Newtonian mode [15], other authors have suggested that the differences are small; for example, Morbiducci et al. [12] found the sensitivity of the oscillatory shear index (OSI) and time-averaged wall shear stress (TAWSS) to be no more than 10% and that these levels were not significant compared to the resolution of imaging of the artery geometry and uncertainties in the inlet velocity. Similar conclusions were also arrived at by Lee and Steinman [16] and Gharahi et al. [17], who found that the need for a non-Newtonian model was dependant on the specific geometry which was being simulated. There is no general consensus as to whether a non-Newtonian model is required [18]; however, where differences are observed it is often in haemodynamic properties close to the wall, such as the WSS observed in [6] and even in larger arteries such as the aorta [19].
Application of the lattice Boltzmann method (LBM) to stenosis development has been more limited, with a small number of models being proposed. Tamagawa and Matsuo [20] proposed a blood clotting model where a tracer particle was transported and adhered to the wall when both its proximity and the shear rate were below specified thresholds. The adhesion rule was later extended [21] to include concentration and surface tension. An alternative approach [22,23] also considered tracer particles, with adhesion accruing based on a prescribed residence time in the vicinity of the wall. A further approach [24] considered combination of residency time and an integrated accumulation of the stress. Karimpour and Javdan [25] considered an LBM model where regions of high OSI were considered as prone to atherosclerosis and, at each step, layers of deposits were progressively deposited. More recently, the model considered here has been proposed [26], which simulates the early stages of stenosis development based on the local haemodynamics, in particular by enabling the stenosis to form in regions of low time-averaged velocity and low wall shear stress. This model has the advantage that the stenosis develops in a local manner using deposits which are sufficiently small that their physical size does not influence the development [26], as opposed to [25] where this happens in layers. Additionally, the developing stenosis tends to be smoother and does not exhibit a staircase boundary in [25], which leads to boundary roughness and fluctuations in the wall velocity, both of which feed into the OSI calculation.
In this paper, we consider the implementation of a recently proposed plaque growth model [26] and in particular examine the extent to which the use of a non-Newtonian fluid model affects the performance of the model, the development of the stenosis and the near-wall haemodynamic properties of the blood. The plaque growth model simulates the development of a stenosis by modelling the deposition of plaque on the artery wall using markers derived from the near-wall haemodynamic parameters, which are known to be the most dependant on the non-Newtonian nature of the fluid. This means that the plaque deposition model will be potentially more sensitive to the non-Newtonian nature of the blood, compared to models of flow in a fixed artery geometry. To investigate this, we compared stenosis development between a Newtonian and non-Newtonian fluid using two different haemodynamic markers to trigger the stenosis formation and development. Further, five commonly measured and/or simulated near-wall haemodynamic parameters were considered on the stenosis wall, again to investigate the impact of the non-Newtonian features of the blood.
The numerical approach is set out in Section 2 in terms of the LBM, the non-Newtonian model and the boundary conditions, including the plaque deposition model. The parameters used in the simulation are set out and determined in Section 3. The results are presented in Section 4 for the stenosis development and changes in the near-wall haemodynamic properties as the stenosis develops. These are presented for both the Newtonian and non-Newtonian models and the results compared. Finally, the conclusions are set out in Section 5.

2. Numerical Model

Here, we briefly describe the lattice Boltzmann method (LBM) approach and how it can be adapted for non-Newtonian fluids, the plaque development model and the specific details applied in this study. The simulations are performed in 2D with a rigid wall approximation. The rigid wall is a good approximation in the stenosed region, and the 2D simulation allows the main features of the flow to be observed and differences between the non-Newtonian simulations and the Newtonian approximation to be assessed.

2.1. The Lattice Boltzmann Method

The LBM in a numerical method which mimics the Navier–Stokes equation based on a kinetic approach [27]. Although the LBM is a more recent development compared to alternative simulation approaches in computational fluid dynamics, such as the finite-volume and finite-element methods, it is now well established and considered as an alternative to the conventional approaches, and it includes blood flow [28,29,30,31,32,33,34] and non-Newtonian [35,36,37,38,39,40,41,42] simulations. It is considered to have a number of advantages over conventional methods [43]: incorporation of microscopic interactions, particularly for simulating complex fluids such as colloidal suspensions, bubbles, solid particle suspension and polymer-solvent systems [44]; suitability for parallel computing; and, of particular reliance to this study, dealing with complex boundaries [43] and implementing non-Newtonian fluid models in an efficient manner, as will be seen in Section 2.1. Disadvantages of the LBM are that it is generally implemented on a regular mesh, preventing a higher mesh density being included in areas such as turbulent boundary layers, and there are limitations in areas of high-Mach number, large pressure or density variation and thermo-hydrodynamic problems. Often, these can be overcome by coupling with alternative approaches; however, this can reduce the overall simplicity and efficiency of the LBM approach.
A Newtonian fluid is described in terms of the distribution function f i ( x , t ) which satisfies the Bhatnagar–Gross–Krook (BGK) LBM equation [27,45,46]
f i ( x + e i , t + 1 ) f i ( x , t ) = 1 τ f i ( x , t ) f i e q ( x , t ) .
The index i labels the link directions, e i , of the mesh used in the simulations. Here, we consider the mesh D2Q9, where D is the number of dimensions and Q is the number of velocity directions on the mesh—including the “rest-particle” given by e 0 = ( 0 , 0 ) and
e i = cos π 2 ( i 1 ) , sin π 2 ( i 1 ) for i = 1 , 2 , 3 , 4 e i = 2 cos π 2 ( i 1 ) + π 4 , sin π 2 ( i 1 ) + π 4 for i = 5 , 6 , 7 , 8 .
The local fluid properties at each mesh node are found from the associated distribution functions, f i ( x , t ) as
ρ ( x , t ) = i = 0 i = 8 f i ( x , t ) and ρ ( x , t ) u ( x , t ) = i = 0 i = 8 f i ( x , t ) e i
and the equilibrium distribution function, f i e q ( x , t ) , is obtained from the local density and velocity as
f i e q ( x , t ) = w i ρ 1 + 3 e i · u + 9 2 ( e i · u ) 2 3 2 u 2 ,
where w 0 = 4 / 9 , w 1 = w 2 = w 3 = w 4 = 1 / 9 and w 5 = w 6 = w 7 = w 8 = 1 / 36 . The discretization method derives from the lattice gas model, which preceded the LBM, in which discrete fluid particles moved between the sites of the regular mesh with a speed of unity (taking it to the neighbouring sites) or zero (remaining at the site). In the LBM, the distribution functions f i are used in place of the discrete particles to overcome a number of limitations and to provide a statistical representation of the fluid. This is achieved through streaming of the distribution functions to nearest neighbour nodes, represented by the left-hand side of Equation (1), followed by a collision step, represented by the right-hand side of Equation (1), corresponding to the distribution functions relaxing towards their equilibrium form. Despite the simplicity of this discretization and the use of only nearest neighbour sites in the LBM equation, the scheme gives second-order accuracy [47].
The continuity and Navier–Stokes equations can be derived from the LBM equation, Equation (1), using a Chapman–Enskog expansion, following Frisch et al. [48]. Taylor expanding the the left-hand side of Equation (1) with respect to x and t, we find that to the second order in the small expansion parameter ϵ :
f i t + e i · f i + ϵ 1 2 e i · 2 f i + e i · f i t + 1 2 2 f i t 2 .
Expanding f i in terms of the equilibrium value, f i ( e q ) , gives
f i = f i ( e q ) + ϵ f i ( 1 ) + ϵ 2 f i ( 2 ) + O ϵ 3 ,
where conservation of mass and momentum require
i f i ( k ) = 0 , i e i f i ( k ) = 0 k = 1 , 2 .
Finally, the differentials are also expanded in terms of ϵ :
t = ϵ t 1 + ϵ 2 t 2 , x = ϵ x 1 .
The right-hand side of Equation (1) can also be expanded as
1 τ f i ( 1 ) + ϵ f i ( 2 ) .
Considering separately the terms of different order in ϵ in Equations (5), (6), (8) and (9), and summing over i, while considering the constraints in Equation (7), yields the continuity Equation [27]
ρ t + · ρ u = 0 .
Repeating the procedure but multiplying Equations (5) and (9) by e i before the summation achieves the Navier–Stokes Equation [27]
u α t + β u α u β = α p ρ + ν β α ρ u β + β ρ u α ,
where α and β represent the vector components and summation over repeated Greek indices is assumed. The kinematic viscosity of the fluid is found from the relaxation time, τ , in Equation (1) as
ν = ( 2 τ 1 ) 6 .
The strain rate tensor, S α β , can be calculated at each site from the distribution function as [49]
S α β = 3 2 τ i f i f i e q e i α e i β .
The f i e q terms are usually calculated as part of the velocity calculations in the Newtonian LBM algorithm. This means that calculating the shear through Equation (13) manner removes the need to calculate derivatives of the velocity and provided an efficient method of implementing a non-Newtonian fluid [47,50]. Further, this is a local calculation method, which is particularly advantageous if the LBM is being implemented in parallel.

2.2. Non-Newtonian Simulations

For a shear-thinning fluid such as blood, the viscosity, μ , is no longer constant but is a function of the shear viscosity, γ ˙ , defined as
γ ˙ = 2 D I I ,
where D I I is the second invariant of the strain rate tensor [51]:
D I I = α , β S α β S α β .
The shear-thinning nature of blood can be mimicked using the C-Y model [52,53,54,55]:
μ γ ˙ = μ + μ 0 μ 1 + λ γ ˙ a n 1 a ,
where γ ˙ is the shear rate, and α , n and λ are empirically determined constant parameters [51]. The parameters α and n are dimensionless, and λ has units of time. The C-Y model is continuous for all γ ˙ 0 , and μ 0 and μ are limiting values of the viscosity in the lowest and highest shear rate cases, respectively.

2.3. Boundary Conditions

The cardiac pulse was simulated using the profile shown in Figure 1 [56].
The pulse shape was derived from 3560 cardiac cycles of Doppler ultrasound measurements taken from six female and eleven male volunteers who had no symptoms or diagnosis of cardiovascular disease and so can be assumed to be normal human subjects [56]. It has been applied in a range of simulations of the carotid artery [57,58,59,60,61]. This was implemented at the base of the geometry where the distribution functions are set to their equilibrium values, Equation (4), for the time-dependant normal velocities shown in Figure 1. A boundary-layer was introduced over a length of approximately 1 mm, over which the velocity linearly reduced to zero. This bottom boundary is approximately 10 cm below the region of interest shown in the results section. At the top of the artery, an extrapolation scheme [62] was used to produce an outflow condition. This was applied approximately 20 cm from the region of interest.
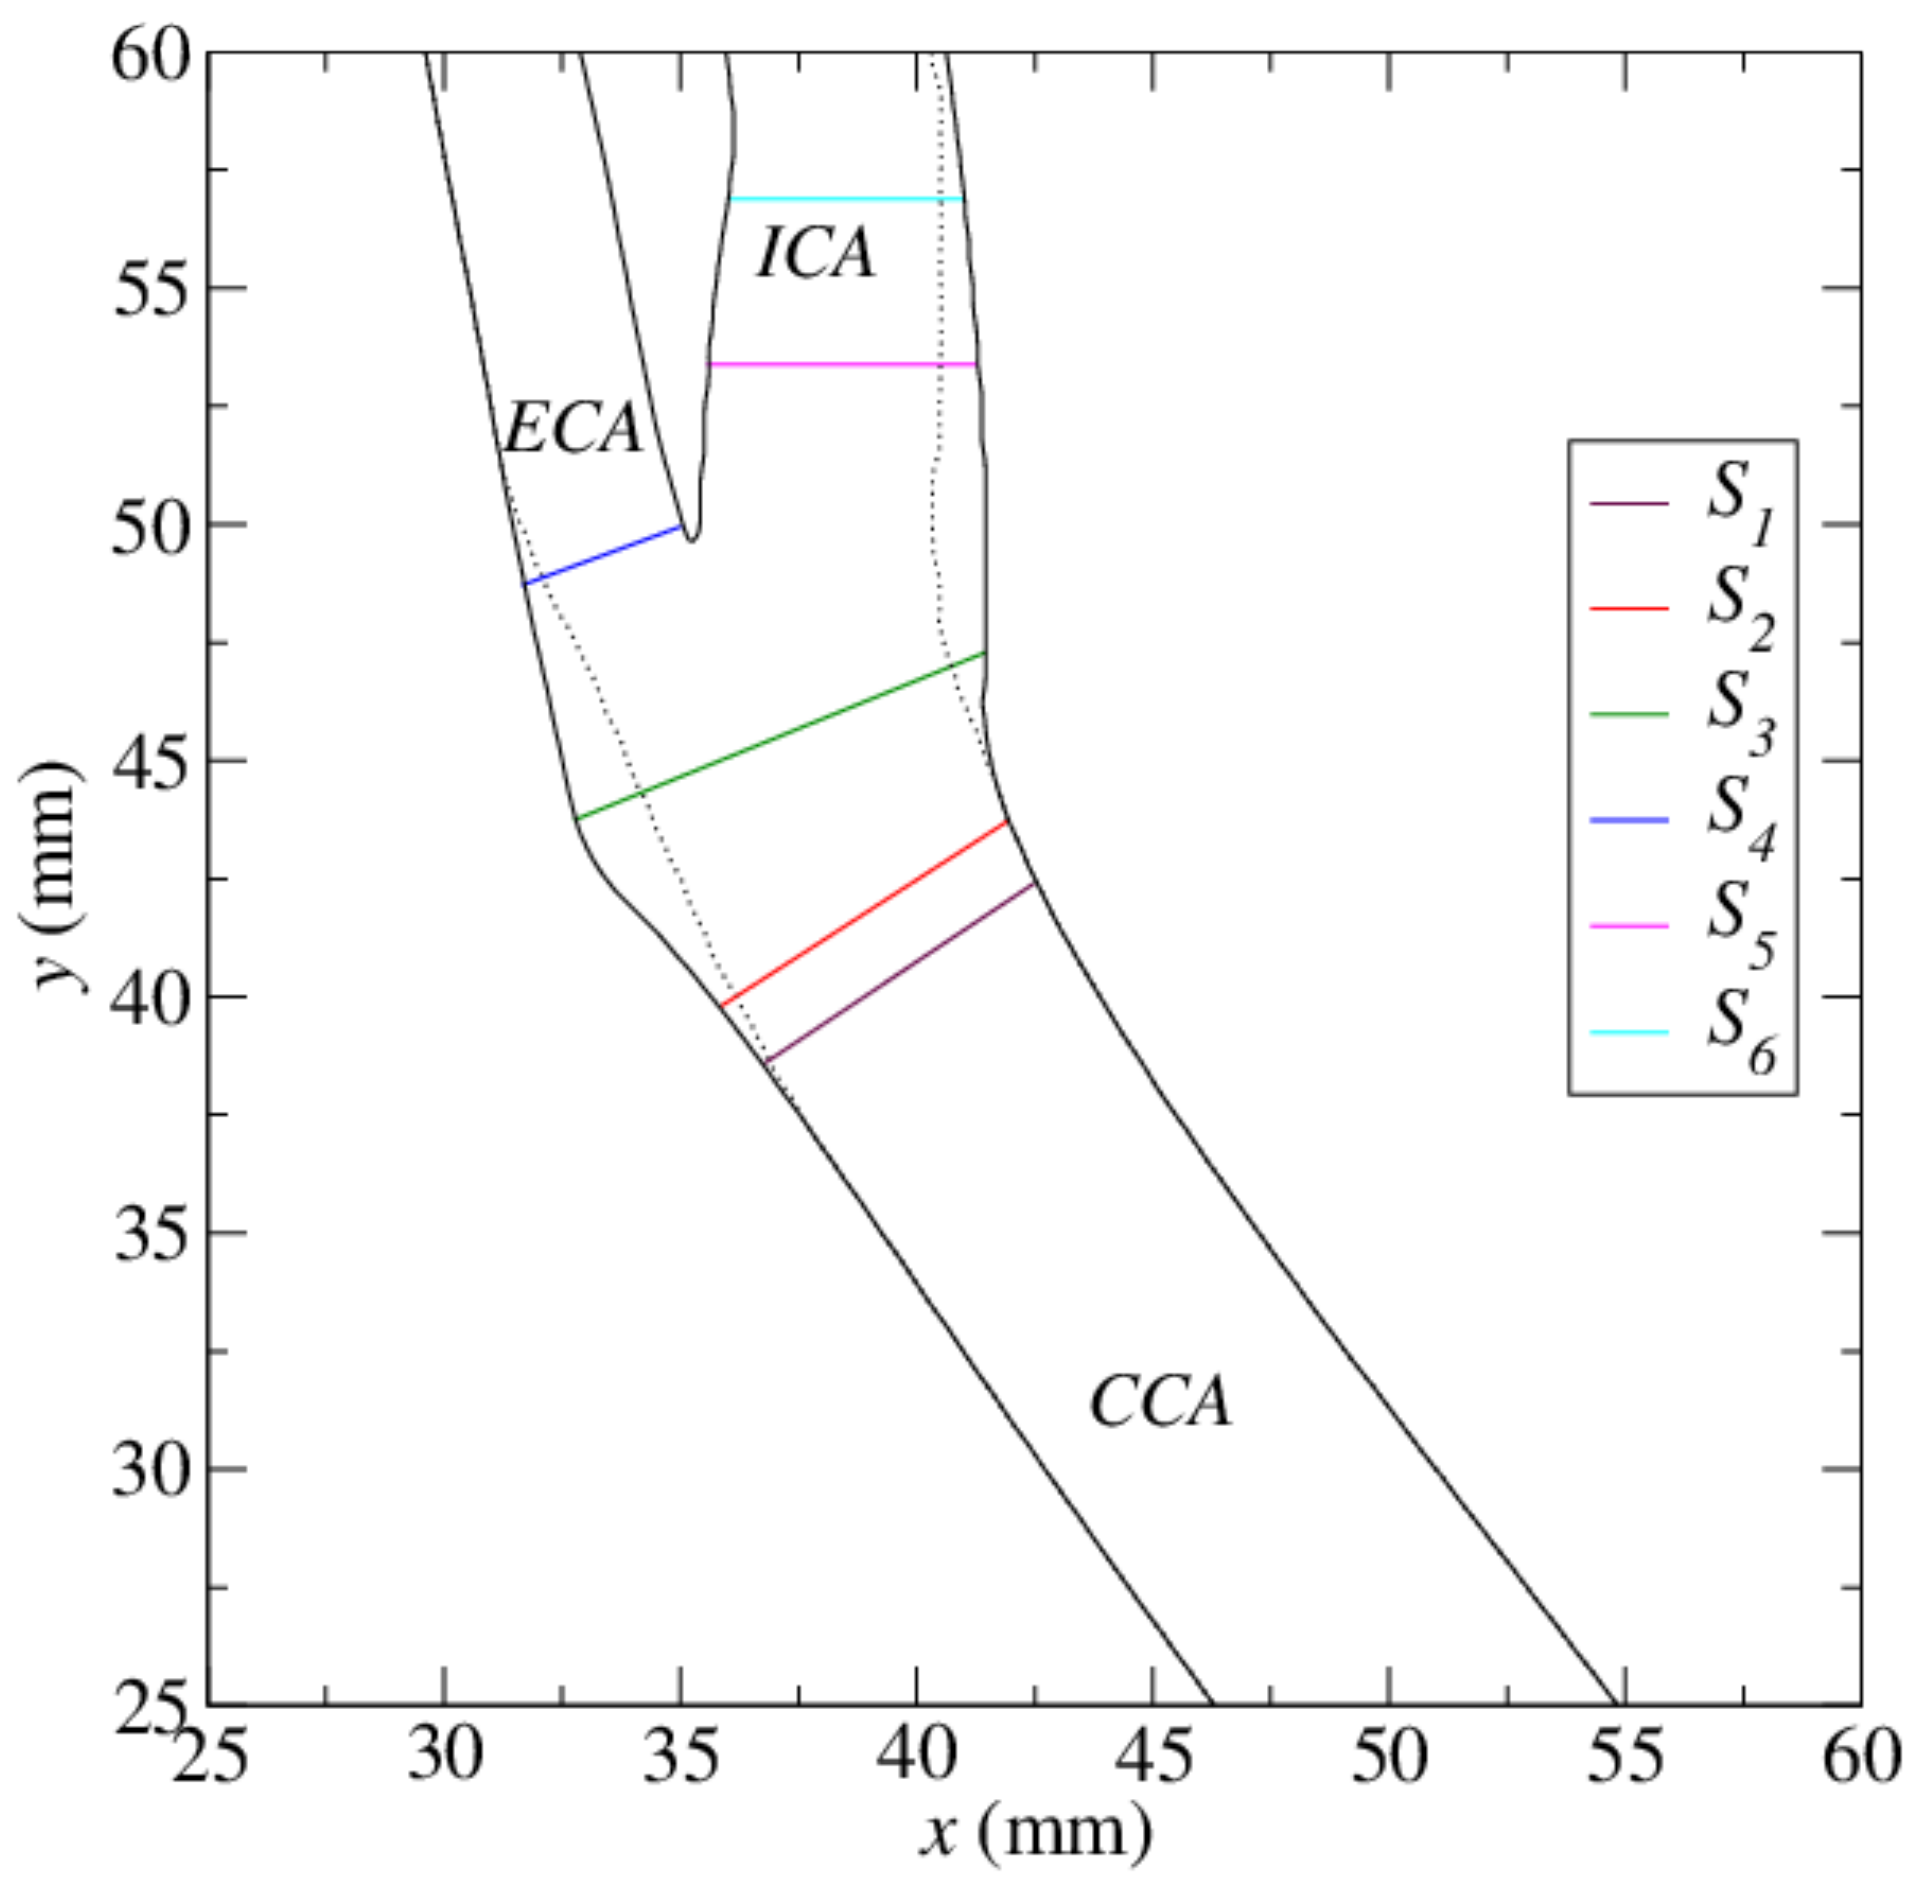
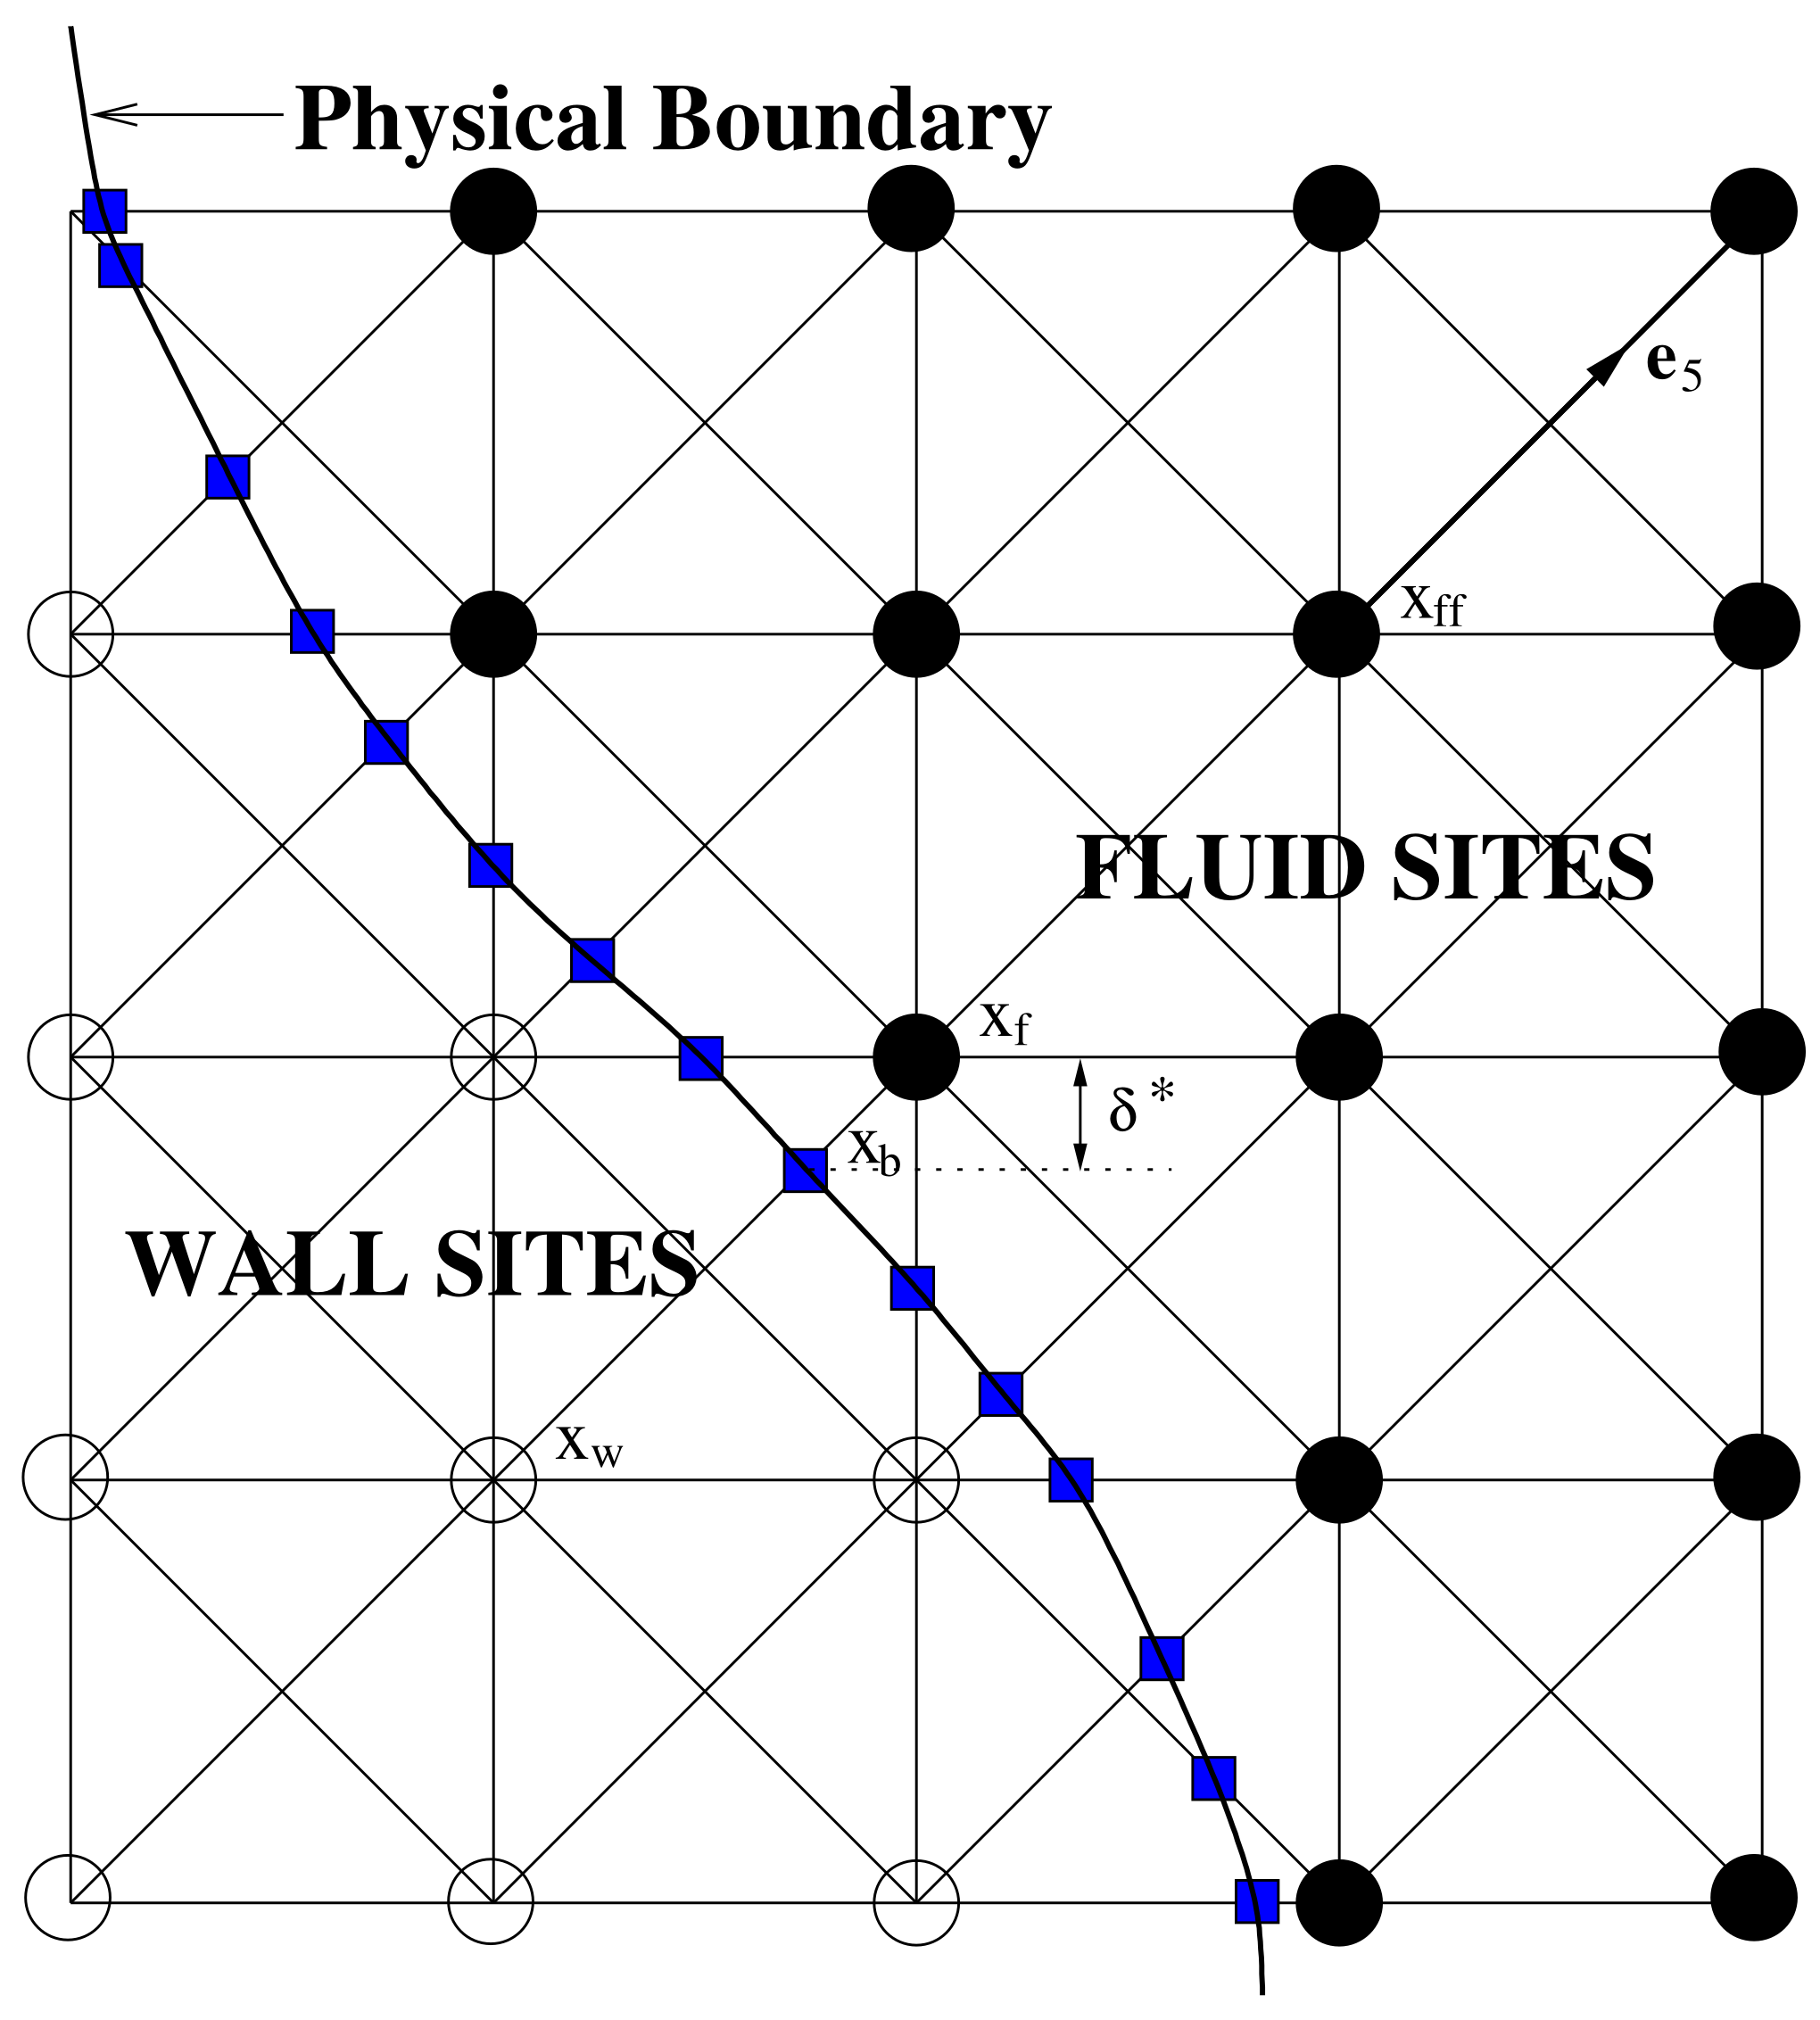
The geometry of the artery is shown in Figure 2, which shows the external carotid artery (ECA), internal carotid artery (ICA) and common carotid artery (CCA) as well as sections S 1 S 6 . These were selected post-simulation to cover the region where the stenosis forms and are used to present the stenosis development. The healthy artery is depicted by the solid lines, and the dotted lines show the extent of plaque development, which is considered here. This was implemented, following [63], using second-order boundary conditions which represent the wall with sub-grid accuracy to overcome the restrictions of modelling the artery geometry on the underlying fixed grid. The underlying idea of Guo [63] is shown in Figure 3, where the fluid sites (filled circles) and the wall sites (empty circles) are separated by the curved boundary, represented by the solid line. The squares represent the wall points where the curved boundary intersects the lattice links. At the site x f , Equation (1) requires the distribution function f 5 to stream from the wall site x w , which is not available. This is calculated in terms of an equilibrium and a non-equilibrium part as
f i x w = f i ( e q ) x w + 1 1 τ f i ( n e q ) x w ,
From stability considerations, Guo [63] suggested two different formulations, depending on the value of δ * defined as the distance along the link between x f and x b normalised by the length of the link. For a diagonal link such as e 5 , this corresponds to the y-component (or x-component) of the vector as depicted in Figure 3. The non-equilibrium part is calculated as
f i ( n e q ) x w = f i ( n e q ) x f , if δ * 0.75
and
f i ( n e q ) x w = δ * f i ( n e q ) x f + 1 δ * f i ( n e q ) x f f , if δ * < 0.75 .
The equilibrium part is found from Equation (4) in terms of a fictitious density and velocity ρ w x w and u w x w with ρ w x w = ρ x f and u w = u w 1 for δ * 0.75 , and u w = δ * u w 1 + 1 δ * u w 2 , for δ * < 0.75 , where u w is determined by extrapolation based on the known boundary velocity, u b = u x b = 0 and the known velocities of u f = u x f and u f f = u x f f . The two approximations are quantified [63] as:
u w 1 = u b + δ * 1 u f δ * ,
and
u w 2 = 2 u b + δ * 1 u f f 1 + δ * .
This enables the artery wall to be modelled to sub-grid resolution with second-order accuracy.
Additionally, the plaque deposition model [26,64] was implemented at the end of each period to simulate the plaque deposition and development of the stenosis. This model monitors near-wall parameters over the previous period and then selects a point on the artery wall where the plaque will be deposited. When the model was first developed [26], this point was determined using the parameter u ( 1 ) , which was defined as the magnitude of the velocity one lattice unit from the wall. This was found for all nodes with a link cutting the boundary and averaged over a period:
u ( 1 ) ¯ = 1 T 0 T u ( 1 ) ( t ) d t ,
where T is the period. The selected point was where this integrated value had a minimum value. The plaque deposition model is implemented here in the same manner [26], using the same parameters; however, the markers used to identify the position for plaque deposition are the TAWSS and O:WS, which are defined as [65]
O:WS = OSI TAWSS
where the TAWSS is defined as
TAWSS = 1 T 0 T W S S d t
and the OSI as
OSI = 0.5 1 0 T W S S d t 0 T W S S d t ;
and the plaque is deposited where O:WS has a maximum value. The TAWSS marker performs similarly to the TA near-wall velocity introduced in [26] for a Newtonian fluid but is more appropriate when considering a non-Newtonian fluid. Plaque deposition occurs where TAWSS has a minimum value. These two markers were selected based on the observations [65] that they both led to the development of a realistic stenosis.
Full details are provided in [26]; here, we present an overview of the algorithm.
  • The LBM simulation is run until it reaches equilibrium using the healthy artery model.
  • A single period of the flow is simulated.
  • The haemodynamic parameter (TAWSS or O:WS) is monitored over the period at all wall-adjacent fluid sites.
  • The site where TAWSS has a minimum value (or O:WS a maximum) is selected.
  • The artery wall is moved into the fluid at the selected site by a distance of 0.3 of the grid length (this may move it beyond the fluid site, which will then become a wall site).
  • Steps 1–5 are repeated.

3. Model Parameters

Within the LBM simulations, non-dimensional parameters which describe the flow are calculated in terms of lattice units (lu) determined by the unit length of the underlying mesh (taken as a separation of 1 lu in the horizontal and vertical directions) and the time unit of one time-step. The LBM parameters are then selected to ensure that the key non-dimensional parameters calculated from the lu terms matches with those calculated from the SI terms describing the flow which is being simulated. R e δ is determined by:
R e δ = U δ ν
where δ is the Stokes layer thickness expressed as:
δ = ν T π .
The Womersley number is given by
α = D 2 2 π T ν .
Table 1 shows the SI parameters which describe the artery and flow, along with the Boltzmann parameters based on an artery diameter of 36 lu. These parameters preserve the model and the artery. In contrast to other numerical approaches, the mesh density relates to both the accuracy of the simulation but also the non-dimensional parameters describing the flow. This spatial resolution applied here has been investigated in [64], where the simulation results were compared to a grid with double the resolution and the same global R e and α . The result suggested that the arterial diameter of 36 lu provides adequate resolution, with differences in the normalised velocity being typically around 10 3 and no larger than 5 × 10 3 , comparable with observations elsewhere [47,66], and this resolution has also been found to be appropriate in comparable carotid artery simulations [26,64,65].
For non-Newtonian simulations, the C-Y model parameters, based on [67] are shown in Table 2, along with their Boltzmann equivalents.
We can rearrange Equation (27) to find the peak simulated velocity U 0 B as:
U 0 B = R e δ η B π T B ,
where a subscript “A” refer to that variable in physical SI units, and subscript “B” refers to variables in the LBM (lattice) units. Furthermore, from Equation (28):
T B = 2 π η B D B 2 a 2 .
For fixed values of R e δ and α , and D B , the suitable value of U B was selected. Matching Reynold’s numbers, we can find:
η B = η A U 0 B U 0 A 2 T B T A .
The values of λ are related by:
λ B = λ A T B T A .

4. Results and Discussion

The effect of the non-Newtonian nature of blood is now considered in two ways. Firstly, the effect it has on the plaque deposit model and the subsequent development of the stenosis is considered. Secondly, changes to the near-wall haemodynamic properties are presented.

4.1. Stenosis Development

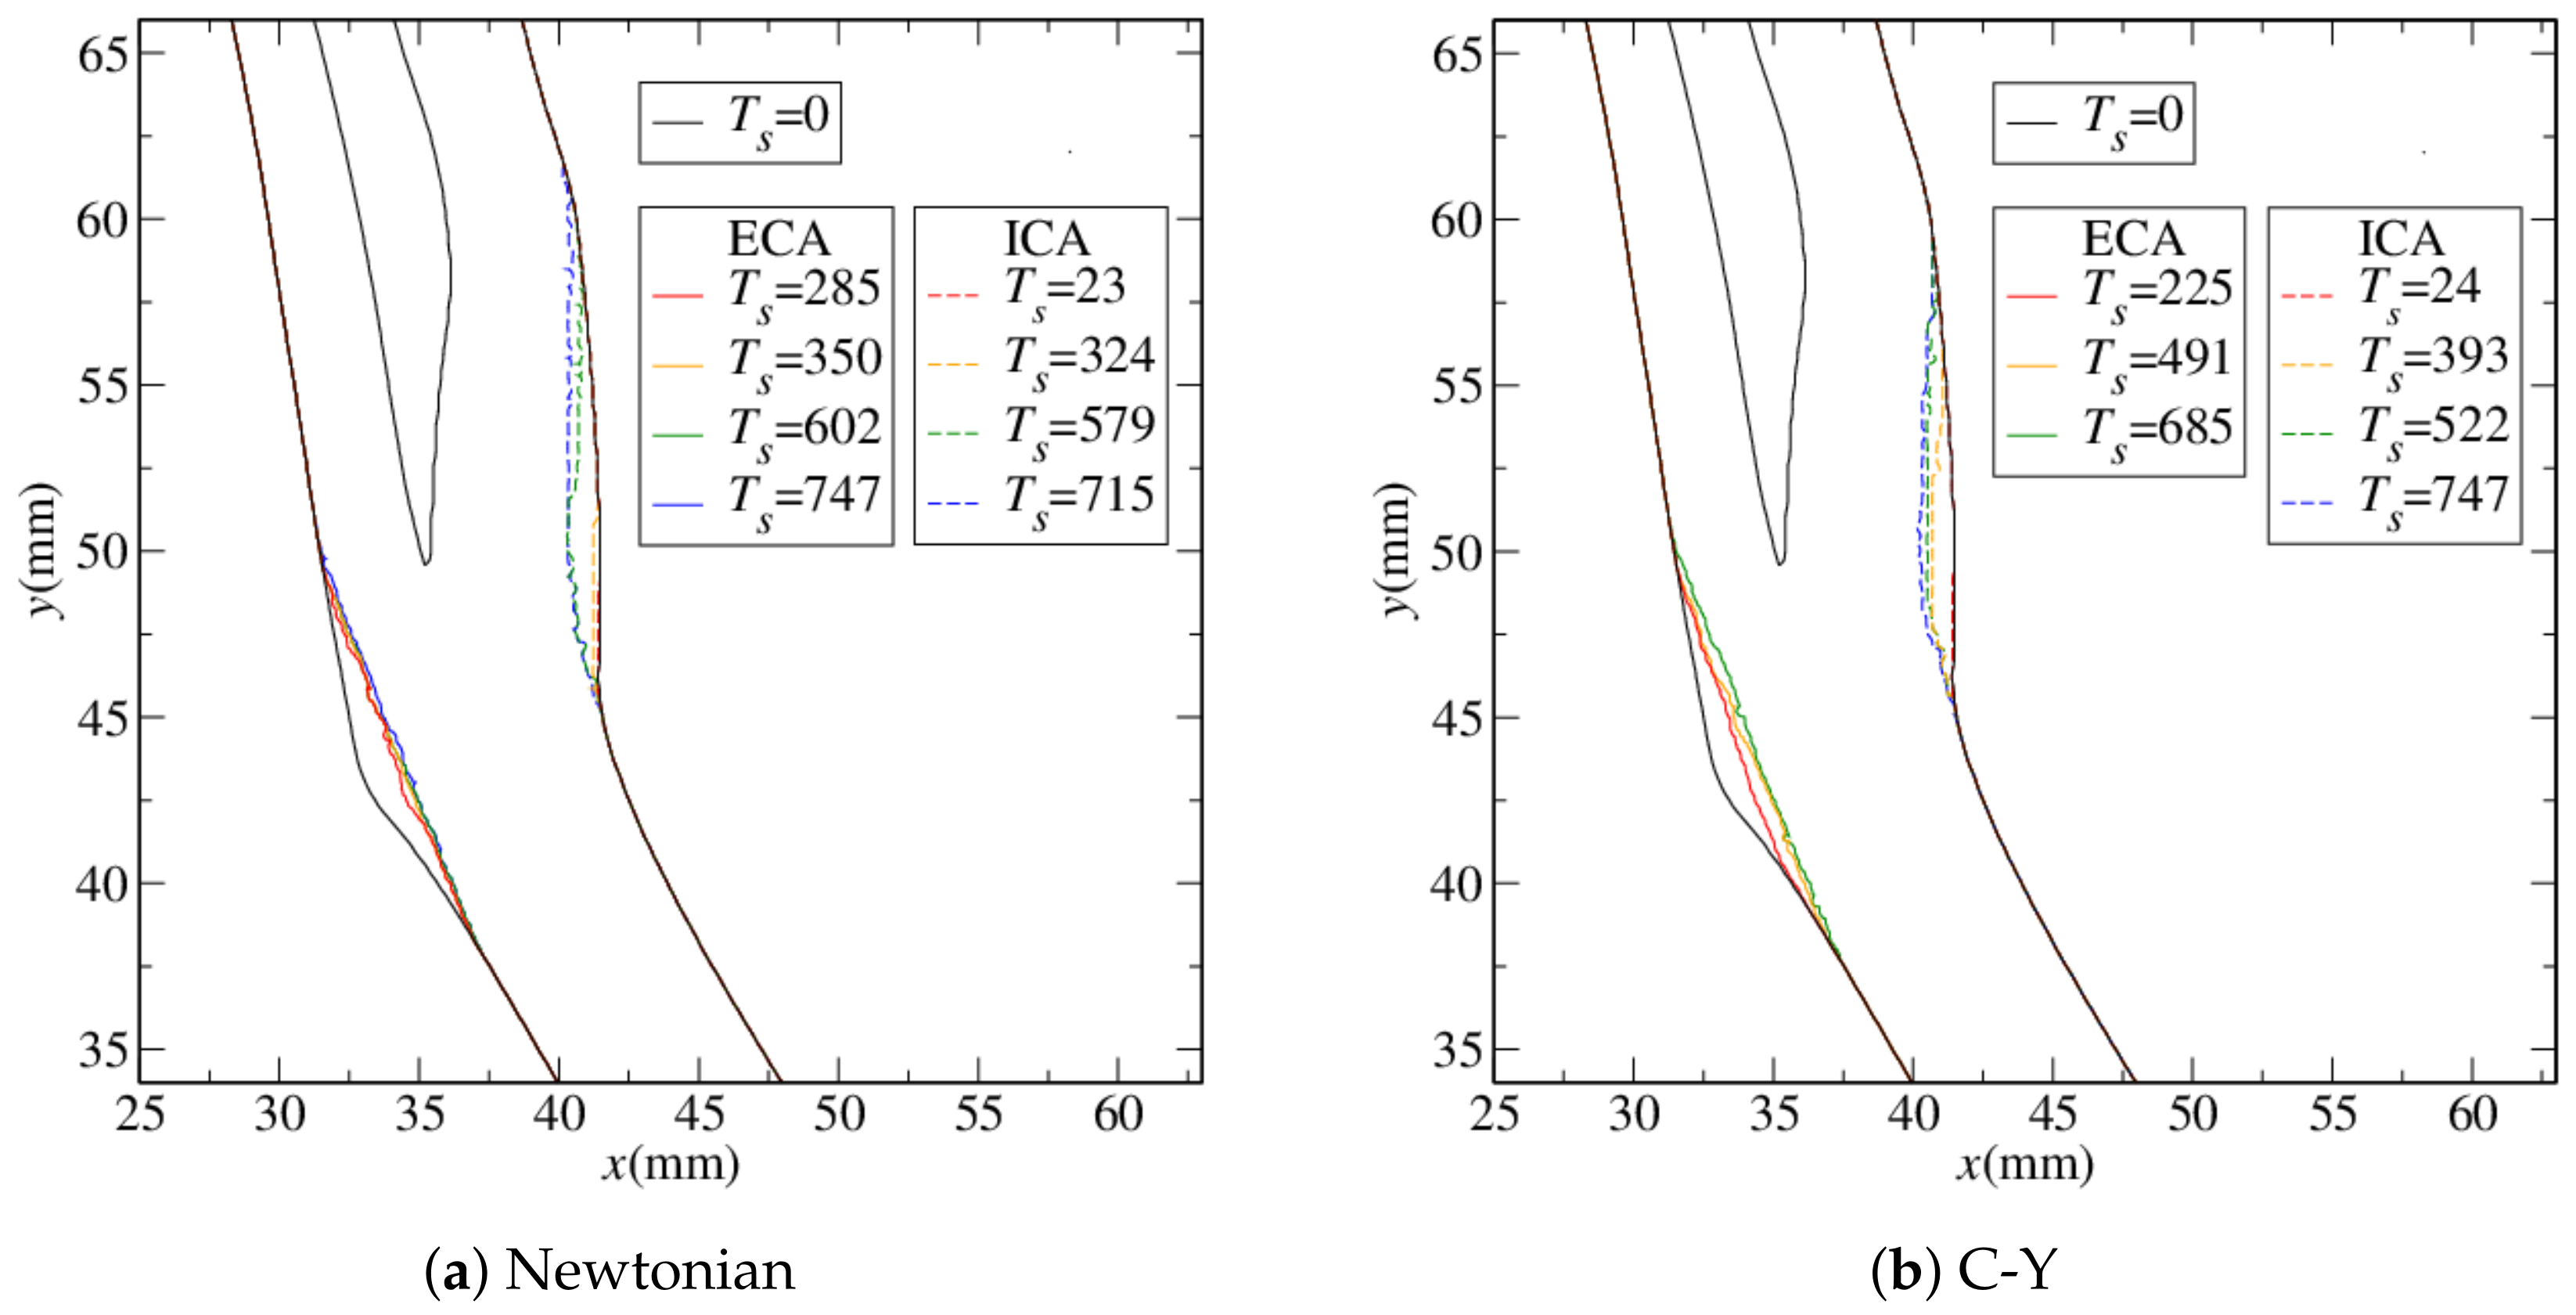
Results of the simulations are presented in Figure 4 and Figure 5 when TAWSS and O:WS are used as markers, respectively.
As observed in [26], the stenosis develops in layers as the plaque deposition is laid down sequentially on the ECA and ICA. The coloured lines in Figure 4 and Figure 5 represent the completion of each layer, after which the development switched to the other artery branch. Here, T s is the number of grid sites removed from the artery as the stenosis develops, which gives a measure of the evolution of the stenosis rather than a precise time-scale. The values given in the figures correspond to the times where the development of one layer finishes due to the changing haemodynamics, and the process switches to the other wall. We also note that there is no requirement in the model for the plaque to develop sequentially on the two walls. Indeed, a more detailed investigation of this process [64] showed that during the development of a layer on any wall, there are typically also small deposits elsewhere. In Figure 4 and Figure 5, the overall formation of the stenosis is similar for both the Newtonian and the non-Newtonian models; however, some differences can be observed. On the ECA, in Figure 4, the second, third and fourth layer do not significantly increase the stenosed region for the Newtonian case, while for the non-Newtonian case there is an observable difference between the first and last layers. Differences are also evident on the ICA where the second layer develops more significantly in the non-Newtonian model. However, these differences do not significantly affect the final stenosed geometry and are no greater than the differences between the two different markers (TAWSS in Figure 4 and O:WS in Figure 5).
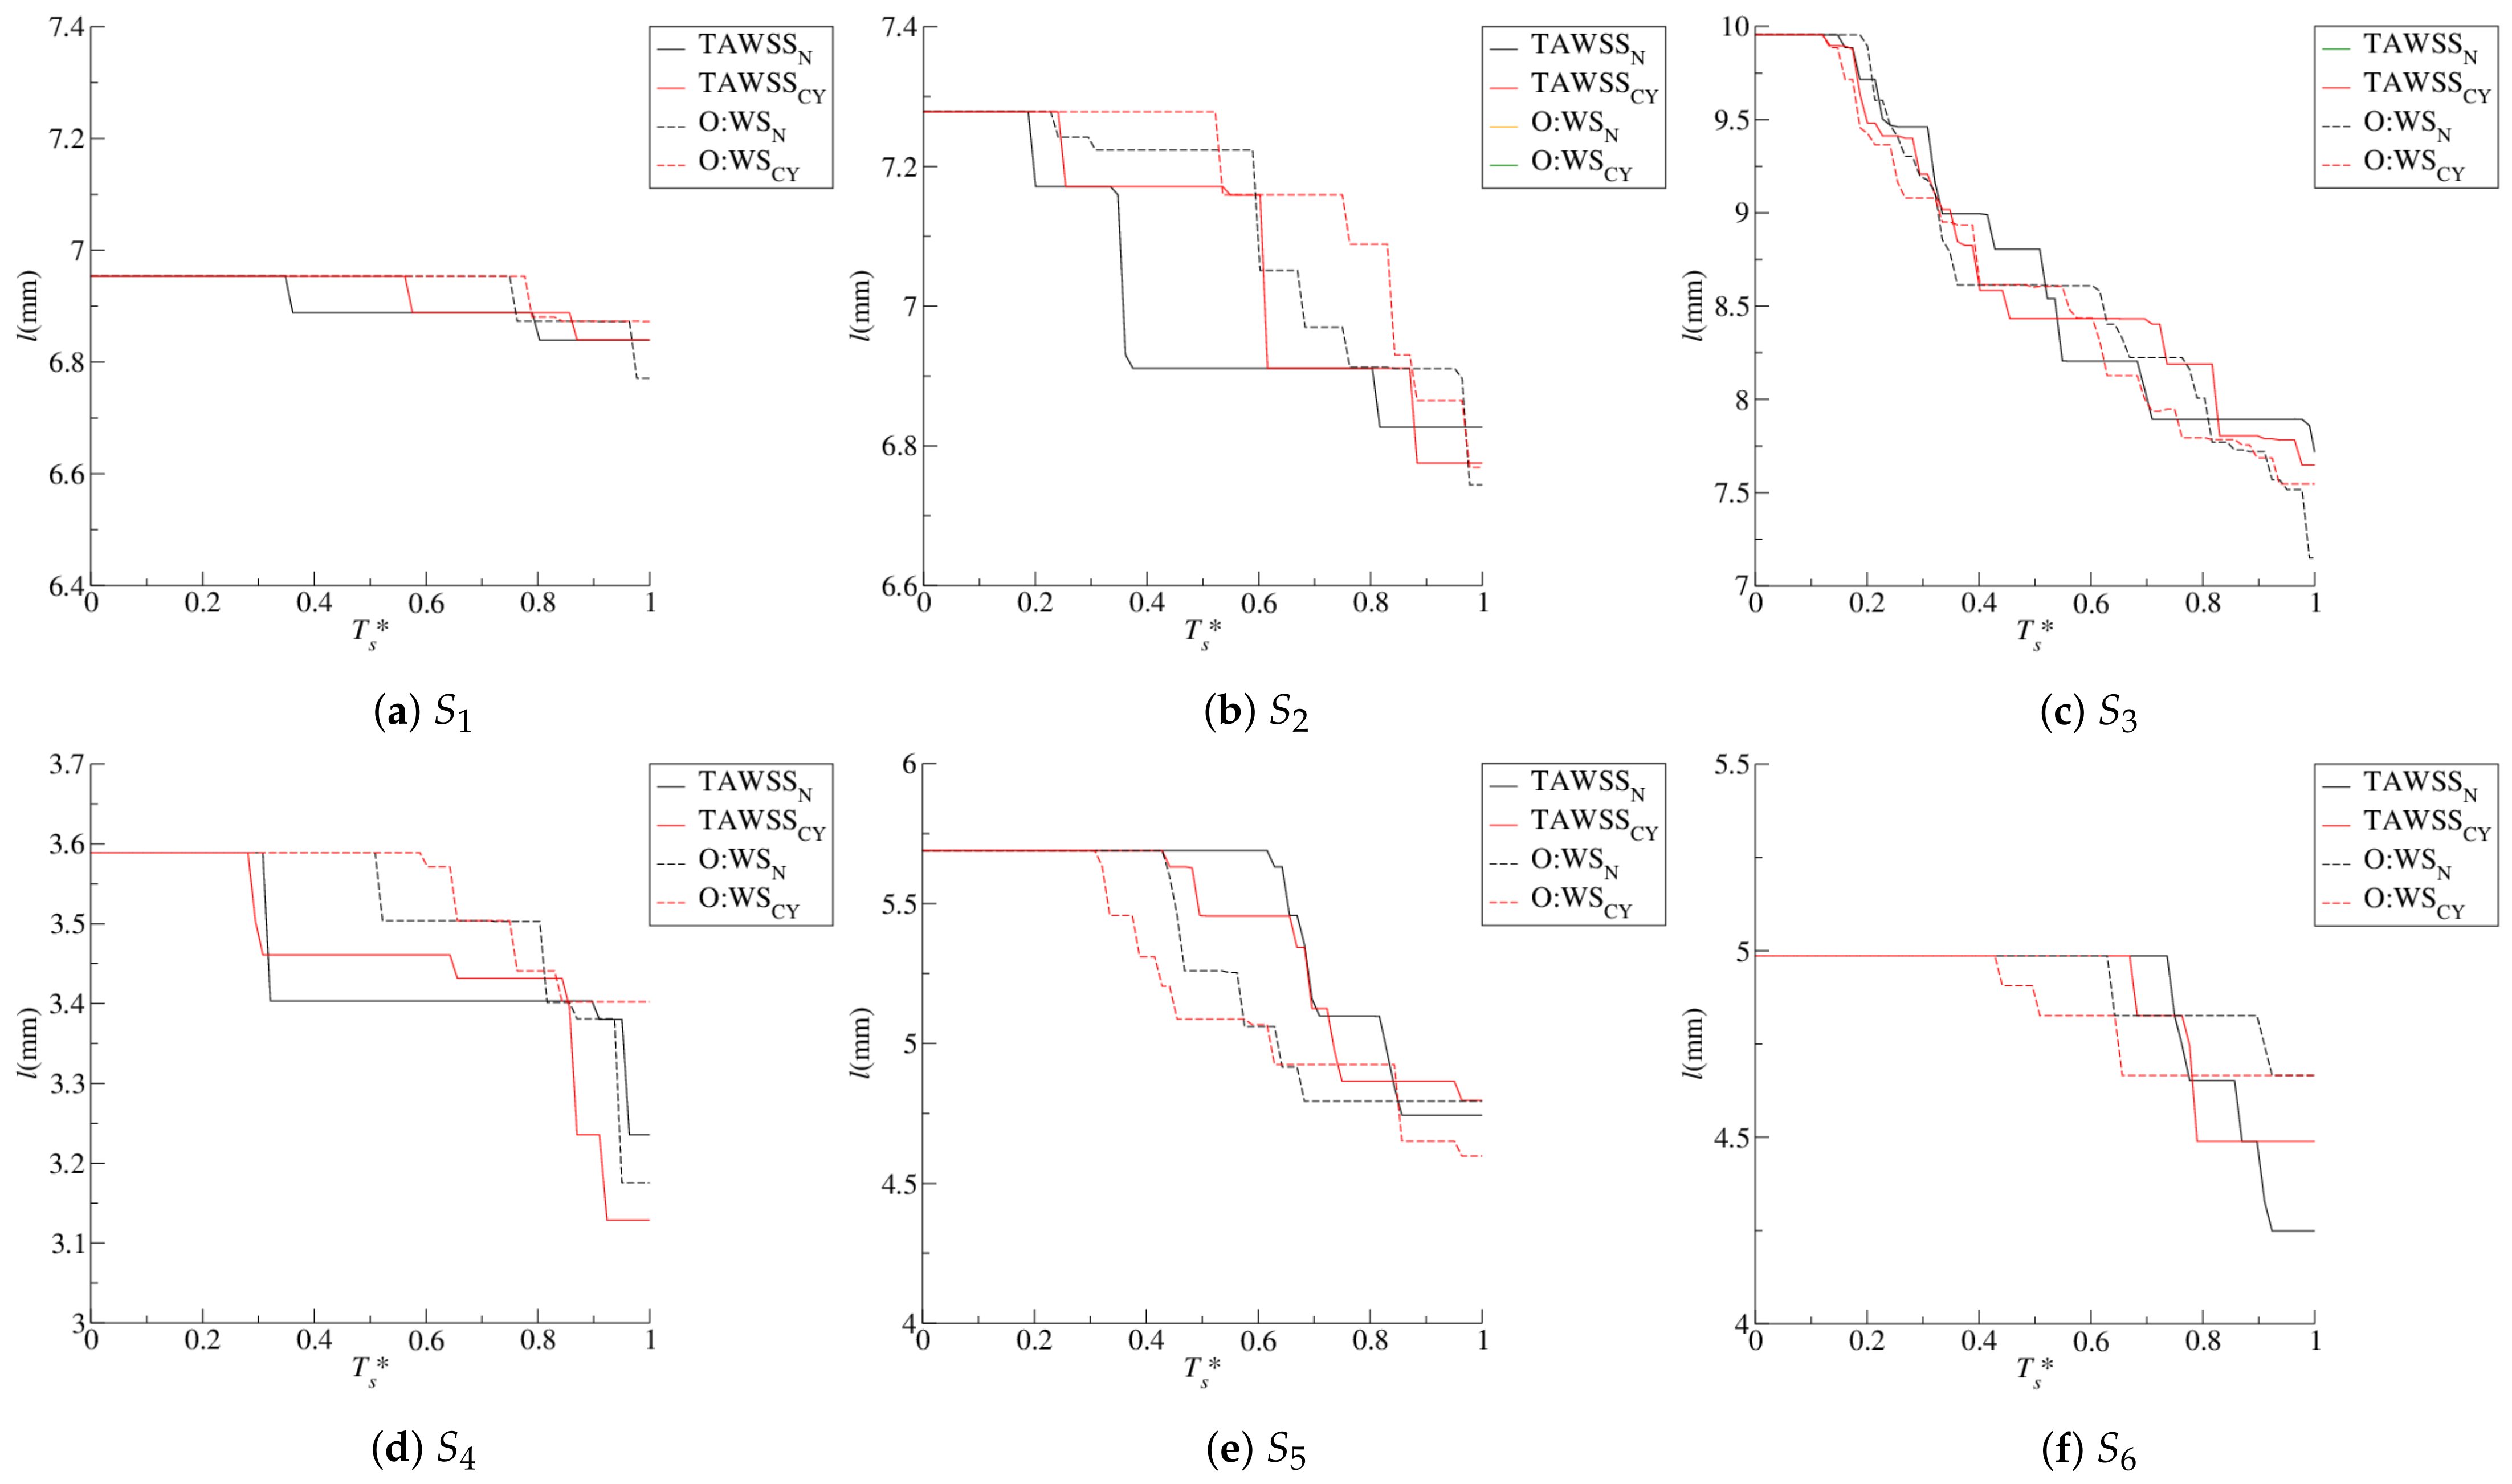
These differences are also evident in Figure 6 and Figure 7 which show, for markers TAWSS and O:WS, respectively, the development of the stenosis for both the Newtonian and non-Newtonian models and also a comparison between the two. The variable T s * represents the value of T s normalised by the maximum number of T s for the simulation. Figure 6c and Figure 7c show the differences Δ T s * = T s N * T s C Y * for the Newtonian and non-Newtonian model, which are generally small. A red/orange line is present through the ECA side corresponding to the differences in the layers discussed for Figure 4a. There is also a light blue region near the wall for the ICA region in Figure 7—this corresponds to the differences in layer 2 observed in Figure 4b. Figure 8 shows how the area in the ECA and ICA, corresponding to sites converted from fluid to wall, grows with T s * . Although the final level of plaque deposition is seen to be similar in Figure 8a,b, there are noticeable differences for 0.2 T s * < 0.6 and 0.8 T s * 1 . The first of these is due to the differences observed in Figure 4, Figure 6 and Figure 7, and the second, while smaller, again represents a difference in the development. Figure 9 shows differences in the rate at which the artery is being occluded on the artery sections shown in Figure 2. These differences are fairly small, but they do show the development being altered due to the non-Newtonian nature of the blood.

4.2. Near-Wall Haemodynamics

These observed changes in the artery geometry can potentially alter the haemodynamics in the artery. To investigate this, the TA near-wall velocity ( u ( 1 ) ¯ ), the TA of the tangential component of the near-wall velocity ( u t ( 1 ) ¯ ), OSI, the relative residency time
R R T 0 T W S S d t T ( 1 2 OSI ) 1
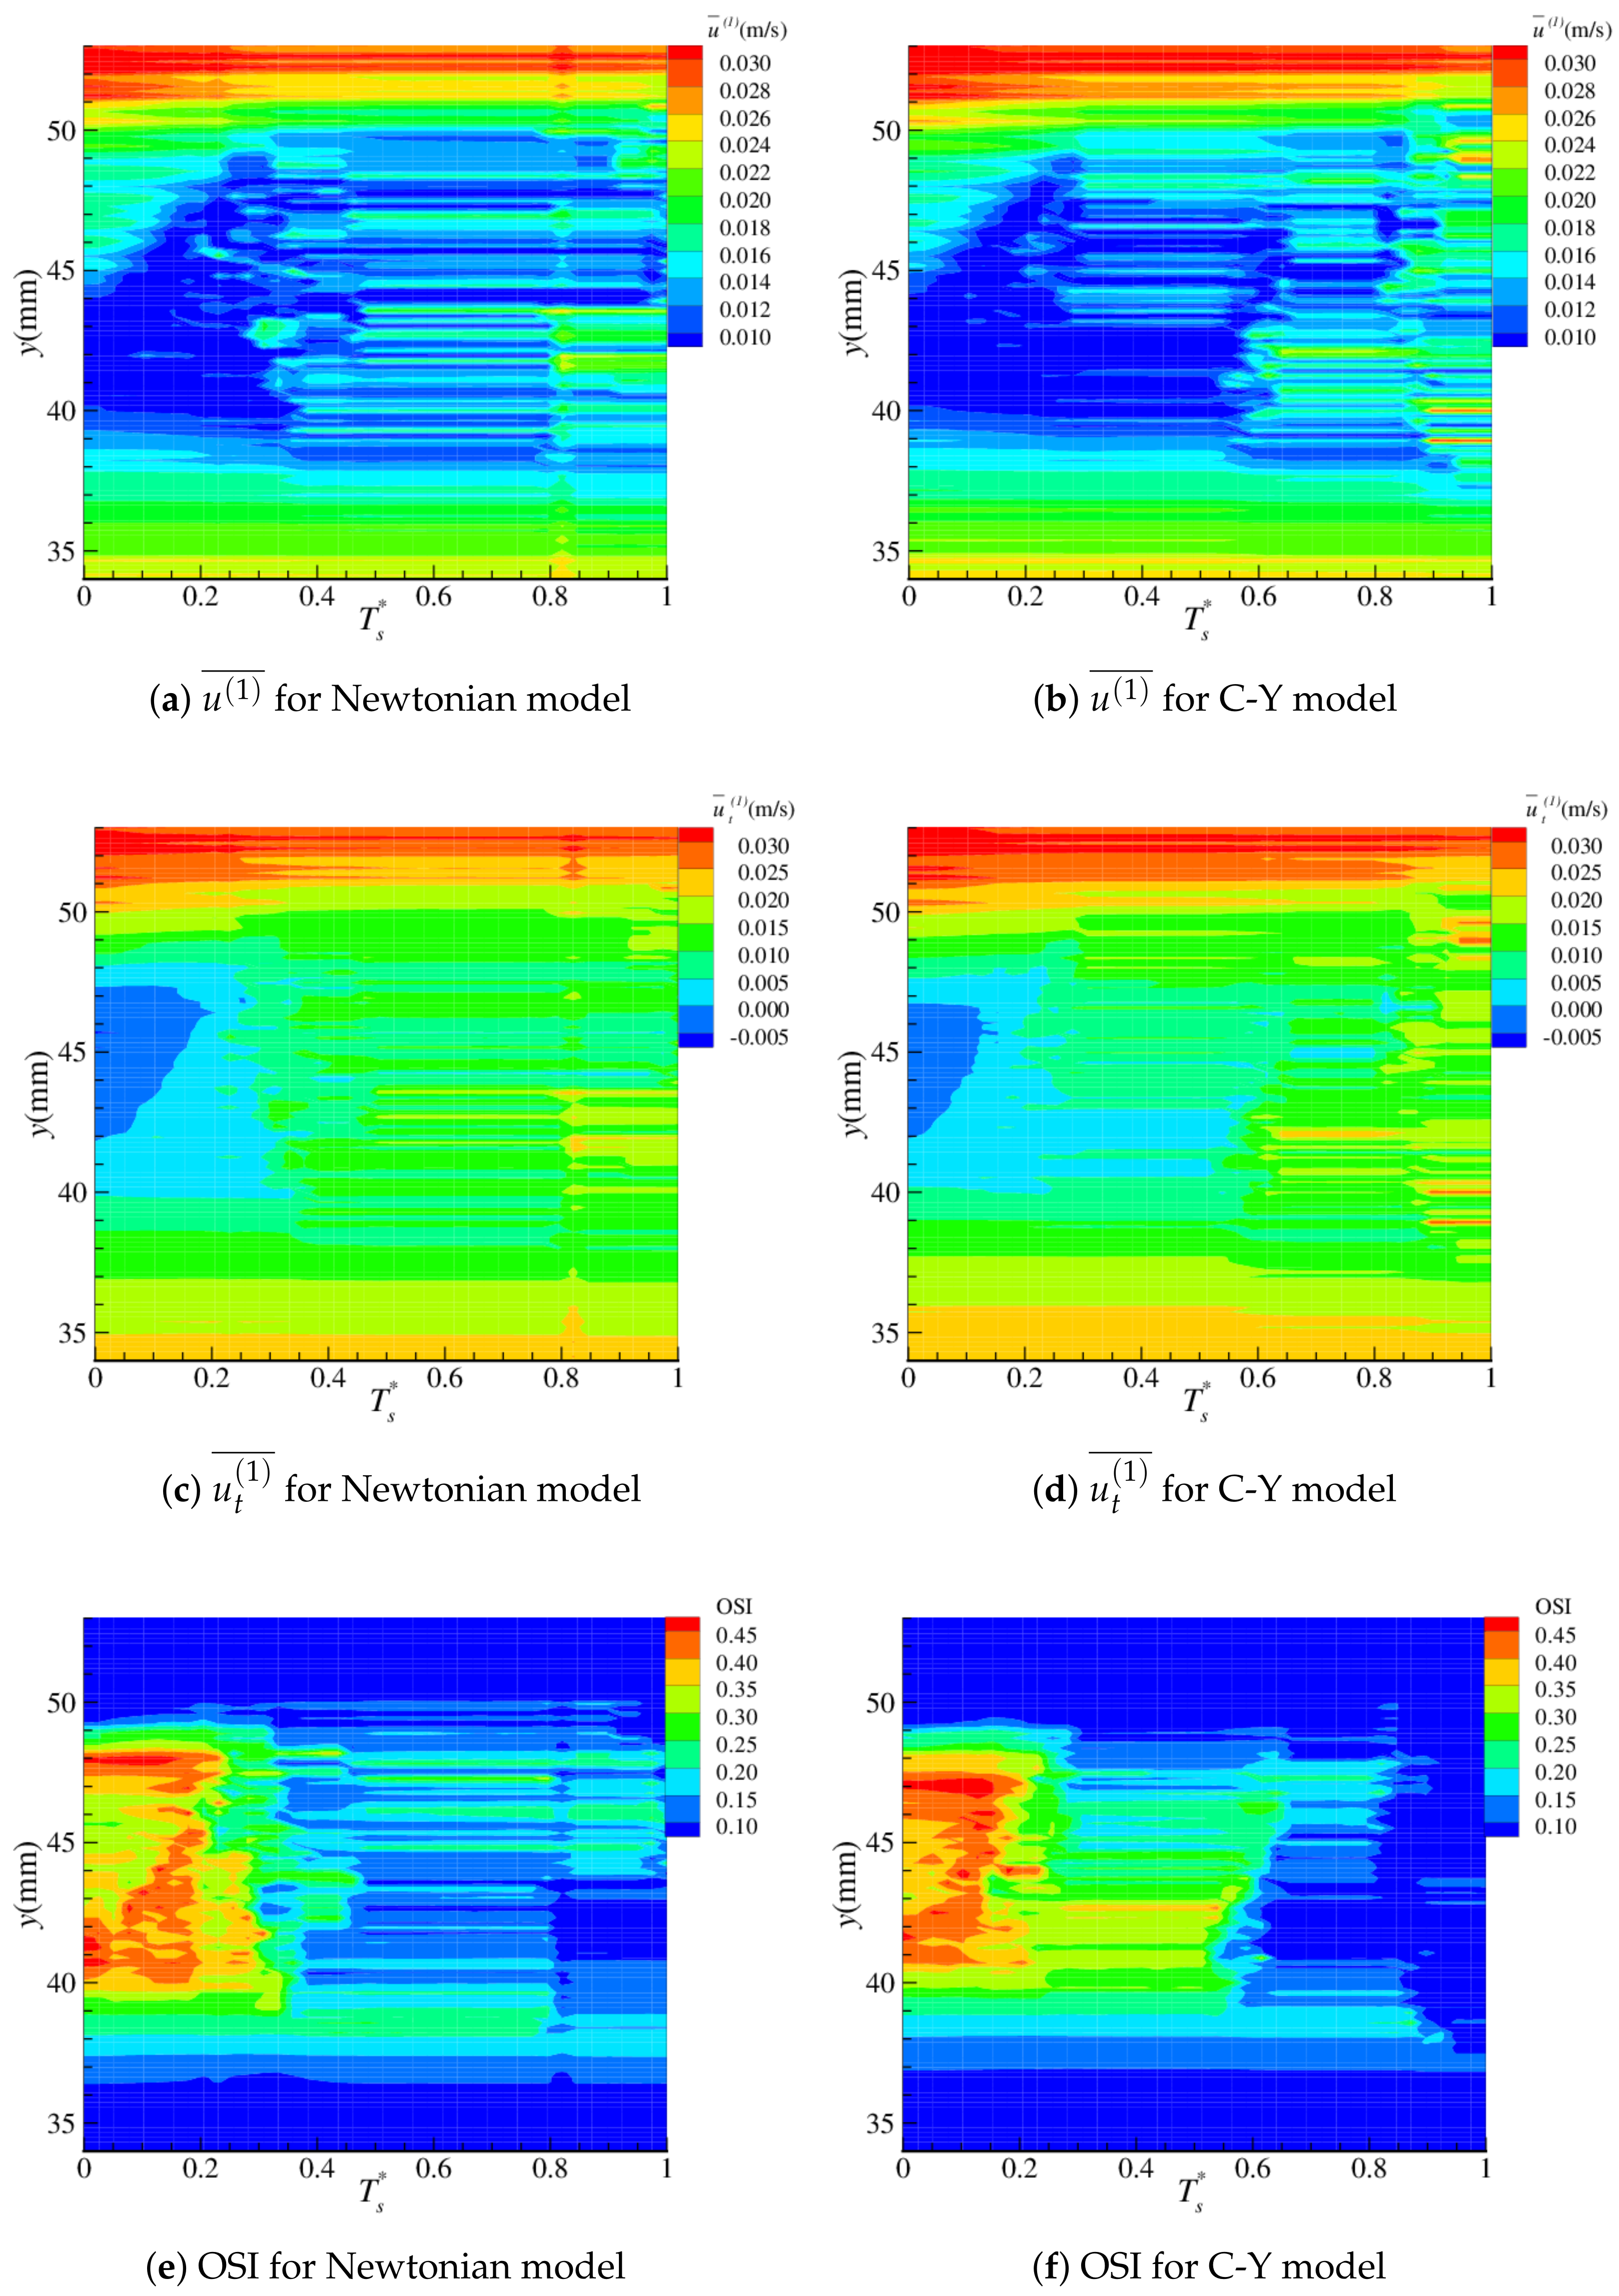
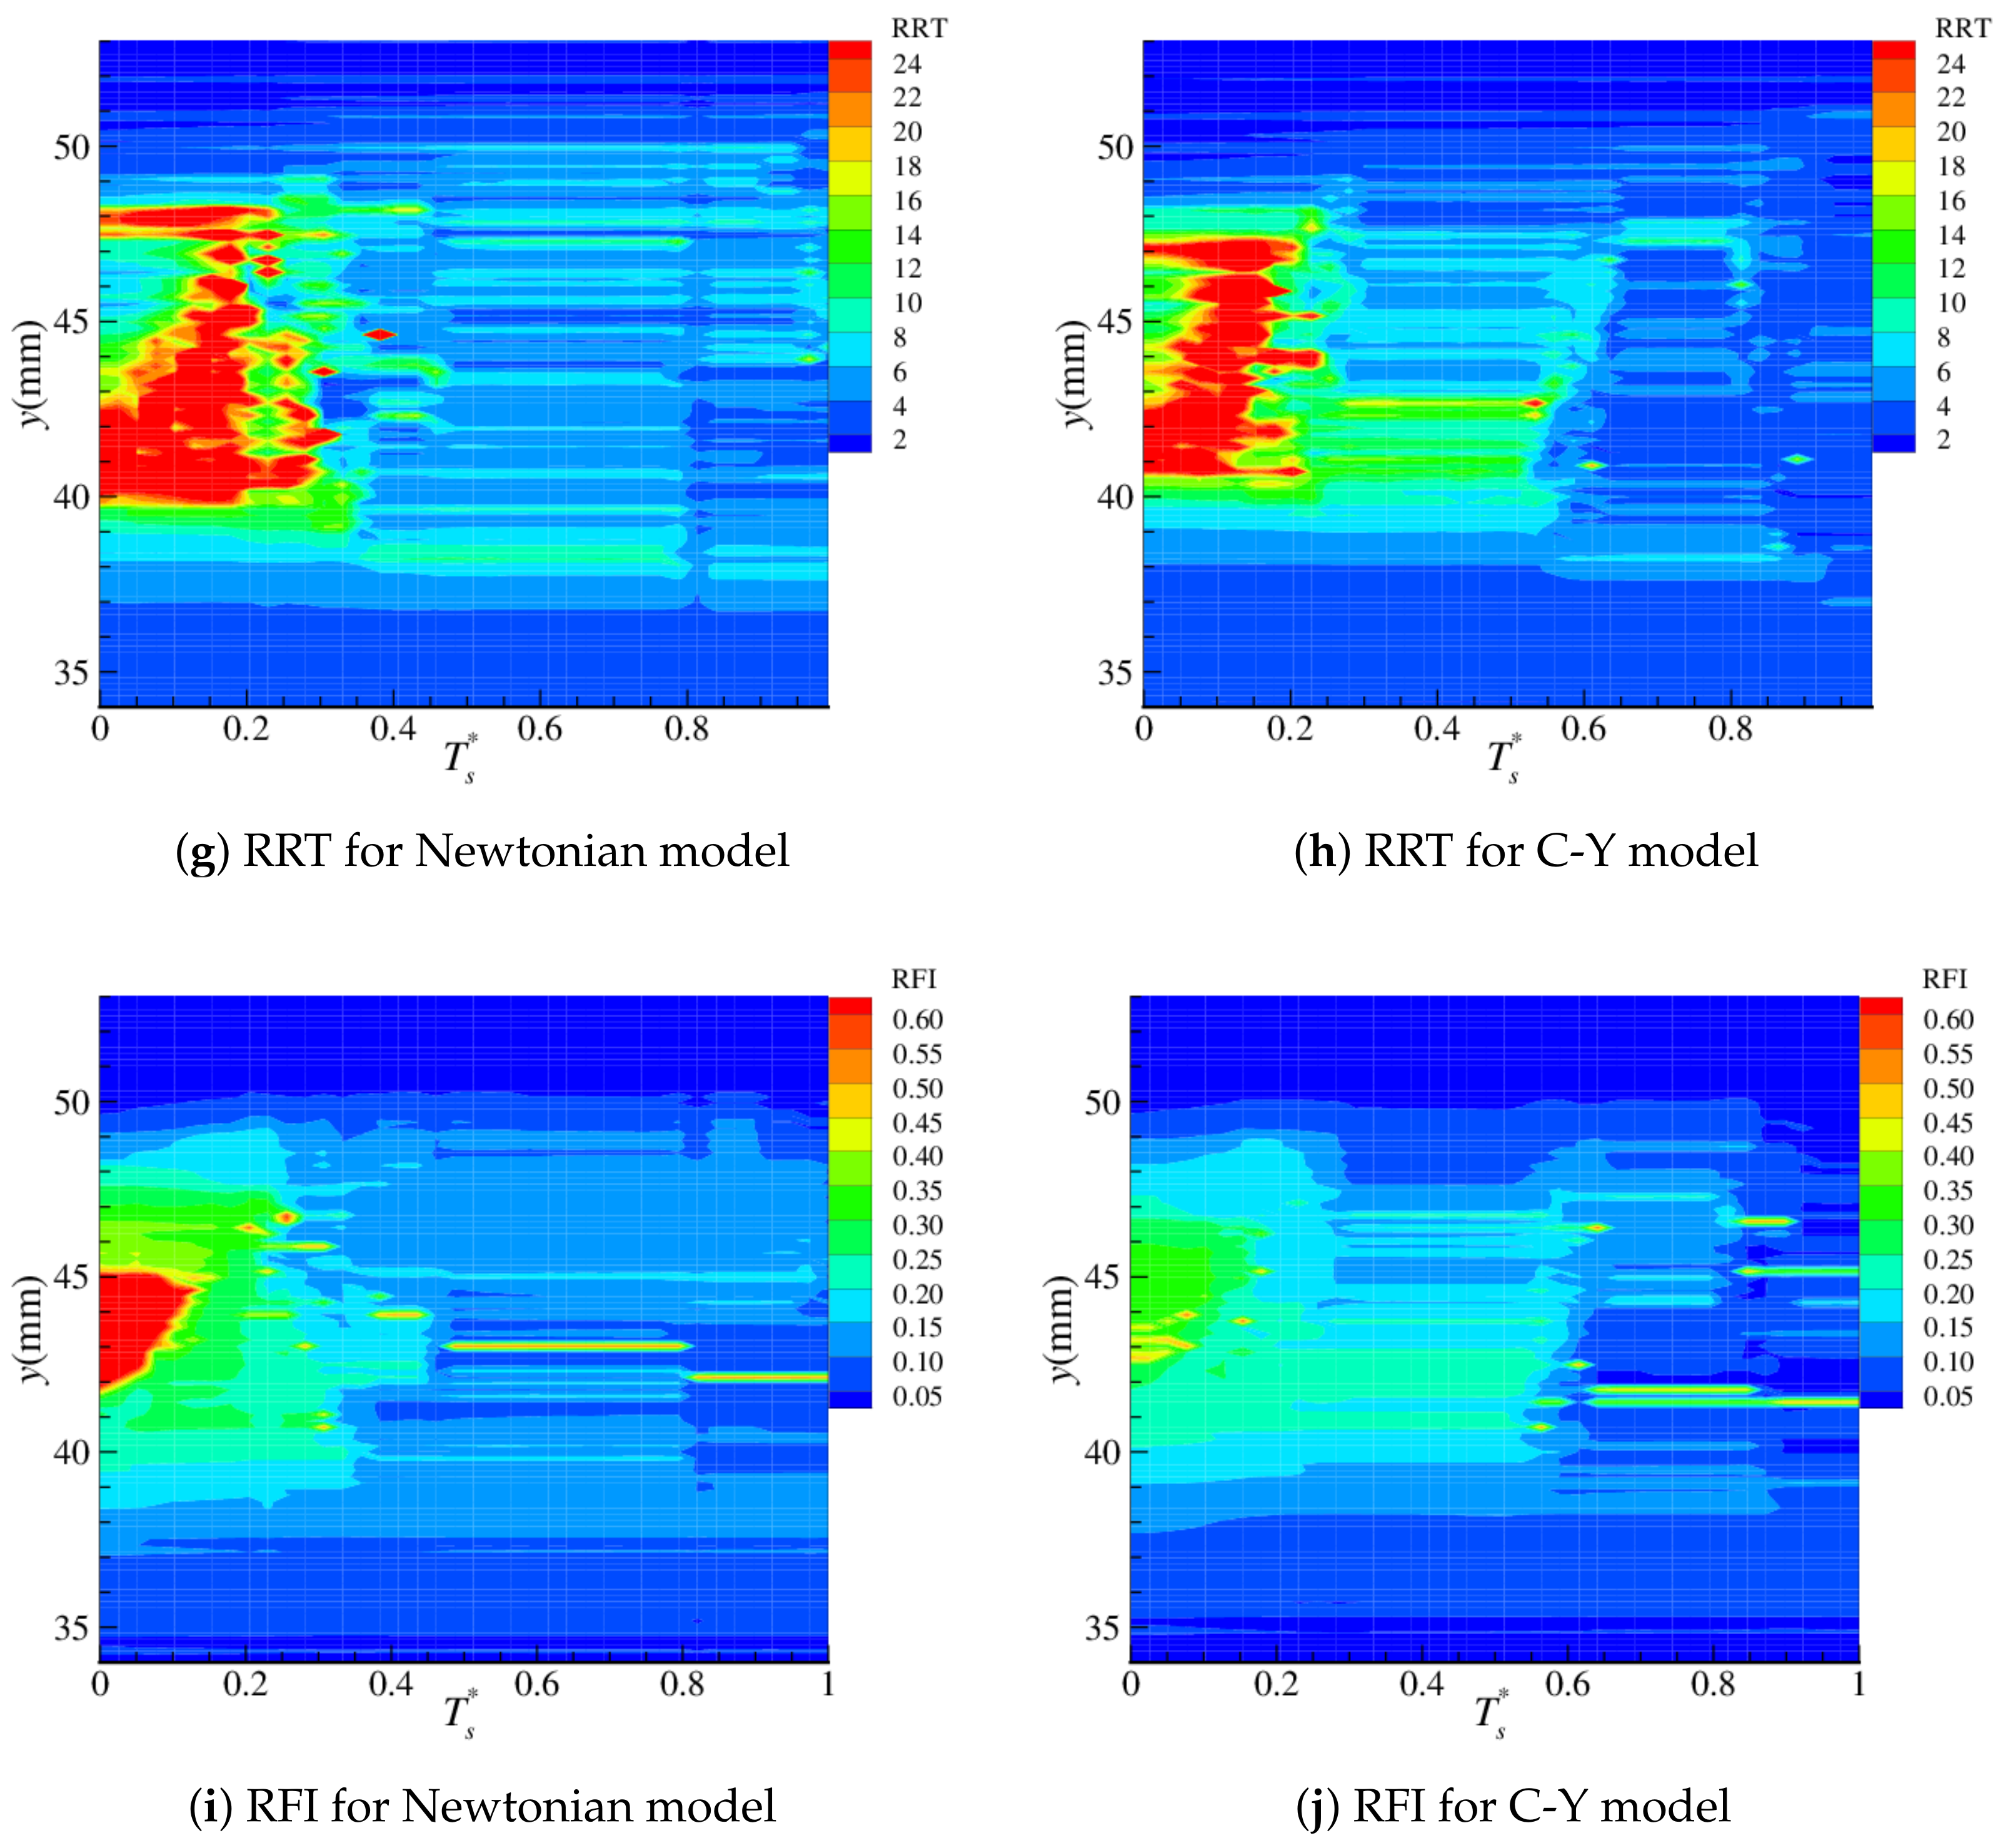
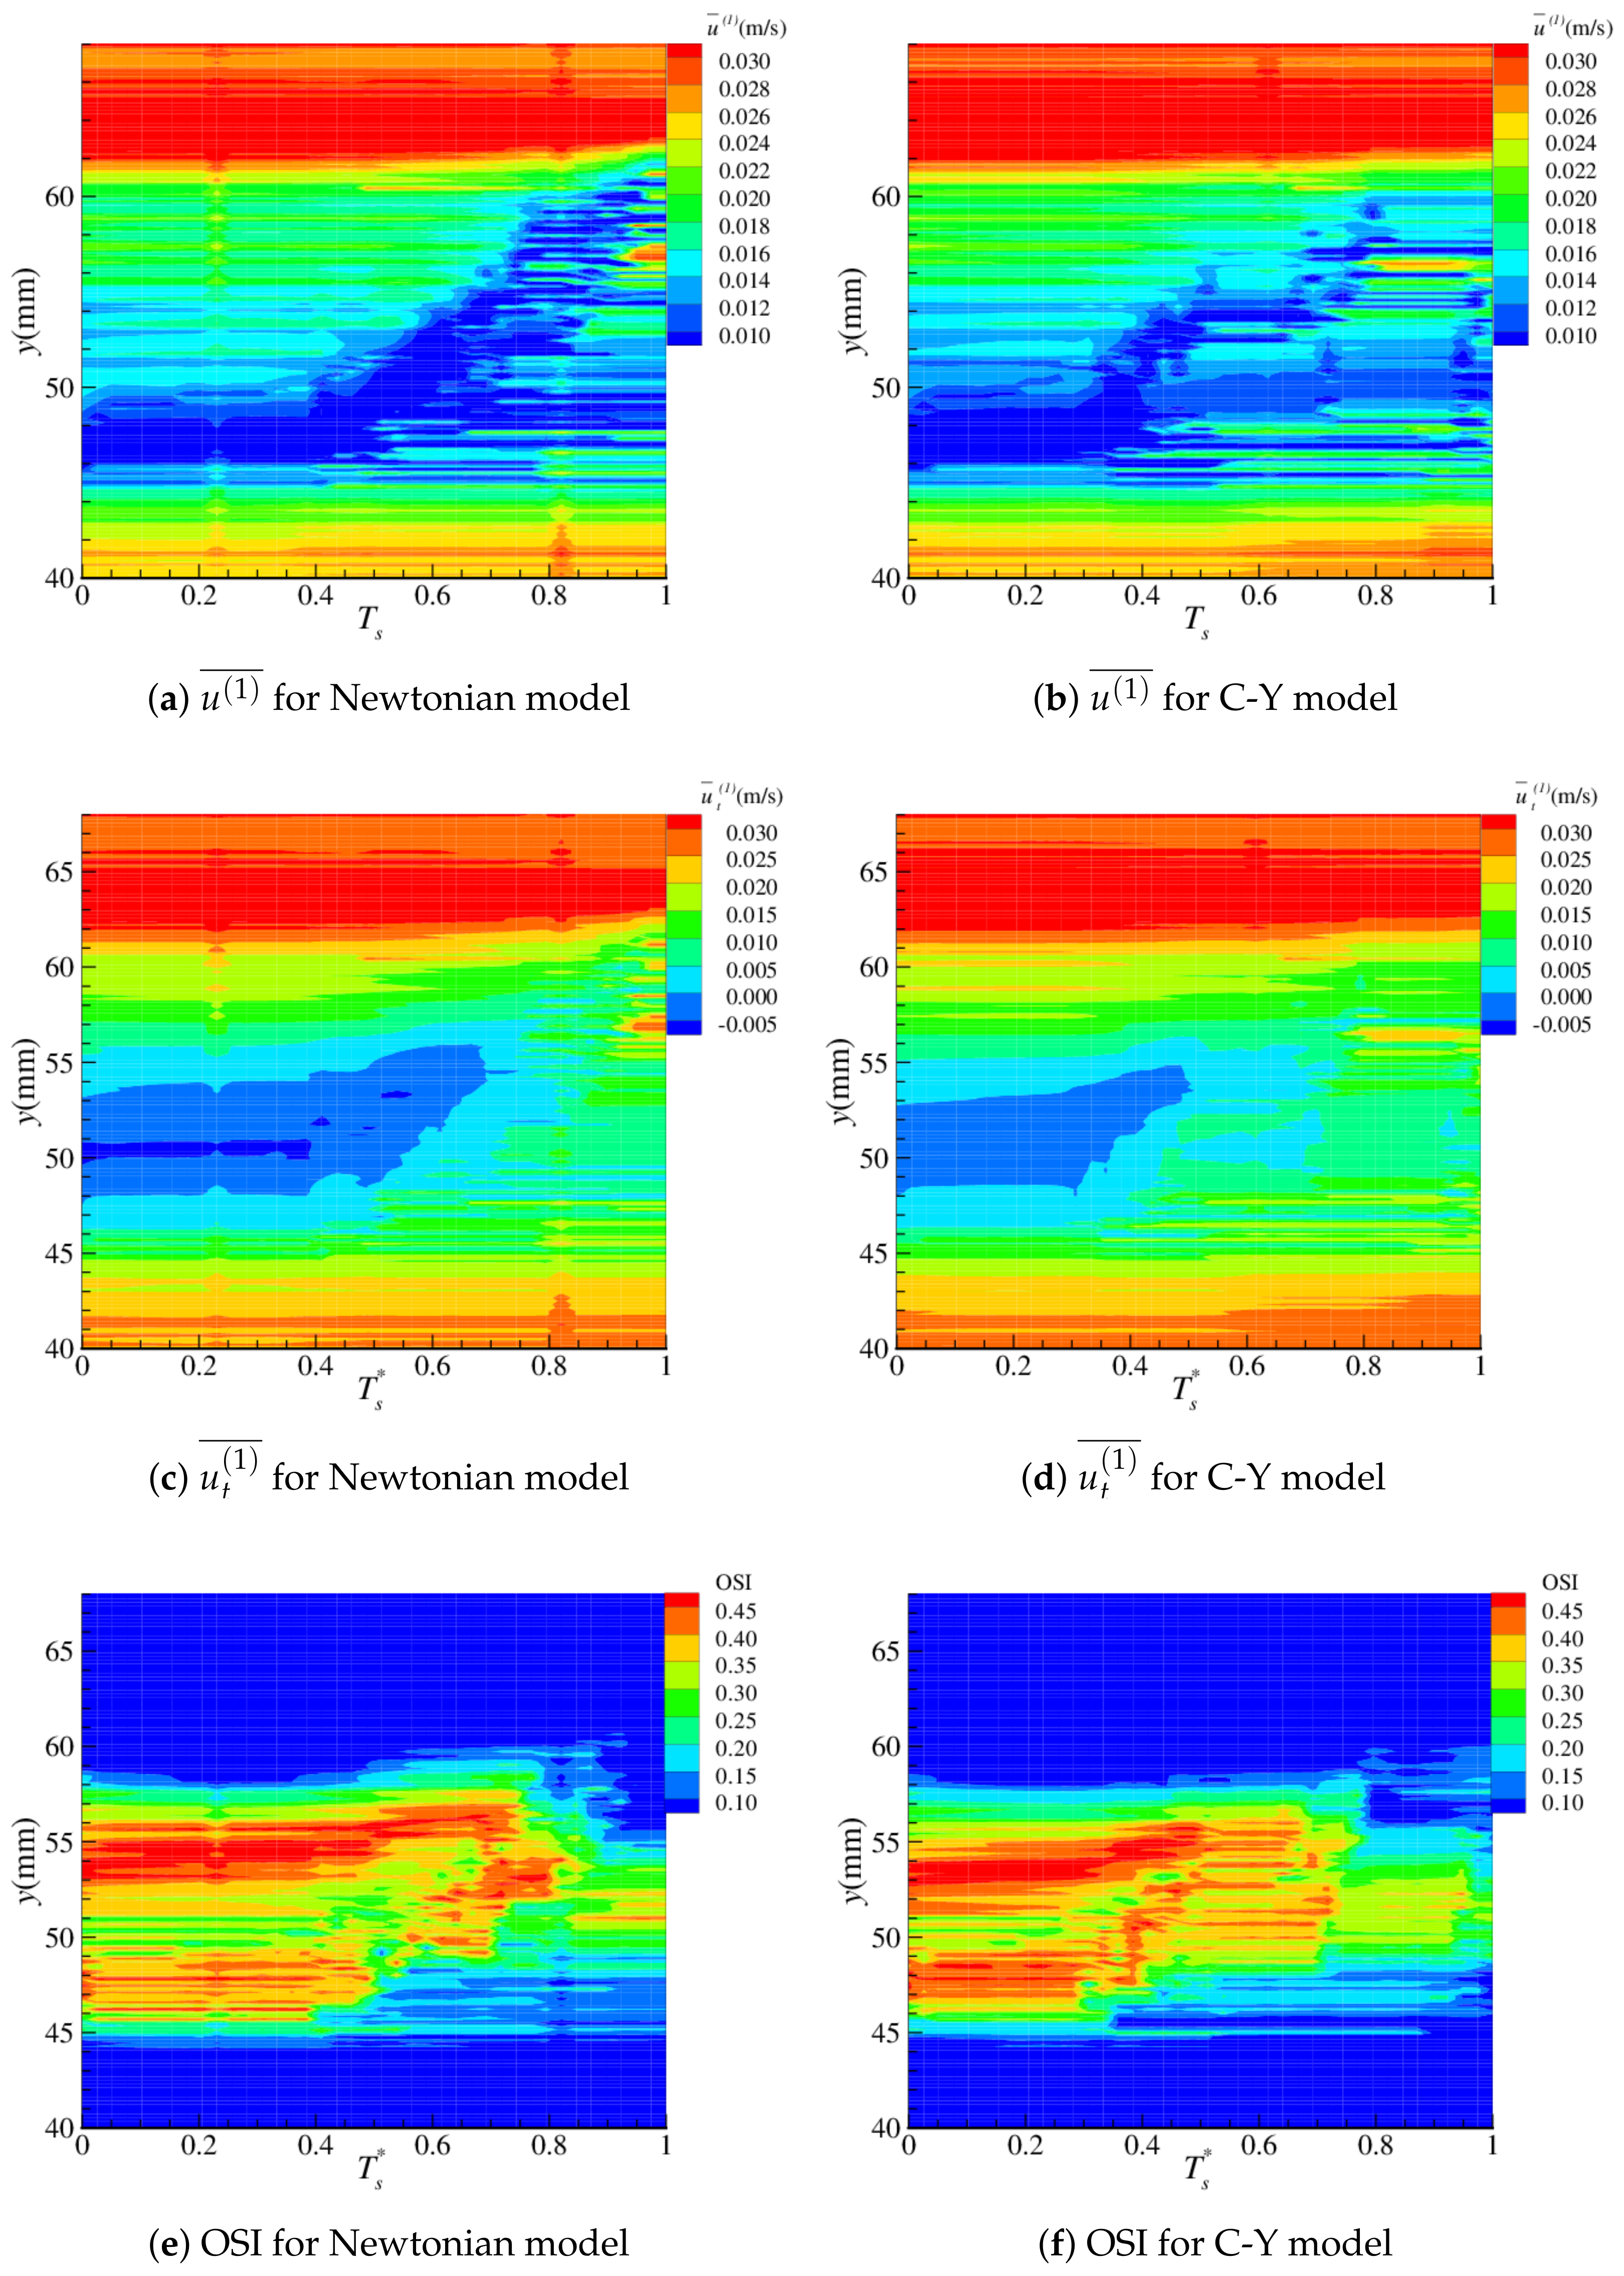
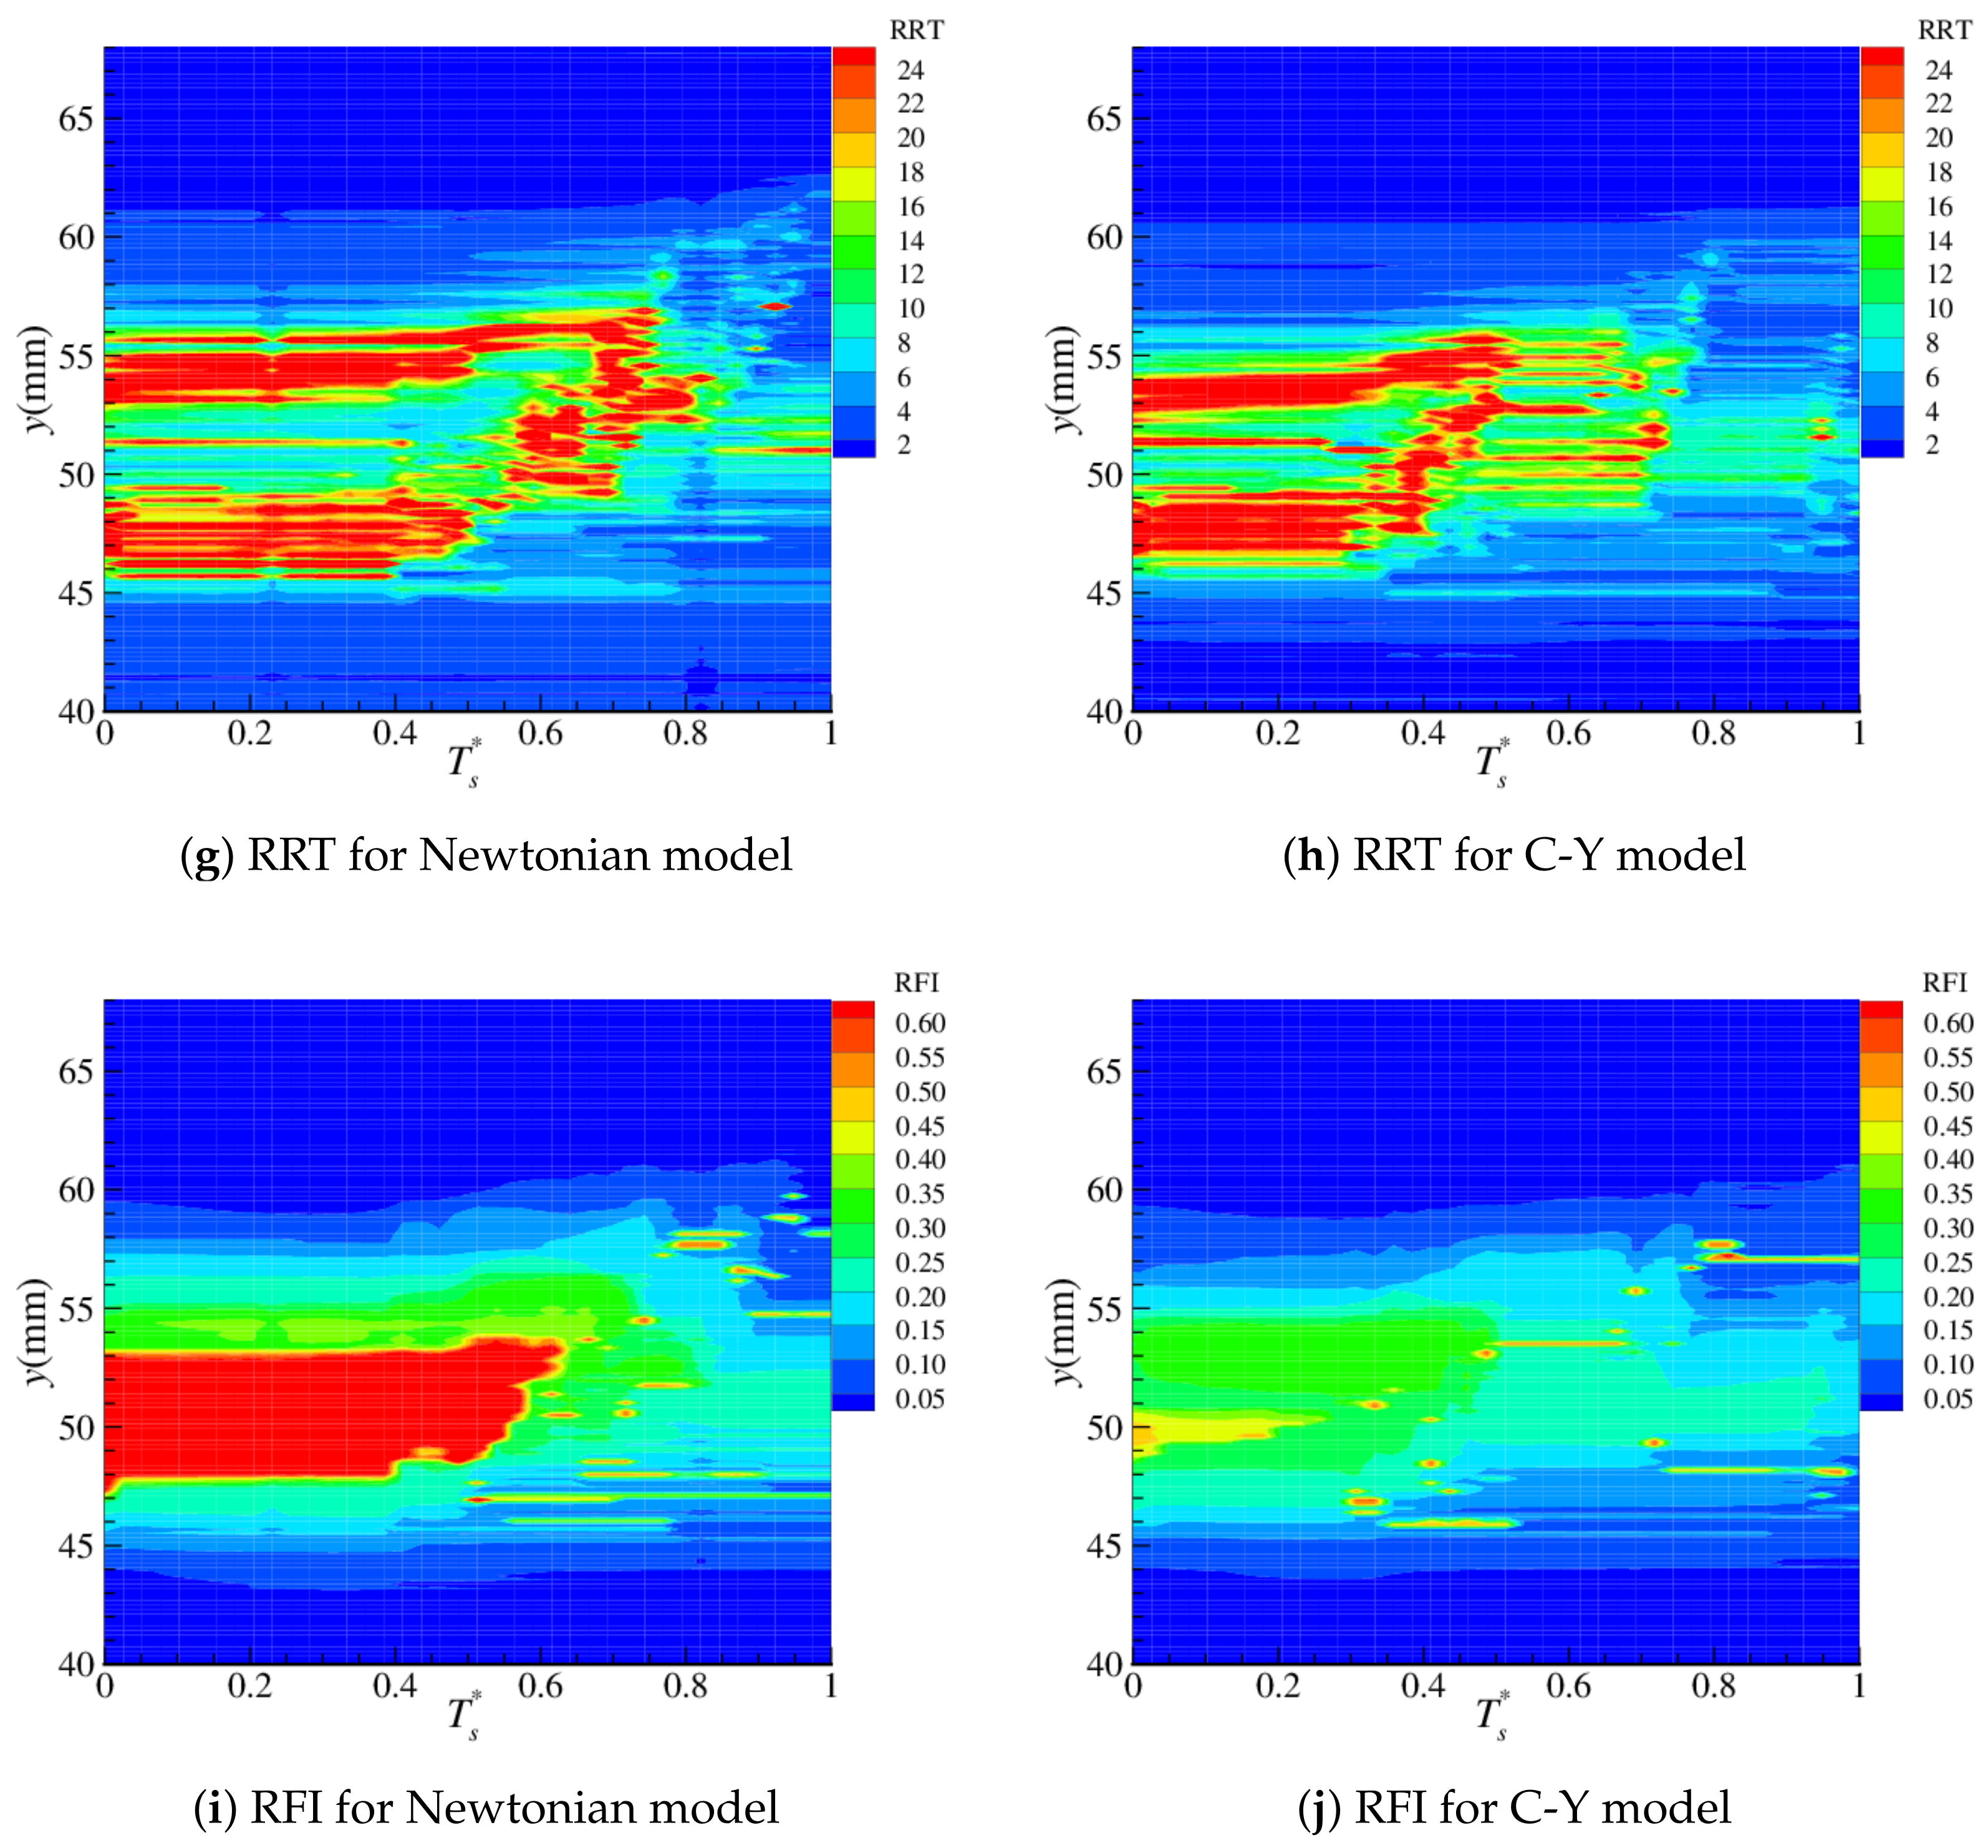
and the reverse flow index (RFI), representing the fraction of the period where u t ( 1 ) is negative, are shown in Figure 10 for the ECA and in Figure 11 for the ICA. For data storage efficiency, the temporal resolution of these figures was downsampled to every 19th T s to give a resolution of 40 points.
In terms of RRT, the constant of proportionality in Equation (33) was found by normalising with respect to the value three diameters upstream of the bifurcation [68,69]. RRT [70,71] is a parameter typically used as a measure of the effect of residency times for elements of the blood in atherosclerotic processes, although it should be noted that it is not derived from tracer measurements but rather indirectly from the WSS and OSI.
Figure 10a,b for the ECA show initial changes in the near-wall velocity, with the low-velocity region expanding in the downstream direction. Differences are observed for T s * > 0.3 , where the non-Newtonian shows a region of lower velocity, particularly in range A: 39 mm < y < 45 mm . This region is also evident in Figure 10c,d, where an additional difference is also observed in that the initial region where u t ( 1 ) ¯ is negative—representing significant reversed flow during the period—which is initially present in range B 42 mm < y < 47 mm , is maintained for a shorter time in the non-Newtonian case. The OSI and RRT are presented in Figure 10e–h. A comparison of both shows anincreased value of both in range A for 0.25 < T s * < 0.5 in the case of the non-Newtonian simulations. In range B, the values of OSI and RRT are initially higher for the non-Newtonian simulations, but they reduce slightly earlier and less sharply at T s * 0.2 . The RFI, shown in Figure 10i,j, displays the most significant differences between the Newtonian and non-Newtonian simulations in region B. For T s * < 0.2 , RFI is significantly lower for the non-Newtonian case. In region A, the RFI is maintained at a slightly higher value in the non-Newtonian simulations for 0.43 < T s * < 0.6 .
The reduced RFI for the non-Newtonian case can be understood in terms of both the nature of the non-Newtonian fluid and the geometry formed by the stenosis. The non-Newtonian fluid has more resistance to flow change, compared to the Newtonian fluid, due to it having a higher effective viscosity. This is largest in regions with a low near-wall velocity (as is observed in the region of high RFI in Figure 10a,b) and consequently a low shear rate. Since the limiting viscosity is used to calculate the Womersley number, this results in a lower effective Womersley number for the non-Newtonian fluid, a higher viscous resistance and a reduced phase difference between the boundary layer flow and the central flow. Thus, in Region B, when the near-wall velocity decreases and the observed reverse flow is formed, the effective Womersley number decreases in the non-Newtonian fluid as the local shear rate decreases. The corresponding reduction in phase difference reduces the time-span of the reverse flow, while the higher viscous resistance dampen the reverse flow, both relative to a Newtonian fluid. Similar effects have been observed by Zheng and Wen-Jei [72], who observed a resistance to flow change from forward to backward for a non-Newtonian fluid at the aorta bifurcation, and by Nakamura and Sawada [73], who found that the non-Newtonian nature of blood tends to restrain the occurrence of flow separation in an accelerating flow and promotes the disappearance of flow separation in decelerating flow. The small differences in the stenosis geometry observed in the ECA in Figure 5 also affect the RFI. Here, for example considering the red contour ( T s = 68 and 105 for the Newtonian and non-Newtonian, respectively), the non-Newtonian geometry levels out the artery wall and cuts out the “dead" region where reverse flow is generated. This is less evident in the Newtonian case, where an, albeit smaller than the unstenosed case, “dead” zone is present at the upstream end of the stenosis. This is expanded by the tendency of the plaque layer to be laid from the bottom to the top [26], extending the “dead” zone. This gives an effect of using a non-Newtonian model, where the reverse flow in the region downstream of the plaque growth is significantly reduced in terms of the time-averaged near-wall tangential velocity, u t ( 1 ) ¯ , in Figure 10d; the percentage of the period where the flow is reversed, RFI in Figure 10i; as well as a small reduction in the time during which high values of OSI, Figure 10f, and RRT, Figure 10h are maintained. Despite this picture of the overall reduction in reversal/oscillatory flow, Figure 10f,h also show a slight increase in the magnitude of OSI and RRT in region A. Additionally, around the upstream development of the stenosis, there is a difference in the near-wall velocity relative to the Newtonian case. Figure 11 shows the same haemodynamic properties in the ICA. Again, there is considerable similarity in the results from the Newtonian and non-Newtonian simulations. There are also a number of differences comparing Figure 11a,b; the time-averaged near-wall velocity is somewhat lower for the non-Newtonian simulation, particularly for T s * < 0.5 . In the same region in Figure 11c,d, both the magnitude and the extent of negative tangential near-wall flow are reduced for the non-Newtonian model. The magnitude of the OSI in Figure 11e,f are similar between the Newtonian and non-Newtonian simulations; however, the OSI reduces earlier for the non-Newtonian case, suggesting that the oscillatory nature of the flow reduces more rapidly. This is mirrored in Figure 11g,h, where the magnitudes are similar, but the RRT reduces earlier for the non-Newtonian case. Figure 11i,j show the most striking differences: they both show a similar region where reversible flow occurs; however, there is a marked difference in the percentage of the period where reversible flow occurs. In the Newtonian case, there is a region 48 mm < y < 53 mm , where the flow is reversed for over 60 % of the period, which is maintained until T s * 0.6 . In the non-Newtonian case, reversible flow typically occurs for no more than 45 % of the period and is typically around 30 % of the period, for 48 mm < y < 53 mm and T s * < 0.6 . This is similar to the phenomenon observed on the ECA in Figure 10i,j.
Carotid arteries are three-dimensional structures, and the flow within them also exhibits three-dimensional features such as secondary flows and helical motion [57,74,75]. Since the results presented here are two-dimensional, these 3D features are not simulated, and their effect on the haemodynamic parameters, such as the TAWSS and O:WS is missing. Despite this, 2D modelling does allow the main haemodynamic features to be captured and tracked at the different levels of stenosis development considered here. Three-dimensional features will have some effect on the haemodynamic markers presented and are also used to guide the plaque deposition model. However, these differences will also exist in terms of specific differences in the details of artery geometry and pressure pulse between different individuals. The aim of this work is to consider general features, and, in cases where a detailed patient-specific model is required, a 3D approach [29,76] will provide additional detail. The 2D approach taken here is appropriate for obtaining details of the more general changes which occur during plaque deposition and stenosis development.
We also note that this study has focused solely on haemodynamic factors; however, atherosclerosis involves multiple pathological mechanisms and different molecular, genetic, environmental, and cellular factors, which are not accounted for in a computational fluid dynamics model such as the one considered here. An overview of these factors is provided by Björkegren and Lusis [77] and Kowara and Cudnoch-Jedrzejewska [78].

5. Conclusions

The stenoses formed using both the Newtonian and non-Newtonian models were fairly similar in terms of the final shape of the geometry; however, small differences were observed in both in final geometry and the formation. Differences were also observed in the near-wall haemodynamics between the two models. In both the ECA and the ICA, the non-Newtonian model reduces the reversible flow in terms of both the spatial region where it occurs and its magnitude. There is also a small reduction in the near-wall TA velocity and the oscillatory nature of the flow measured through the OSI. Overall, some differences were noticed in the near-wall flow characteristics, particularly in the reverse flow in the region of plaque deposition, indicating that the use of a non-Newtonian model is required to capture these features. Despite this, in the simulations presented here, the development of stenosis, which is determined by these wall haemodynamics, was not significantly sensitive to the non-Newtonian nature of the fluid, with any differences being small and not significant relative to the differences between the different markers considered. This suggests that differences in the near-wall velocity, TAWSS and OSI, which were used to determine the position of the plaque deposition, were in terms of the magnitude and not the distribution along the artery wall. It is worth noting that this study did not consider severely stenosed arteries, where non-Newtonian affects will be more significant.

Author Contributions

Conceptualization, J.M.B.; methodology, A.C.S. and J.M.B.; software, A.C.S. and J.M.B.; validation, A.C.S. and J.M.B.; formal analysis, A.C.S. and J.R. and J.M.B.; investigation, A.C.S. and J.M.B.; resources, J.R. and J.M.B.; data curation, A.C.S.; writing—original draft preparation, A.C.S.; writing—review and editing, A.C.S., J.R. and J.M.B.; visualization, A.C.S.; supervision, J.R. and J.M.B.; project administration, J.R. and J.M.B.; funding acquisition, J.M.B. All authors have read and agreed to the published version of the manuscript.

Funding

This research received no external funding.

Data Availability Statement

The data presented in this study are available on request from the corresponding author.

Conflicts of Interest

The authors declare no conflict of interest.

Abbreviations

The following abbreviations are used in this manuscript:
BGKBhatnagar–Gross–Krook
CCACommon Carotid Artery
C-YCarreau–Yasuda
ECAExternal Carotid Artery
ICAInternal Carotid Artery
LBMLattice Boltzmann Method
OSIOscillatory Shear Index
O:WSOSI/TAWSS
RFIReverse Flow Index
RRTRelative Residency Time
TATime-Averaged
TAWSSTime-Averaged Wall Shear Stress
WSSWall Shear Stress

References

  1. Chien, S.; Usami, S.; Dellenback, R.J.; Gregersen, M.I. Shear-dependent deformation of erythrocytes in rheology of human blood. Am. J. Physiol. Leg. Content 1970, 219, 136–142. [Google Scholar] [CrossRef] [PubMed]
  2. Chien, S. Biophysical behavior of red cells in suspensions. Red Blood Cell 1975, 2, 1031–1133. [Google Scholar]
  3. Pries, A.; Secomb, T.W.; Gaehtgens, P. Biophysical aspects of blood flow in the microvasculature. Cardiovasc. Res. 1996, 32, 654–667. [Google Scholar] [CrossRef] [PubMed]
  4. Mejia, J.; Mongrain, R.; Bertrand, O.F. Accurate prediction of wall shear stress in a stented artery: Newtonian versus non-Newtonian models. J. Biomech. Eng. 2011, 133, 074501. [Google Scholar] [CrossRef] [PubMed]
  5. Gijsen, F.; van de Vosse, F.; Janssen, J. The influence of the non-Newtonian properties of blood on the flow in large arteries: Steady flow in a carotid bifurcation model. J. Biomech. 1999, 32, 601–608. [Google Scholar] [CrossRef] [PubMed]
  6. Kumar, N.; Khader, S.M.A.; Pai, R.B.; Kyriacou, P.A. Effect of Newtonian and non-Newtonian flow in subject specific carotid artery. J. Eng. Sci. Technol. 2020, 15, 2764–2780. [Google Scholar]
  7. Weddell, J.C.; Kwack, J.; Imoukhuede, P.I.; Masud, A. Hemodynamic Analysis in an Idealized Artery Tree: Differences in Wall Shear Stress between Newtonian and Non-Newtonian Blood Models. PLoS ONE 2015, 10, e0124575. [Google Scholar] [CrossRef] [PubMed]
  8. Wang, D.; Bernsdorf, J. Lattice Boltzmann simulation of steady non-Newtonian blood flow in a 3D generic stenosis case. Comput. Math. Appl. 2009, 58, 1030–1034. [Google Scholar] [CrossRef]
  9. Rabby, M.G.; Razzak, A.; Molla, M.M. Pulsatile non-Newtonian blood flow through a model of arterial stenosis. Procedia Eng. 2013, 56, 225–231. [Google Scholar] [CrossRef]
  10. Baaijens, J.; Van Steenhoven, A.; Janssen, J. Numerical analysis of steady generalized Newtonian blood flow in a 2D model of the carotid artery bifurcation. Biorheology 1993, 30, 63–74. [Google Scholar]
  11. Boyd, J.; Buick, J.M. Comparison of Newtonian and non-Newtonian flows in a two-dimensional carotid artery model using the Lattice Boltzmann method. Phys. Med. Biol. 2007, 52, 6215–6228. [Google Scholar] [CrossRef] [PubMed]
  12. Morbiducci, U.; Gallo, D.; Massai, D.; Ponzini, R.; Deriu, M.A.; Antiga, L.; Redaelli, A.; Montevecchi, F.M. On the importance of blood rheology for bulk flow in hemodynamic models of the carotid bifurcation. J. Biomech. 2011, 44, 2427–2438. [Google Scholar] [CrossRef] [PubMed]
  13. Perktold, K.; Peter, R.O.; Resch, M.; Langs, G. Pulsatile non-Newtonian blood flow in three-dimensional carotid bifurcation models: A numerical study of flow phenomena under different bifurcation angles. J. Biomed. Eng. 1991, 13, 507–515. [Google Scholar] [CrossRef] [PubMed]
  14. Abugattas, C.; Aguirre, A.; Castillo, E.; Cruchaga, M. Numerical study of bifurcation blood flows using three different non-Newtonian constitutive models. Appl. Math. Model. 2020, 88, 529–549. [Google Scholar] [CrossRef]
  15. Gijsen, F.; Katagiri, Y.; Barlis, P.; Bourantas, C.; Collet, C.; Coskun, U.; Daemen, J.; Dijkstra, J.; Edelman, E.; Evans, P.; et al. Expert recommendations on the assessment of wall shear stress in human coronary arteries: Existing methodologies, technical considerations, and clinical applications. Eur. Heart J. 2019, 40, 3421–3433. [Google Scholar] [CrossRef] [PubMed]
  16. Lee, S.W.; Steinman, D.A. On the relative importance of rheology for image-based CFD models of the carotid bifurcation. J. Biomech. Eng. 2007, 129, 273–278. [Google Scholar] [CrossRef] [PubMed]
  17. Gharahi, H.; Zambrano, B.A.; Zhu, D.C.; DeMarco, J.K.; Baek, S. Computational fluid dynamic simulation of human carotid artery bifurcation based on anatomy and volumetric blood flow rate measured with magnetic resonance imaging. J. Eng. Sci. Technol. 2016, 8, 46–60. [Google Scholar] [CrossRef] [PubMed]
  18. Fatahian, E.; Kordani, N.; Fatahian, H. The Application of Computational Fluid Dynamics CFD Method and Several Rheological Models of Blood Flow: A Review. Gazi Univ. J. Sci. 2018, 31, 1213–1227. [Google Scholar]
  19. Karimi, S.; Dabagh, M.; Vasava, P.; Dadvar, M.; Dabir, B.; Jalali, P. Effect of rheological models on the hemodynamics within human aorta: CFD study on CT image-based geometry. J. Non-Newton. Fluid Mech. 2014, 207, 42–52. [Google Scholar] [CrossRef]
  20. Tamagawa, M.; Matsuo, S. Predictions of thrombus formation using Lattice Boltzmann Method (modeling of adhesion force for particles to wall). JSME Int. J. Ser. C 2004, 47, 1027–1034. [Google Scholar] [CrossRef]
  21. Tamagawa, M.; Kaneda, H.; Hiramoto, M.; Nagahama, S. Simulation of thrombus formation in shear flows using Lattice Boltzmann Method. Artif. Organs 2009, 33, 604–610. [Google Scholar] [CrossRef] [PubMed]
  22. Harrison, S.; Smith, S.; Bernsdorf, J.; Hose, D.; Lawford, P. Application and validation of the Lattice Boltzmann Method for modelling flow-related clotting. J. Biomech. 2007, 40, 3023–3028. [Google Scholar] [CrossRef] [PubMed]
  23. Bernsdorf, J.; Harrison, S.E.; Smith, S.M.; Lawford, P.V.; Hose, D.R. Applying the Lattice Boltzmann technique to biofluids: A novel approach to simulate blood coagulation. Comput. Math. Appl. 2008, 55, 1408–1414. [Google Scholar] [CrossRef]
  24. Moiseyev, G.; Bar-Yoseph, P.Z. No need for particle tracing: From accumulating fluid properties to novel blood coagulation model in the lattice Boltzmann method. J. Biomech. 2010, 43, 864–870. [Google Scholar] [CrossRef] [PubMed]
  25. Karimpour, H.; Javdan, E. Simulation of stenosis growth in the carotid artery by Lattice Boltzmann Method. J. Mech. Med. Biol. 2014, 14, 1450016. [Google Scholar] [CrossRef]
  26. Stamou, A.C.; Buick, J.M. An LBM based model for initial stenosis development in the carotid artery. J. Phys. A Math. Theor. 2016, 49, 195602. [Google Scholar] [CrossRef]
  27. Chen, S.; Doolen, G. Lattice Boltzmann method for fluid flows. Annu. Rev. Fluid. Mech. 1998, 30, 329–364. [Google Scholar] [CrossRef]
  28. Li, H.; Fang, H.; Lin, Z.; Xu, S.; Chen, S. Lattice Boltzmann simulation on particle suspensions in a two-dimensional symmetric stenotic artery. Phys. Rev. E 2004, 69, 031919. [Google Scholar] [CrossRef]
  29. Boyd, J.; Buick, J.M. Three-dimensional modelling of the human carotid artery using the lattice Boltzmann method: I. Model and velocity analysis. Phys. Med. Biol. 2008, 53, 5767–5779. [Google Scholar] [CrossRef]
  30. Zhang, J.; Johnson, P.C.; Popel, A.S. Red blood cell aggregation and dissociation in shear flows simulated by lattice Boltzmann method. J. Biomech. 2008, 41, 47–55. [Google Scholar] [CrossRef]
  31. Dupin, M.; Halliday, I.; Care, C.; Munn, L. Lattice Boltzmann modelling of blood cell dynamics. Int. J. Comput. Fluid Dyn. 2008, 22, 481–492. [Google Scholar] [CrossRef]
  32. Yun, B.M.; Dasi, L.; Aidun, C.; Yoganathan, A. Computational modelling of flow through prosthetic heart valves using the entropic lattice-Boltzmann method. J. Fluid Mech. 2014, 743, 170–201. [Google Scholar] [CrossRef]
  33. Yi, H. Numerical Simulation of Particle Deposition in Arterial Bifurcation via Lattice Boltzmann Method. J. Funct. Spaces 2022, 2022, 3873484. [Google Scholar] [CrossRef]
  34. Wang, L.; Dong, D.; Tian, F.B. Fast prediction of blood flow in stenosed arteries using machine learning and immersed boundary lattice Boltzmann method. Front. Physiol. 2022, 13, 953702. [Google Scholar] [CrossRef] [PubMed]
  35. Lobovský, L.; Bublík, O.; Heidler, V.; Vimmr, J. Numerical and experimental prediction of free surface flow of shear-thinning fluids. Comput. Fluids 2021, 225, 104969. [Google Scholar] [CrossRef]
  36. Xia, Y.; Lin, J.; Ku, X. Flow-induced rotation of circular cylinder in Poiseuille flow of power-law fluids. J. Non-Newton. Fluid Mech. 2018, 260, 120–132. [Google Scholar] [CrossRef]
  37. Ohta, M.; Nakamura, T.; Yoshida, Y.; Matsukuma, Y. Lattice Boltzmann simulations of viscoplastic fluid flows through complex flow channels. J. Non-Newton. Fluid Mech. 2011, 166, 404–412. [Google Scholar] [CrossRef]
  38. Bisht, M.; Patil, D.V. Power-law fluid flow in driven enclosures with undulation using MRT-lattice Boltzmann method. Comput. Math. Appl. 2020, 79, 100–110. [Google Scholar] [CrossRef]
  39. Kefayati, G.; Tang, H.; Chan, A.; Wang, X. A lattice Boltzmann model for thermal non-Newtonian fluid flows throug porous media. Comput. Fluids 2018, 176, 226–244. [Google Scholar] [CrossRef]
  40. Osaki, S.; Hayashi, K.; Kimura, H.; Seta, T.; Kohmura, E.; Tomiyama, A. Numerical simulations of flows in cerebral aneurysms using the lattice Boltzmann method with single- and multiple-relaxation time collision models. Comput. Math. Appl. 2019, 78, 2746–2760. [Google Scholar] [CrossRef]
  41. Ashrafizaadeh, M.; Bakhshaei, H. A comparison of non-Newtonian models for lattice Boltzmann blood flow simulations. Comput. Math. Appl. 2009, 58, 1045–1054. [Google Scholar] [CrossRef]
  42. De Rosis, A. Harmonic oscillations of laminae in non-Newtonian fluids: A lattice Boltzmann-Immersed Boundary approach. Adv. Water Resour. 2014, 73, 97–107. [Google Scholar] [CrossRef]
  43. Zhang, J.; Kwok, D.Y. Lattice Boltzmann Method (LBM). In Encyclopedia of Microfluidics and Nanofluidics; Li, D., Ed.; Springer: Boston, MA, USA, 2008; pp. 981–985. [Google Scholar] [CrossRef]
  44. Yu, D.; Mei, R.; Luo, L.S.; Shyy, W. Viscous flow computations with the method of lattice Boltzmann equation. Prog. Aerosp. Sci. 2003, 39, 329–367. [Google Scholar] [CrossRef]
  45. Qian, Y.H.; d’Humières, D.; Lallemand, P. Lattice BGK models for Navier-Stokes equation. Europhys. Lett. 1992, 17, 479–484. [Google Scholar] [CrossRef]
  46. Bhatnagar, P.L.; Gross, E.P.; Krook, M. A model for collision processes in gases. I: Small amplitude processes in charged and neutral one-component system. Phys. Rev. 1954, 94, 511–525. [Google Scholar] [CrossRef]
  47. Boyd, J.; Buick, J.; Green, S. A second order accurate lattice Boltzmann non-Newtonian flow model. J. Phys. A Math. Gen. 2006, 39, 14241–14247. [Google Scholar] [CrossRef]
  48. Frisch, U.; d’ Humières, D.; Hasslacher, B.; Lallemand, P.; Pomeau, Y.; Rivet, J.P. Lattice Gas Hydrodynamics in Two and Three Dimensions. Complex Syst. 1987, 1, 649–707. [Google Scholar]
  49. Artoli, A. Mesoscopic Computational Haemodynamics; Technical Report; University of Amsterdam: Amsterdam, The Netherlands, 2003. [Google Scholar]
  50. Wang, C.H.; Ho, J.R. A lattice Boltzmann approach for the non-Newtonian effect in the blood flow. Comput. Math. Appl. 2011, 62, 75–86. [Google Scholar] [CrossRef]
  51. Aharonov, E.; Rothman, D. Non-Newtonian flow (through porous media): A lattice-Boltzmann method. Geophys. Res. Lett. 1993, 20, 679–682. [Google Scholar] [CrossRef]
  52. Cross, M.M. Rheology of non-Newtonian fluids: A new flow equation for pseudoplastic systems. J. Colloid Sci. 1965, 20, 417–437. [Google Scholar] [CrossRef]
  53. Carreau, P.J. Rheological equations from molecular network theories. Trans. Soc. Rheol. 1972, 16, 99–127. [Google Scholar] [CrossRef]
  54. Yasuda, K.; Armstrong, R.; Cohen, R. Shear flow properties of concentrated solutions of linear and star branched polystyrenes. Rheol. Acta 1981, 20, 163–178. [Google Scholar] [CrossRef]
  55. Yasuda, K. A multi-mode viscosity model and its applicability to non-Newtonian fluids. J. Text. Eng. 2006, 52, 171–173. [Google Scholar] [CrossRef]
  56. Holdsworth, D.; Norley, C.; Frayne, R.; Steinman, D.; Rutt, B. Characterisation of common carotid artery blood-flow waveforms in normal human subjects. J. Physiol. Meas. 1999, 20, 219–240. [Google Scholar] [CrossRef] [PubMed]
  57. Schirmer, C.M.; Malek, A.M. Computational fluid dynamic characterization of carotid bifurcation stenosis in patient-based geometries. Brain Behav. 2012, 2, 42–52. [Google Scholar] [CrossRef] [PubMed]
  58. Wild, N.C.; Bulusu, K.V.; Plesniak, M.W. Vortical Structures Promote Atheroprotective Wall Shear Stress Distributions in a Carotid Artery Bifurcation Model. Bioengineering 2023, 10, 1036. [Google Scholar] [CrossRef] [PubMed]
  59. Zalud, N.C.; Bulusu, K.V.; Plesniak, M.W. Shear stress metrics associated with pro-atherogenic high-risk anatomical features in a carotid artery bifurcation model. Clin. Biomech. 2023, 105, 105956. [Google Scholar] [CrossRef]
  60. Cox, C.; Plesniak, M.W. The effect of entrance flow development on vortex formation and wall shear stress in a curved artery model. Phys. Fluids 2021, 33, 101908. [Google Scholar] [CrossRef]
  61. Lee, U.Y.; Kim, C.I.; Chung, G.H.; Jung, J.; Kwak, H.S. Hemodynamic Changes in the Carotid Artery after Infusion of Normal Saline Using Computational Fluid Dynamics. Diagnostics 2020, 10, 473. [Google Scholar] [CrossRef]
  62. Neal, M. A Study of the Brass Instrument Lip Reed Mechanism using Artificial Lips and Lattice Boltzmann Flow Simulations. Ph.D. Thesis, University of Edinburgh, Edinburgh, UK, 2002. [Google Scholar]
  63. Guo, Z.; Zheng, C.; Shi, B. An extrapolation method for boundary conditions in lattice Boltzmann method. Phys. Fluids 2002, 14, 2007–2010. [Google Scholar] [CrossRef]
  64. Stamou, A.; Radulovic, J.; Buick, J. Effect of stenosis growth on blood flow at the bifurcation of the carotid artery. J. Comput. Sci. 2021, 54, 101435. [Google Scholar] [CrossRef]
  65. Stamou, A.C.; Radulovic, J.; Buick, J.M. Investigation of hemodynamic markers for stenosis development. Eng. Rep. 2021, 3, e12389. [Google Scholar] [CrossRef]
  66. Boyd, J.; Buick, J.; Cosgrove, J.; Stansell, P. Application of the lattice Boltzmann method to arterial flow simulation: Investigation of boundary conditions for complex arterial geometries. Australas. Phys. Eng. Sci. Med. 2004, 27, 147–152. [Google Scholar] [CrossRef] [PubMed]
  67. Abraham, F.; Behr, M.; Heinkenschloss, M. Shape Optimisation in Steady Blood Flow: A Numerical Study of Non–Newtonian Effects. Comput. Methods Biomech. Biomed. Eng. 2005, 8, 127–137. [Google Scholar] [CrossRef] [PubMed]
  68. Lee, S.W.; Antiga, L.; Steinman, D.A. Correlations Among Indicators of Disturbed Flow at the Normal Carotid Bifurcation. J. Biomech. Eng. 2009, 131, 061013. [Google Scholar] [CrossRef] [PubMed]
  69. Lee, S.W.; Antiga, L.; Spence, J.D.; Steinman, D.A. Geometry of the Carotid Bifurcation Predicts Its Exposure to Disturbed Flow. Stroke 2008, 39, 2341–2347. [Google Scholar] [CrossRef] [PubMed]
  70. Hashemi, J.; Rai, S.; Ghafghazi, S.; Berson, R.E. Blood residence time to assess significance of coronary artery stenosis. Sci. Rep. 2020, 10, 11658. [Google Scholar] [CrossRef] [PubMed]
  71. Himburg, H.A.; Grzybowski, D.M.; Hazel, A.L.; LaMack, J.A.; Li, X.M.; Friedman, M.H. Spatial comparison between wall shear stress measures and porcine arterial endothelial permeability. Am. J. Physiol. Heart Circ. Physiol. 2004, 286, H1916–H1922. [Google Scholar] [CrossRef]
  72. Lou, Z.; Yang, W.J. A computer simulation of the non-Newtonian blood flow at the aortic bifurcation. J. Biomech. 1993, 26, 37–49. [Google Scholar] [CrossRef]
  73. Nakamura, M.; Sawada, T. Numerical Study on the Unsteady Flow of Non–Newtonian Fluid. J. Biomech. Eng. 1990, 112, 100–103. [Google Scholar] [CrossRef]
  74. Gallo, D.; Steinman, D.A.; Bijari, P.B.; Morbiducci, U. Helical flow in carotid bifurcation as surrogate marker of exposure to disturbed shear. J. Biomech. 2012, 45, 2398–2404. [Google Scholar] [CrossRef]
  75. Harloff, A.; Albrecht, F.; Spreer, J.; Stalder, A.; Bock, J.; Frydrychowicz, A.; Schöllhorn, J.; Hetzel, A.; Schumacher, M.; Hennig, J.; et al. 3D blood flow characteristics in the carotid artery bifurcation assessed by flow-sensitive 4D MRI at 3T. Magn. Reson. Med. 2009, 61, 65–74. [Google Scholar] [CrossRef]
  76. Boyd, J.; Buick, J.M. Three-dimensional modelling of the human carotid artery using the lattice Boltzmann method: II. Shear analysis. Phys. Med. Biol. 2008, 53, 5781–5795. [Google Scholar] [CrossRef]
  77. Björkegren, J.L.; Lusis, A.J. Atherosclerosis: Recent developments. Cell 2022, 185, 1630–1645. [Google Scholar] [CrossRef]
  78. Michal, K.; Cudnoch-Jedrzejewska, A. Pathophysiology of Atherosclerotic Plaque Development-Contemporary Experience and New Directions in Research. Int. J. Mol. Sci. 2021, 22, 3513. [Google Scholar]
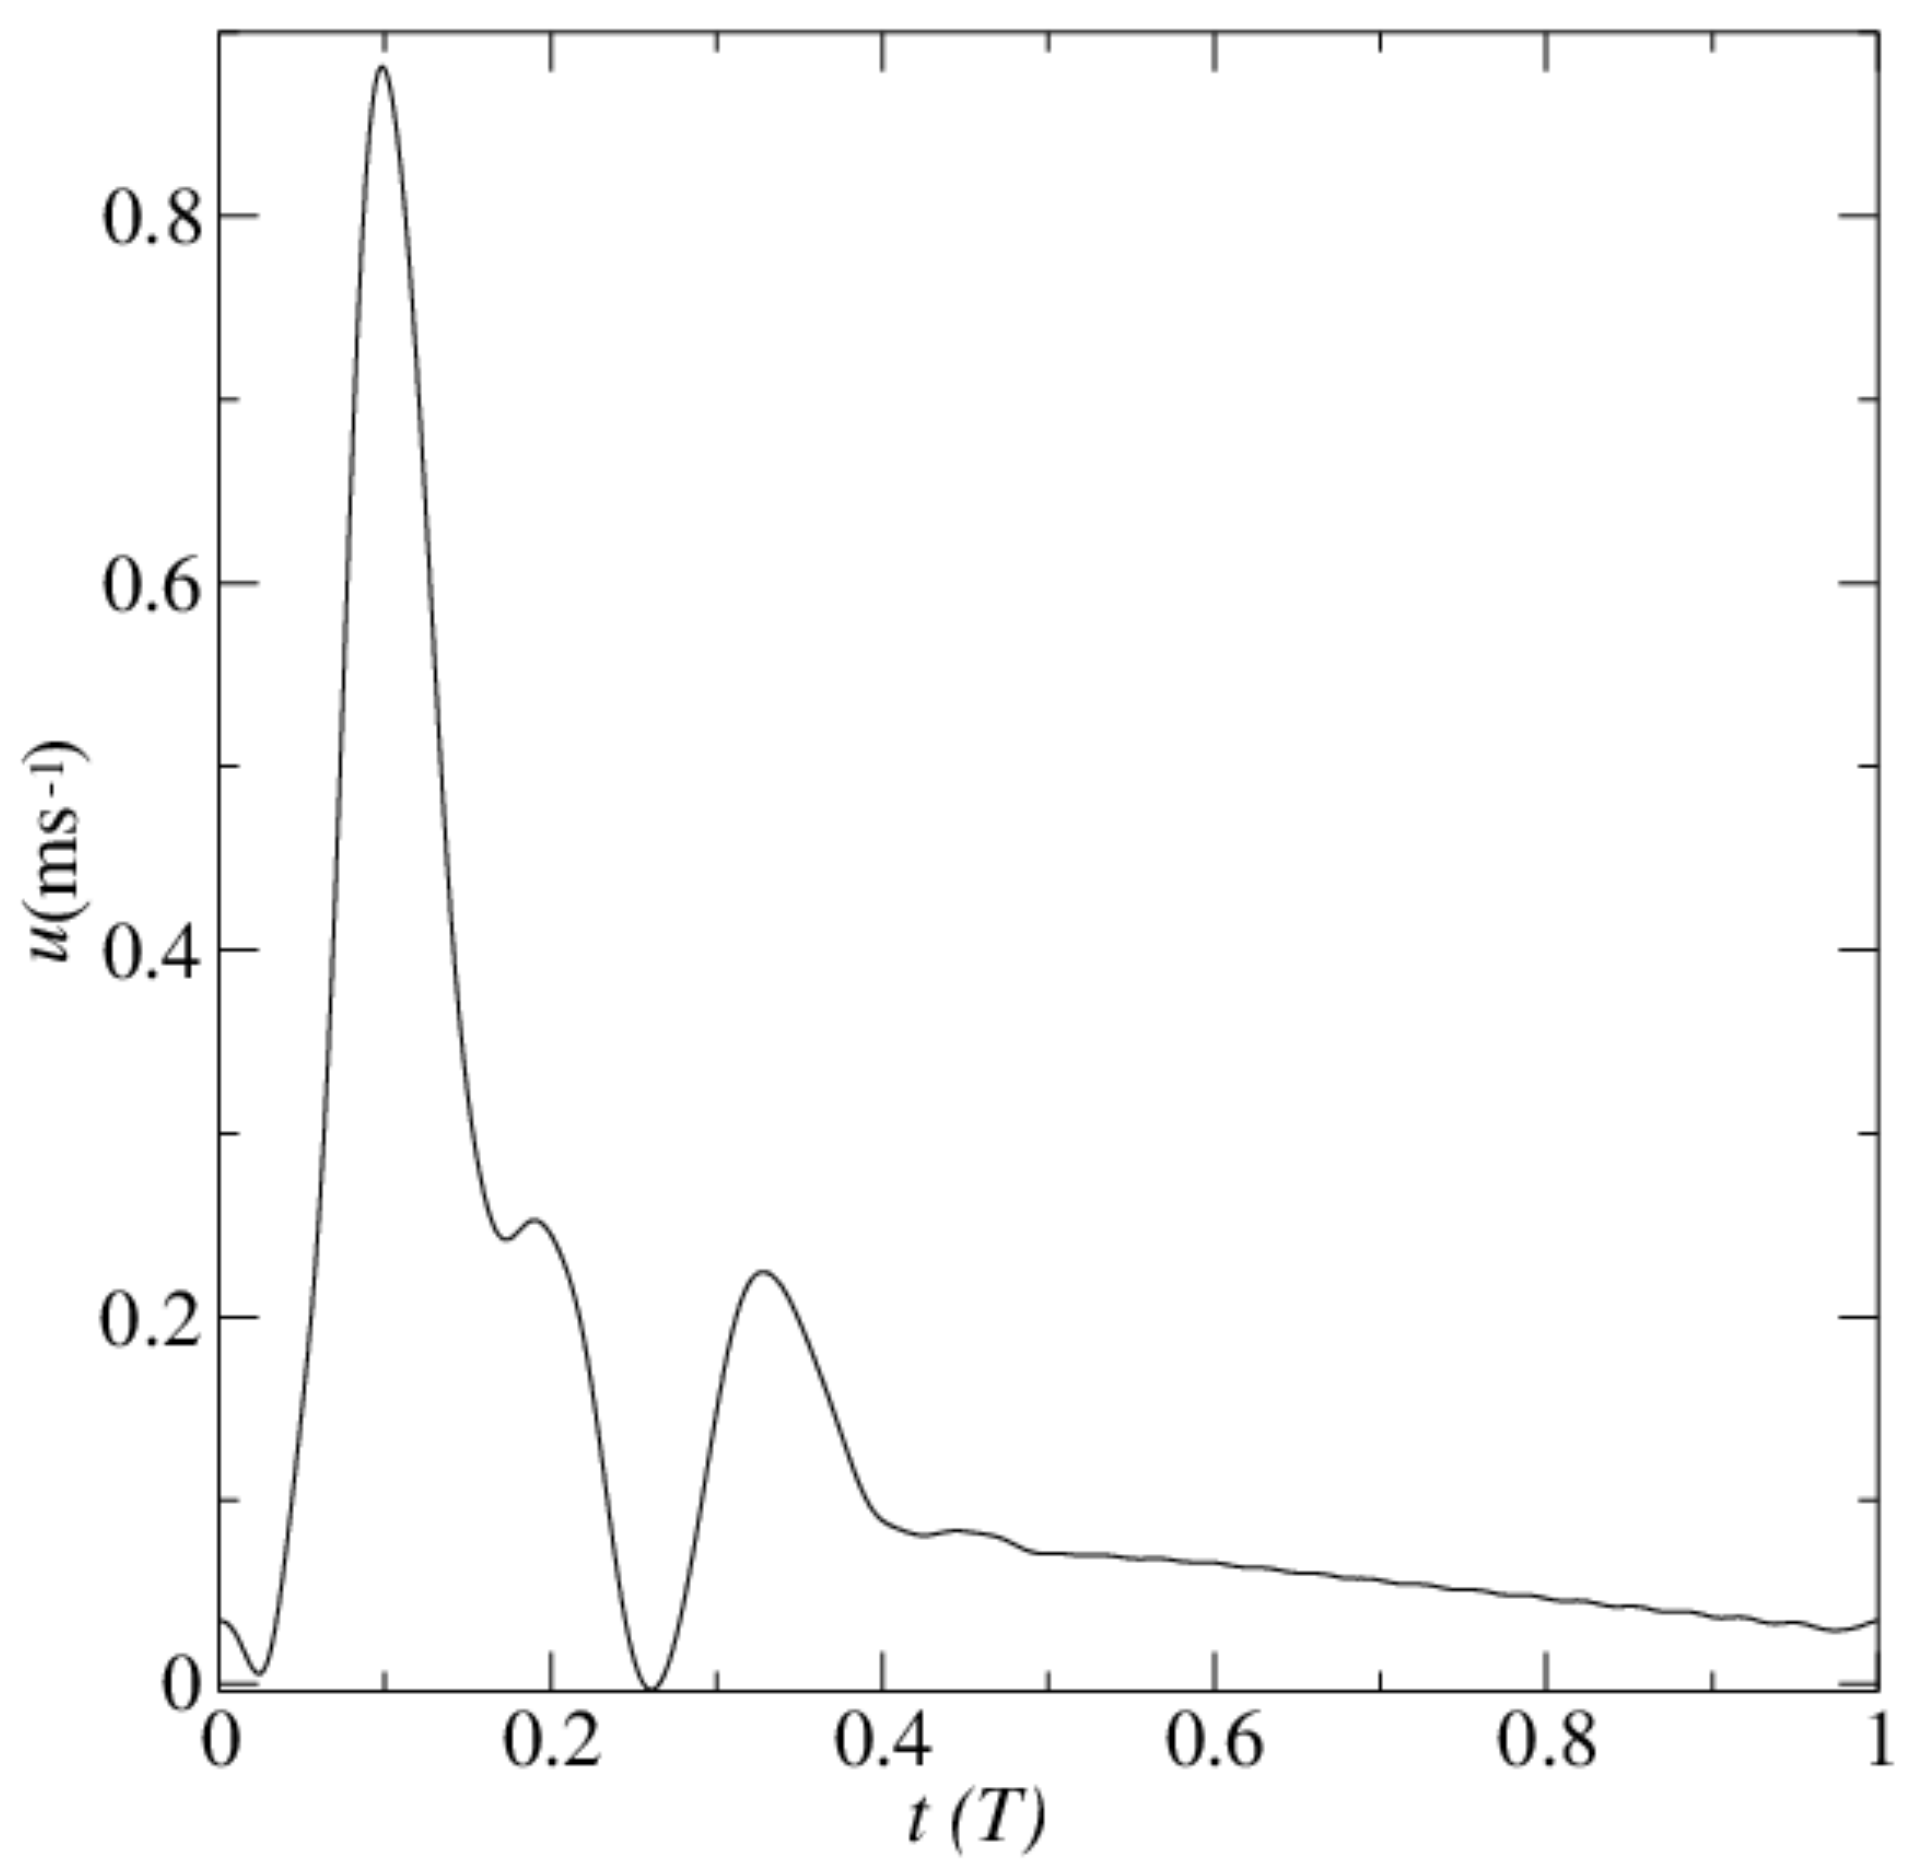
Figure 1. Carotid artery velocity waveform, obtained from Holdsworth et al. [56].
Fluids 08 00282 g001
Figure 2. Artery geometry. The healthy artery is depicted by the solid lines and the stenosed artery by the dotted lines. Also shown are sections S 1 S 6 , which are used to present the development of the stenosis.
Fluids 08 00282 g002
Figure 3. The extrapolation scheme. The fluid sites are shown as filled circles and the wall sites as open circles. They are separated by a physical boundary represented by the solid line. Also shown are the sites x f , x w and x f f , which are used in the extrapolation boundary scheme, and the normalised distance δ * .
Fluids 08 00282 g003
Figure 4. Layer development of the stenosis using TAWSS as a marker for (a) the Newtonian model and (b) the non-Newtonian C-Y model.
Fluids 08 00282 g004
Figure 5. Layer development of the stenosis using O:WS as a marker for (a) the Newtonian model and (b) the non-Newtonian C-Y model.
Fluids 08 00282 g005
Figure 6. Stenosis development using TAWSS as a marker for (a) Newtonian model, (b) non-Newtonian C-Y model and (c) their comparison.
Fluids 08 00282 g006
Figure 7. Stenosis development using O:WS as a marker for (a) Newtonian model, (b) non-Newtonian C-Y model and (c) their comparison.
Fluids 08 00282 g007
Figure 8. Area removed from (a) the ECA and (b) the ICA by the developing stenosis using TAWSS and O:WS as markers for both the Newtonian and Non-Newtonian C-Y models.
Fluids 08 00282 g008
Figure 9. Change in artery diameter as the plaque is deposited and the stenosis develops along the sections (a) S 1 , (b) S 2 , (c) S 3 , (d) S 4 , (e) S 5 and (f) S 6 using TAWSS and O:WS as a marker for both the Newtonian and non-Newtonian models.
Fluids 08 00282 g009
Figure 10. Near-wall haemodynamics on the ECA over the development of stenosis using TAWSS as a marker: (a,b) u ( 1 ) ¯ ; (c,d) u t ( 1 ) ¯ ; (e,f) OSI; (g,h) RRT; and (i,j) RFI, on the outer wall of the ECA, using a Newtonian model (left column) and non-Newtonian C-Y model (right column).
Fluids 08 00282 g010aFluids 08 00282 g010b
Figure 11. Near-wall haemodynamics on the ICA over the development of the stenosis using TAWSS as a marker: (a,b) u ( 1 ) ¯ ; (c,d) u t ( 1 ) ¯ ; (e,f) OSI; (g,h) RRT; and (i,j) RFI, on the outer wall of the ICA, using a Newtonian model (left column) and non-Newtonian C-Y model (right column).
Fluids 08 00282 g011aFluids 08 00282 g011b
Table 1. Carotid artery parameters, based on Holdsworth et al. [56] and equivalent Boltzmann scaled parameters.
ParameterArteryBoltzmann (lu)
u 0 1.07   m s 1 0.08152
D 6.4 × 10 3   m 36
ν = ν 3.5 × 10 6 Pa · s 0.0015
T 0.91   s 66,987
α 4.5 4.5
R e δ 307307
Table 2. C-Y model parameters from Abraham et al. [67] and equivalent Boltzmann scaled parameters.
ParameterSIBoltzmann (lu)
μ 0 2.17 × 10 4 Pa · s 0.068364
μ 3.5 × 10 6 Pa · s 0.0015
λ 1.5 s 1 603,619
a 0.64 0.64
n 0.2128 0.2128
Disclaimer/Publisher’s Note: The statements, opinions and data contained in all publications are solely those of the individual author(s) and contributor(s) and not of MDPI and/or the editor(s). MDPI and/or the editor(s) disclaim responsibility for any injury to people or property resulting from any ideas, methods, instructions or products referred to in the content.