Article

An Affordable Acoustic Measurement Campaign for Early Prototyping Applied to Electric Ducted Fan Units

1
Institute of Fundamentals and Theory in Electrical Engineering, Graz University of Technology, 8010 Graz, Austria
2
Institute of Mechanics and Mechatronics, Technische Universität Wien, 1040 Wien, Austria
3
VOLARE GmbH, 2340 Mödling, Austria
*
Author to whom correspondence should be addressed.
These authors contributed equally to this work.
Fluids 2023, 8(4), 116; https://doi.org/10.3390/fluids8040116
Submission received: 4 March 2023 / Revised: 22 March 2023 / Accepted: 28 March 2023 / Published: 31 March 2023

Abstract

:
New innovative green concepts in electrified vertical take-off and landing vehicles are currently emerging as a revolution in urban mobility going into the third dimension (vertically). The high population density of cities makes the market share highly attractive while posing an extraordinary challenge in terms of community acceptance due to the increasing and possibly noisier commuter traffic. In addition to passenger transport, package deliveries to customers by drones may enter the market. The new challenges associated with this increasing transportation need in urban, rural, and populated areas pose challenges for established companies and startups to deliver low-noise emission products. The article’s objective is to revisit the benefits and drawbacks of an affordable acoustic measurement campaign focused on early prototyping. In the very early phase of product development, available resources are often considerably limited. With this in mind, this article discusses the sound power results using the enveloping surface method in a typically available low-reflection room with a reflecting floor according to DIN EN ISO 3744:2011-02. The method is applied to a subsonic electric ducted fan (EDF) unit of a 1:2 scaled electrified vertical take-off and landing vehicle. The results show that considerable information at low costs can be gained for the early prototyping stage, despite this easy-to-use, easy-to-realize, and non-fine-tuned measurement setup. Furthermore, the limitations and improvements to a possible experimental setup are presented to discuss a potentially more ideal measurement environment. Measurements at discrete operating points and transient measurements across the total operating range were conducted to provide complete information on the EDF’s acoustic behavior. The rotor-self noise and the rotor–stator interaction were identified as primary tonal sound sources, along with the highest broadband noise sources located on the rotor. Based on engineering experience, a first acoustic improvement treatment was also quantified with a sound power level reduction of 4 dB(A). In conclusion, the presented method is a beneficial first measurement campaign to quantify the acoustic properties of an electric ducted fan unit under minimal resources in a reasonable time of several weeks when starting from scratch.

1. Introduction

Highly populated cities make the market share of transportation and product deliveries for urban mobility extremely attractive by going into the third dimension (vertically). The demand for fast relocation is met by (electrified) vertical take-off and landing vehicles for passenger transport, and drones possibly delivering goods in the future. It is evident that this scenario poses an extraordinary challenge for the community issuing regulations (ICAO Annex 16 [1]) and the stakeholders of such operating systems due to possible noise emissions that must be classified, analyzed, and reduced to an acceptable minimum [2]. The article revisits the usefulness of a measurement procedure to first gain insights into such propulsion units associated with new disruptive technologies and outlines how to affordably start with noise mitigation at the early prototyping stage and within a short time.
Electric propulsion has become a vital part of the aviation sector among electrically powered vertical take-off and landing (eVTOL) aircraft. The noise emissions of eVTOL aircraft are mainly produced by the propulsion and lifting units and are of major concern during certification. During vertical flight operation, usually performed in urban and rural areas, the propulsion units’ thrust generates lift forces [3,4] and, simultaneously, a substantial amount of noise emissions. One type of electric propulsion system is an EDF. Figure 1 shows a schematic of the EDF based on a single-stage axial fan and its aerodynamic and electric components. Such an EDF is the subject of this study on acoustic characterization in early prototyping.
Similar types of electric aero-engines [6,7,8,9,10] have been aerodynamically studied for small-scale aircrafts [11]. Typically, the rotors are driven at high angular velocities (such as 8000 revolutions per minute) and relatively low Reynolds numbers (10,000 to 100,000) compared to large aircraft engines. Both the positioning of multiple propulsion units as well as the in-duct placement of the rotors is a challenge for flight control and noise [4,11] but offers a high potential for the optimization of fuel consumption, emission, noise reduction [12,13,14], and operational flexibility [15]. Although the whole aircraft offers acoustic shielding effects, in early prototyping, a component-based evaluation is of significant importance in the detection of design errors upfront [16] and gained experience with electric propulsion units [17].
Concerning this need for the structured experimental assessment of preliminary design at low cost, this case study on the electric ducted fan unit provides valuable insights for conducting such an evaluation with relatively few resources and within a stringent timeframe. In contrast to well-tailored and detailed experimental studies concerning the electric ducted fan noise [18,19] of the past hosted inside expensive facilities, the study concentrates on the overall aspects and an easy-to-realize and affordable method also during the starting phase of a new idea with a limited budget. In [18], the aeroacoustic aspects of the design, construction, and testing of an all-electric ducted fan propulsion unit inside a large anechoic test chamber are presented. In general, ducted fan configurations potentially significantly reduce noise emissions [19,20,21]. These options include incorporating acoustic liners into ducted walls [22] and designing the ratio of stator vanes to rotor blades so that specific blade passing frequency harmonics are cut off [23]. Recently, studies have been shown to be insignificant and noise amplification can even occur when incorporating simple ducts into an existing propeller unit [11,12]. As a design concept, it is critical that the duct has the potential to both lower and increase the sound emission; possible erroneous designs can be sorted out early with the proposed method, since keeping them in the development process is very costly. Furthermore, the method can be combined with computational models [24,25] to gain further insight into the mechanism and serve as a plausible baseline for the simulation.
Another important aspect of the noise generation of electric ducted fans is the excitation of electric motor forces and possible attenuation by structural modes [26]. Additionally, the authors of [22] reported the high-frequency noise of the electronic switching since the frequencies can be close to the natural frequencies of the structure, especially when placed inside the fan’s duct. Typically, this switching noise occurs around a base switching frequency, and both increasing and falling harmonics arise during operation [26,27,28]. Common strategies for avoiding this source of sound are placing them outside the human hearing range or by advanced switching algorithms [27]. For instance, such a parasitic side effect is an exemplary motivation for this article by the underlying data showing the unexpected effects of the electric drive of the electric ducted fan unit.
Based on the proposed enveloping surface of the international standard DIN EN ISO 3744:2011-02 [29], ten microphones were positioned around the electric ducted fan unit. As an alternative approach, the acoustic intensimetry can be used to quantify the acoustic characteristics. The fan’s sound emissions are subject to the following investigation at different operating points. The total sound power of the operating EDF unit was measured at different operation points. In doing so, the far-field measurements of the unit’s electric powertrain with and without load were conducted, which showed significant noise emissions at the blade passing frequencies. We acoustically investigated the electric powertrain, consisting of an electronically commutated brushless DC motor (ECM) and the motor controller without load and found significant contributions from the periodic electromagnetic forces and the motor controller electronics. After processing the insights gained from the measuring campaign, a secondary noise reduction measure was designed. By considering several options for noise mitigation, a micro-perforated plate liner configuration after the fan was placed inside the duct with an optimally designed back volume. The noise was evaluated using an A-weighting to account for human perception. This paper is an extended version of an article published in the AIAA Aviation Forum 2021, USA, 2–6 August 2021 [22].
This article is structured as follows. The electric ducted fan unit and the upfront noise mitigation measures are presented. This is followed by the setup of the measurement campaign designed for early prototyping studies of electric ducted fan units. The limitation of the enveloping surface method regarding this application is discussed. Based on this initial measurement campaign, the results are analyzed, and conclusions for improvements are drawn in a structured way. The results indicate two interesting issues for further analysis. Firstly, at 9000 revolutions per minute, a hump in the overall sound pressure level was found and further investigated within the means of the method. Secondly, the characteristics of the far-field noise of the EDF unit’s electric powertrain, consisting of a brushless DC motor and electronic speed controller without load were analyzed. After processing the insights gained from the measuring campaign with accompanying duct mode simulations, a secondary noise reduction measure was designed and evaluated.

2. Application and Device under Test

The device under test is a subsonic, subscale 1:2, single-stage, axial-flow EDF unit. Figure 2 shows how the axial-flow EDFs are mounted at the APELEON X1 and provides a detailed picture of the EDF unit mounted on the propulsion test rig during the measurement setup of the enveloping surface method.
Figure 1 schematically shows the structure of the EDF unit under test. The primary parts of the EDF unit are the rotor, consisting of seven blades, the spinner, the electric motor, the stator with four guide vanes vectorizing the flow and connecting the brushless DC motor (seven pole pairs) with the motor controller, which is assembled inside the duct hub and the duct with a curved inlet lip. Further geometrical details can be found in [5].

2.1. Revisiting Basic Acoustic Emissions of EDF Units

This EDF unit generates aeroacoustic sound that is characteristic for axial fans [30] and summarized in Table 1.
According to [23], the primary noise emissions of axial fans stem from aerodynamic excitation. The detailed mechanism highly depends on the underlying design of the fan, the operating conditions, and the inflow profile. For a partial load range, typically, a rotating stall [34] and subharmonics tip noise [35] occur and dominate the acoustic spectrum. Blade thickness noise and Gutin noise are usually relevant for relatively high rotational speeds of the fan [31,32,36]. Turbulent ingestion noise is generally present for distorted and highly turbulent inflow [30]. Rotor self-noise and noise generated by the interaction between the rotor and stator flow generate tonal noise at the blade-passing frequency (BPF) [37,38] f BPF = B f rot , and its harmonic frequencies f BPF n = n f BPF , with B being the number of rotor blades, f rot being the rotational speed, and n being the harmonic multiplicity. The noise origin at the BPF and its harmonics is anticipated to be from the rotor–stator interactions for subsonic rotor-self mechanisms inside circular ducts [37].
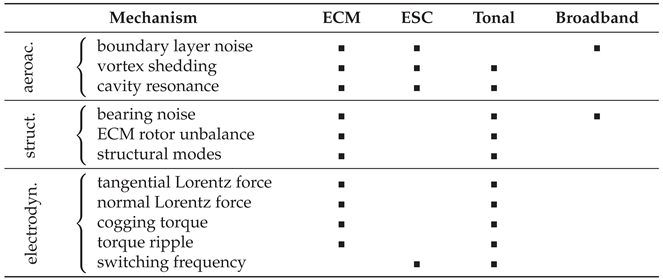
In addition, the EDFs’ electric powertrain emits noise. Table 2 summarizes possible source and attenuation mechanisms related to the electric motor placement inside the duct. The individual mechanisms are classified into tonal and broadband representation inside a measured spectrum. Furthermore, the excitation is classified as aeroacoustic, structurally related, and electrodynamic. In addition, the electric drive parts, electronic commutate motor (ECM), and electronic speed controller (ESC), responsible for the acoustic emission, are also provided.
The noise emissions of an ECM are the result of electromagnetic force and torque ripples during operation [39,40,41,42]. The fundamental frequency of the electromagnetic force forces is f LF = 2 p f rot , and its harmonic frequencies are f LFn = 2 n p f rot . The frequencies can be computed using the number of motor pole pairs p [39,41,42].

2.2. Noise Mitigation Strategies

Since future small aircraft should operate and be tolerated in urban and rural environments, noise reduction is relevant, even on the component level. Therefore, propulsion noise should be considered early, indicating a motivation for this investigation at the conceptual design stage [15]. For instance, the ducted fan offers the potential to combine a variety of rotor blade and stator vane designs to minimize noise, offer noise shielding options, and the placement of acoustic liners [43,44] with the use of acoustic metamaterials (e.g., [45,46]). Figure 3 shows possible locations to apply noise mitigation measures.
In the current design, the stator is placed downstream, as so-called outlet guide vanes, to significantly lower the sound pressure levels (SPLs) for the resulting rotor–stator interaction compared to upstream stator installations [47]. The guide vanes are swept to further decrease the noise emissions. No special care was taken in the current configuration by selecting the rotor blade number and the guide vane number to cut off lower harmonic duct modes. Furthermore, no modifications of the leading and trailing edge serrations [48] or forward and backward skew [49] were applied to the fan blades.
A possible noise amplification effect that is important to investigate is that the manufactured EDF unit number of electric motor pole pairs equals the rotor blades p = B = 7 . As a consequence, the excitation frequency of the electromagnetic forces matches the second harmonic of the BPF f LF = 2 f BPF of the EDF unit. Changing this attribute can reduce the emitted sound regarding the overall sound level.
Finally, the electric motor controller cooling fins reach into the air stream inside the duct to achieve the required cooling. This placement impacts the overall aerodynamic sound generation. Furthermore, the structural sound of the switching currents may be transmitted inside the duct and possibly amplified. In the case of occurring switching noise, advanced switching routines can drastically reduce the noise emissions.

2.3. Design Constraints for Noise Mitigation Measures

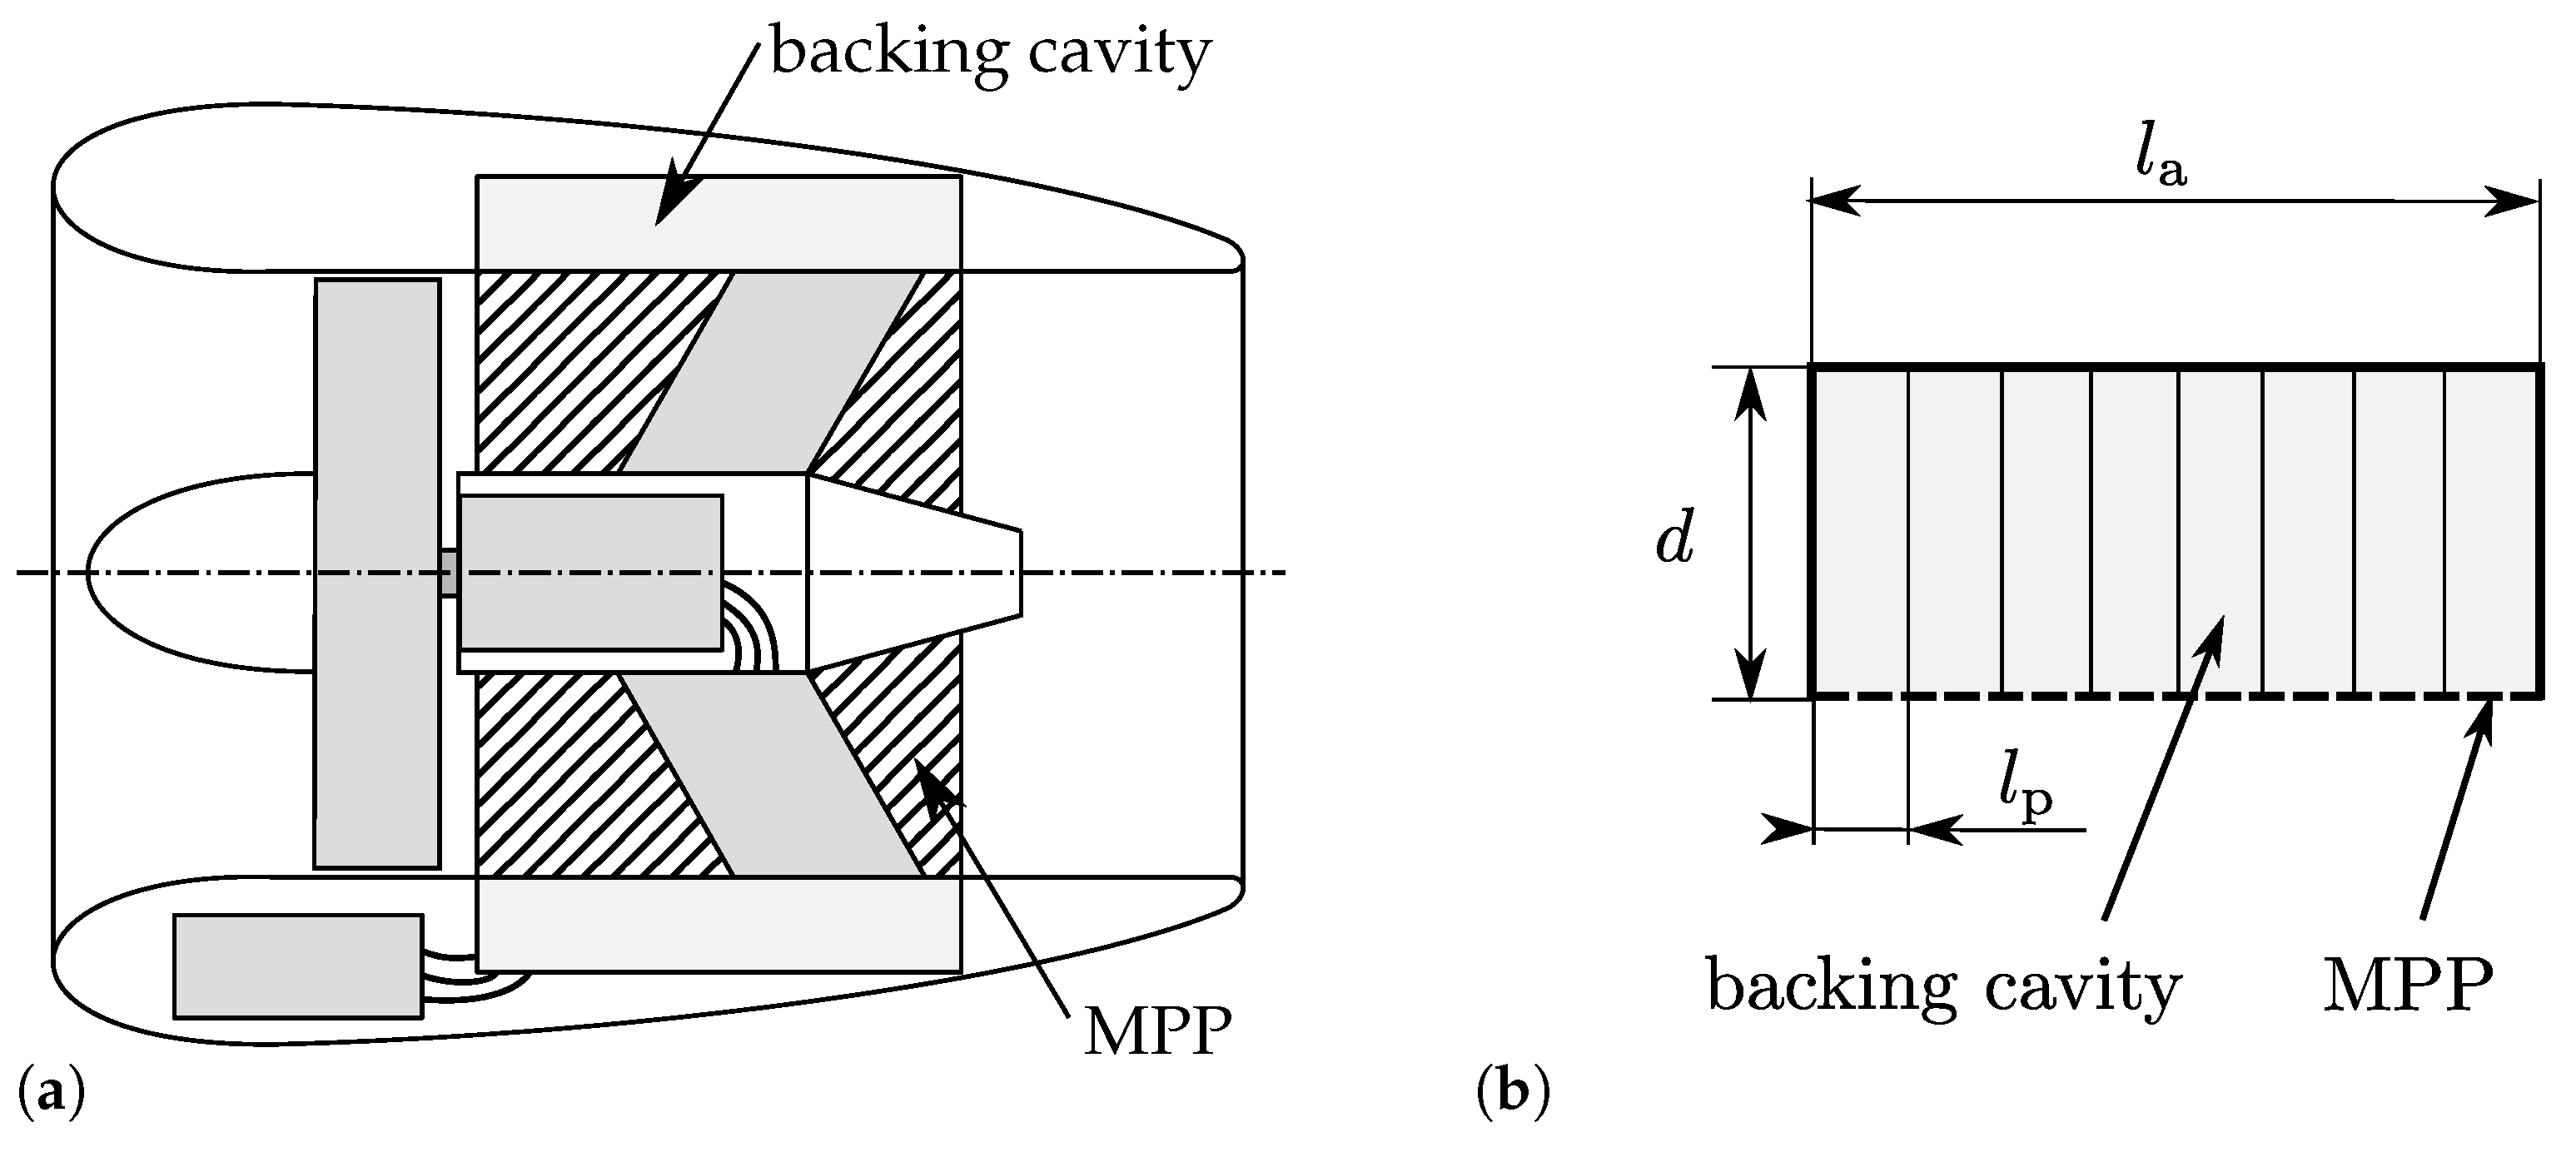
Regarding this study, being executed in early prototyping, the primary and fundamental principles behind the noise generation are essential to gain a first insight into the aeroacoustic properties of the device [15]. In reality, the design space of possible noise mitigation structures was limited by the current design of the EDF unit. No alternation of the housing and dimensions of the duct with a length of 250 mm, a duct diameter of 201.3 mm, the number of stator blades and the number of rotor blades, and the rotor diameter of 200 mm was in the scope of possibilities. Furthermore, the influence of a possible treatment on the aerodynamic characteristics of the fan and the EDF unit must be kept to a minimum. Additionally, the position of the motor controller electronics must stay at the same place due to the cooling requirements. These constraints fundamentally reduce the design space for noise mitigation strategies. After an initial measurement campaign, an acoustic liner treatment to partly cover the inner duct side was applied for the first reduction measure for the acoustic emissions (as can be seen in Figure 4). We selected to use micro-perforated (MASH [50] of the company fteu) liners with back volume, among other treatments, since minor changes in the aerodynamic properties are expected and a currently unused volume in the duct can provide value.
The micro-perforated face sheet of the liner has a perforation rate ϵ = 0.152 and thickness t = 0.7 mm. The perforations are slit-shaped. The absorber liner uses a backing cavity depth of d = 40 mm, which already pushed the geometric limits of the fan unit’s aerodynamic shell. The extent is also limited towards the inlet lip due to the avoidance of absorbers in the rotor plane, which would reduce the fan’s aerodynamic efficiency [51]. The computed absorption coefficient maximum [52] in the lower frequency range at 1800 Hz is nearly 1 and is located close to the fan unit’s BPF at OP4 (see Table 3), which represents the maximum tonal SPL for the examined operating range. The highest broadband SPL will also be partially absorbed by the absorber designed, as the second maximum of the absorption coefficient close to the value of 1 occurs at 5500 Hz. As shown in Figure 4, the backing cavity of the absorber linings designed is partitioned to increase the absorption of random incident sound pressure waves. A partitioning resulted in the rectangular segment cross-sections, which were dimensioned according to former research insights [53]. The absorber linings were placed in the stators guide vane section duct to not disturb the aerodynamics at the rotor tip section. This placement resulted in a relative absorption area of 16.6% of the total inner duct area.

3. Measurement Campaign for Early Prototyping

One of the most important acoustic indicators to determine a machine’s acoustic emissions is the acoustic power level, which can be quantified by the enveloping surface method (ESM) to determine the sound power level of an acoustic source using an anechoic measuring room. The international standard DIN EN ISO 3745 [54] contains all the necessary information and procedures to conduct the measurements needed for accuracy class 1 (e.g., studies conducted in [55,56]). As the claims to the anechoic room have to be proven according to ISO 26101 [57] and are very restrictive, measurements for accuracy class 1 cannot be taken without unreasonable effort and are contradictory to the motivation of this study in providing an affordable experimental setup. However, a measuring method with the lower accuracy class 2 is described in the international standard DIN EN ISO 3744 and can be conducted with fewer resources [29]. The criteria of a 15 dB difference between the external noise and the measured sound is met at all narrowband measurements [5]. The narrowband evaluations are according to DIN EN 61260-1 [58] based on the bandwidth of 1 / 41 of an octave band.

3.1. Operating Conditions

The EDF units’ acoustic emissions are studied at four operating points, defined in Table 3.
Table 3. The studied operating points of the EDF unit.
Operating Point f rot M tip U ¯ Re d f BPF f LF
OP 16000 min 1 0.1822.5 m/s338,3457001400
OP 28000 min 1 0.2430.0 m/s451,1279331866
OP 310,000 min 1 0.3037.5 m/s563,90911672343
OP 412,000 min 1 0.3645.0 m/s676,69114002800
The subsonic behavior of the observed EDF unit is evident when looking at the rotor blades’ tip Mach number M tip = | u tip | / c 0 , with the blade tip velocity u tip and the speed of sound c 0 . The Reynolds number Re d of the flow is based on the duct diameter and the cross-sectional mean velocity U ¯ inside the duct. The aerodynamic design point of operation is OP 4. The temperature was approximately 26 °C, the relative humidity 30%, and the atmospheric pressure was 98 kPa during the calibration and measurement. The microphones were calibrated according to the procedure described in [59]. The EDF was mounted at a fixed location inside a measurement room.

3.2. Measurement Facility

Sound power measurements based on DIN EN ISO 3744:2011-02 were carried out in a fully equipped low-reflection room with a reflecting floor [29].
A porous absorber (Baso Plan 100) was attached to approximately 50% of the room’s walls and ceiling to produce relatively cheap, easy-to-install, and effective absorption characteristics. Mobile protection walls needed to be put up to ensure safety for the people present in the measuring room during the EDF unit’s operation. The acoustic properties of the facility limit the reliable experiments to frequencies above 300 Hz [29]. The room was characterized by reverberation time measurements resulting in a reverberation time T 20 of approximately 150 ms for measured frequencies above 300 Hz [5,59].
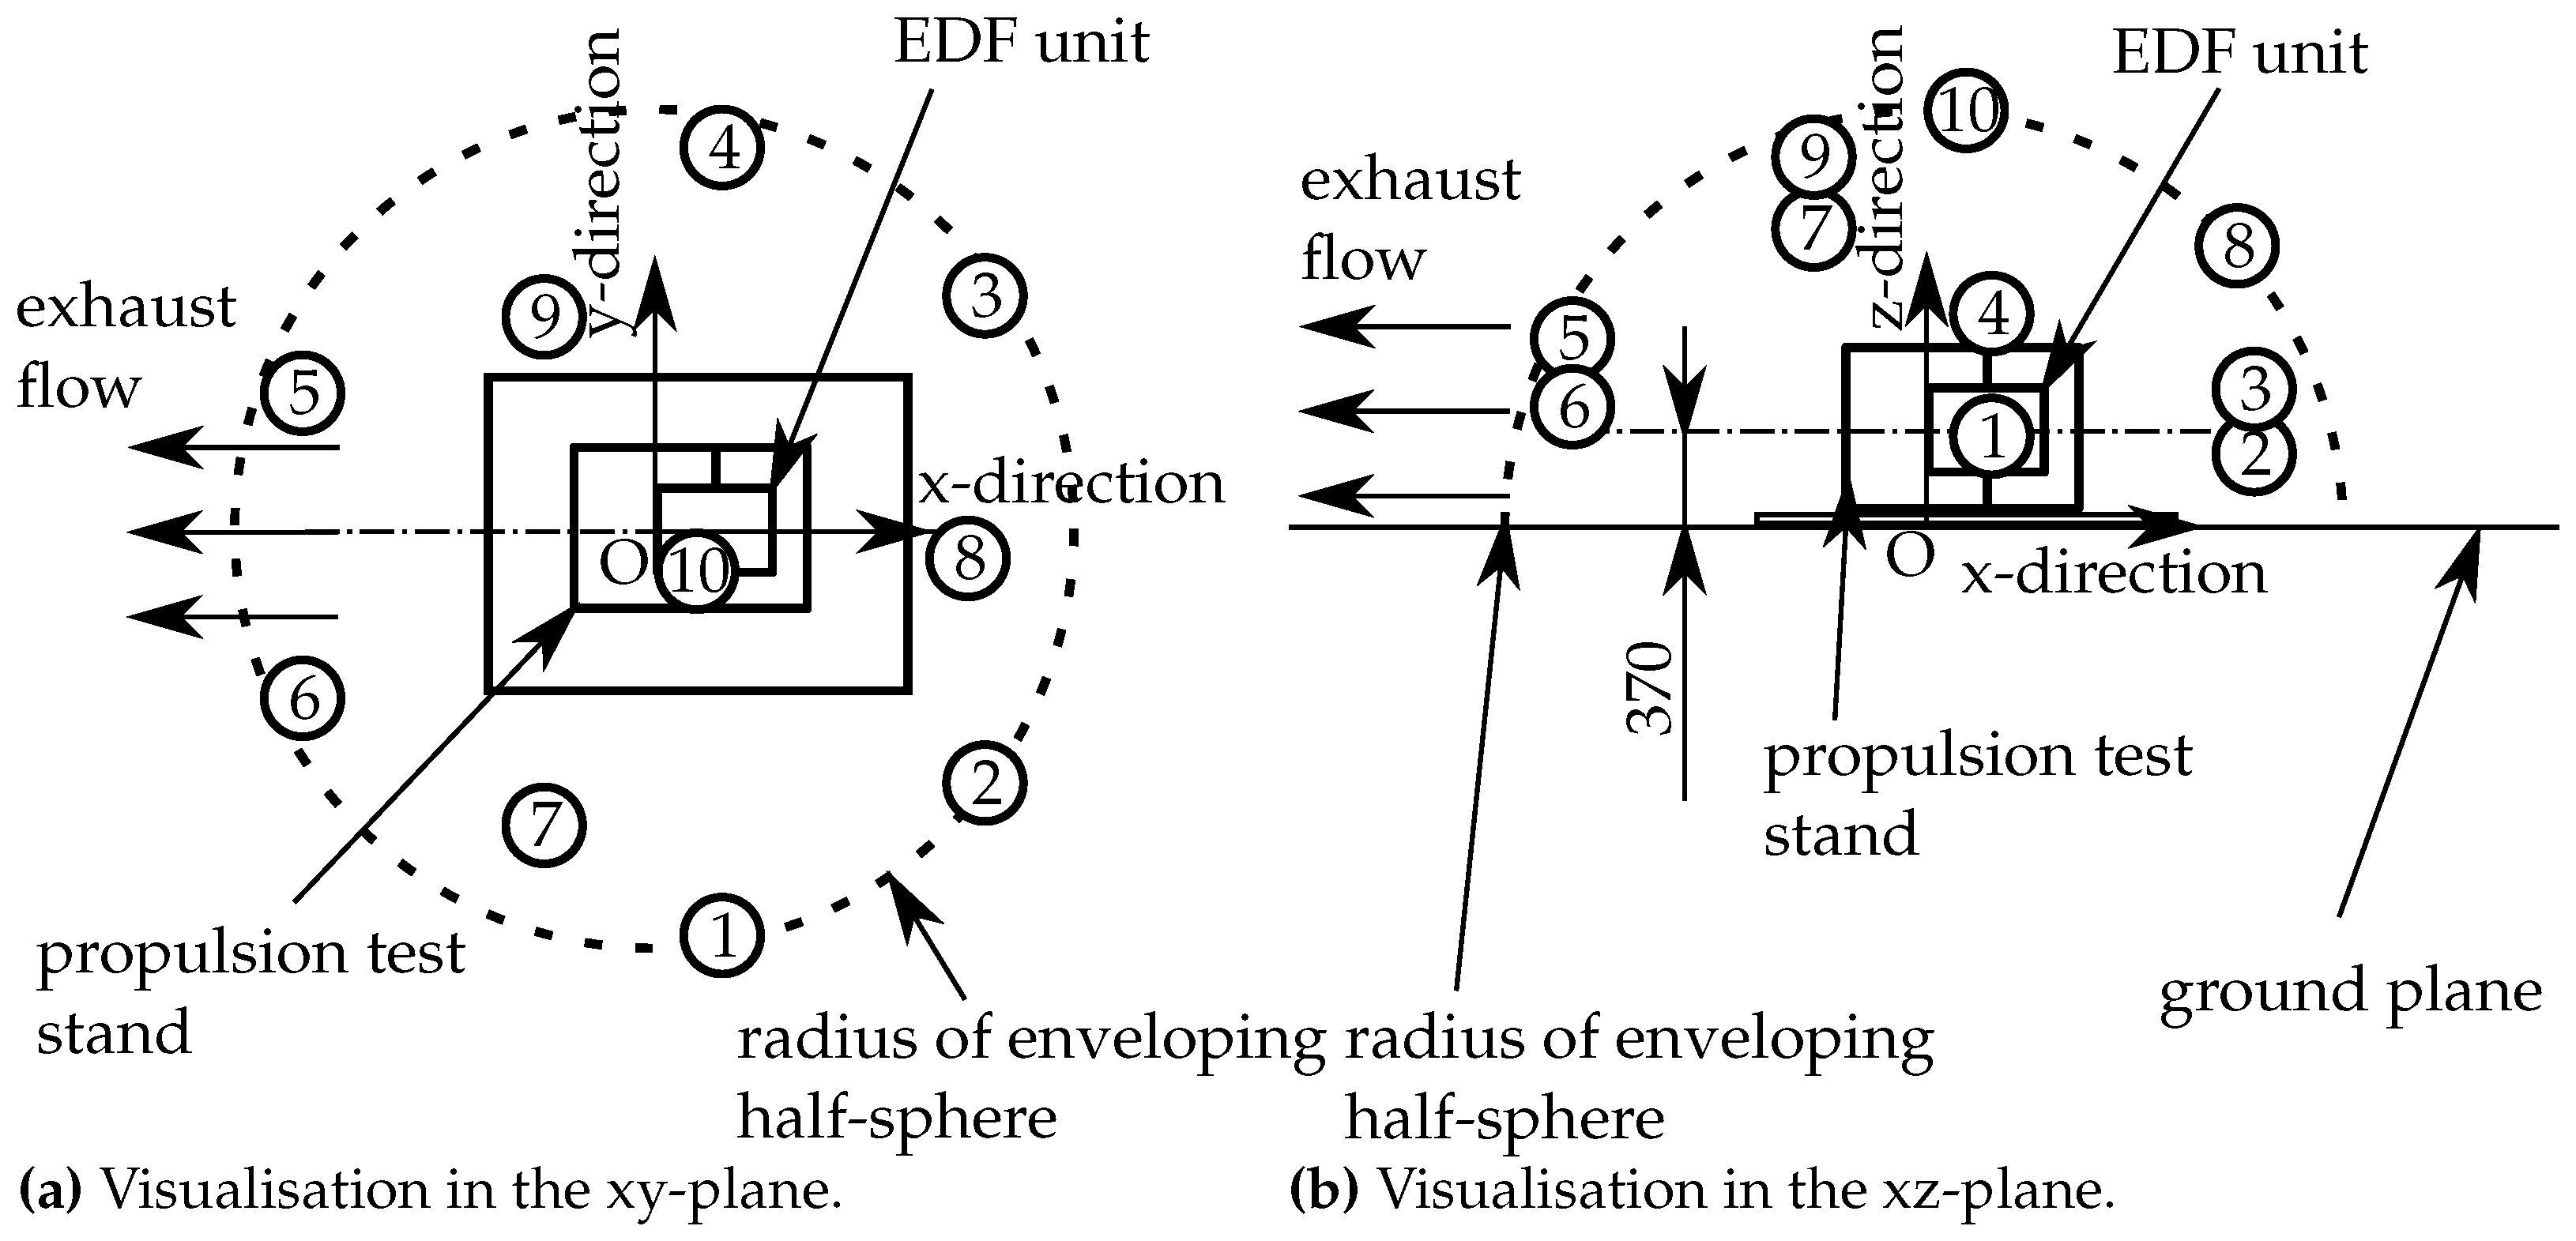
Ten microphones enveloped the EDF unit by spanning a half-sphere surface around it [29] (see Figure 5). The positions of the microphones were used as proposed by the standard for measuring arbitrary sound sources. The EDF unit was placed inside such that no microphones were located inside the significant air stream of the intake and exhaust.
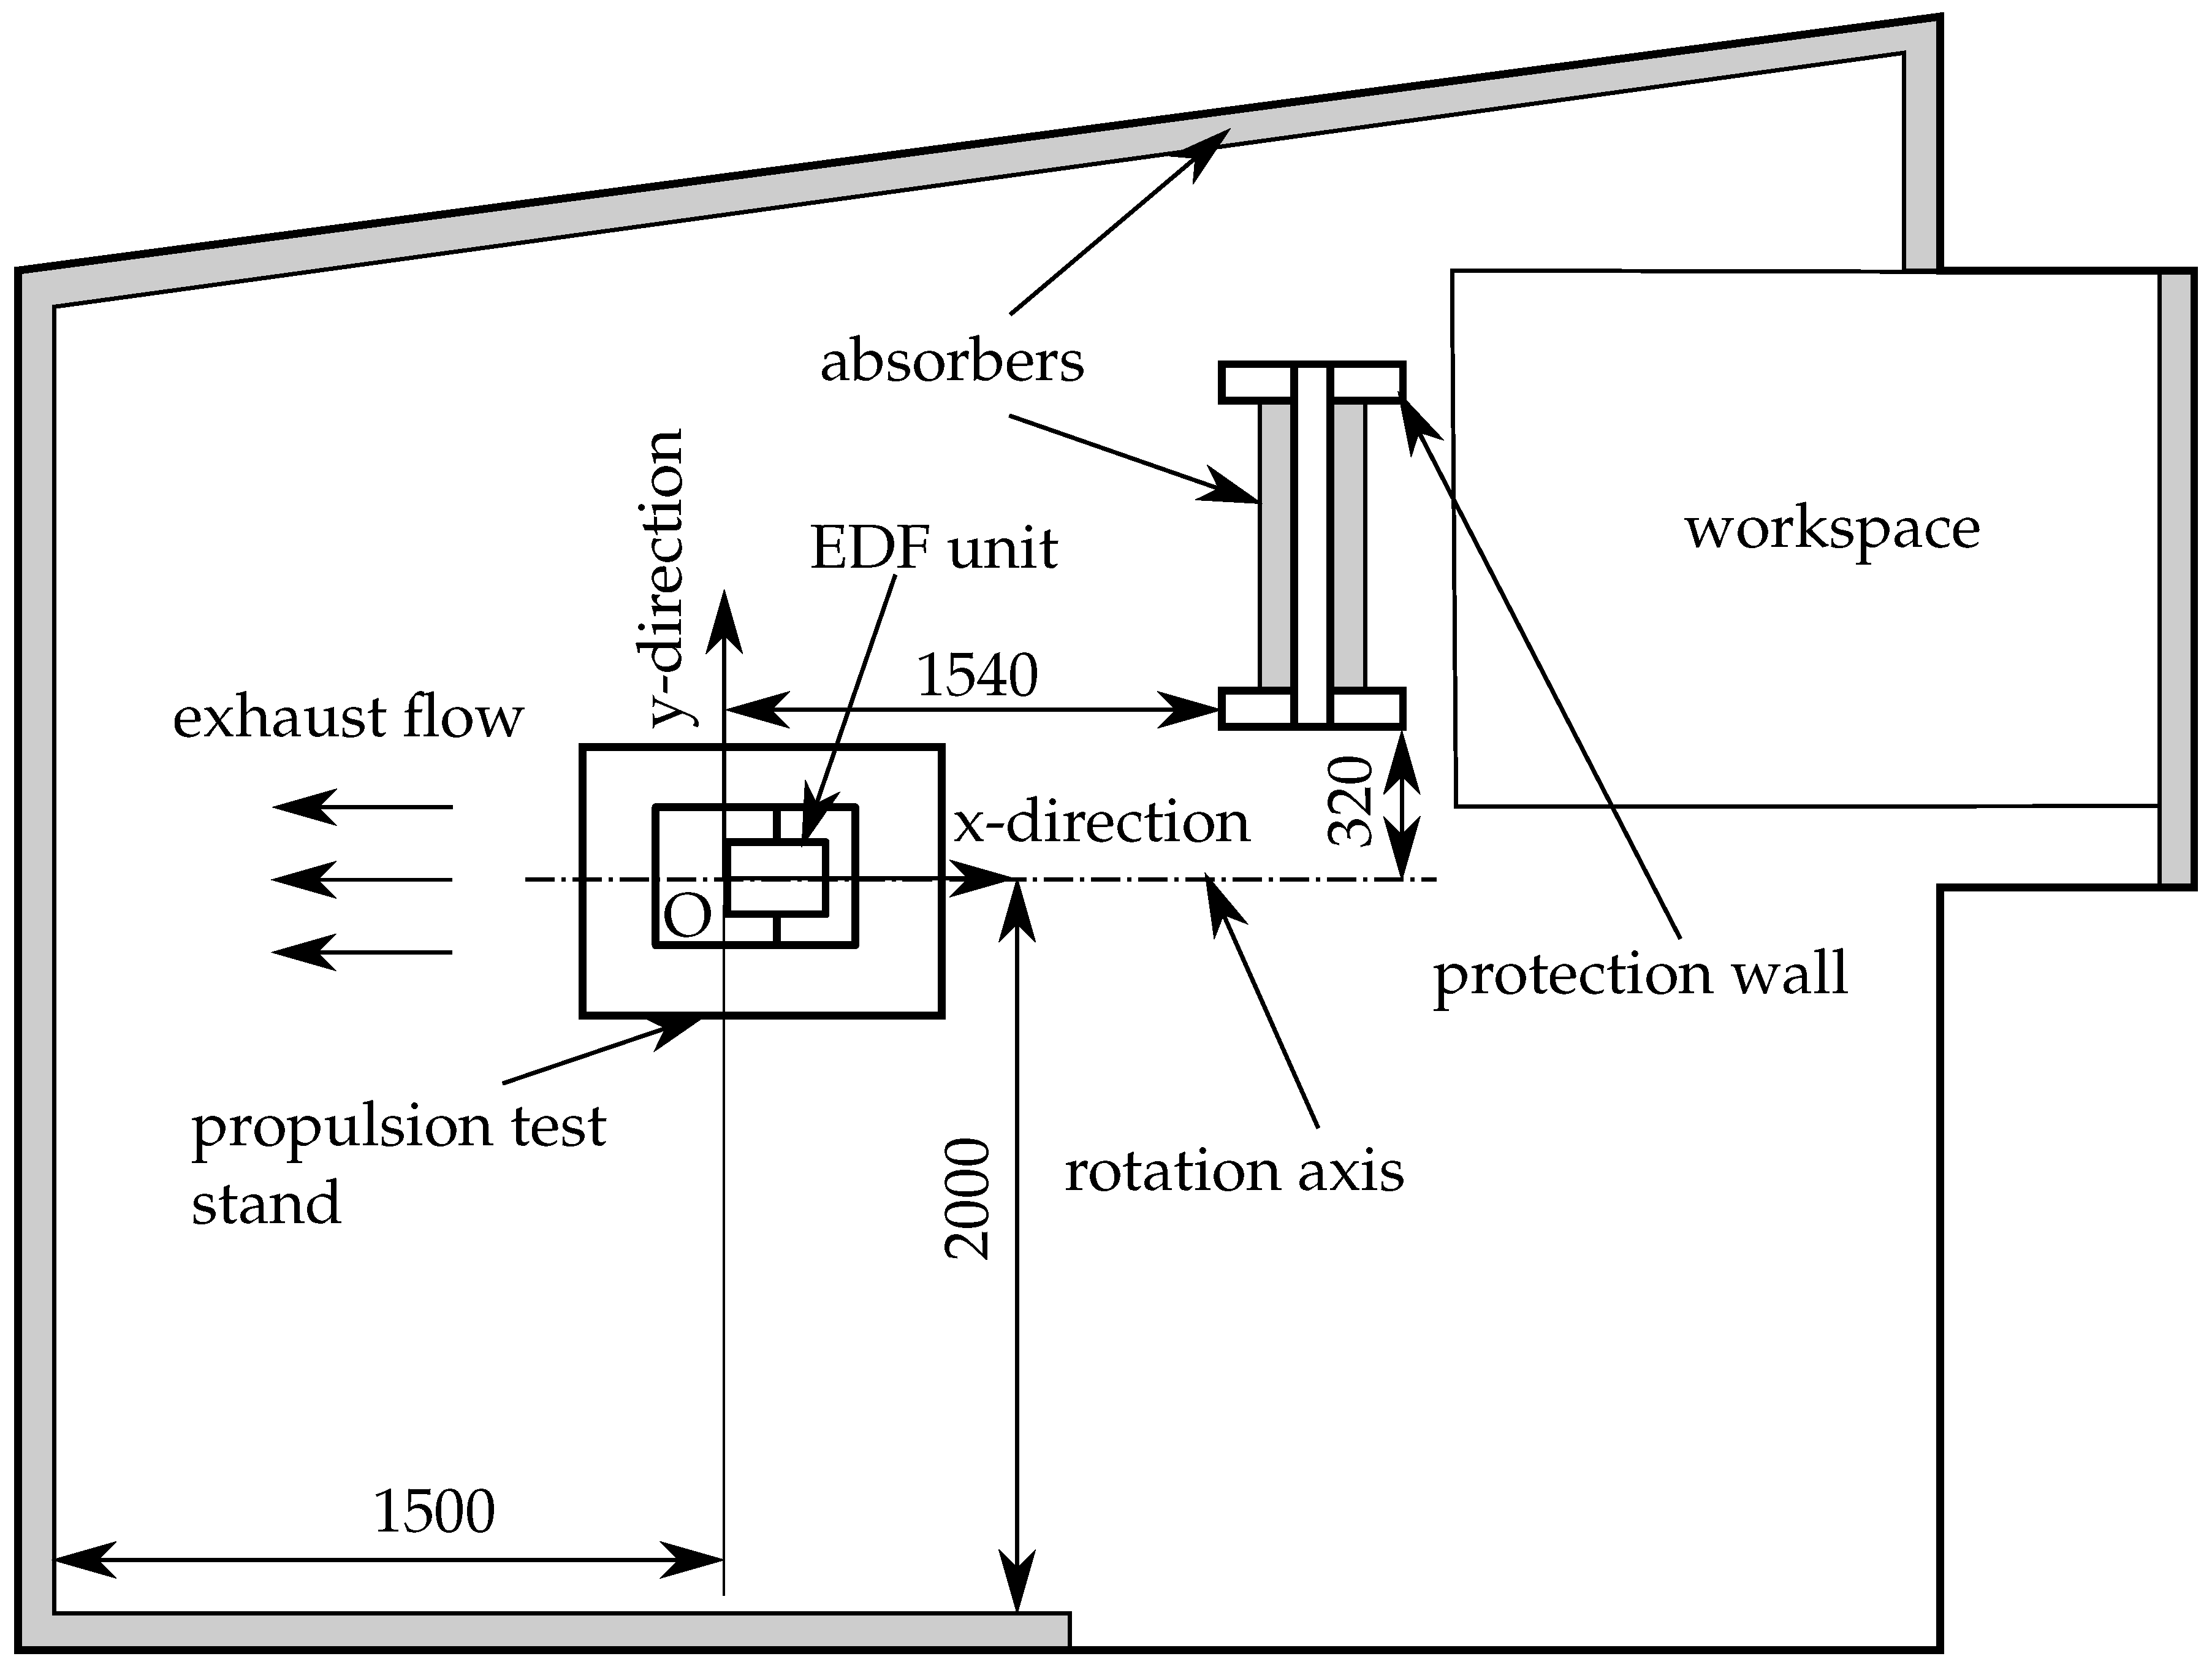
The EDF unit was mounted on a thrust measurement test rig. Figure 6 shows the EDF unit positioned inside the middle of the room to minimize the effects of flow interaction with the surrounding walls. In the current setup, no free flow conditions could be realized. The exhaust flow hits the rear wall, covered by acoustic absorber material, at a distance of 1.5   m . No avoiding measures to reduce the impinging jet on the room walls were used during the experiments. The measurement campaign produced reliable results since the goal was to understand the noise mechanisms and a possible mitigation strategy by comparing two manufactured variants.
The measurement concept followed the data processing presented in [59]. Pre-polarized back-electret condenser microphones (Sennheiser KE 4-211-2) recorded the acoustic signal. Windscreens were used to reduce the effect of the fluid flow on the acoustic results of the microphones. According to the manufacturer, the capsule has high long-term stability and constant sensitivity in the frequency range from 20 to 20,000 Hz (within a deviation 3 dB). The signals emitted by the microphone capsules pass through the microphone-integrated preamplifier to the main amplifier (in-house developed amplifier, a so-called FlexAmplifier), in which the signals can be amplified by a factor of 55 to 430, depending on the setting. The signals are amplified to achieve the recommended output level of the A/D converter (RM M32 AD). The digitized data are transferred to the MADIface (MADIface XT) via a fiber optic cable (LWL), where the signal is converted into the MADI format. The MADIface is connected to the computer via USB. Finally, the data are read and processed in MATLAB using the ASIO driver.
The measurements were sampled at a frequency of f s = 48 kHz. Each operating point was measured for 20 s . The data are further processed by the Matlab-based AcouCam-Software [59]. The measurement results were corrected with the measuring room’s reverberation characteristics and the individual microphones’ frequency-dependent sensitivities based on the data generated in [59]. Finally, the A-weighted sound power level spatially averaged across all microphone positions L W , A ¯ was computed.

3.3. Limitations and Improvements

As already discussed above, this section additionally highlights possible limitations on the study in order to generate awareness and that the purpose of this study was not to tailor the measurements towards the highest accuracy but to stay within a minimal budget and to compare different configurations of the same EDF unit with an identical setup. The reproducibility was therefore tested during the experimental investigations and found to be the case within the 1 dB(A) range.
A major improvement to the current study would be to perform countermeasures to the impinging jet on the room’s walls and avoid large recirculations. Mitigating this was not possible in the available measurement facilities. The microphone positions were selected such that the influence of the airflow was kept to a minimum. Moreover, recirculations can affect the acoustic measurement and should be avoided using a relatively large room [15].
The authors are aware of the influence of ingested external disturbances, as they could strongly affect acoustic behavior. The problems first arose when comparing the acoustic data of jet engines gathered through ground tests and in-flight measurements with different inflow conditions. When ground vortices, atmospheric turbulences, or other flow disturbances are ingested, they are experienced by the rotor for several revolutions due to the elongation of the flow medium in a streamlined direction. In conclusion, broadband noise and tonal noise components result from ingested external disturbances interacting with the rotor [60,61]. In the ground testing stage of this study, the mitigation of this effect is subject to more advanced testing.
Furthermore, the directivity of the EDF unit’s acoustic emissions was considered unidirectional. Several publications mentioned that the radiation is not unidirectional and varies with frequency (e.g., see in [15,25]). Since the setup’s directivity was not clear upfront in this very early prototyping study, the benefit of knowing the directivity of a possible setup not being put into further production may be excessively early in the design process. We recommend studying the directivity and adapting the measurement positions for a second follow-up study of an EDF unit passing this presented preliminary study.
In addition, the investigated EDF unit is a subsonic, subscale 1:2, single-stage, axial-flow EDF unit. The direct transfer of gained knowledge to the 1:1 scale, single-stage, and axial-flow EDF unit is not straightforward concerning the detailed aerodynamic properties and acoustic emissions. Several scaling laws exist to give a first estimate of the behavior of changing geometrical size. Aerodynamically, the trust for unchanged powering conditions scales with the geometry being the square of the third root of the rotor diameter and the scale with the square of the mean velocity based on the volume flow [62]. For an identical working fluid and an equal rotor tip speed, resulting in constant Strouhal and Helmholtz numbers, the scaling from a model-size fan to a full-size version is based on the work in [43]. For the total sound power, P can be expressed by
P | u tip | 3 M tip 1 + 2 ϵ d Rotor 2
with d Rotor being the rotor diameter and ϵ being the tip speed exponent, which has to be determined for a specific fan model. The tip speed exponent can vary for one fan model depending on whether the measuring location is at the duct inlet or outlet section. Now, the total sound power level difference in dB between two-dimensionally similar axial fans can be estimated by
L W , 2 L W , 1 = 10 ( 4 + 2 ϵ ) log | u tip , 2 | | u tip , 1 | + 20 log d Rotor , 2 d Rotor , 1
Acoustically, the frequency location of the duct modes will change with changing geometry and modulate different frequencies of sound sources.
Finally, the measurement facility has no option to emulate a dismounted fan configuration’s load onto the electric motor during measurements without a fan. Emulating the reactions from the fan would be necessary for a very reliable experimental study of the electric motor and the electronics. Again, within this limited budget and the facilities available, this was not possible in the scope of the work, and it was decided to drive the electric motor without fan loading to gain at least some information about the electric drive system. For following up on this topic, it is recommended to emulate the fan loading by a second electric motor connected to the propeller shaft.

4. Sound Power Measurements Results

Regarding the execution in early prototyping, the results are presented in the historical order of the data acquisition to highlight the knowledge generation process and reasoning accordingly. Firstly, the initial EDF unit results are presented and followed by an intermediate conclusion to point out the direction of follow-up investigations. After that, the noise emitted by the electric motor and controller is investigated without the fan being mounted. Finally, an acoustic treatment based on micro-perforated liners is presented to partly absorb the sound emissions.

4.1. Initial Campaign

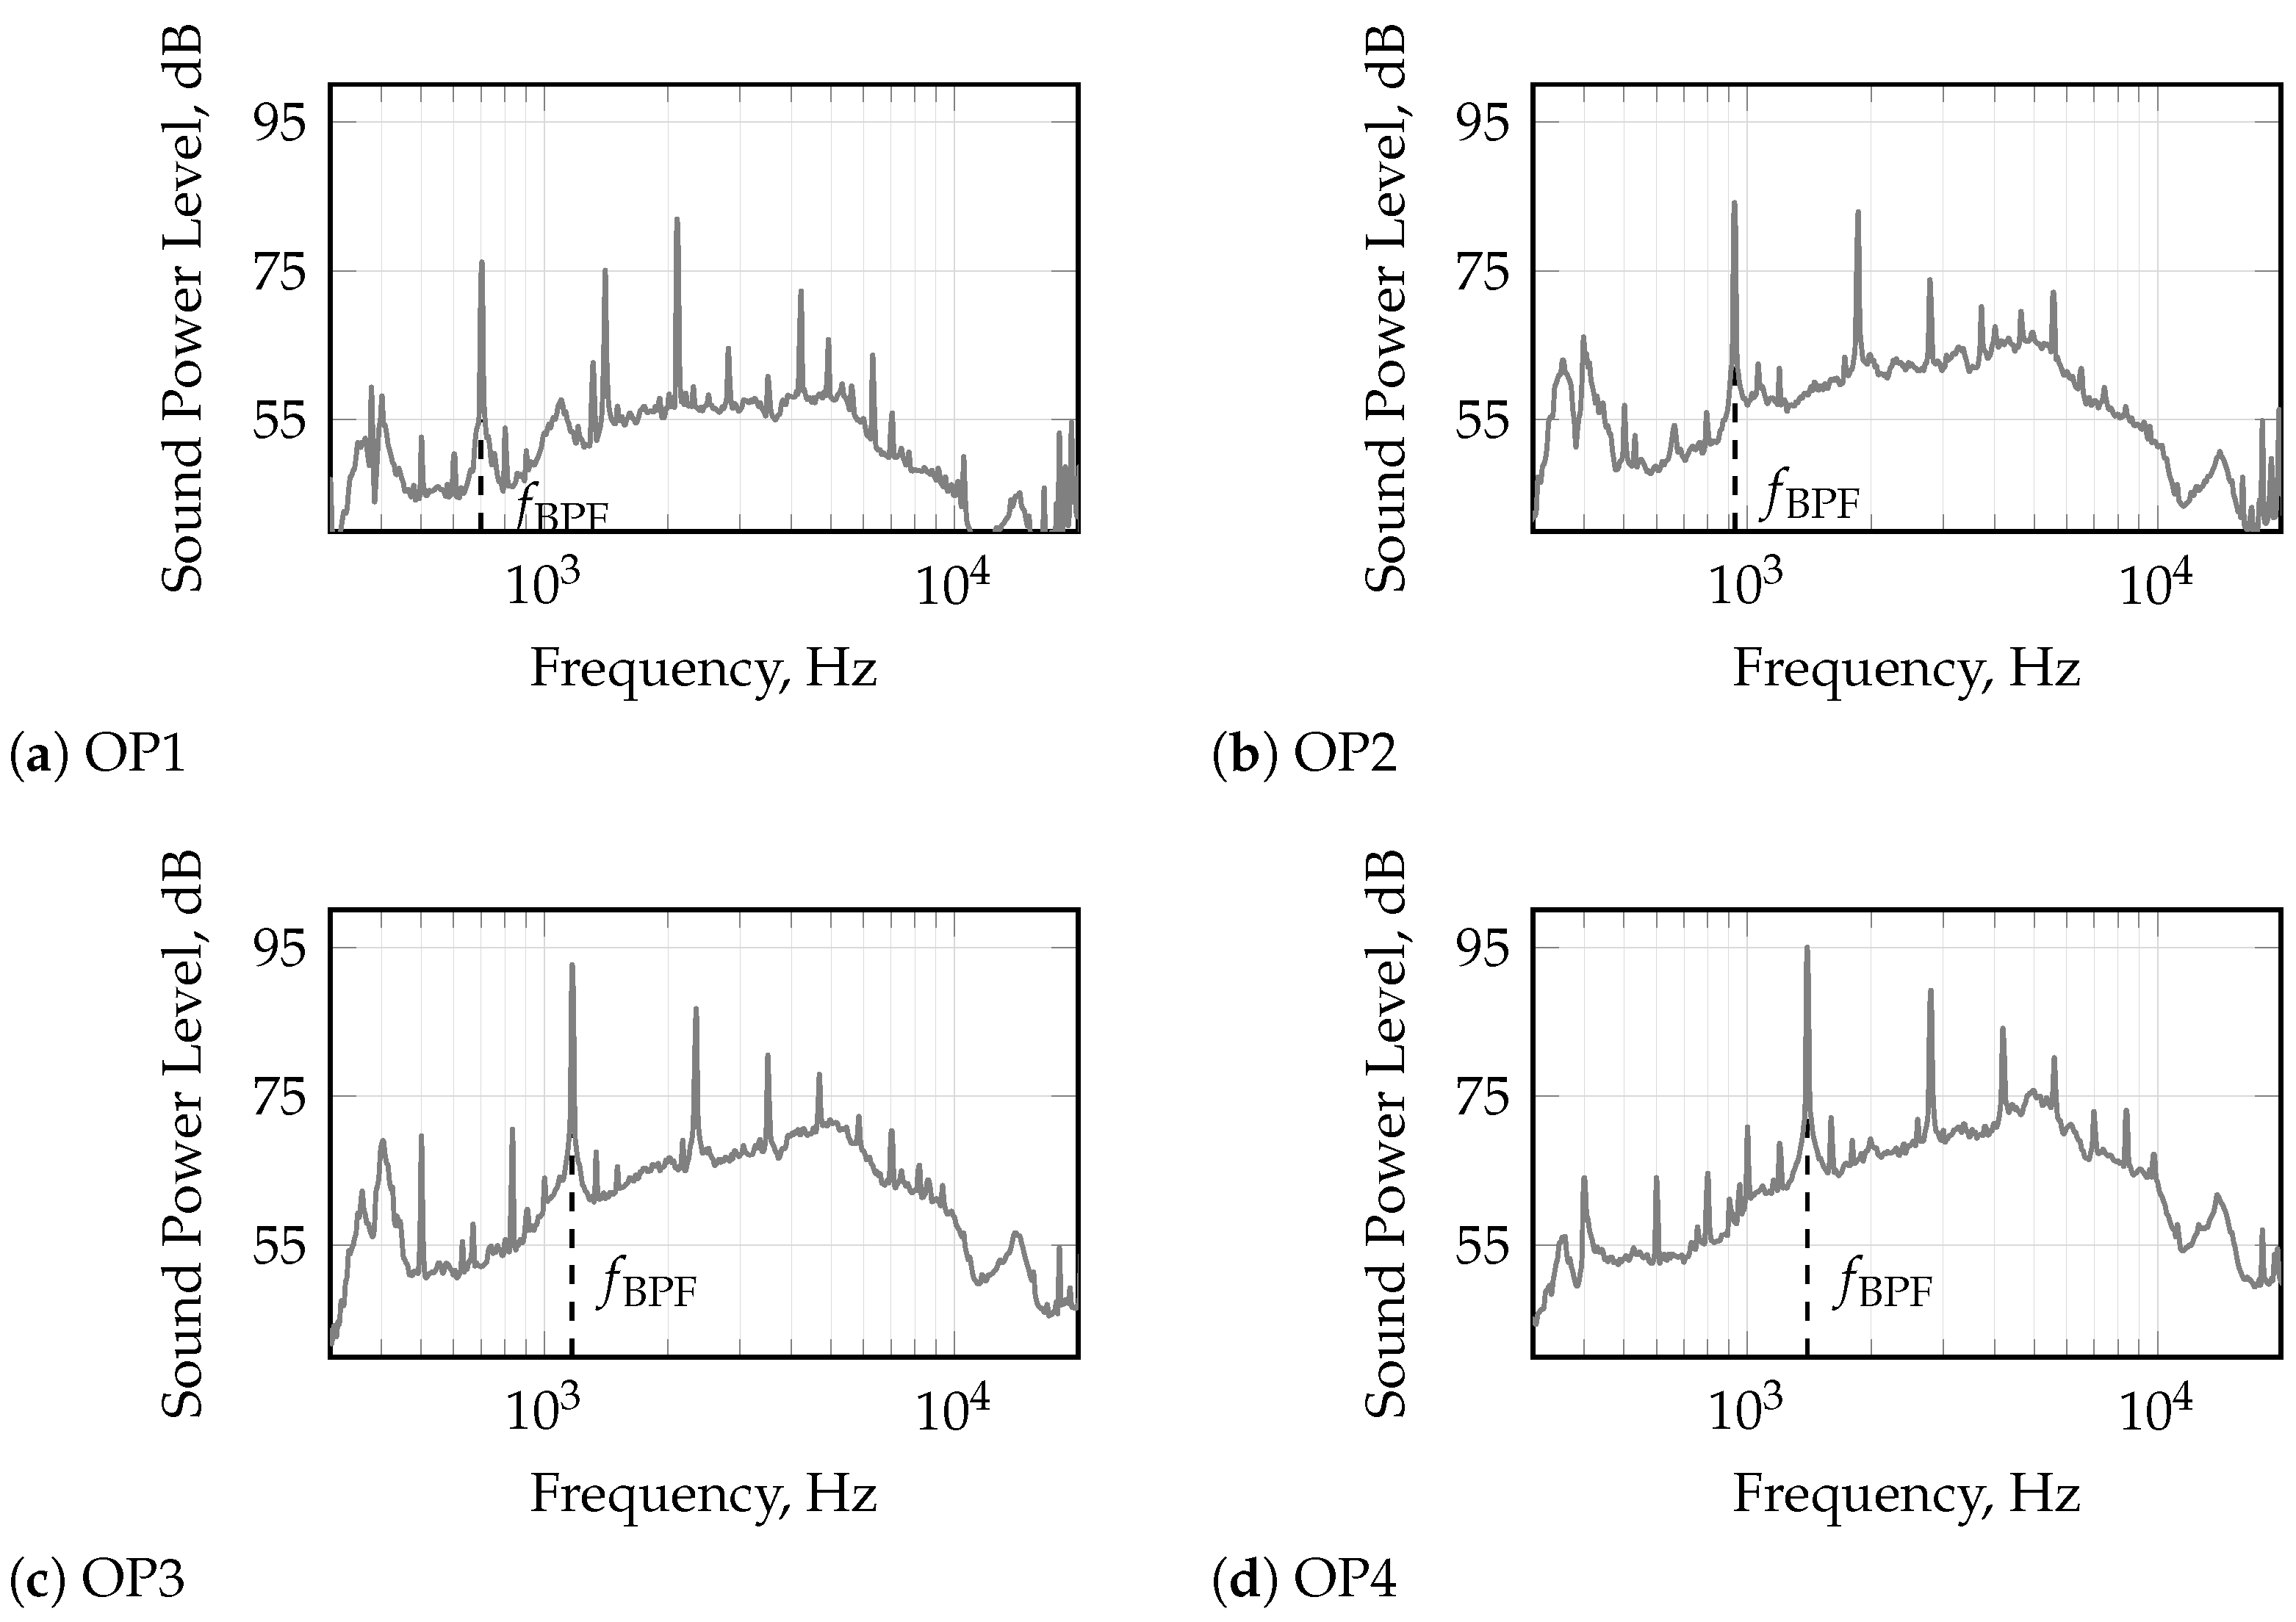
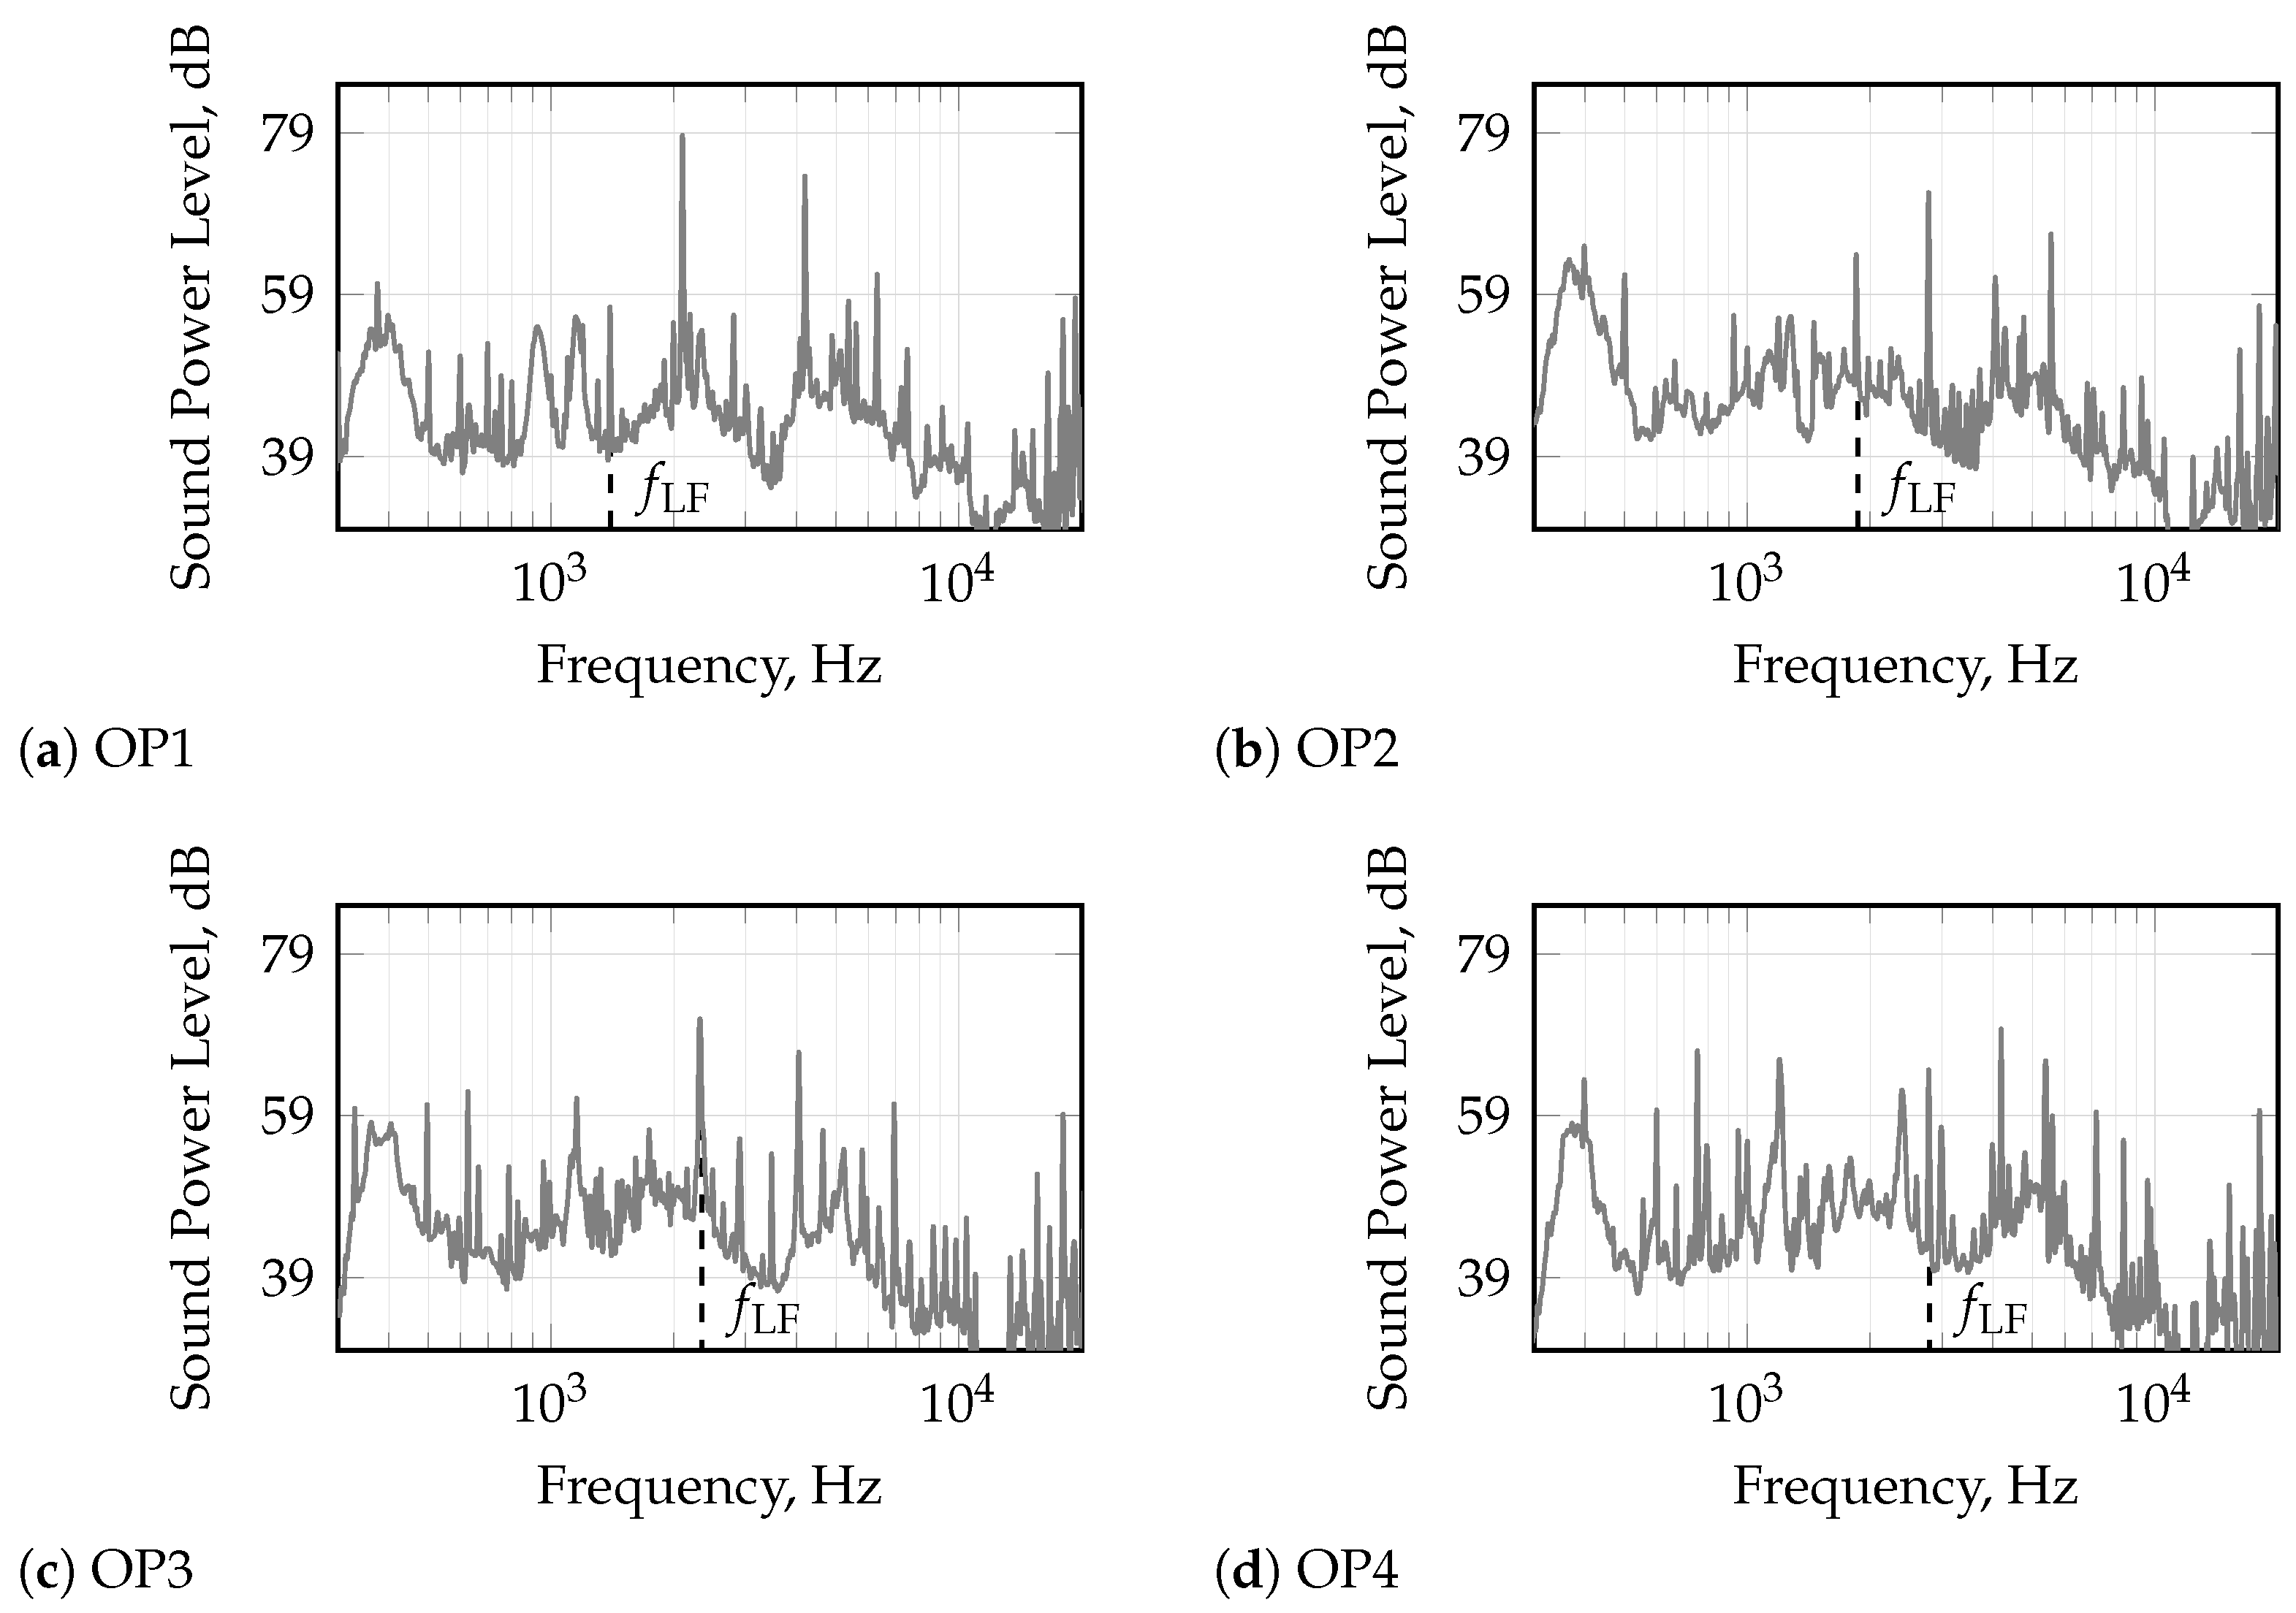
The measurements of the EDF were performed at four operating points and evaluated as narrowband-signals L W , A ¯ in Figure 7. The highest tonal sound power levels (SWLs) are at the BPF and its harmonics at all operating points. The primary acoustic source mechanism at the BPF is an aerodynamic effect. In contrast, the higher harmonic frequencies (e.g., first, third, fifth) of the BPF could result from the electric powertrain since the number of pole pairs coincides with the number of blades. At OP1, the highest tonal SWL is at the third harmonic frequency of the BPF at 2.1 kHz. This strong SWL at the third harmonic frequency could result from the matching excitation and the aerodynamic and electrodynamics forcing of the rotor structure. Literature suggests that this unusual amplification of the acoustic is possibly by a duct mode resonance [12,15]. Experimentally, these modes can be measured using a loudspeaker as a source inside the duct, driven at a specific frequency, and evaluating the sound emissions characteristics and directivity without flow. The duct mode was confirmed by a 2D eigenmode simulation [63] using openCFS [64] and the influence of the flow was corrected according to [65]. Furthermore, it is noteworthy is that at OP1, a hump between the BPF and the first harmonic occurs.
High broadband components of the SWLs occur between 4 and 6 kHz and grow in magnitude with increasing rotational speed. In [30], it is shown that both tip noise and boundary layer noise contribute to the broadband noise emissions of axial fans.
The high arrowband components of the frequency spectrum range from 350 Hz to 450 Hz. They do not change in their frequency with increasing rotational speed. One hypothesis for the noise mechanism of those low-frequent narrowband components can be acoustic resonances of the electric motor cavity because those narrowband components have also been detected in the subsequent measurements of the EDF’s electric powertrain. Additionally, acoustic resonances of this kind have already been detected in [41]. An accompanying acoustic simulation confirmed that this hump is a duct mode.
Frequency components at 15 kHz do not depend on the rotational speed and are most likely caused by the transistor operations of the electronic motor controller to achieve the electric phase commutation [27,28]. This base frequency of the switching noise is the typical acoustic signature of an electric powertrain.
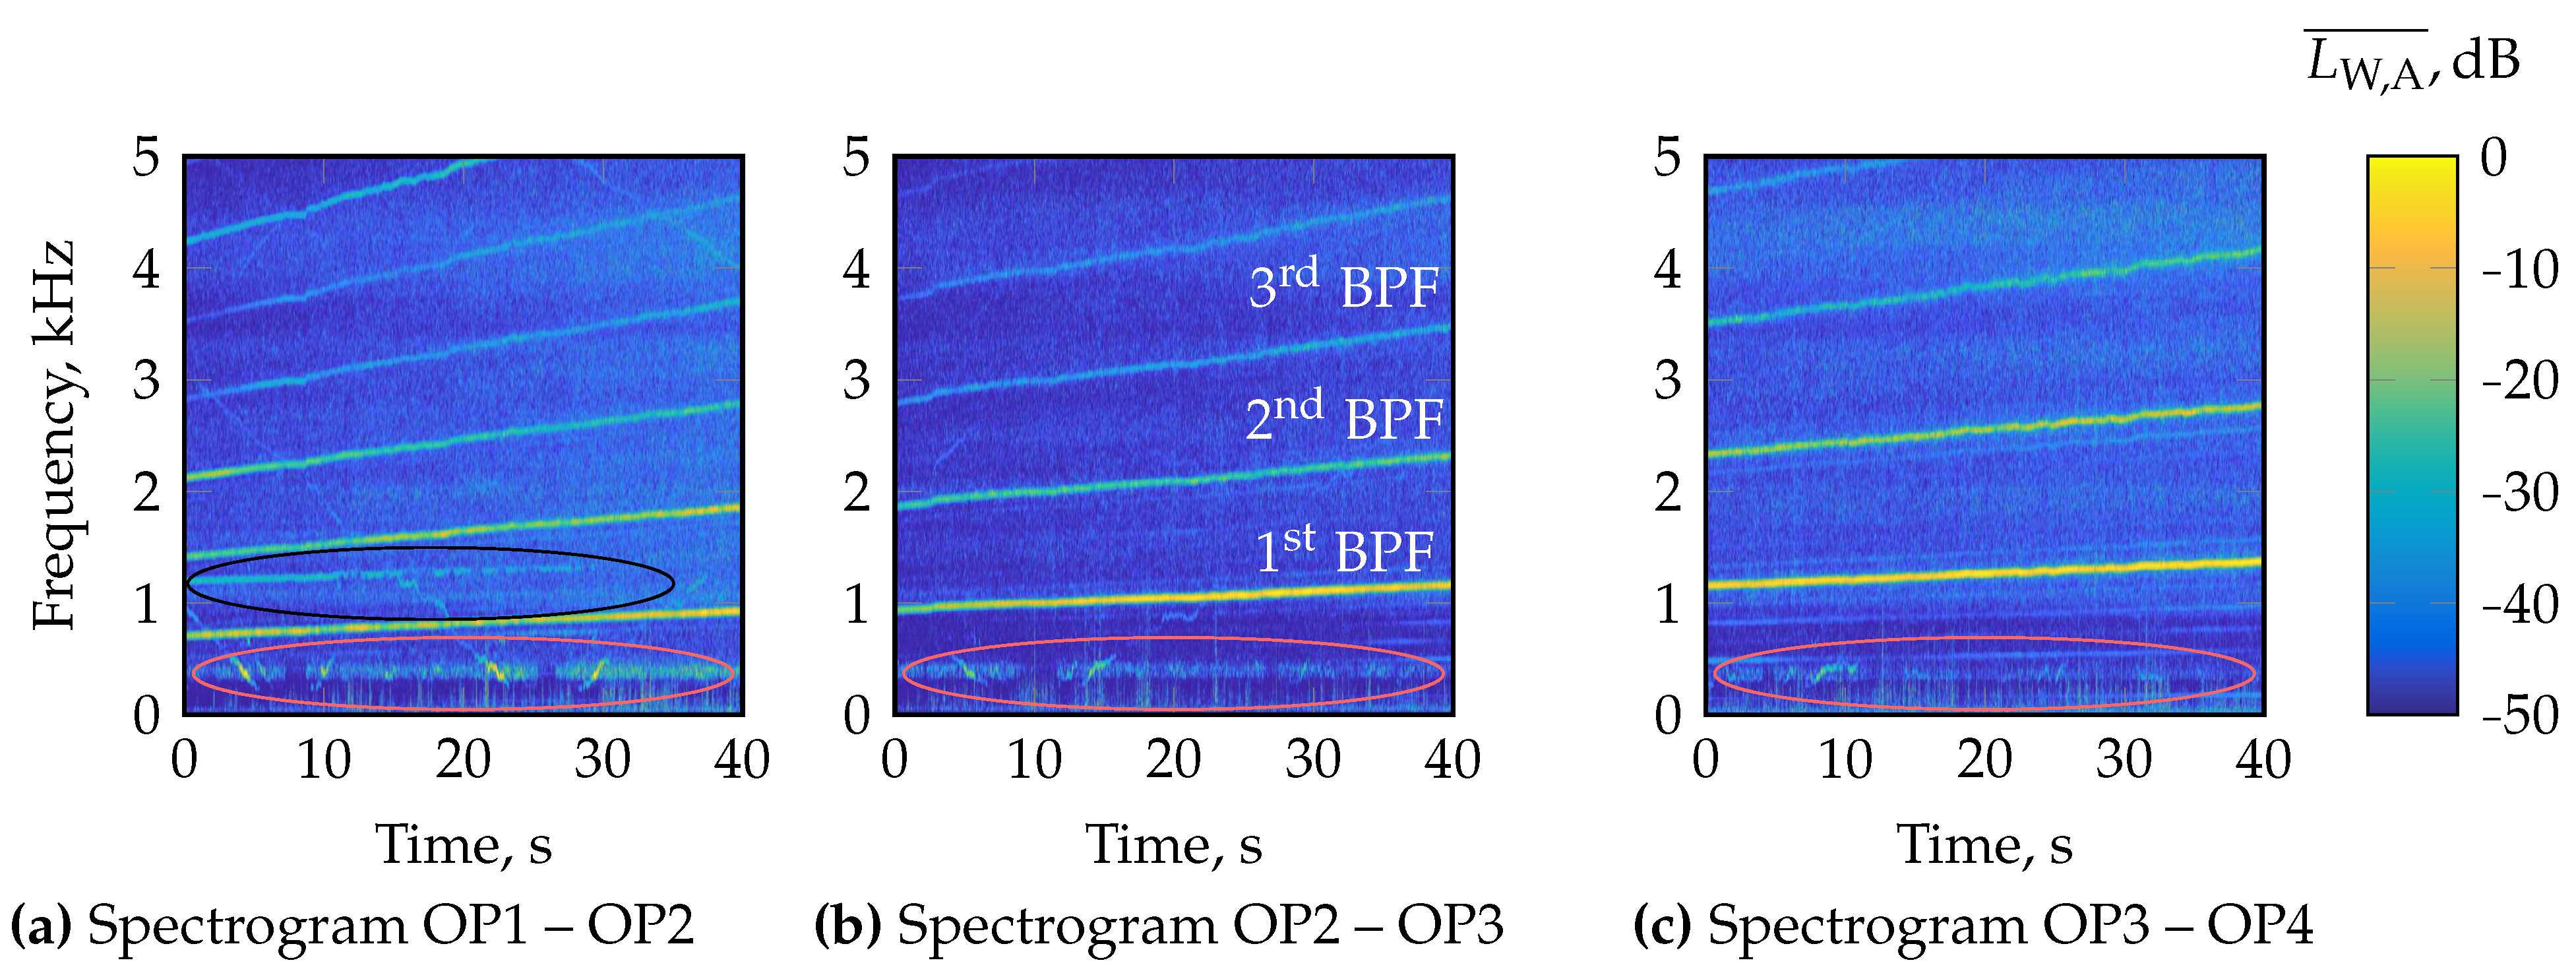
Additional experiments of the EDF unit’s SWL were performed as transient run-ups with a constant speed increase. The speed increase was sufficiently low with respect to the investigated noise emission frequency content to ensure quasi-steady states during the run-ups. Measurements between the neighboring operating points took 40 s using the setup as presented for the four stationary operation point experiments. Figure 8 shows the BPF and its harmonics as linearly increasing high SWL lines. This confirms the presence of aerodynamic sources at the BPF and its harmonics in the form of a rotor and a rotor–stator interaction.
As already recognized in Figure 7 and confirmed by the results depicted in Figure 8, the narrowband SWL hump between 350 Hz and 450 Hz (encircled in red) is independent of the operating conditions. Between OP1 and OP4, repeating artifacts are visible that linearly depend on the rotational speed piecewise [27,28]. Those artifacts are most visible in Figure 8a,b at about 400 Hz as linearly decreasing with the rotational speed, vanishing, and as the rotational speed increases, further linearly increasing again. Four of those characteristics are identified between OP1 and OP3. The first occurs in Figure 8a, disappearing from 5 s to 10 s ; the second one occurs in Figure 8a between 23 s and 30 s ; the third one occurs in Figure 8b between 6 s and 13 s ; and the fourth one occurs in Figure 8c between 1 s and 8 s . A review of the literature [27,28] attributes this to the switching of the ECM.
At 1200 Hz, a speed-independent single tonal component (see Figure 8a) occurs. Its amplitude decays with increasing fan speed and completely disappears after 30 s . An aerodynamic resonance of the EDF unit can describe this behavior.
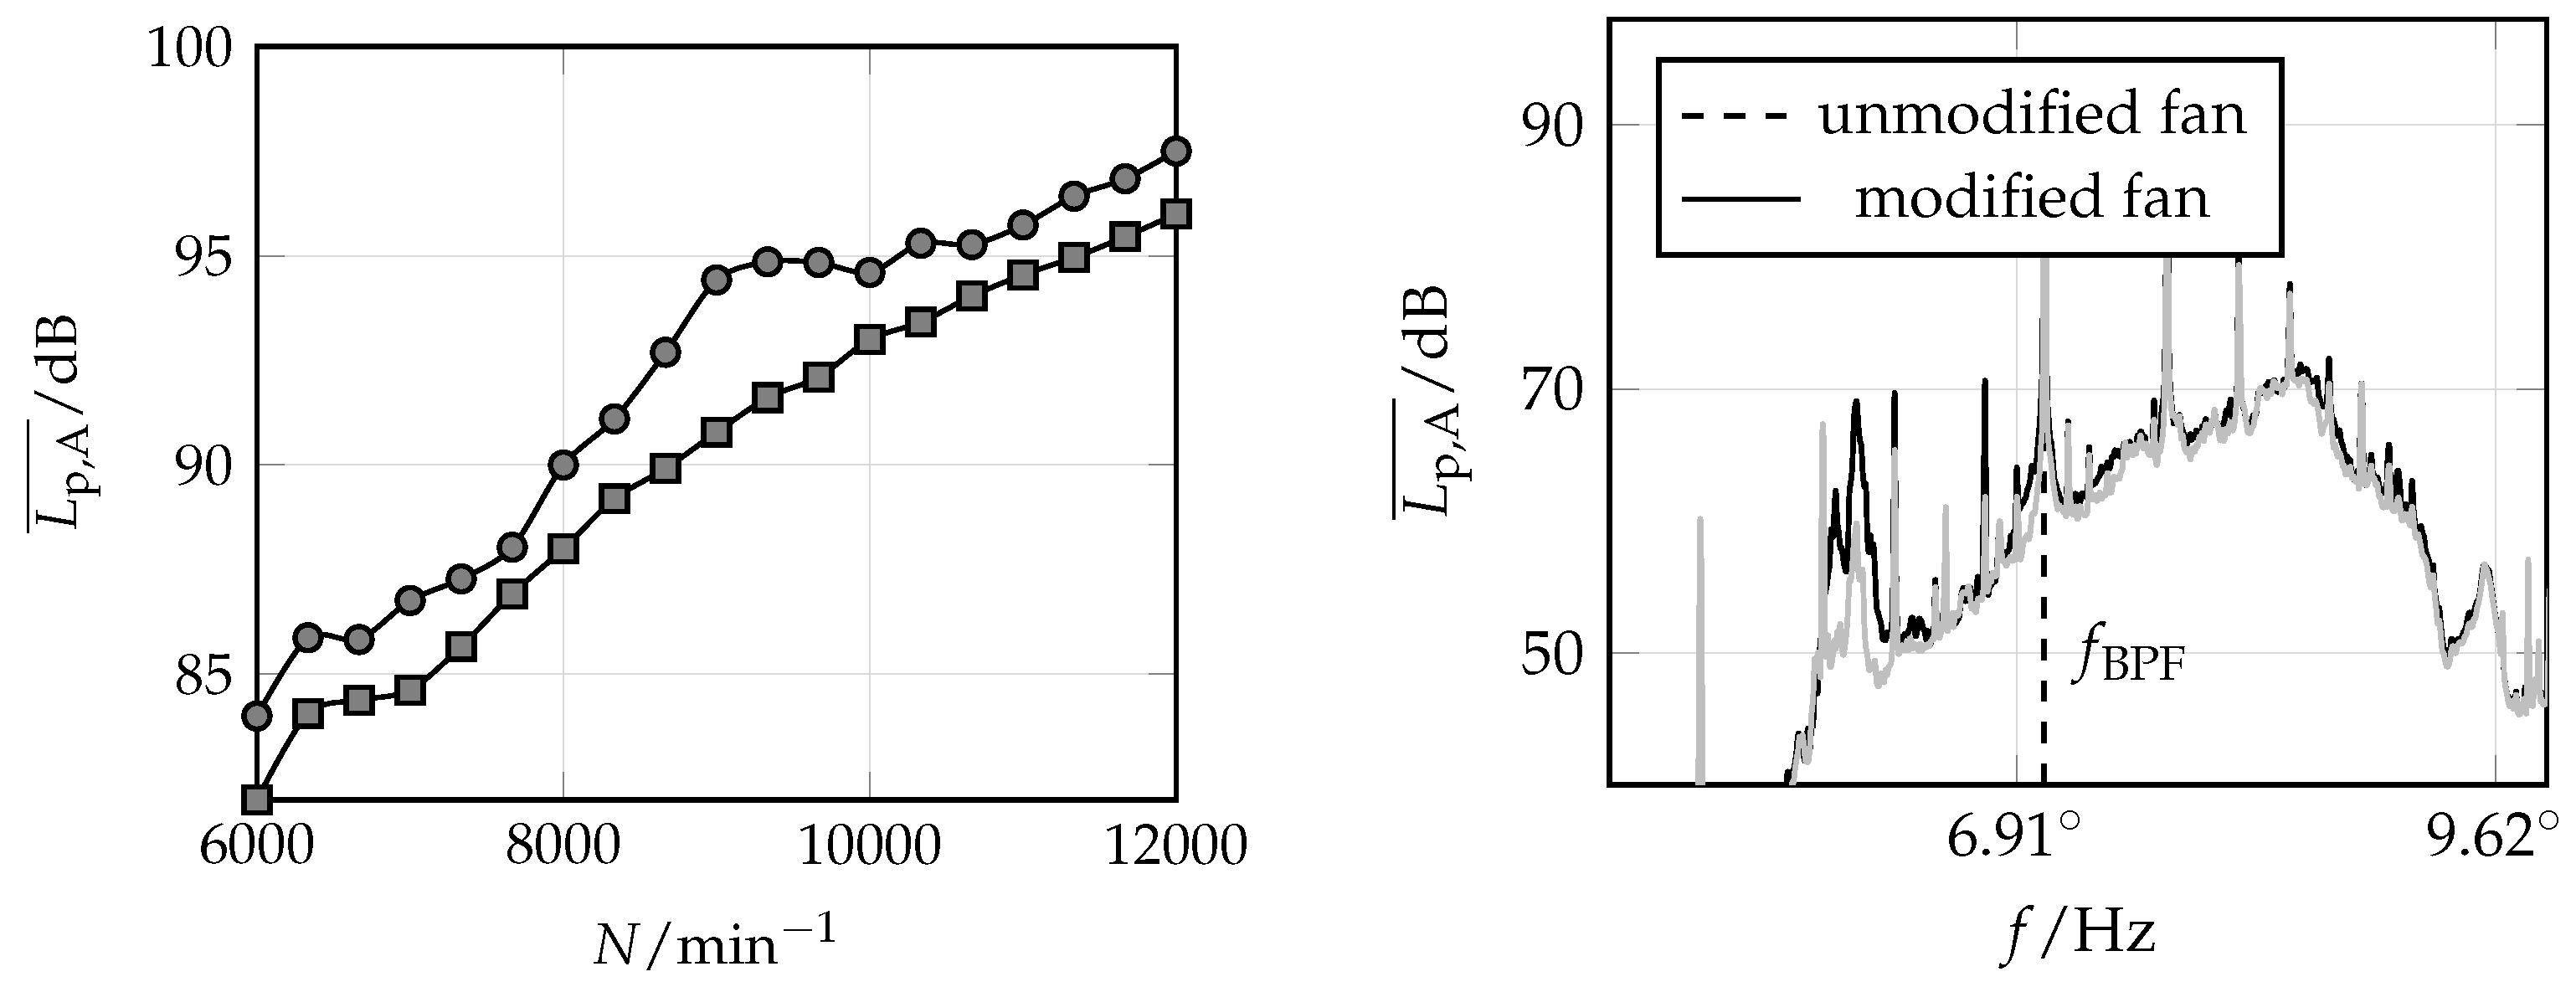
Finally, the reproducibility of the measurement was investigated by comparing the post-processed results of the two measurements in Figure 9. The difference between both measurement series was less than 1 dB over the whole operating range. Interestingly, specific humps occur at approximately 6300 and 9000 revolutions per minute in these data.
The two bumps can be explained by an amplification due to an acoustic resonance at approximately 2.1 kHz, which coincides with the third (at 6300 revolutions per minute) and second BPF (at 9000 revolutions per minute), respectively. In Figure 8, it can be seen that the resonant frequency is crossed between OP1-OP2 and OP2-OP3, respectively. As intended by the perforated liner design presented in the previous section, frequencies at approximately 2.1 kHz are absorbed and are an effective countermeasure to reduce this resonant effect occurring at 2.1 kHz.

4.2. Intermediate Conclusions

Based on these initial results, some odd dependencies of frequencies on the revolutions of the fan are questionable and may be further investigated. Firstly, a more in-depth investigation targets the switching noise of the electric motor and the EMC. Therefore, the electric powertrain is transiently investigated with a dismounted aerodynamic rotor. The same operating range was considered for this study.
Secondly, the explanation for the humps in Figure 9 and how they can be mitigated is of interest. The motor has 14 poles, which can interact with the seven blades’ rotor structure and overlap the second BPF with some electrodynamics excitation of the rotor structure. This coincidence has to be evaluated and might be a reason for the amplification of the third harmonics of the BPF, but it cannot explain the amplification of the second hump at 9000 revolutions in Figure 9 and therefore, we are confident that this is connected to an acoustic mode based on the preliminary data. Another possibility can be a structural mode of the duct. Any absorber placement inside the duct modulates the acoustic emissions by absorption and changes the structural modes of the duct by the updated geometry. Therefore, we will see an impact on these humps by the absorber placement.

4.3. Effects of the Electric Drive

Regarding the intermediate conclusion on the ECM noise, the fan was removed to detect the odd behavior of some noise emissions. Additionally, we investigated the proportion of the noise coming from the EDF electric powertrain without the fan’s influence. By dismounting the fan, the noise emissions of the electric powertrain can be studied, but no direct comparison with the previously presented setup is possible. In the case without load, the ECM’s internal currents and electromagnetic forces are significantly lower than in the loaded case. Therefore, we expect lower absolute SPL amplitudes for the components under load, which makes a direct comparison impossible. Nevertheless, a first insight can be gained into the relevant frequency content of the acoustic spectrum. Additionally, noise compensation based on physical considerations regarding the electric current would be possible by advanced countermeasures [27,28].
Figure 10 shows the SWL results of the measurement campaign at the considered operating points. The powertrain’s highest tonal noise emissions quantified at OP1 without load occur at 2.1 kHz. This coincides with the EDF unit’s third harmonic of the BPF. The electric powertrain in clogging torque characteristics is responsible for this tonal noise component. As mentioned, the amplification can also result from a structural or acoustic duct mode. The result further emphasizes that some natural frequency is present there. The highest recognized tonal SWLs of the electric components happened at multiples of the rotational motor speed, which supports the hypothesis of electromagnetic forces being an important noise generator to consider. Since the narrowband SWLs between 350 Hz and 450 Hz are also pronounced in this measurement study, an aerodynamic mechanism can be excluded as the origin of this noise. It is most likely that the acoustic duct mode is responsible for the modulation. In [41], an acoustic resonance of the motor’s internal airspace between its rotor and stator was causing these narrowband SWLs, independently of the rotational speed.
In OP1 of Figure 7, the highest tonal SWL exists at the third BPF harmonic (and at the first harmonic of the pole forces), indicating an unusual amplification of the acoustic and structural components by a natural frequency. At this frequency, the SWLs are pronounced when only considering the acoustic results of the electric powertrain. In this OP1, the electric powertrain emissions are associated with the first harmonic of the electrodynamic pole forces and are modulated by coincidence with the duct mode at 2.1 kHz.
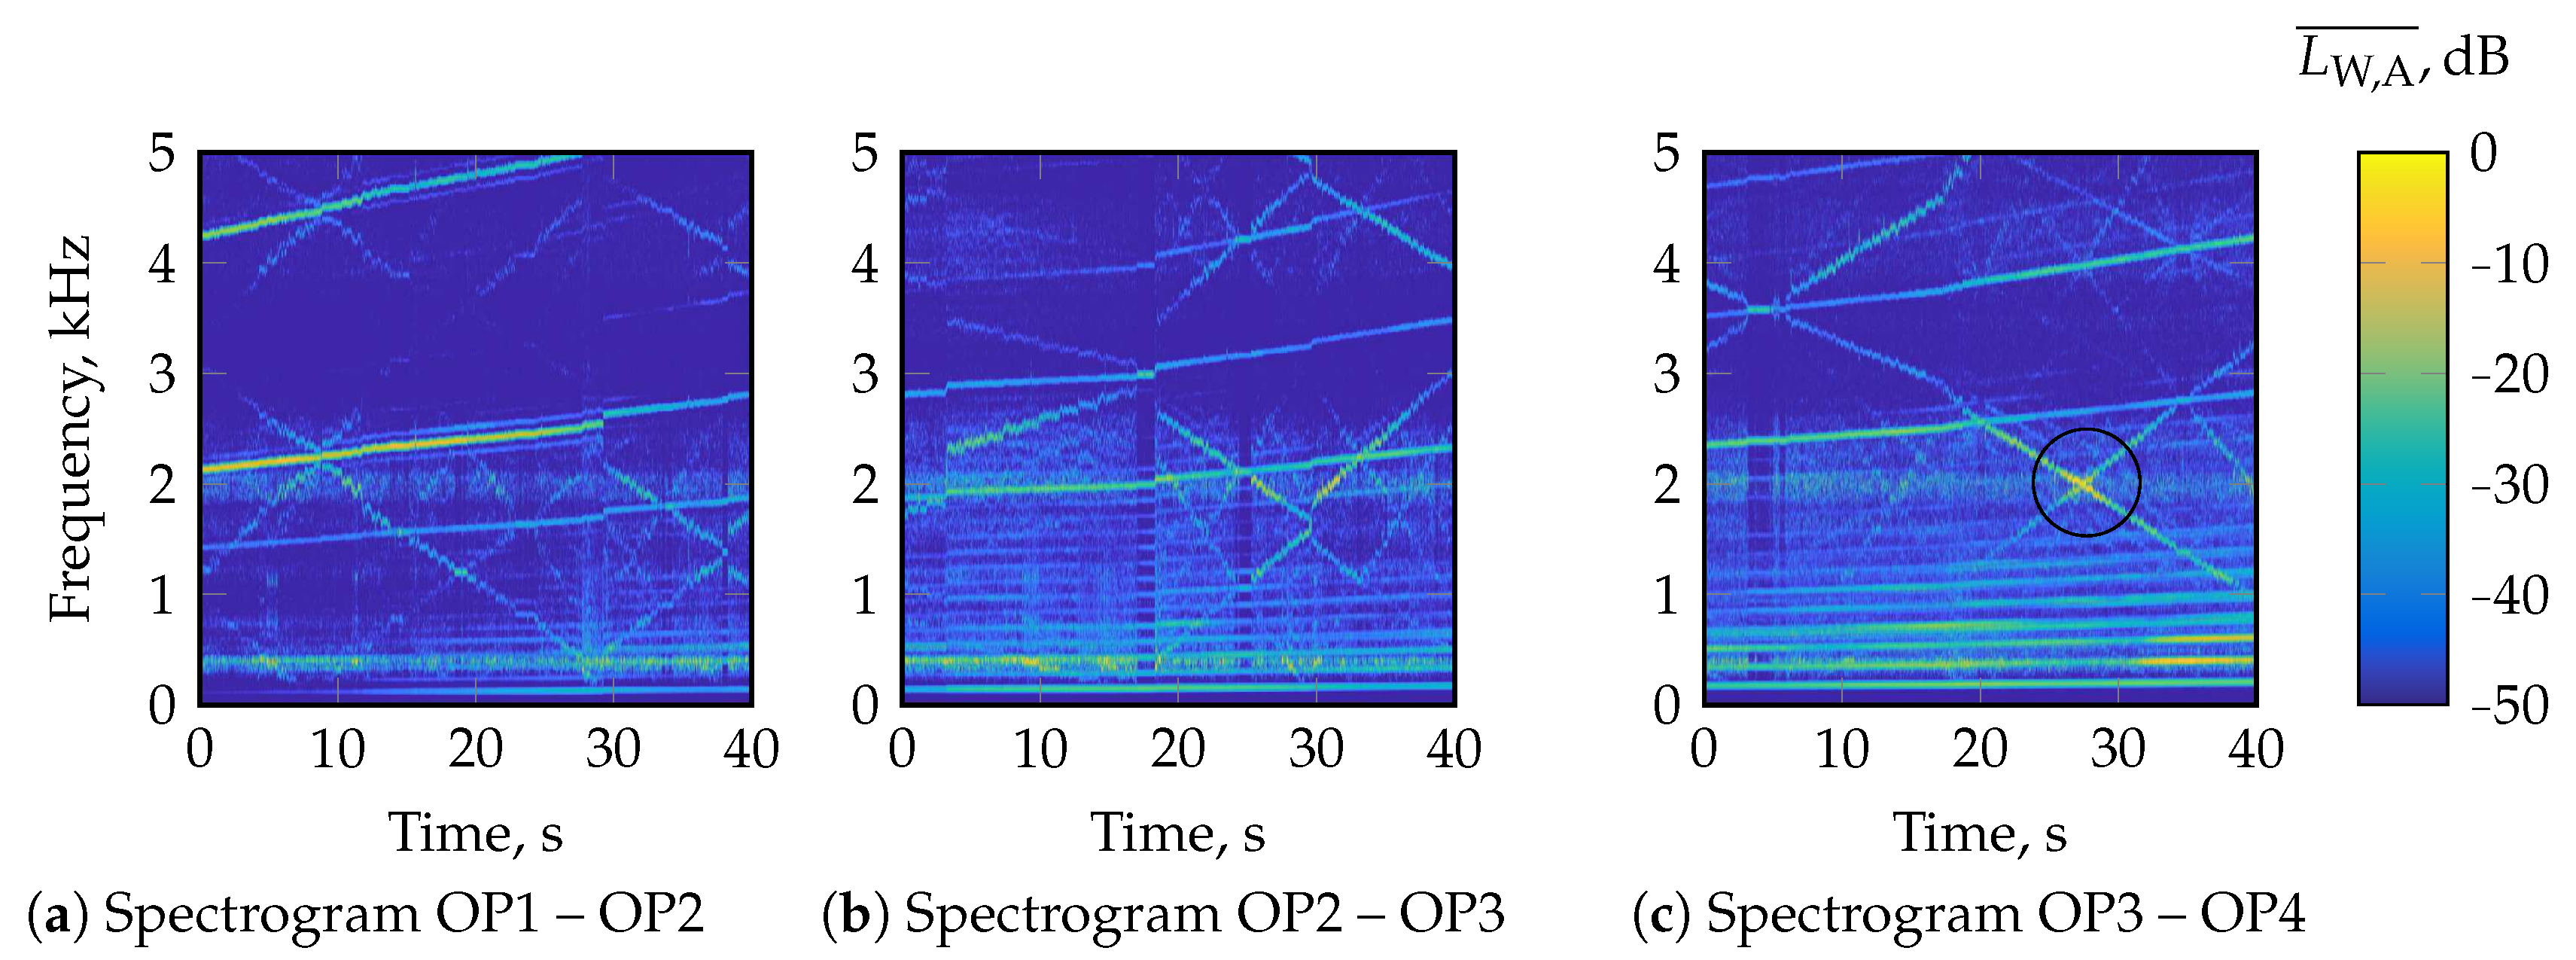
Run-up measurement studies for the operating range between OP1 and OP4 were carried out for the unloaded EDF unit. Figure 11 shows spectrograms to visualize the powertrain’s noise dependence on the motor speed. We observe in Figure 11 that difficulties in terms of controlling of the unloaded EDF unit occurred. As a result, the rotational speed was only block-constant across the entire operating range. Tonal noise components at the primary electromagnetic frequency f LF and their harmonics are notably visible by linearly increasing lines.
The previously discussed artifact is now more pronounced. Both increasing and decreasing frequency characteristics with increasing rotational speeds are observable in the measurement results. According to the literature [27,28], the electric drives’ commutation operating principle of the inverter is responsible for this noise characteristic. However, a closer examination of the electronic components reveals that cooling fin vibrations and the electric motor supply current need to be conducted to prove this hypothesis [28].
Another interesting aspect revealed by the data presented in Figure 11 is that a revolution-independent signature occurs at 2.1 kHz. As previously indicated for OP1, this overlaps with the electrodynamics forcing of the motor (as visible in Figure 11a). Furthermore, the 2.1 kHz modulation also amplifies the x-shaped characteristics of the electronics switching the motor currents at approximately 30 s between OP3 and OP4 in Figure 11c (encircled in black).

4.4. Effects of the Perforated Liner

Regarding the previous measurement campaigns and according to the description, the EDF unit design was modified by placing acoustic liners inside the duct. These micro-perforated liners were used to reduce the operating range’s emitted sound power overall, especially around 2.0 kHz. Based on the two design variants (unmodified and modified duct), the A-weighted overall sound power level (OSPL) was measured, computed, and compared (see Figure 12). The design of the micro-perforated liners was performed based on experience and without optimizing the position and the design concerning noise mitigation, the placement of the acoustic liners decreased the emitted noise over a broad operating range. The design was constructed in order to best absorb the acoustic energy around 2.0 kHz and 5.5 kHz. The influence on the humps at 2.1 kHz discussed in the analysis of Figure 9 was expected and is observable in Figure 12a. Exemplarily, for the narrowband SWL, the unmodified and the modified EDF unit are compared in Figure 12. A reduction in several dB is observable at the tonal components, with a more significant reduction at the second BPF, which is close to the first absorber design absorption maximum at 2.0 kHz. Accompanying spectrograms of the modified EDF unit are given in Figure 13.
As already explained, the small hump at 6300 revolutions in the A-weighted OSPL (see Figure 12) is an interrelation between the third harmonic of the BPF and the base frequency. A reduction in the hump is within the range of the overall reduction in the OSPL. It is noteworthy that the small maximum disappeared, which is attributed to the modulation of the resonance occurring at 2.1 kHz. At the second, more pronounced hump located at 9000 revolutions per minute, the A-weighted OSPL was significantly reduced by 4 dB(A). As indicated, this hump resulted from a resonance occurring at 2.1 kHz, effectively mitigated by the designed micro-perforated liner. Instead of the unmodified EDF unit, the modified EDF unit now has an expected behavior that the OSPL is monotonously and linearly increasing in the dB scale with increasing revolutions. Overall, the A-weighted OSPL was reduced by 2–4 dB across the total operating range of the EDF unit, whereas specific narrowband tonal frequencies more significantly decreased.
Finally, the reported subharmonic hump between 350 Hz and 450 Hz (marked in red) visible in Figure 8 vanished with the absorber treatment [5]. The comparison with Figure 8 reveals that the third and fourth harmonic of the BPF are reduced.

5. Conclusions and Suggestions

In this acoustic measurement campaign for early prototyping, we showed how reliable results could be achieved within a limited budget and timeframe. The study of the EDF unit’s noise emissions in the investigated operating range has shown expected tonal components at the BPF and its harmonics. Aerodynamic reasons caused the highest measured sound power levels. An unexpected excitation and duct mode frequency match caused specific humps on the overall sound power level measurements.
In contrast, minor sound power level characteristics in the spectrogram could be attributed to the electric powertrain and its components. The fundamental frequency of the ECM’s electromagnetic forces caused tonal noise emissions of the electric powertrain with a dismounted axial fan. X-shaped dependence on the rotational speed of tonal noise emissions in spectrograms was found for the transient measurements of the electric powertrain. The behavior was assigned to the switching currents of the electric powertrain. Regarding the measurement results of the electric powertrain in contrast to the entire EDF unit, a study using an artificial load to account for the original fan load would be interesting to make the results comparable. Furthermore, the next measurement campaign is motivated to adjust the test rig to analyze the electric powertrain’s effects. In the future, a detailed analysis of the electric powertrain would also involve the measurement of the individual single motor phases and currents supplied to the motor. These correlations could be drawn to better understand the powertrains’ noise emissions.
Given the EDF’s acoustic characteristics findings, perforated absorber linings were laid out to effectively absorb the sound pressure waves with the highest amplitude, which the BPF represents. After designing and manufacturing the absorber linings, the modified EDF was measured again and a resulting reduction in the SPL was noticed. The a-weighted OSPL was reduced by 2–4 dB across the EDF operating range, whereas the dominant BPF and the harmonics were attenuated by up to 10 dB. Having discussed what limitations apply to the affordable measurement campaign, gaining first insight in early prototyping is valuable and can be combined with more detailed computational [24,25,35,66] or experimental studies [30,46,67,68]. Simulations in combination with optimization can especially serve as a complementary noise reduction potential [69,70]. The value of the method was proven by identifying the EDF’s noise characteristics of an improved design version and lowering the overall noise signature by several dB across a wide operating range.

Author Contributions

Conceptualization, S.S. and R.K.; Methodology, S.S. and M.P.; Validation, J.S.; Formal analysis, J.S.; Investigation, J.S.; Data curation, J.S.; Writing—original draft, S.S., J.S., R.K. and M.P.; Writing—review & editing, A.F., R.K. and M.P.; Supervision, S.S. and A.F.; Project administration, S.S. and A.F.; Funding acquisition, S.S. and A.F. All authors have read and agreed to the published version of the manuscript.

Funding

Supported by TU Graz Open Access Publishing Fund. Open Access Funding by the Graz University of Technology.

Data Availability Statement

Restrictions apply to the availability of the dataset based on privacy and commercial interests of Volare GmbH.

Acknowledgments

Open Access Funding by the Graz University of Technology.

Conflicts of Interest

The authors declare no conflict of interest.

References

  1. ICAO. 2022 Environmental Report. 2022. Available online: https://www.icao.int/environmental-protection/Pages/envrep2022.aspx (accessed on 12 October 2022).
  2. WHO. Environmental Noise Guidelines for the European Region; World Health Organization—Regional Office for Europe: Copenhagen, Denmark, 2018. [Google Scholar]
  3. Pascioni, K.; Rizzi, S.A. Tonal noise prediction of a distributed propulsion unmanned aerial vehicle. In Proceedings of the 2018 AIAA/CEAS Aeroacoustics Conference, Atlanta, GA, USA, 25–29 June 2018; p. 2951. [Google Scholar] [CrossRef] [Green Version]
  4. Kim, H.D.; Perry, A.T.; Ansell, P.J. A review of distributed electric propulsion concepts for air vehicle technology. In Proceedings of the 2018 AIAA/IEEE Electric Aircraft Technologies Symposium (EATS), Cincinnati, OH, USA, 12–14 July 2018; IEEE: New York, NY, USA, 2018; pp. 1–21. [Google Scholar]
  5. Schmidt, J. Acoustic Optimisation of an Electric Ducted Fan Unit through Absorber Design and Placement. Ph.D. Thesis, Technical University of Vienna, Vienna, Austria, 2020. [Google Scholar] [CrossRef]
  6. Pereira, J.L. Hover and Wind-Tunnel Testing of Shrouded Rotors for Improved Micro Air Vehicle Design; University of Maryland: College Park, MD, USA, 2008. [Google Scholar]
  7. Raeisi, B. Aerodynamic Study of Tilting Asymmetrical Ducted Fans Mounted at the Wing Tips of a Vtol Uav. Ph.D. Thesis, Ryerson University, Toronto, ON, USA, 2016. [Google Scholar]
  8. Abrego, A.I.; Bulaga, R.W.; Rutkowski, M. Performance study of a ducted fan system. In Proceedings of the American Helicopter Society Aerodynamics, Acoustics and Test and Evaluation Technical Specialists Meeting, San Francisco, CA, USA, 23–25 January 2002. [Google Scholar]
  9. Rhee, W.; Myers, L.; McLaughlin, D. Aeroacoustics of vertical lift ducted rotors. In Proceedings of the 15th AIAA/CEAS Aeroacoustics Conference (30th AIAA Aeroacoustics Conference), Miami, FL, USA, 11–13 May 2009; p. 3333. [Google Scholar]
  10. Yilmaz, S.; Erdem, D.; Kavsaoglu, M.S. Performance of a ducted propeller designed for UAV applications at zero angle of attack flight: An experimental study. Aerosp. Sci. Technol. 2015, 45, 376–386. [Google Scholar] [CrossRef]
  11. Zhang, T.; Barakos, G.N. Review on ducted fans for compound rotorcraft. Aeronaut. J. 2020, 124, 941–974. [Google Scholar] [CrossRef]
  12. Malgoezar, A.M.; Vieira, A.; Snellen, M.; Simons, D.G.; Veldhuis, L.L. Experimental characterization of noise radiation from a ducted propeller of an unmanned aerial vehicle. Int. J. Aeroacoust. 2019, 18, 372–391. [Google Scholar] [CrossRef] [Green Version]
  13. Hall, C.A.; Crichton, D. Engine and installation configurations for a silent aircraft. ISABE 2005, 1164, 2005. [Google Scholar]
  14. Hileman, J.; Spakovszky, Z.; Drela, M.; Sargeant, M. Airframe design for “silent aircraft”. In Proceedings of the 45th AIAA Aerospace Sciences Meeting and Exhibit, Reno, NV, USA, 11 January 2007; p. 453. [Google Scholar]
  15. Weintraub, D.; Koppelberg, J.; Köhler, J.; Jeschke, P. Ducted fans for hybrid electric propulsion of small aircraft. CEAS Aeronaut. J. 2022, 13, 471–485. [Google Scholar] [CrossRef]
  16. Ko, A.; Ohanian, O.; Gelhausen, P. Ducted fan UAV modeling and simulation in preliminary design. In Proceedings of the AIAA Modeling and Simulation Technologies Conference and Exhibit, Hilton Head, SC, USA, 20–23 August 2007; p. 6375. [Google Scholar]
  17. Moore, M.D. Misconceptions of electric aircraft and their emerging aviation markets. In Proceedings of the 52nd Aerospace Sciences Meeting, National Harbor, MD, USA, 13–14 January 2014; p. 0535. [Google Scholar]
  18. Casagrande Hirono, F.; Torija Martinez, A.; Elliott, A.; Taylor, J.; Grimshaw, S.; Lefas, D. Aeroacoustic design and optimisation of an all-electric ducted fan propulsion module for low-noise impact. In Proceedings of the 28th AIAA/CEAS Aeroacoustics 2022 Conference, Southampton, UK, 14–17 June 2022; p. 3034. [Google Scholar]
  19. Rizzi, S.A.; Huff, D.L.; Boyd, D.D.; Bent, P.; Henderson, B.S.; Pascioni, K.A.; Sargent, D.C.; Josephson, D.L.; Marsan, M.; He, H.B.; et al. Urban Air Mobility Noise: Current Practice, Gaps, and Recommendations. Technical Report. 2020. Available online: https://ntrs.nasa.gov/citations/20205007433 (accessed on 26 November 2020).
  20. Schoder, S.; Schmidt, J.; Fürlinger, A.; Kaltenbacher, M. Quantification of the Acoustic Emissions of an Electric Ducted Fan Unit. In Proceedings of the 2022 Delft International Conference on Urban Air-Mobility: DICUAM 2022, Delft, The Netherlands; 2022. [Google Scholar]
  21. Darrah, D.; Eppler, J.; Liu, W.; Anemaat, W.A. Electric Ducted Fan Design and Testing for High Performance UAV Integration. In Proceedings of the AIAA Scitech 2020 Forum, Orlando, FL, USA, 31 January–4 February 2020; p. 0017. [Google Scholar]
  22. Schmidt, J.; Kaltenbacher, M.; Fürlinger, A.; Schoder, S. Experimental Characterization of an Electric Ducted Fan Unit’s Acoustic Emissions. In Proceedings of the AIAA AVIATION 2021 FORUM, Online, 2–6 August 2021; p. 2174. [Google Scholar]
  23. Smith, M.J.T. Aircraft Noise; Cambridge Aerospace Series; Cambridge University Press: Cambridge, UK, 1989. [Google Scholar] [CrossRef]
  24. Moreau, S. A review of turbomachinery noise: From analytical models to high-fidelity simulations. Fundamentals of High Lift for Future Civil Aircraft; Springer: Berlin/Heidelberg, Germany, 2021; pp. 579–595. [Google Scholar]
  25. Schoder, S.; Junger, C.; Kaltenbacher, M. Computational aeroacoustics of the EAA benchmark case of an axial fan. Acta Acust. 2020, 4, 22. [Google Scholar] [CrossRef]
  26. Vijayraghavan, P.; Krishnan, R. Noise in electric machines: A review. IEEE Trans. Ind. Appl. 1999, 35, 1007–1013. [Google Scholar] [CrossRef]
  27. Sarrazin, M.; Anthonis, J.; Van der Auweraer, H.; Martis, C.; Gyselinck, J. Signature analysis of switched reluctance and permanent magnet electric vehicle drives. In Proceedings of the 2014 International Conference on Electrical Machines (ICEM), Berlin, Germany, 2–5 September 2014; IEEE: New York, NY, USA, 2014; pp. 1831–1837. [Google Scholar]
  28. Fang, Y.; Zhang, T. Sound quality investigation and improvement of an electric powertrain for electric vehicles. IEEE Trans. Ind. Electron. 2017, 65, 1149–1157. [Google Scholar]
  29. DIN EN ISO 3744: 2011-02; Akustik—Bestimmung der Schallleistungs- und Schallenergiepegel von Geräuschquellen aus Schalldruckmessungen— Hüllflächenverfahren der Genauigkeitsklasse 2 für ein im Wesentlichen freies Schallfeld über einer reflektierenden Ebene (ISO 3744: 2010). Beuth-Verlag: Berlin, Germany, 2011.
  30. Krömer, F.J. Sound Emission of Low-Pressure Axial Fans under Distorted Inflow Conditions; FAU University Press: Boca Raton, FL, USA, 2018. [Google Scholar] [CrossRef]
  31. Bommes, L.; Fricke, J.; Grundmann, R. Blowers; Ventilatoren; Vulkan: Essen, Germany, 2003. [Google Scholar]
  32. Wright, S. The acoustic spectrum of axial flow machines. J. Sound Vib. 1976, 45, 165–223. [Google Scholar] [CrossRef]
  33. Moreau, S.; Roger, M.; Christophe, J. Flow features and self-noise of airfoils near stall or in stall. In Proceedings of the 15th AIAA/CEAS Aeroacoustics Conference (30th AIAA Aeroacoustics Conference), Miami, FL, USA, 11–13 May 2009; p. 3198. [Google Scholar]
  34. Czwielong, F.; Soldat, J.; Becker, S. On the interactions of the induced flow field of heat exchangers with axial fans. Exp. Therm. Fluid Sci. 2022, 139, 110697. [Google Scholar]
  35. Moreau, S.; Sanjose, M. Sub-harmonic broadband humps and tip noise in low-speed ring fans. J. Acoust. Soc. Am. 2016, 139, 118–127. [Google Scholar] [CrossRef]
  36. Blake, W.K. Mechanics of flow-induced sound and vibration. Volume 1 General concepts and elementary source. Volume 2-Complex flow-structure interactions. Apl. Mat. Appl. Math. 1986, 1, 457. [Google Scholar]
  37. Tyler, J.M.; Sofrin, T.G. Axial Flow Compressor Noise Studies; SAE Technical Paper. 1962. Available online: https://saemobilus.sae.org/content/620532/ (accessed on 4 March 2023).
  38. Griffiths, J. The spectrum of compressor noise of a jet engine. J. Sound Vib. 1964, 1, 127–140. [Google Scholar] [CrossRef]
  39. Gieras, J.F.; Wang, C.; Lai, J.C. Noise of Polyphase Electric Motors; CRC Press: Boca Raton, FL, USA, 2018. [Google Scholar] [CrossRef]
  40. Ko, H.S.; Kim, K.J. Characterization of noise and vibration sources in interior permanent-magnet brushless DC motors. IEEE Trans. Magn. 2004, 40, 3482–3489. [Google Scholar] [CrossRef]
  41. Lee, H.J.; Chung, S.U.; Hwang, S.M. Noise source identification of a BLDC motor. J. Mech. Sci. Technol. 2008, 22, 708–713. [Google Scholar] [CrossRef]
  42. Pindoriya, R.; Mishra, A.; Rajpurohit, B.; Kumar, R. An analysis of vibration and acoustic noise of BLDC motor drive. In Proceedings of the 2018 IEEE Power & Energy Society General Meeting (PESGM), Portland, OR, USA, 5–10 August 2018; IEEE: New York, NY, USA, 2018; pp. 1–5. [Google Scholar] [CrossRef]
  43. Neise, W.; Michel, U. Aerodynamic noise of turbomachines; Deutsche Forschungsanstalt für Luft-und Raumfahrt, eV, DLR; Institut für Strömungsmechanik; Abt. Turbulenzforschung: Berlin, Germany, 1994; Volume 5. [Google Scholar]
  44. Hubbard, H.; Lansing, D.; Runyan, H. A review of rotating blade noise technology. J. Sound Vib. 1971, 19, 227–249. [Google Scholar] [CrossRef]
  45. Trematerra, A.; Bevilacqua, A.; Iannace, G. Noise Control in Air Mechanical Ventilation Systems with Three-Dimensional Metamaterials. Appl. Sci. 2023, 13, 1650. [Google Scholar] [CrossRef]
  46. Czwielong, F.; Floss, S.; Kaltenbacher, M.; Becker, S. Influence of a micro-perforated duct absorber on sound emission and performance of axial fans. Appl. Acoust. 2021, 174, 107746. [Google Scholar] [CrossRef]
  47. Copeland, W.; Crigler, J. Experimental noise studies of inlet-guide-vane rotor-stator interactions for a single-stage axial-flow compressor. J. Acoust. Soc. Am. 1965, 38, 920. [Google Scholar]
  48. Krömer, F.; Czwielong, F.; Becker, S. Experimental investigation of the sound emission of skewed axial fans with leading-edge serrations. AIAA J. 2019, 57, 5182–5196. [Google Scholar] [CrossRef]
  49. Krömer, F.J.; Moreau, S.; Becker, S. Experimental investigation of the interplay between the sound field and the flow field in skewed low-pressure axial fans. J. Sound Vib. 2019, 442, 220–236. [Google Scholar] [CrossRef]
  50. FTEU. MASH—Faserfreie Schalldämpfung. 2023. Available online: https://fteu.de/technologie/mash/ (accessed on 20 March 2023).
  51. Floss, S. Minderung von Schallausbreitung durch Mikroperforierte Absorber in unterschiedlichen Schallfeldarten-Design und Evaluierung. Ph.D. Thesis, Institute for Mechanics and Mechatronics, Vienna, Austria, 2022. [Google Scholar] [CrossRef]
  52. Jaouen, L.; Bécot, F.X. Acoustical characterization of perforated facings. J. Acoust. Soc. Am. 2011, 129, 1400–1406. [Google Scholar] [CrossRef] [PubMed] [Green Version]
  53. Liu, J.; Herrin, D. Enhancing micro-perforated panel attenuation by partitioning the adjoining cavity. Appl. Acoust. 2010, 71, 120–127. [Google Scholar] [CrossRef]
  54. DIN EN ISO 3745:2017-10; Acoustics—Determination of Sound Power Levels and Sound Energy Levels of Noise Sources Using Sound Pressure—Precision Methods for Anechoic Rooms and Hemi-Anechoic Rooms (ISO 3745:2012 + Amd 1:2017). Beuth-Verlag: Berlin, Germany, 2017.
  55. Papa, U.; Iannace, G.; Del Core, G.; Giordano, G. Sound power level and sound pressure level characterization of a small unmanned aircraft system during flight operations. Noise Vib. Worldw. 2017, 48, 67–74. [Google Scholar] [CrossRef]
  56. Iannace, G.; Ciaburro, G.; Trematerra, A. Fault diagnosis for UAV blades using artificial neural network. Robotics 2019, 8, 59. [Google Scholar] [CrossRef] [Green Version]
  57. ISO 26101:2017-04; Acoustics—Test Methods for the Qualification of Free-Field Environments. Beuth-Verlag: Berlin, Germany, 2017.
  58. DIN EN 61260-1:2014-10; Electroacoustics—Octave-Band and Fractional-Octave-Band Filters—Part 1: Specifications (IEC 61260-1:2014). Beuth-Verlag: Berlin, Germany, 2014.
  59. Gombots, S. Acoustic Source Localization at Low Frequencies Using Microphone Arrays. Ph.D. Thesis, Technical University of Vienna, Vienna, Austria, 2020. [Google Scholar]
  60. Feiler, C.; Groeneweg, J. Summary of forward velocity effects on fan noise. In Proceedings of the 4th Aeroacoustics Conference, Atlanta, GA, USA, 3–5 October 1977; p. 1319. [Google Scholar]
  61. Groeneweg, J.; Rice, E. Aircraft turbofan noise. J. Turbomach. 1987, 109, 130–141. [Google Scholar] [CrossRef]
  62. Royce, R. The Jet Engine; John Wiley & Sons: Hoboken, NJ, USA, 2015. [Google Scholar]
  63. Maurerlehner, P.; Schoder, S.; Tieber, J.; Freidhager, C.; Steiner, H.; Brenn, G.; Schäfer, K.H.; Ennemoser, A.; Kaltenbacher, M. Aeroacoustic formulations for confined flows based on incompressible flow data. Acta Acust. 2022, 6, 45. [Google Scholar] [CrossRef]
  64. Schoder, S.; Roppert, K. openCFS: Open Source Finite Element Software for Coupled Field Simulation–Part Acoustics. arXiv 2022, arXiv:2207.04443. [Google Scholar]
  65. Broatch, A.; García-Tíscar, J.; Roig, F.; Sharma, S. Dynamic mode decomposition of the acoustic field in radial compressors. Aerosp. Sci. Technol. 2019, 90, 388–400. [Google Scholar] [CrossRef]
  66. Schoder, S.; Kaltenbacher, M. Hybrid aeroacoustic computations: State of art and new achievements. J. Theor. Comput. Acoust. 2019, 27, 1950020. [Google Scholar] [CrossRef]
  67. Czwielong, F.; Floss, S.; Kaltenbacher, M.; Becker, S. Sound reduction in heat exchanger modules by integrating plate absorbers with sub-millimeter openings. Acta Acust. 2021, 5, 35. [Google Scholar] [CrossRef]
  68. Floss, S.; Czwielong, F.; Kaltenbacher, M.; Becker, S. Design of an in-duct micro-perforated panel absorber for axial fan noise attenuation. Acta Acust. 2021, 5, 24. [Google Scholar] [CrossRef]
  69. Kim, J.H.; Ovgor, B.; Cha, K.H.; Kim, J.H.; Lee, S.; Kim, K.Y. Optimization of the aerodynamic and aeroacoustic performance of an axial-flow fan. AIAA J. 2014, 52, 2032–2044. [Google Scholar] [CrossRef]
  70. Tieghi, L.; Becker, S.; Corsini, A.; Delibra, G.; Schoder, S.; Czwielong, F. Machine-learning clustering methods applied to detection of noise sources in low-speed axial fan. J. Eng. Gas Turbines Power 2023, 145, 031020. [Google Scholar] [CrossRef]
Figure 1. The visualization of components in a typical single-stage axial-flow EDF unit. Adapted from [5].
Fluids 08 00116 g001
Figure 2. The device under test during the measurement campaign (right) is one fan of the propulsion assemblies, which are arranged left and right of the fuselage of the APELEON X1 (left).
Fluids 08 00116 g002
Figure 3. Visualization of potential noise reduction measures at an EDF unit.
Fluids 08 00116 g003
Figure 4. Design and placement of absorber linings: (a) placement in EDF; and (b) design of the micro-perforated absorber (MPA).
Fluids 08 00116 g004
Figure 5. Visualization of the microphone positions for the measurements relative to the propulsion test stand. The numbers in the figure describe the positions where a microphone is placed.
Fluids 08 00116 g005
Figure 6. Setup and spatial dimensions of the experimental facility and positioning of the EDF unit on a propulsion test bench inside the measuring room. Adapted from [5].
Fluids 08 00116 g006
Figure 7. Narrowband L W , A ¯ at different operating points relative to the highest narrowband sound power level in the observed operating range.
Fluids 08 00116 g007
Figure 8. L W , A ¯ of the EDF unit, run between neighboring operating points. The scale is selected relative to the highest sound power level in the respective measurement range. The black and red circle mark detailed characteristics in the spectrograms.
Fluids 08 00116 g008
Figure 9. A weighted OSPL of unmodified EDF unit over the operating range.
Fluids 08 00116 g009
Figure 10. Narrowband L W , A ¯ of the electric powertrain with a dismounted axial fan stage operated at four operating points.
Fluids 08 00116 g010
Figure 11. L W , A ¯ of the electric powertrain between neighboring operating points relative to the highest sound power level in the respective measurement range. The black circle marks a detail of a crossing characteristic in the spectrogram.
Fluids 08 00116 g011
Figure 12. A weighted OSPL over an operating range of unmodified (•) and modified () and the narrowband L W , A ¯ of the EDF unit at OP3 with unmodified configuration in black and the modified configuration in gray. We attempt to compare the detailed spectra at approximately 9000 Hz, OP2, and 3 (shown here) at 8000 and 10,000 Hz. Comparing these 3 conditions to determine what might explain the reduction of more 4 dB rather than the usual 2 dB.
Fluids 08 00116 g012
Figure 13. LW,A of the modified EDF unit between neighboring operating points relative to the highest sound power level in the respective measurement range. The black and red circle mark detailed characteristics in the spectrograms.
Fluids 08 00116 g013
Table 1. Aeroacoustic sources and characteristics in axial fans associated with the rotor, adapted from [5,30,31,32,33]. The marker ▪ describes the occurrence of a mechanism.
Fluids 08 00116 i001
Table 2. Acoustic sources and characteristics in axial fans associated with the electric powertrain [5]. The marker ▪ describes the occurrence of a mechanism.
Fluids 08 00116 i002
Disclaimer/Publisher’s Note: The statements, opinions and data contained in all publications are solely those of the individual author(s) and contributor(s) and not of MDPI and/or the editor(s). MDPI and/or the editor(s) disclaim responsibility for any injury to people or property resulting from any ideas, methods, instructions or products referred to in the content.