Article

Experimental Studies on Vortex-Induced Vibration of a Piggyback Pipeline

1
School of Engineering, The University of Western Australia, 35 Stirling Highway, Crawley, WA 6009, Australia
2
College of Logistics Engineering, Shanghai Maritime University, Shanghai 201306, China
3
State Key Laboratory of Oil and Gas Reservoir Geology and Exploitation, Southwest Petroleum University, Chengdu 610500, China
*
Author to whom correspondence should be addressed.
Fluids 2024, 9(2), 39; https://doi.org/10.3390/fluids9020039
Submission received: 29 October 2023 / Revised: 15 January 2024 / Accepted: 29 January 2024 / Published: 1 February 2024
(This article belongs to the Special Issue Vortical Flows in Memory of Professor Ippolit Stepanovich Gromeka)

Abstract

:
Offshore pipelines of different diameters are often seen in piggyback arrangements in close proximity. Under the effects of external flows, the pipelines may experience vibration. Reliable prediction of the vibration amplitudes is important for the design and operation of these structures. In the present study, the effect of the position angle (α) and gap ratio (G/D) of a piggyback pipeline on the amplitude of 1DOF vortex-induced vibration (VIV) was investigated experimentally in a wind tunnel. The diameter ratio d/D of the two cylinders was 0.5. Five position angles, namely, α = 0°, 45°, 90°, 135°, and 180°, and six gap ratios at each angle, G/D = 0, 0.1, 0.2, 0.3, 0.4, 0.5, were tested. It was found that both α and G/D affected the amplitude of vibrations significantly. For all gap ratios, the amplitude of vibrations increased from α = 0° to α = 90° and then decreased to a minimum value around α = 135°. The maximum amplitude occurred around α = 90° when G/D = 0, and the minimum occurred around α = 135°, when G/D = 0.2–0.3. At other position angles, the vibration amplitude was less sensitive to G/D, especially when the latter was between 0.1 and 0.4. These results verified those obtained using numerical methods and are invaluable to engineers when designing offshore piggyback pipelines.

1. Introduction

The offshore oil and gas industry extensively uses pipelines and risers for production and transportation purposes. Under the effects of waves, sea currents, or combinations of them, vortex shedding may occur. When the vortex shedding frequency is close to the natural frequency of the pipelines and risers, resonance occurs. In this case, large-amplitude pipeline vibrations are induced, normally termed as vortex-induced vibrations (VIVs). Due to technical or sometimes economic considerations, offshore pipelines of different diameters are often laid in bundles, i.e., two or more pipelines strapped together and treated as a single pipe for installation purposes. The pipelines in the bundle can be in direct contact with each other or be separated by a small gap. It is expected that the gap ratio G/D (where G is the gap between the surfaces of the pipelines in the bundle and D is the diameter of the primary pipeline) and the position angle α between the primary and the secondary pipelines may change the flow structures around the primary pipeline and hence the VIV characteristics of the whole bundle. Hereafter, the position angle α is defined as the angle between the flow direction and the direction passing through the centers of the two pipelines. The most common configuration of pipeline bundles in the oil and gas industry comprises a larger pipeline (primary with a diameter D) and a smaller one (secondary with a diameter d), arranged in piggyback configuration. The small one may be used for water injection or gas lift in order to increase production from the reservoir. It may also be used for other technical requirements such as electronics and communications.
Extensive studies on cylinder bundles of unequal diameters have been conducted. Igarashi [1] studied the flow characteristics around two tandem circular cylinders with a diameter ratio d/D = 0.68. Depending on the gap ratio G/D, four flow regimes, namely, complete separation, reattachment flows, bistable flows, and jumped flows, were classified. Zhao et al. [2] investigated the flow past two stationary piggyback pipelines with d/D = 0.25, G/D = 0.05–1.0 and α = 0°–180°. Three shedding flow regimes were proposed over α = 22.5°–157.5°, namely, single body, interactive vortex shedding, and separate wakes. It was also found that the root-mean-square (RMS) lift coefficients on both the large and small cylinders were strongly affected by α and G/D. The RMS lift coefficient generally increased as G/D decreased. Since VIV is the direct result of the fluctuating lift force, it is plausible to assume that an increase in RMS lift coefficient implies an increase in the amplitude of vibration. Alam and Zhou [3] examined the Strouhal numbers (St), forces, and flow structures around two tandem cylinders of different diameters for a fixed G/D but varying d/D between 0.24 and 1, where St is defined as f s U / D , with f s being the vortex shedding frequency and U the free stream velocity. Two distinct frequencies were detected behind the downstream cylinder, one corresponding to the vortex shedding in the gap and the other corresponding to the shedding from the downstream cylinder. Gao et al. [4] studied the wake structures of a piggyback pipeline as a function of α (0° ≤ α ≤ 180°). The Reynolds number Re, gap ratio G/D, and diameter ratio d/D were 1200, 1.2, and 2/3, respectively, where Re is defined as U D / ν , with ν being the dynamic viscosity of the fluid. It was found that when α was changed from 0° to 90°, the flow patterns changed correspondingly from that of a single bluff body to two vortex streets. The inverse change was observed when α was increased from 90° to 180°. Cheng et al. [5] examined the effects of gap distance between the pipeline and seabed, G/D, and d/D on the hydrodynamics a piggyback pipeline with α = 90° in waves and currents in a wave flume. It was found that when G/D > 0.6, the effects of G/D on the hydrodynamics were weakened.
For piggyback pipelines undergoing VIV, the wake structures and force characteristics have also been studied by quite a number of researchers, e.g., Zdravkovich [6,7,8]. Medeiros and Zdravkovich [9] tested various cylinder arrangements, namely, tandem, side-by-side, and staggered with a diameter ratio d/D of 0.5. It was found that the vibration amplitude is sensitive to G/D. For instance, the tandem configuration reached a peak vibration amplitude of Amax/D ≈ 0.7 for G/D = 0.45, where Amax is the maximum vibration amplitude. But when G/D was increased to 1.45, Amax/D = 2.7. The configuration that yielded the maximum vibration amplitude corresponded to α = 90°. The minimum amplitude occurred at the staggered arrangement. This is expected as the small cylinder causes the asymmetric vortices from the primary one, which results in weak vortex shedding and, hence, small-amplitude VIV.
Zang et al. [10] investigated the VIV of piggyback pipelines and the flow structures in the subcritical flow regime using particle image velocimetry (PIV). It was found that for G/D ≥ 0.3, the effect of G/D was not apparent due to weak interaction between the two pipelines. Zang and Gao [11] further experimentally studied the effects of d/D, G/D, and α on the VIV responses of piggyback pipelines. The results showed that the VIV amplitude was suppressed significantly for G/D = 0.25 and α = 90°. Zhao and Yan [12] studied two-degree-of-freedom (2DOF) VIV of two piggyback pipelines at Re = 250 for α in the range of 0°–180° with an increment of 22.5°. It was found that the vibration frequency, amplitude, and force coefficients were all sensitive to both α and d/D. Rehmanian et al. [13] studied 2DOF VIV of two piggyback pipelines, with d/D = 0.1 for G/D = 0.1–0.4 and α = 0°–180°. The mass ratio m* and the damping coefficient ζ of the bundle (in both the in-line and the cross-flow directions) were 2.4 and 0.000863, respectively, which are the same as those used by Khalak and Williamson [14] and Jauvtis and Williamson [15]. The force coefficients of the cylinder bundle were also investigated at typical G/D and α. It was found that the results, including vibration frequency components, VIV amplitudes, and force coefficients, were all very sensitive to both G/D and α. The maximum cross-flow vibration amplitude occurred when α = 67.5° and G/D = 0.1, whereas the minimum cross-flow and in-line vibration amplitudes occurred at α = 112.5°, when G/D = 0.3. The two-degree-of-freedom (2DOF) VIVs of two rigidly coupled cylinders were numerically investigated at Re = 3.6 × 10⁶ by Serta et al. [16] with d/D = 0.25; α = 0°, 90°, and 180°; and G/D = 0.1. To examine the effect of the gap ratio, another two values of G/D (0.25 and 0.5) were also considered for α = 90°. The results showed that the secondary cylinder enlarged the lock-on region for all values of α. The largest and smallest amplitudes of vibrations were found when α = 0° and 180°, respectively. Janocha and Ong [17] studied the VIV of piggyback pipelines located 0.2D above a horizontal wall for Re = 3.6 × 10⁶ at d/D = 0.2; G/D = 0.2; and α = 0°, 90°, and 180°. The results of the largest and smallest amplitudes were found to be similar to those by Serta et al. [16], though with smaller magnitudes due to the wall effects. Chen and Wu [18] studied the 3DOF VIV of a piggyback pipeline at Re = 100 for d/D = G/D = 0.2 and α = 0°–180° with a 30° increment. Significant effects of α on amplitudes were found. In a recent study by Gao et al. [19], 2DOF VIVs of two coupled cylinders with unequal diameters were performed at Re = 20,000 to investigate the effects of α, G/D, and d/D on VIV responses. The vortex shedding modes were also examined.
It needs to be noted that the aforementioned studies about the VIV of piggyback pipelines of unequal diameters were mainly conducted using numerical methods. They improved our understanding of the effects of d/D, G/D, and α on VIV amplitudes, hydrodynamic forces, and vortex shedding characteristics. Extensive experimental studies on the VIVs of two equal-diameter cylinders of various arrangements (i.e., varying G/D and α, mainly in tandem and side-by-side arrangements) have also been conducted previously, and various flow classifications have been proposed (e.g., [20,21,22]). However, the experimental results on the VIVs of piggyback pipelines and the effects of α and G/D of two unequal diameter cylinders are not very well documented in the literature [11]. As mentioned earlier, the offshore piggyback pipelines are mainly concerned with unequal diameter pipes at close proximity for various position angles. Reliable evaluation of the maximum vibration amplitudes using experimental methods is crucial, not only to the safe design and operation of these structures, but also to providing benchmarks for numerical simulations. Ideally, systematic studies should be focused on VIV amplitudes, hydrodynamic forces, and vortex structures for various scenarios (i.e., various d/D, G/D, and α). However, these will involve complex experimental setup. In this study, the VIV of two pipelines arranged rigidly in a piggyback configuration is investigated experimentally in a wind tunnel at five different position angles (α = 0°, 45°, 90°, 135°, and 180°) and six gap ratios (G/D = 0–0.5). The main purpose is to examine the effects of G/D and α on the maximum vibration amplitudes for a fixed diameter ratio (d/D = 0.5), based on which the worst scenarios can be identified and compared with those obtained using numerical methods.

2. Experimental Set Up

Experiments were conducted in the wind tunnel at The University of Western Australia. The dimensions of the test section were 2.2 m (height) × 2.8 m (width) × 6 m (length). The freestream turbulence intensity was less than 1%. The primary and the secondary cylinders were made of polished aluminum with diameters D = 80 mm and d = 40 mm, respectively (Figure 1). The length of the cylinders was L = 1600 mm, resulting in an aspect ratio L/D = 20. The blockage ratio of the wind tunnel was less than 5%, which is below the suggested value of 6% [23]. The two cylinders were attached to each other via two steel threaded rods, one at either end. The rods passed through the centers of both cylinders, with each cylinder being held securely using nuts and spring washers. The gap ratio G/D between the two cylinders was adjustable, changing from 0 to 0.5. The position angle α was also changeable, in the range of 0°–180° with an increment of 45°. Previous numerical simulations (Rahmanian et al. [13]) showed that the occurrence angle of the maximum amplitude may also depend on G/D. It would be too time-consuming to capture the critical angles experimentally. Therefore, only some typical angles are examined in this study. The masses of the two cylinders were 3.235 kg and 1.120 kg, respectively. Two end plates with dimensions of 7D × 7D were used to minimize the end effect of the cylinders. The thickness of the end plate was 3 mm, with the four edges being sharpened at an angle of 45°. They were fixed vertically at about 10 mm from the ends of the cylinder bundle. Four steel springs, two at either end of the cylinder, suspended the cylinders approximately 1000 mm off the wind tunnel floor. The springs were selected based on their stiffness and length. They must be stiff enough and long enough to remain in tension when measuring the amplitude of vibrations. All four springs were of equal stiffness k (1680 N/m) and equal original length (250 mm). The stiffness was measured by applying a known load to the springs and measuring the subsequent deflection. Once the springs were attached to the cylinder, the top and bottom springs were stretched to lengths of about 340 mm and 330 mm, respectively.
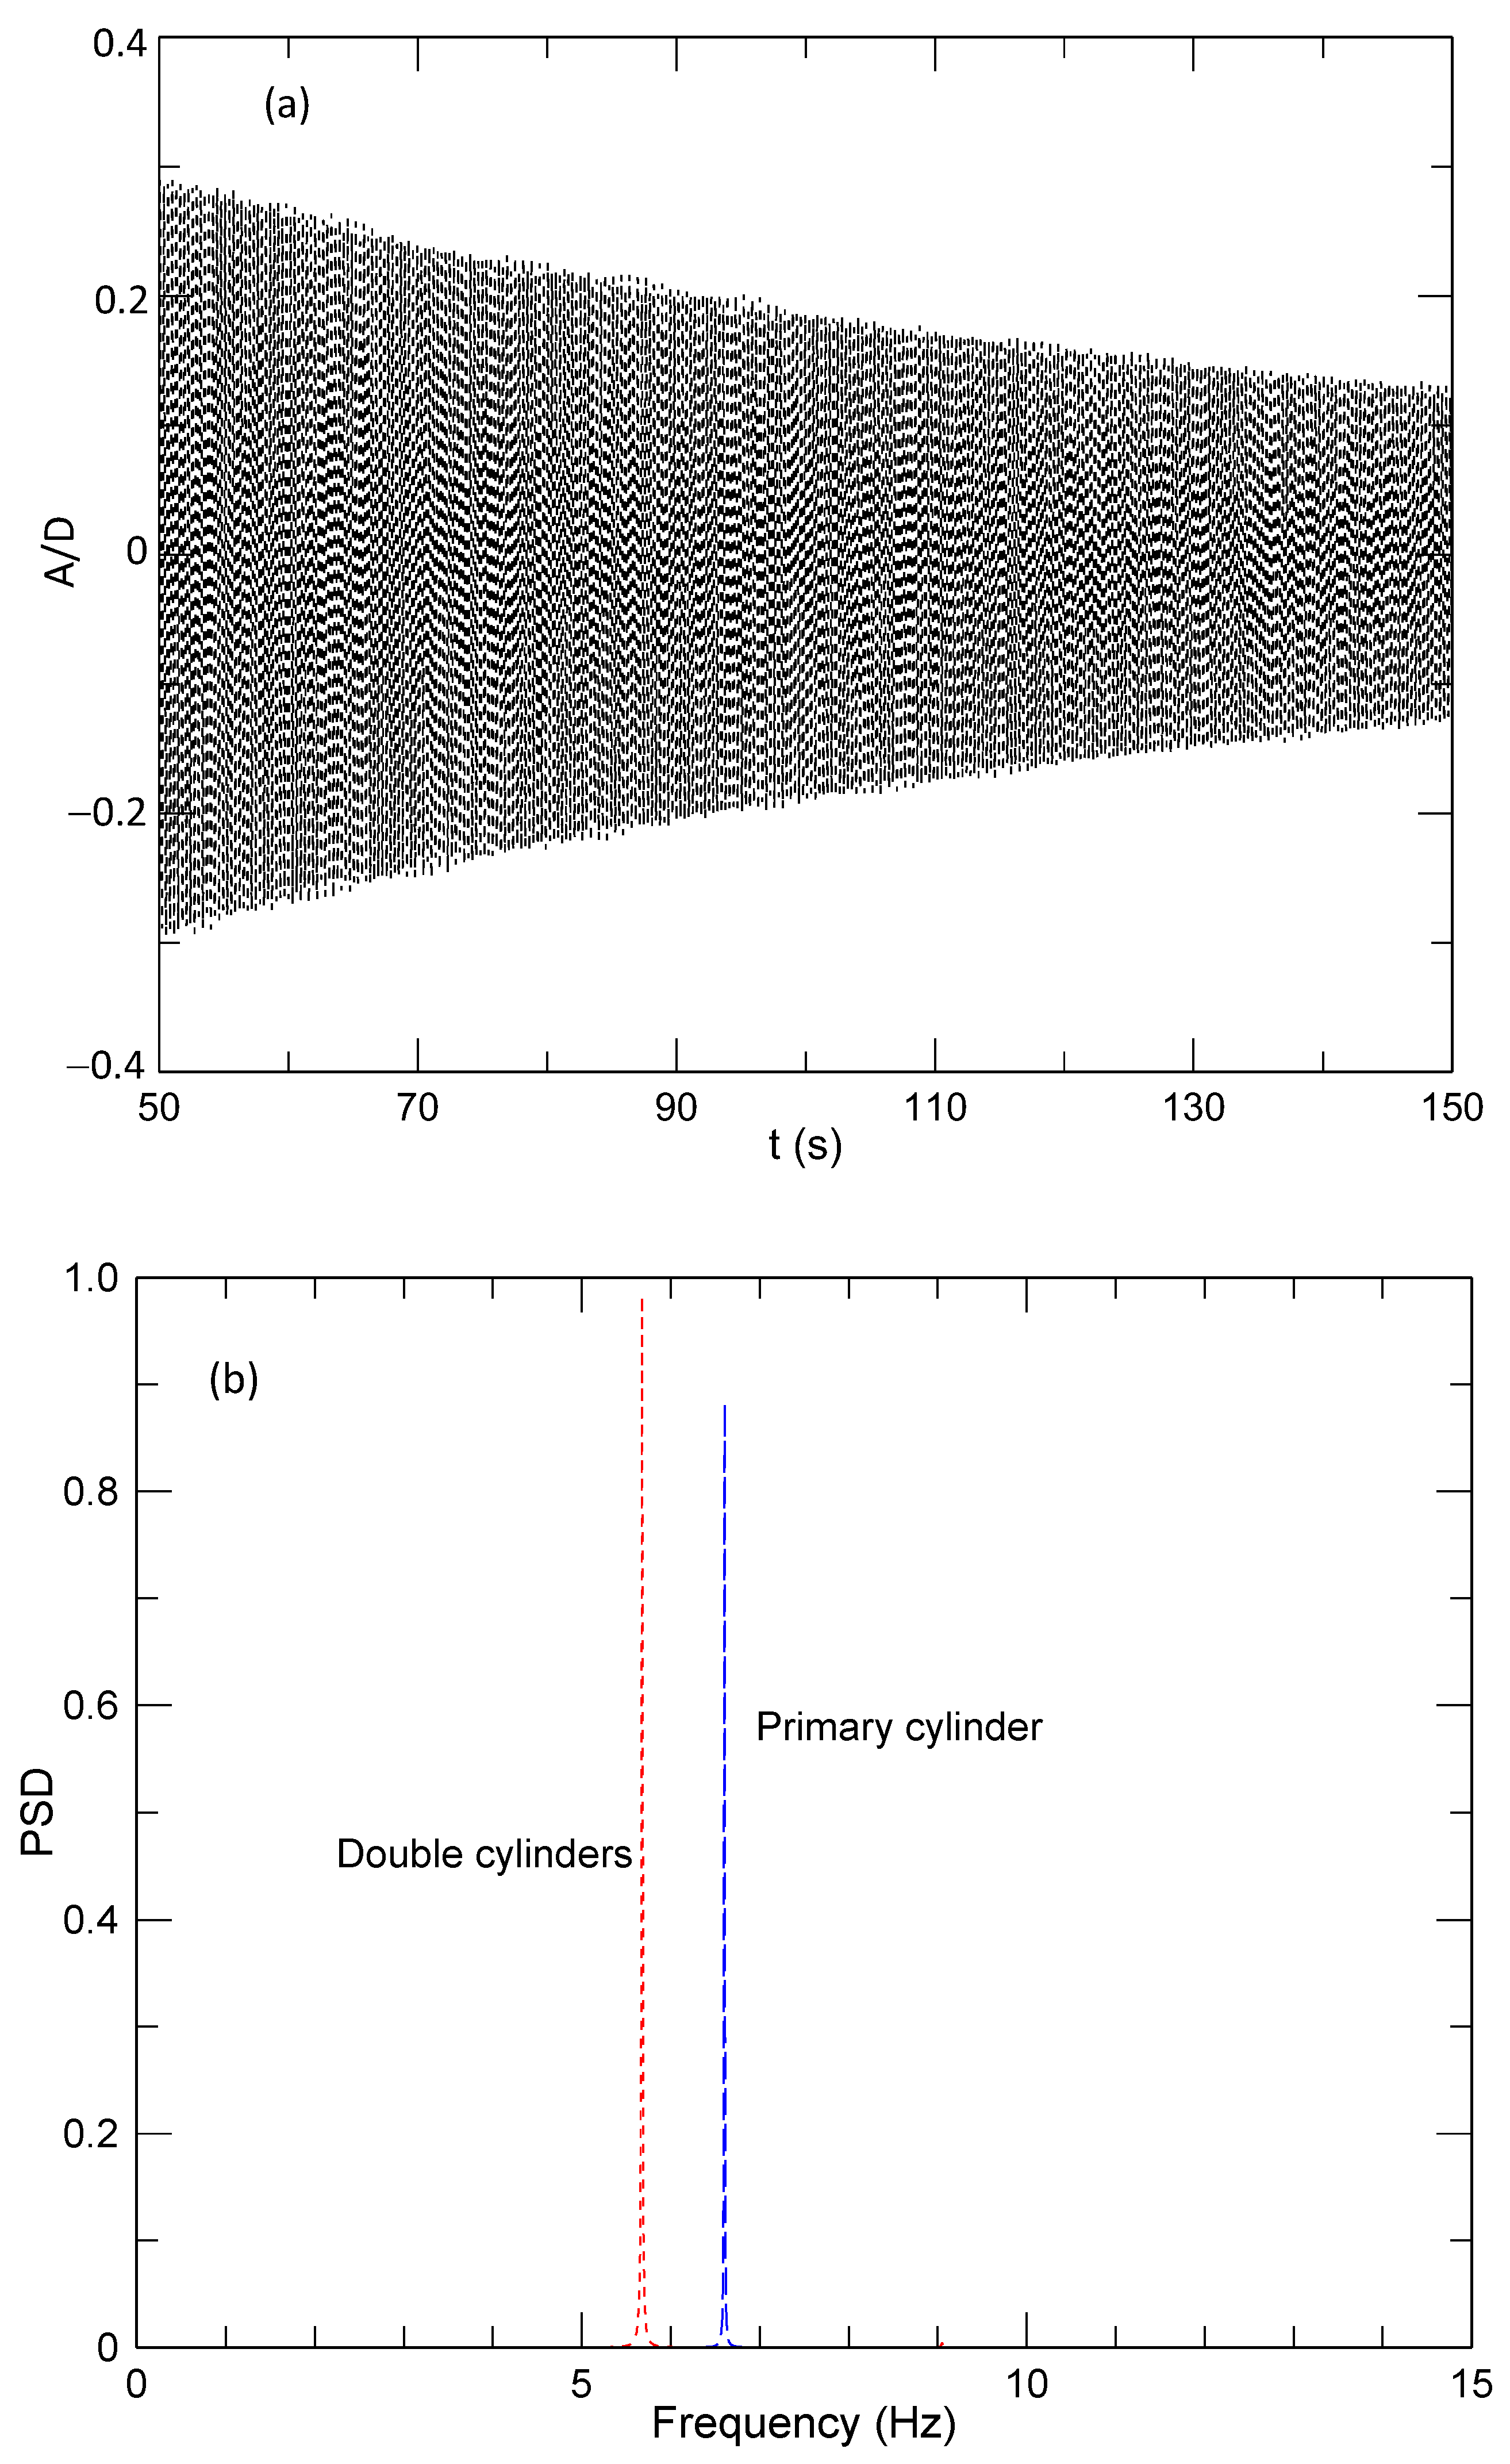
The amplitude of vibrations was measured using a linear variable differential transformer (LVDT) laser, which was cantilevered off the frame’s vertical member. The vibration signal was recorded at an interval of 5 ms using LabVIEW 7.1. The natural frequencies of the single primary cylinder and the double cylinder system were obtained using free-decay tests. Fast Fourier Transform (FFT) was then applied to the time series of the measured signals, and the strong peak on the distribution corresponded to the natural frequencies, which were 6.6 Hz and 5.7 Hz, respectively, for the single-cylinder and the double-cylinder systems (Figure 2).
Experimental uncertainty for the mean velocity was inferred from the errors in the Pitot-static tube, as well as the scatters observed by repeating the experiment a few times. The uncertainty for U was about ±3%. The uncertainty for St depends on that of the mean velocity and the vortex shedding frequency. The latter can be identified using the FFT algorithm with a window size of 211. Its uncertainty depends on the sampling frequency and the window size when performing FFT [24]. In the present study, the uncertainty of the vortex shedding frequency was estimated to be about 3%. The uncertainty for the vibration amplitude depended on the accuracy of the LVDT (3%), data sampling rate, the way that the amplitude was evaluated, and the scatter observed in repeating the experiment, which was about 4%. Using the above values and the method of error propagation [25,26,27], the uncertainties for frequency ratio fs/fn and the vibration amplitude A were estimated to be around 4.2% and 5.4%, respectively.

3. Results and Discussion

3.1. Single Cylinder with D = 80 mm

In order to validate the current experimental setup, the dynamic response of a single cylinder was tested first. The response of the cylinder can be described in terms of the vibration amplitude A/D versus the reduced velocity Vr, which is defined as U / f n D . An example of the vibration response at Re = 16,000 is shown in Figure 3. It can be seen that the vibration took about 100 s to stabilize, after which the amplitude of vibration did not change apparently. The vibrations were monitored, and when they stabilized, the signals were recorded for about 120 s. The amplitudes of vibration were determined by averaging the 10% highest readings in the time history of the vibration [28,29].
The vortex shedding frequency f s at various reduced velocities was examined by performing FFT on the velocity signals measured in the wake using a hot-wire probe. Before the cylinder began to vibrate, vortex shedding from the cylinder was apparent, with a peak frequency corresponding to St = 0.21, which agreed well with the consensus values in the literature. After the cylinder began to vibrate, the energy spectrum peaked at the natural frequency of the cylinder–spring system over the whole lock-on region. The peak frequencies on the energy spectra at different reduced velocities were replotted as f s / f n versus Vr (Figure 4). Outside the lock-on region, f s / f n increased linearly with Vr until Vr = 5, i.e., f s f n = S t V r [30]. Over the lock-on region, the ratio f s / f n maintained a constant value of 1 until Vr = 8.5. This frequency ratio in the lock-on region was apparently different from those reported by Khalak and Williamson [14] and Franzini et al. [29] due to the high mass ratio used in the present study.
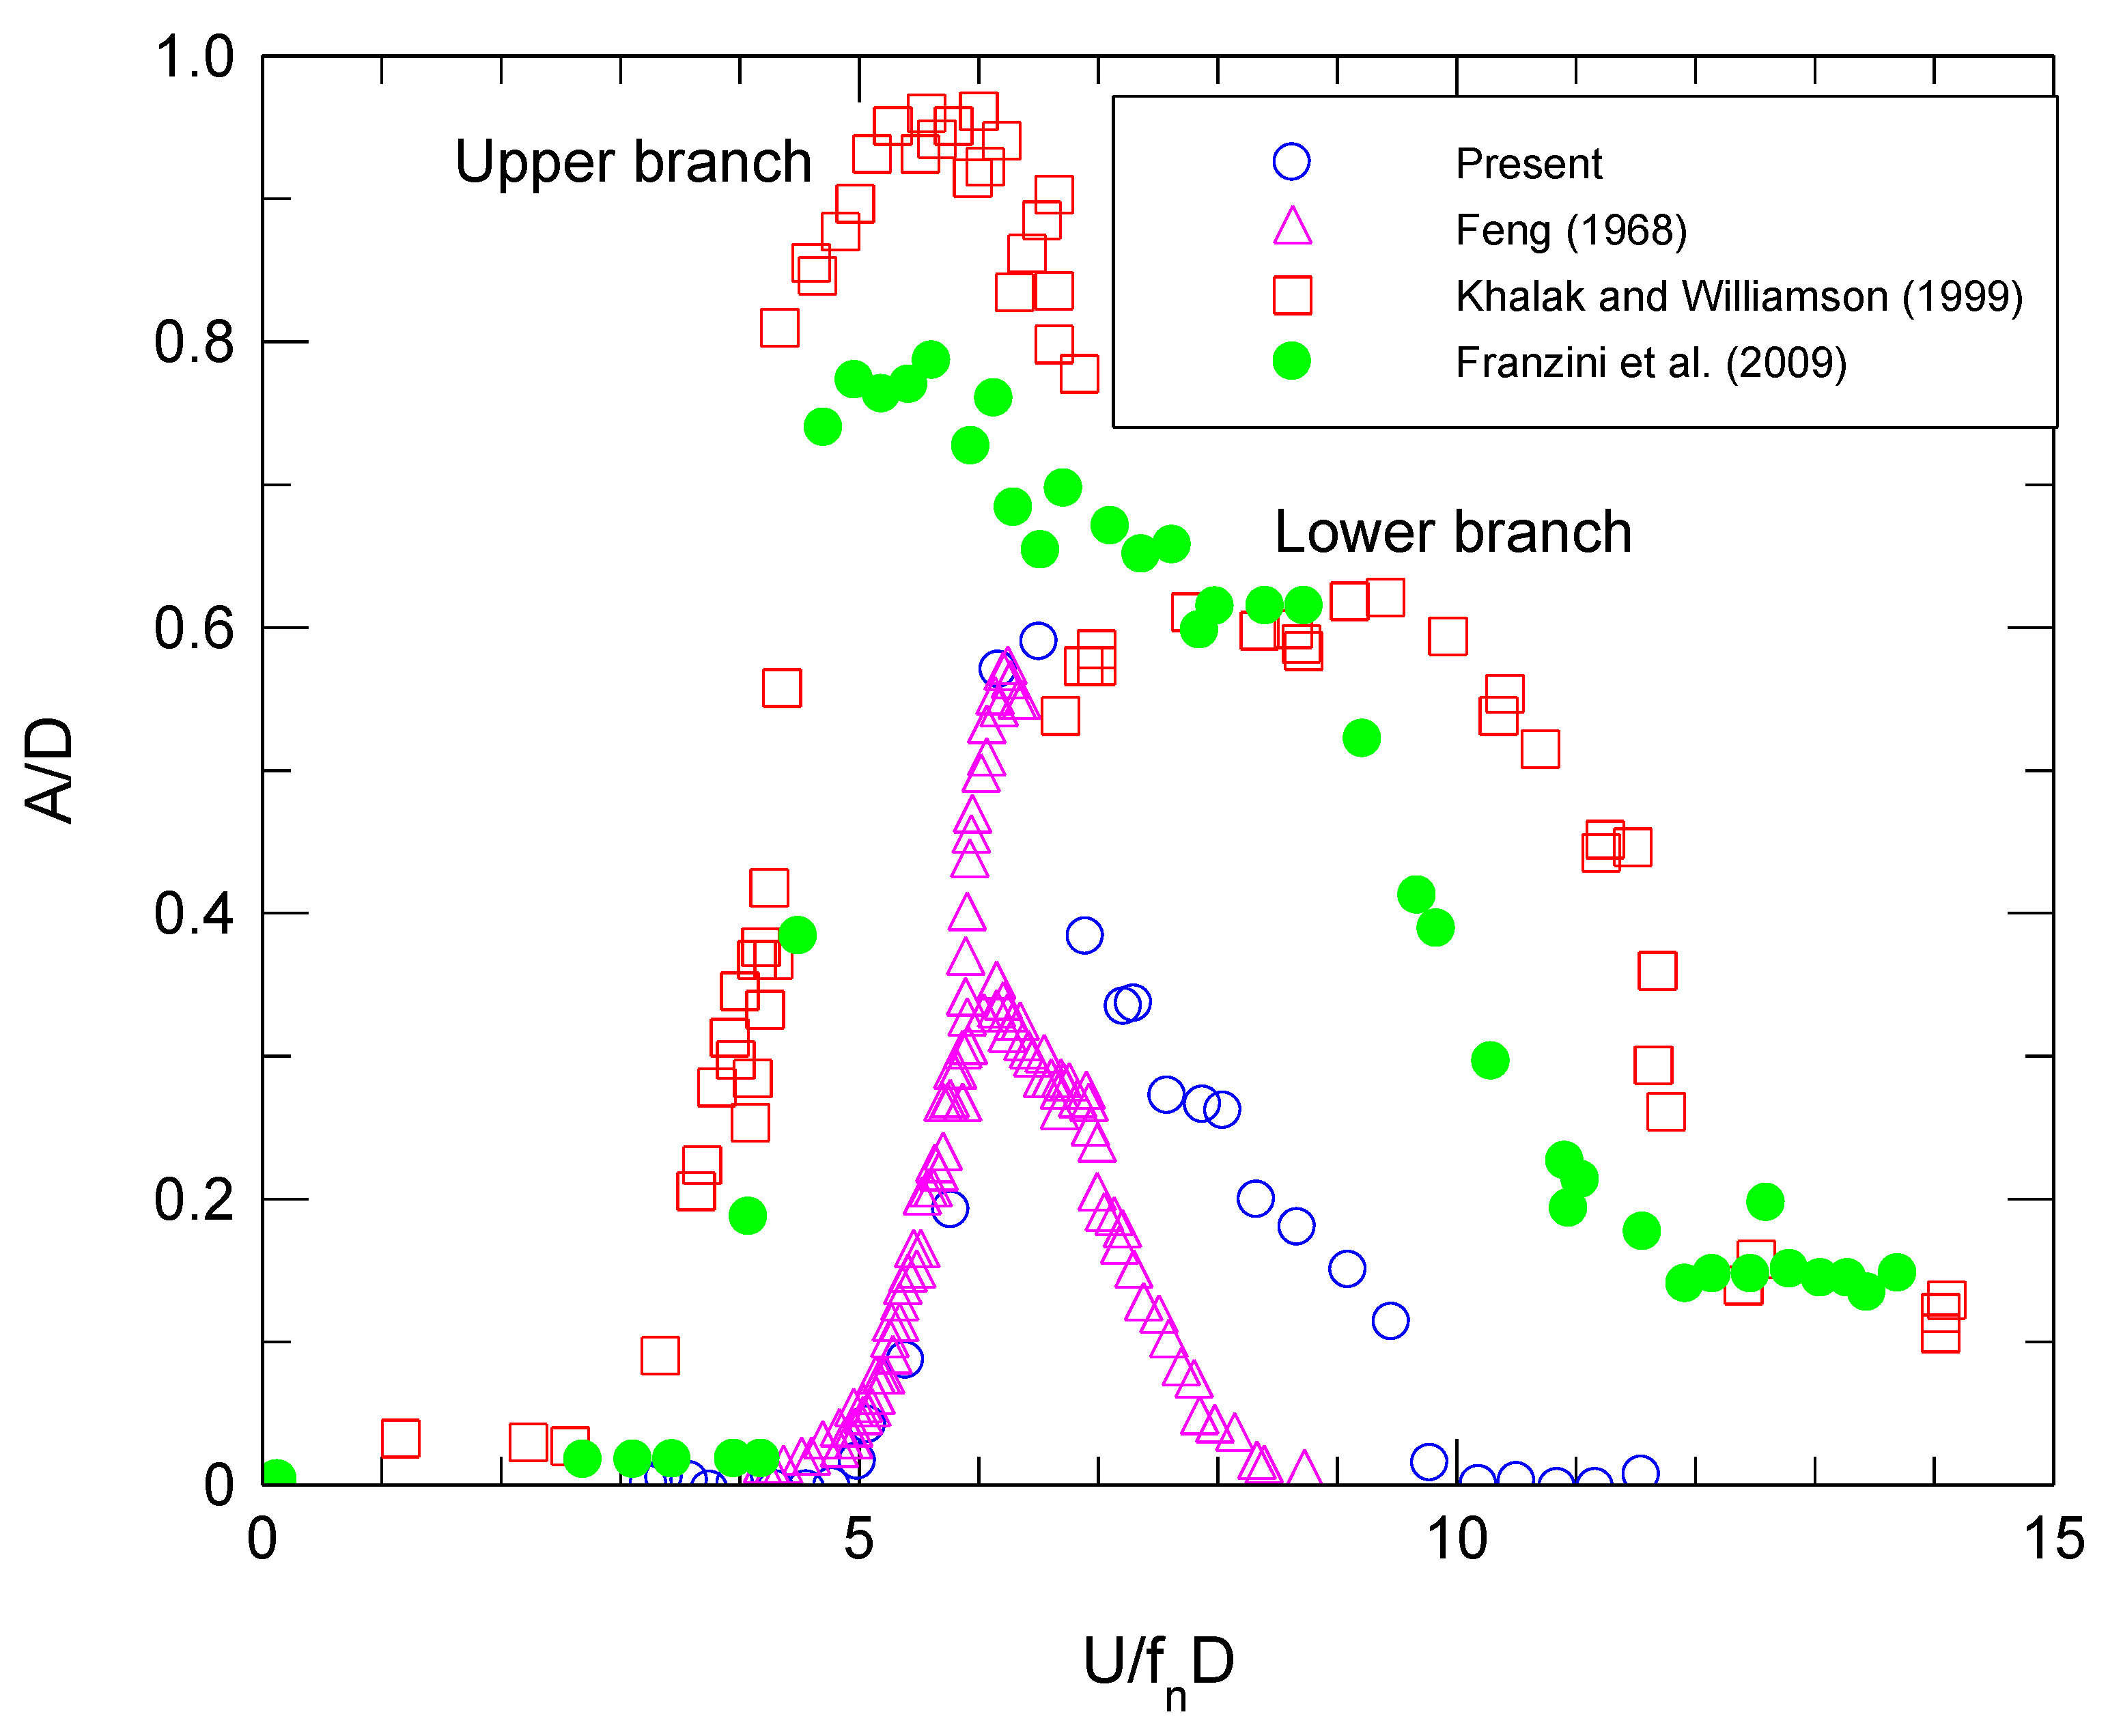
The vibration amplitude (A/D) for various Vr are shown and compared with those obtained by Feng [31], Khalak and Williamson [14], and Franzini et al. [29] in Figure 5. The maximum peak amplitude (Amax) occurred at Vr between 5 and 8, which is within the consensus range reported by Sumer and Fredsoe [30]. The current results of A/D show the highest value of 0.59 at Vr = 7. This agrees well with that of Feng [31] (Amax/D = 0.57) due to comparable mass-damping parameters m * ζ s in these studies, where m* ( m / m f , with m being the structure mass including the enclosed fluid mass and mf being the displaced fluid mass) is the mass ratio and ζ s is the structural damping factor, which can be determined from the free-decay test, viz. ζ s = ln(yn+1/yn)/2π, with yn+1 and yn being the two consecutive vibration amplitudes [30]. The present mass ratio m* was 263, while that of Feng’s [31] was 248. Therefore, the mass-damping parameter m * ζ s equals 0.26 for the current study and 0.255 for Feng [31].
The VIV responses reported by Khalak and Williamson [14] and Franzini et al. [29] depict a different scenario. This is because these tests were conducted in water, with mass-damping parameters m * ζ s of 0.013 and 0.0125, respectively, which are significantly lower than those of the current study and Feng’s study [31]. The overall amplitudes are higher than those of the present study, and the peak values are Amax/D = 0.95 and 0.79, respectively, occurring at Vr = 5.8. Three different branches can be identified, namely, the initial branch, the upper branch, and the lower branch. Furthermore, Sarpkaya [32] proposed an empirical formula to estimate the maximum amplitude through ( A / D ) / γ = 1.12 × 0.35 S G , where the dimensionless mode factor γ is fixed at 1 for a rigid cylinder and the response parameter S G can be estimated through S G = 2 π 3 S t 2 m * ζ s . By using the above relationships, the maximum amplitude was estimated to be 0.57, which is in good agreement with the value found in the present study (0.59). Overall, the above experimental results for a single smooth cylinder verified the feasibility of the present experimental setup.

3.2. Vibration Amplitude of the Piggyback Pipeline at Different G/D and α

In the present study, a total of 30 different cylinder arrangements were examined, which included six different gap ratios at five different position angles. To normalize the vibration amplitude, three characteristic length scales can be used, namely, the diameter D of the primary cylinder; the projected diameter DProj, which is the vertical height between the top and bottom of the cylinders; and the equivalent diameter Dequiv = D + d. However, as DProj changes with gap ratio, this normalization results in individual configurations not being comparable to one another. On the country, even though Dequiv is a constant value, for most configurations except at α = 90°, the vertical height of the piggyback pipelines should be overestimated. Therefore, we used the diameter of the primary pipe D as the characteristic length scale for the normalizations. For each of the above 30 configurations, a plot of A/D versus Vr was obtained first. From this, the peak amplitude of vibration (Amax) for each cylinder configuration, i.e., for a given α and G/D, could be identified. This peak amplitude is of the most interest as it relates to the largest vibrations of the pipelines, and hence the most potential damage to the system in terms of loading and fatigue.
Figure 6 compares the vibration amplitudes A/D of a single cylinder with those of the piggyback cylinders at different values of α and G/D. Three distinct characteristics for the piggyback cylinders were observed. Firstly, the magnitudes of Amax/D at α = 45° and 90° for all gap ratios were larger than that of a single cylinder, while for other gap ratios, they were smaller than that of the single cylinder, especially at α = 135°. Secondly, compared with the single-cylinder results, the width of the lock-on region for most values of α and G/D was enlarged. This result seems consistent with that reported by Gao et al. [19]. Thirdly, for all gap ratios, the onset of VIV at α = 0° and 90° occurred at a lower reduced velocity, even smaller than that of the single cylinder, indicating that for these configurations, the vortex shedding frequency increased and did not depend apparently on gap ratio. For α = 45°, the onset of VIV occurred at a fixed reduced velocity (Vr = 7) for G/D ≤ 0.4. When G/D was increased to 0.5, VIV occurred earlier, indicating an increased vortex shedding frequency for this gap ratio. For α = 135° and G/D = 0, the onset of VIV occurred at Vr = 8.5, indicating a reduced vortex shedding frequency at this gap ratio. With the increase in G/D, the shedding frequency increased, resulting in a reduced Vr for the onset of VIV. For α = 180°, the onset of VIV did not change with the gap ratio, occurring at about Vr ≈ 5. This should be because the smaller cylinder was located in the recirculation region of the larger one when G/D ≤ 0.5, and the onset of VIV resembled that of the single cylinder.

3.3. Effects of α on Amax for Given Values of G/D

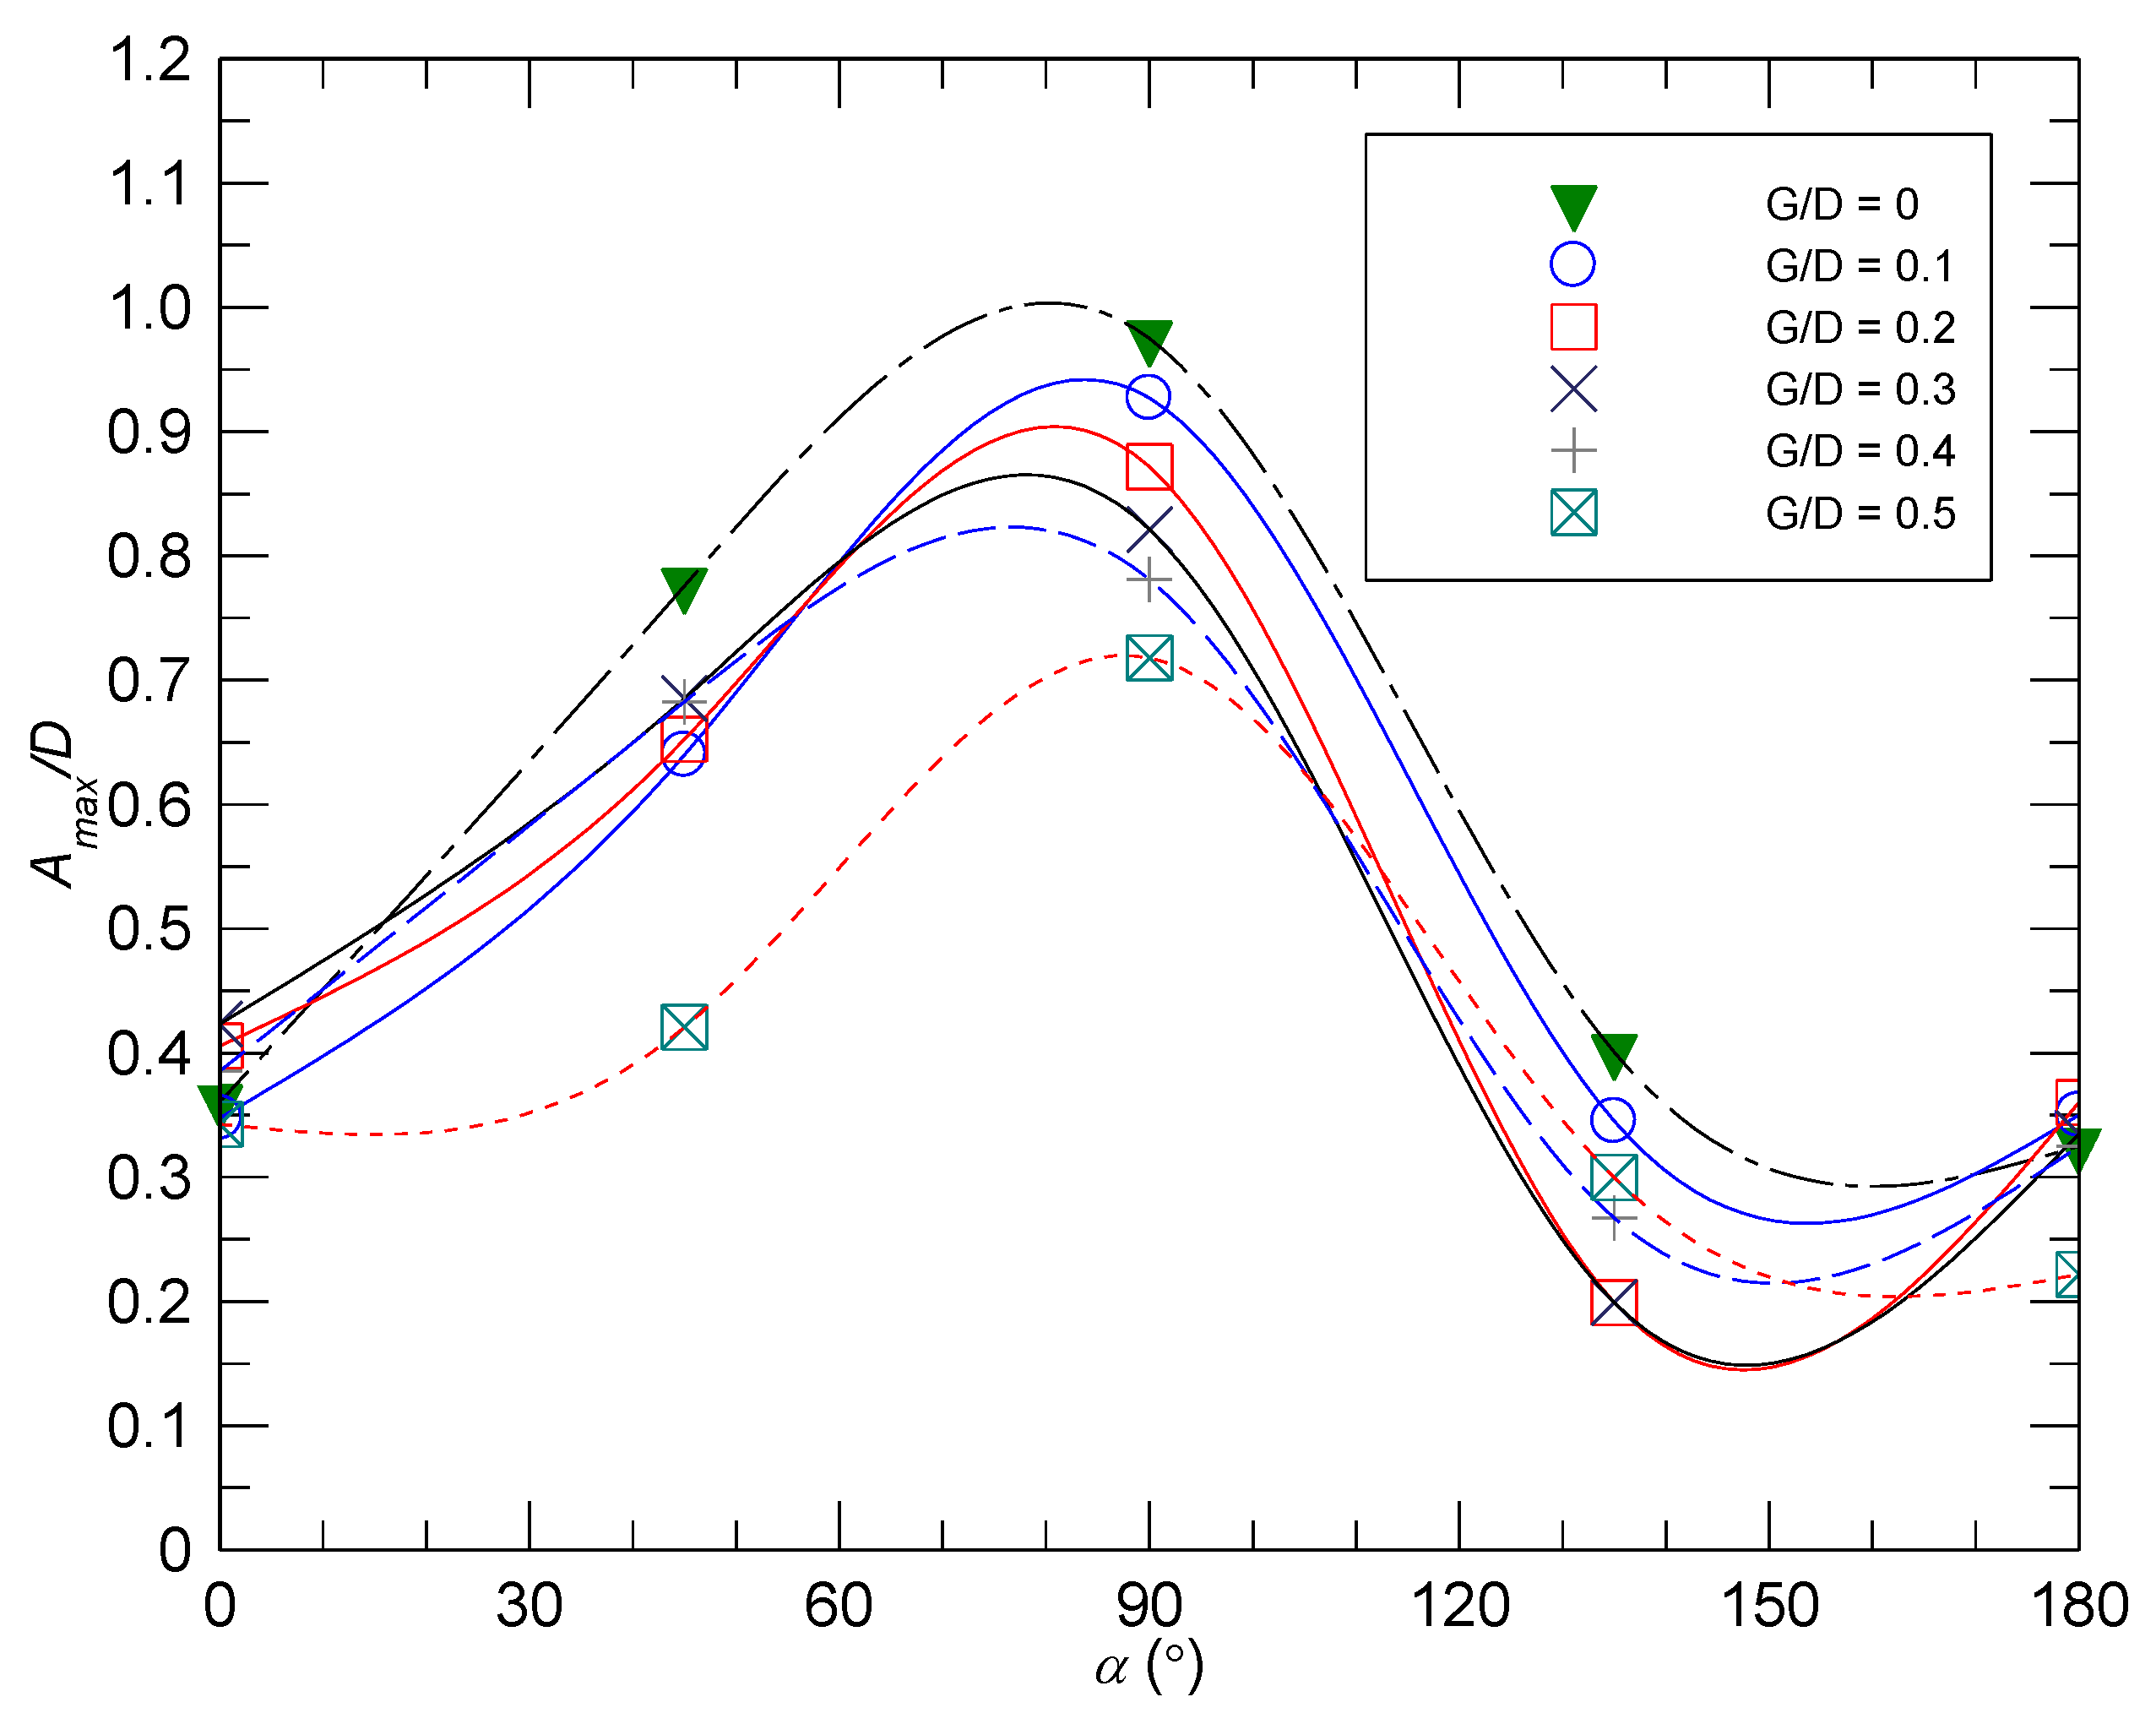
Figure 7 shows the variation in the maximum amplitude Amax/D with α for various G/D. These values correspond to the maxima shown in Figure 6. Using a spline function to fit the measured data in Figure 7 so that the extrema can be resolved, the maximum Amax/D occurred at around α = 80° when G/D = 0. As G/D was increased, the maximum value of Amax/D for a given G/D decreased consistently over α = 75°–90°, with the minimum occurring at G/D = 0.5 and α ≈ 90°. The above trends around the peak locations were very similar to those reported by Rahmanian et al. [13]. For example, Rahmanian et al. [13] found that the maximum cross-flow vibration amplitude occurred at α ≈ 67.5° for G/D = 0.1. This was the smallest gap ratio examined in that study due to restrictions in numerical simulations. In addition, based on the fitted curves in Figure 7, the minimum values of Amax/D for all gap ratios occurred around α ≈ 148°–160°, with G/D = 0.2–0.3. In general, these minimum values were only about 1/3 of the maximum values occurring over α = 75°–90°. Even though the occurring position angle was different from that reported by Rahmanian et al. [13] who found that the minimum cross-flow vibration amplitudes occurred at α = 112.5°, both studies confirmed that G/D = 0.2–0.3 is the critical gap ratio for the minimum value of Amax/D. It is also interesting to note that, as the gap ratio changed, there were smaller variations in Amax/D at α = 0° and 180° than those at other position angles, which were consistent with the results of Rahmanian et al. [13], even though the magnitudes in the latter study were more than two times larger than those of the present study due to the small mass ratio used in the former. The results shown in Figure 7 are also supported by the numerical study of Wang and Cheng [33], where the effects of α on the RMS lift coefficient of the primary cylinder were examined. It is fair to assume that, since VIV is caused by a variation in lift, there exists a correlation between the amplitude of VIV and the RMS lift coefficient. As the RMS lift coefficient increases, so does the amplitude of vibrations. For the numerical simulations, the RMS lift coefficient increased from α = 0° to a maximum value at α = 90° and was then followed by a decreasing trend. The results of Wang and Cheng [33] serve to confirm those obtained here for the effect of α on Amax/D.

3.4. Effect of G/D on Amax for Given Values of α

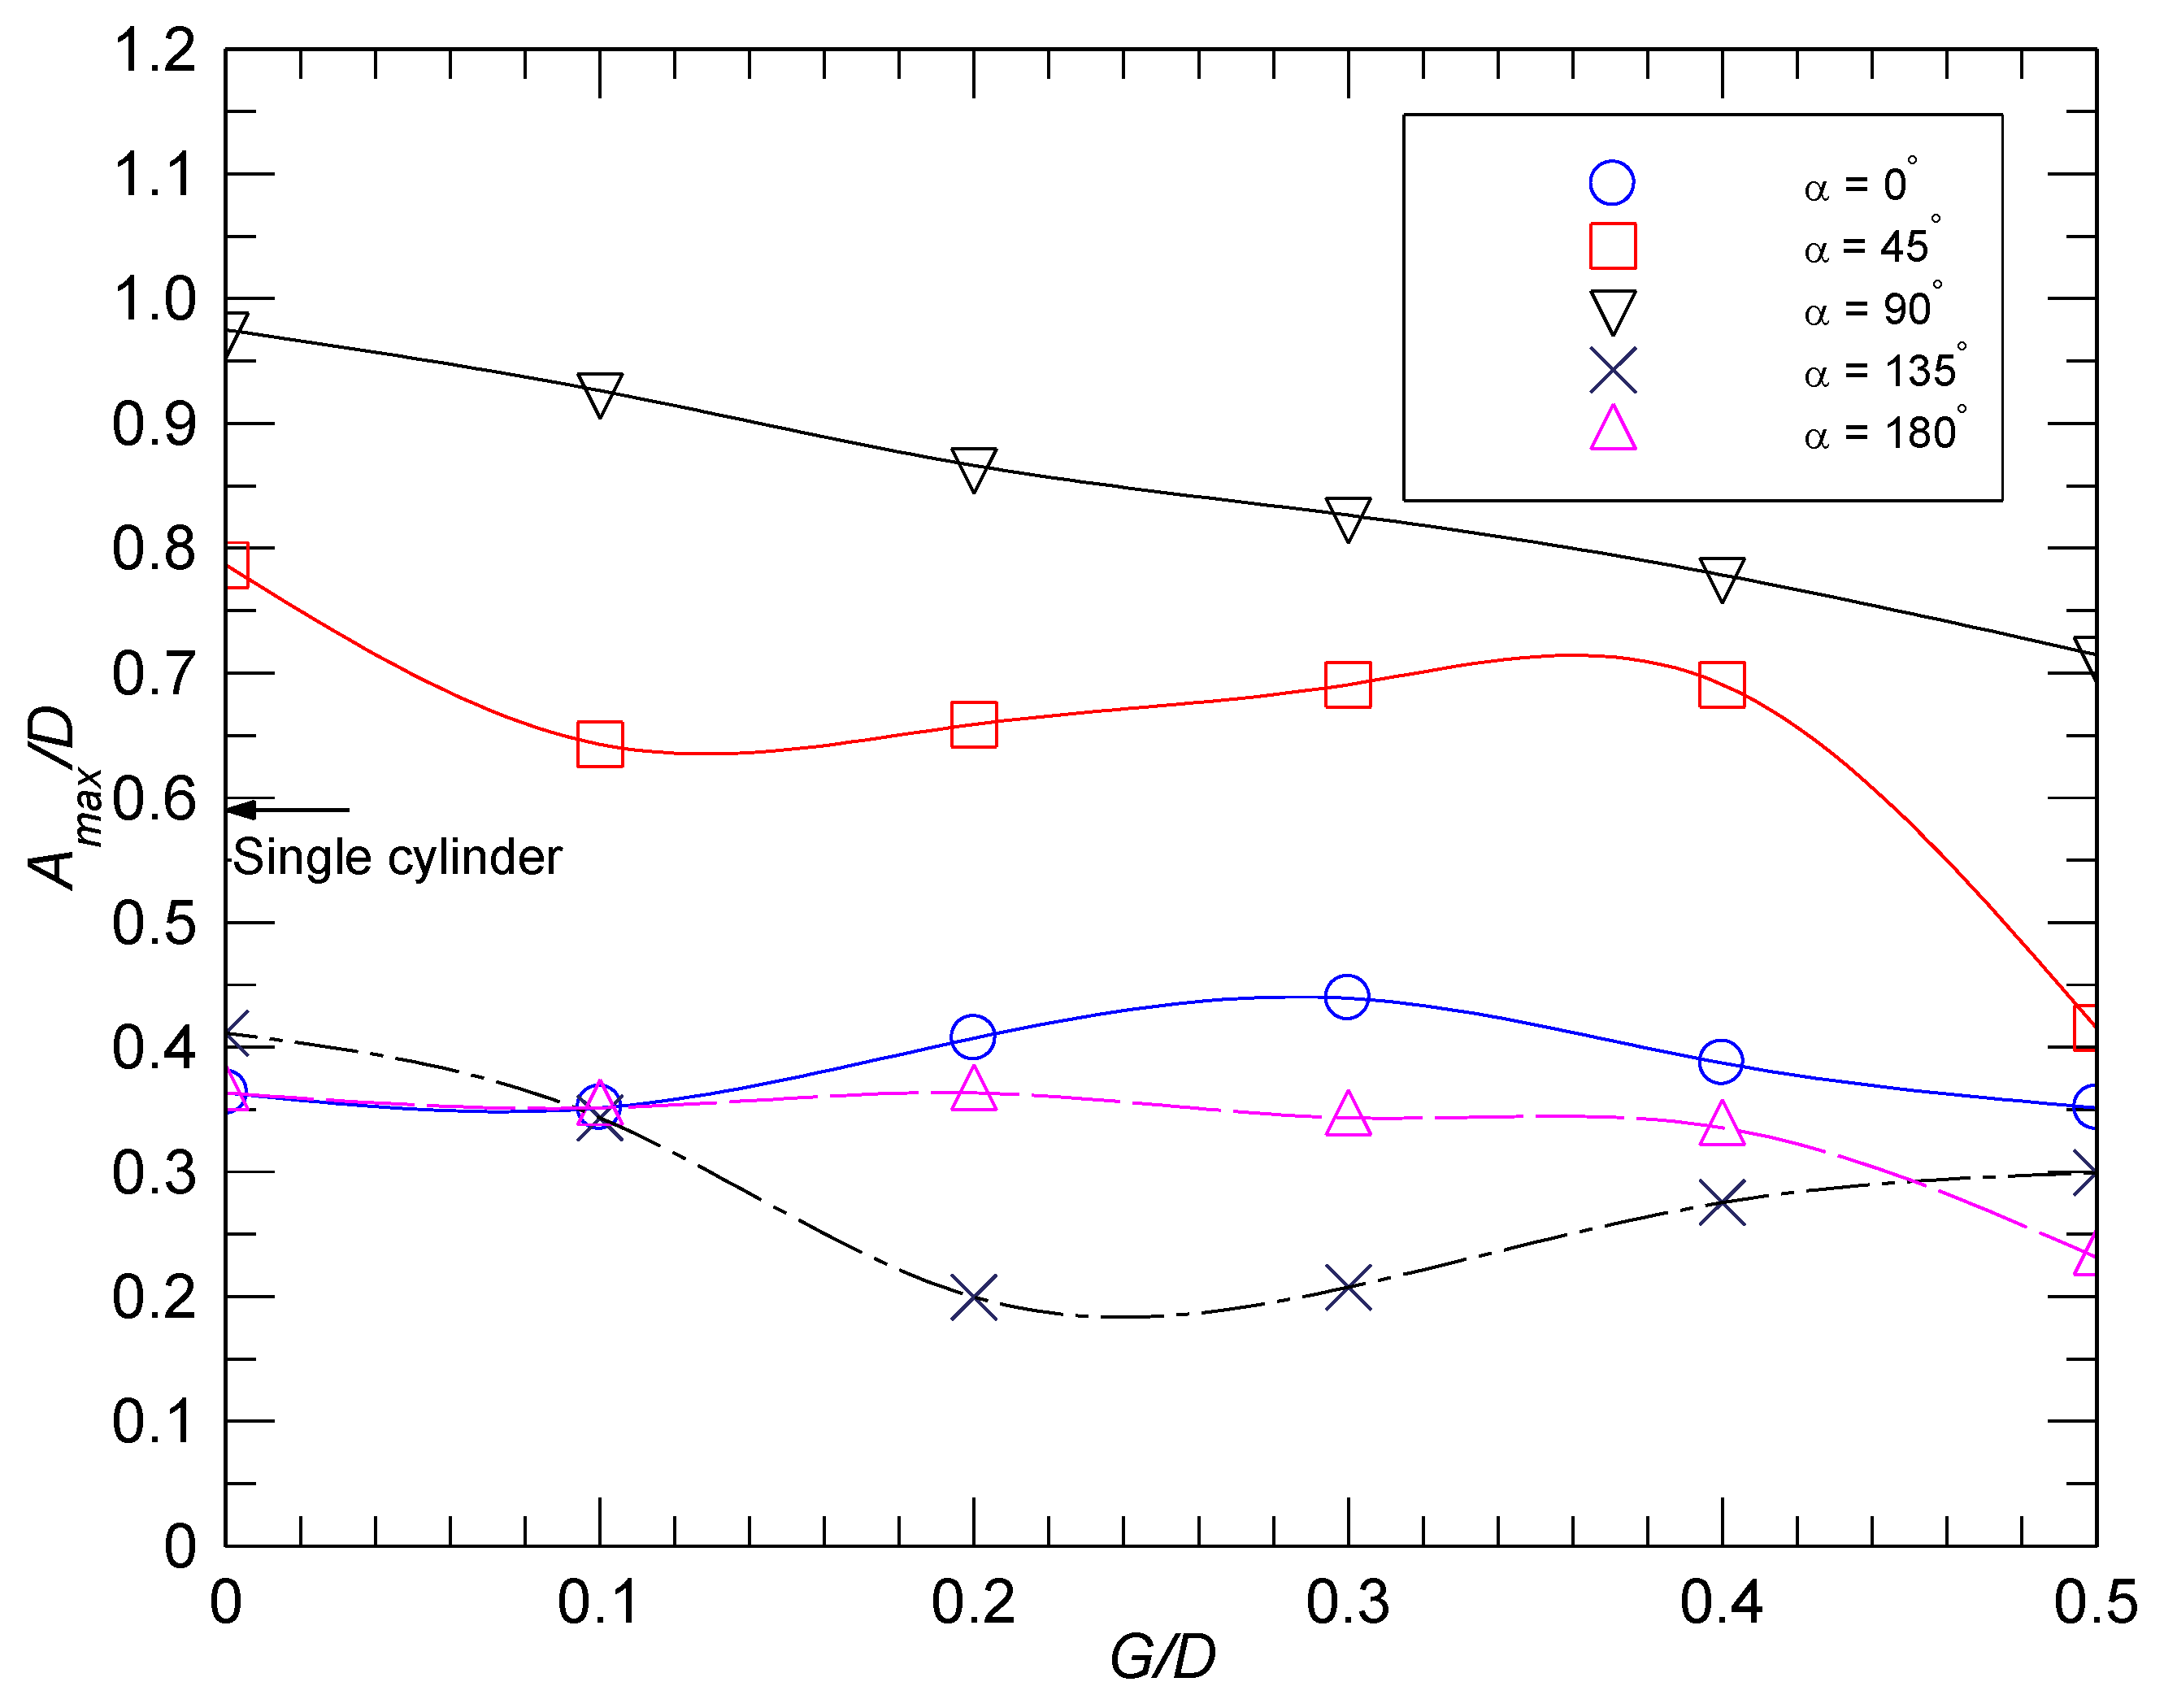
Figure 8 shows the variations in Amax/D with G/D for given position angles. The VIV response of the single cylinder is also included as a benchmark. It can be seen that the vibration amplitude for the single cylinder was greater than those of all other piggyback cylinders, except at α = 45° for G/D = 0–0.4 and at α = 90° for all gap ratios. Compared with Figure 7, varying G/D has less of an effect on Amax/D than varying α.
When α = 0°, there is no significant variation in Amax/D for any of the gap ratios. This trend is consistent with that reported by Rahmanian et al. [13]. This may be due to the symmetry of the cylinders with respect to the incoming flow. The amplitudes of vibrations for the piggyback pipeline at all gap ratios (Amax/D = 0.35–0.44) were smaller than that of the single cylinder (Amax/D = 0.59), indicating that the presence of the secondary cylinder reduces the amplitude of vibrations. In addition, for two stationary cylinders of d/D = 2/3 with α = 0° and G/D = 0.367, Gao et al. [4] also found that the cylinder pair behaved as a single bluff body. This gap ratio was within the critical value for a single-wake mode shedding, as suggested by Zhao et al. [2]. The shedding from the smaller cylinder was suppressed, and only shedding from the larger one could be identified. The upstream smaller cylinder appeared to have little or no influence on the flow patterns behind the downstream cylinder. However, this result is different from that when the two cylinders as a bundle with G/D = 0.4 were free to vibrate [13], where vortex shedding from both cylinders could be seen. During the process, when the cylinders oscillated, interaction between the vortices shed from the cylinders was observed. However, it can also be seen that the vortices generated by the smaller cylinder merged with those generated by the larger one, resulting in only one dominant frequency in the wake, which did not depend on the gap ratio (for G/D = 0.1–0.4).
When α = 45°, the largest value of Amax/D occurred for G/D = 0, then decreased to a relatively constant value throughout G/D = 0.1–0.4. The amplitude suddenly became the smallest for G/D = 0.5, as, under this condition, there was a clear vertical opening between the cylinders. The maximum amplitude for G/D = 0 could be due to fact that the two cylinders behaved more as one equivalent large cylinder as air was forced to flow around both cylinders. Once a gap was introduced, a sudden reduction was noticed as it became possible for air to flow between the cylinders, which interfered with the detached vortices from the top of the small cylinder and the bottom of the large one. The interference of the vortices led to slightly less stable vortex shedding downstream of the cylinders, resulting in a reduction in Amax/D. For G/D = 0.1–0.4, there was no clear vertical opening between the cylinders. Therefore, Amax/D remains quite stable over these gap ratios. For G/D = 0.5, the vertical gap was large, and the gap flow became apparent. The PIV results of Gao et al. [4] showed that, for stationary cylinders at α = 45° and G/D = 0.367, vortex shedding from the lower side of the smaller one was suppressed and vortices were identified downstream of the cylinder bundle. However, when the cylinder bundle was free to vibrate, Rahmanian et al. [13] found that, for G/D = 0.2, vortex shedding from the small cylinder could be suppressed or strengthened depending on the moving direction. Again, the vortices generated by the small cylinder merged with those generated by the large one, forming a wake with only one dominant frequency for all gap ratios.
The largest values of Amax/D occurred at α = 90° for all gap ratios, and they were larger than that of the single cylinder. This is because the pipeline bundle resembles that of a single bluff body. Zhao et al. [2] found regular shedding downstream of the bundle when G/D = 0.05. There was no shedding from the gap between the two cylinders, and the gap flow was too weak to influence the shedding process. As the gap ratio was increased, Amax/D decreased almost linearly. The reason for this reduction is that the pipeline bundle behaves gradually, as two individual cylinders as vortices are likely to form from the top of the large cylinder and from the bottom of the small cylinder, resulting in two independent wakes. The aforementioned discussion is supported by Zhao et al. [2], who found that for G/D = 0.1, in addition to the regular vortex shedding behind the two cylinders, vortices were shed regularly from the gap between two cylinders at a non-dimensional period of around 1.0. It was suggested that the shedding of the vortices from the gap was due to the interactions of the shear layers from the bottom edge of the small cylinder and the top edge of the large cylinder. At G/D = 0.3, Zhao et al. [2] found two vortex shedding processes, one from the large cylinder and the other from the small one, which interact with each other. This results in a steady decrease in Amax/D as G/D is increased. For two stationary cylinders at d/D = 0.367, Gao et al. [4] found that the gap flow deflection can be either toward the smaller cylinder, with a wider wake formed behind the larger cylinder and a narrower wake behind the smaller cylinder, or vice versa, supporting the previous results of Zdravkovich [6]. However, this phenomenon was not found by Zhao et al. [2]. This could be because of the slight difference in the gap ratio between the two studies. Rahmanian et al. [13] examined the flow characteristics around the cylinder bundle with G/D = 0.1 and 0.2 and found apparent shedding around the small cylinder. For G/D = 0.1, when the cylinders moved upwards, the shed vortices from the small cylinder were forced into the back side of the large one, resulting in interactions between the vortices generated by both cylinders. The interactions are also reflected by the high frequency oscillations in the time history of the force coefficients. When the cylinders moved downwards, the small cylinder was in the wake of the large one. As a result, there was no vortex shedding from the small cylinder, resulting in smooth time histories of the force coefficients. Similar results for G/D = 0.2 were found, except that the vortices from the small cylinder were not as close to the large cylinder as in the case of G/D = 0.1, and vortex shedding from the small cylinder appeared during the processes of both upward and downward movements.
When α was further increased to 135°, the values of Amax/D were smaller than that of the single cylinder for all gap ratios, with the largest amplitude occurring at G/D = 0. This is because, at G/D = 0, the cylinders performed as a single body. As G/D was increased, there was a drop in Amax/D, which reached a minimum value of 0.18 over G/D = 0.2–0.3. As G/D increased further to 0.4 and 0.5, a minor increase in Amax/D became evident. Gao et al. [4] found that when α = 135°, vortex shedding in the wake of the bundle was asymmetric and deflected towards the larger cylinder. In addition, even though the deflected shedding from the large cylinder can be seen clearly, the shedding from the lower side of the large cylinder was suppressed. This result is different from that at α = 45°, where vortices were formed in the shear layers generated by the outer surfaces of both cylinders. This could be the reason that the magnitudes of Amax/D at α = 135° were only around half of that at α = 45°.
At α = 180°, the magnitudes of Amax/D were still smaller than that of the single cylinder. In general, changing the gap ratio did not have a significant effect on Amax/D, except for G/D = 0.5, where an apparent decrease in Amax/D was observed. This trend is similar to that at α = 0°. This could be because both arrangements had the same projected diameter, regardless of the gap ratio, and behaved as a single bluff body [4]. The addition of the secondary cylinder at α = 180° made the pipeline streamlined, especially at G/D = 0.5, and the smaller cylinder was totally engulfed in the wake of the larger one [6,29]. Gao et al. [4] found that, for α = 180°, the vortex formation length measured from the center of the large cylinder was extended to x/D = 4, which is much larger than its counterpart at α = 0°. Due to the increase in vortex formation length, the interaction between the upper and lower shear layers was delayed and weakened, resulting in a reduction in VIV amplitude [31].

4. Conclusions

The VIV responses of a piggyback pipeline were investigated experimentally in a wind tunnel. Totally, 30 cases were considered, including six gap ratios and five position angles. The present results demonstrate the sensitivity of the pipeline’s maximum vibration amplitude to the position angles and the gap ratios so that the worst scenarios can be identified. They can be used to verify those obtained using numerical methods. They are also important for the design and operation of the offshore structures. However, it needs to be noted that, to provide full understanding of the VIV amplitudes for various cases, flow structures using PIV and hydrodynamic forces should be examined thoroughly in the future. The major conclusions are summarized as follows:
  • The position angle and gap ratio have significant effects on the amplitude of VIV. The maximum vibration amplitudes are higher in some configurations and lower in other configurations than that experienced by a single cylinder.
  • The minimum amplitude of vibration occurs around α = 135° for a gap ratio G/D = 0.2–0.3. The maximum amplitude of vibration occurs around α = 90° with G/D = 0 due to the large equivalent diameter.
  • The effect of gap ratio on the amplitude of VIV is also dependent on the position angle. Increasing the gap ratio generally reduces the amplitude of vibration, as the two cylinders behave less as one equivalent large cylinder and more as two independent cylinders. This effect is more obvious at α = 45°, 90°, and 135° than at other angles.
  • The introduction of a clear vertical gap or opening can significantly disrupt vortex shedding downstream, and, hence, reduce the amplitude of the VIV. This was noticed for α = 45° and 90°.

Author Contributions

Conceptualization, T.Z. and H.Z.; methodology, D.X., T.Z. and Z.H.; software, D.X. and Z.H.; validation, D.X.; formal analysis, D.X. and Z.H.; investigation, D.X.; resources, T.Z.; data curation, D.X. and T.Z.; writing—original draft preparation, D.X. and Z.H.; writing—review and editing, D.X., T.Z. and H.Z.; funding acquisition, T.Z. All authors have read and agreed to the published version of the manuscript.

Funding

This research was funded by Australian Research Council through ARC Discovery Projects grant number DP190103279.

Data Availability Statement

The data presented in this study are available on request from the corresponding author. The data are not publicly available due to ethical reasons.

Acknowledgments

The authors sincerely acknowledge Andrew Lalli for his contributions to some of the experiments.

Conflicts of Interest

The authors declare no conflicts of interest.

References

  1. Igarashi, T. 1982 Characteristics of a flow around two circular cylinders of different diameters arranged in tandem, 1st report. Bull. JSME 1982, 25, 349–357. [Google Scholar] [CrossRef]
  2. Zhao, M.; Cheng, L.; Teng, T.; Liang, D. Numerical simulation of viscous flow past two circular cylinders of different diameters. Appl. Ocean Res. 2005, 27, 39–55. [Google Scholar] [CrossRef]
  3. Alam, M.M.; Zhou, Y. Strouhal numbers, forces and flow structures around two tandem cylinders of different diameters. J. Fluids Struct. 2008, 24, 505–526. [Google Scholar] [CrossRef]
  4. Gao, Y.Y.; Wang, X.; Tan, D.S.; Keat, S.K. Particle image velocimetry technique measurements of the near wake behind a cylinder-pair of unequal diameters. Fluid Dyn. Res. 2013, 45, 045504. [Google Scholar] [CrossRef]
  5. Cheng, X.F.; Yang, J.; Xu, T.J.; Xu, Q. Study on Hydrodynamic Coefficients of a Submarine Piggyback Pipeline under the Action of Waves and Current. J. Mar. Sci. Eng. 2021, 9, 1118. [Google Scholar] [CrossRef]
  6. Zdravkovich, M.M. The effects of interference between circular cylinders in cross flow. J. Fluids Struct. 1987, 1, 239–261. [Google Scholar] [CrossRef]
  7. Zdravkovich, M.M. Review of interference-induced oscillation in flow past two parallel circular cylinders in various configurations. J. Wind. Eng. Ind. Aerodyn. 1988, 28, 183–199. [Google Scholar] [CrossRef]
  8. Zdravkovich, M.M. Flow Around Circular Cylinders, Volume 2: Applications; Oxford University Press: Oxford, UK, 2003. [Google Scholar]
  9. Medeiros, E.B.; Zdravkovich, M.M. Interference-induced oscillations of two unequal cylinders. J. Wind. Eng. Ind. Aerodyn. 1992, 41, 753–762. [Google Scholar] [CrossRef]
  10. Zang, Z.; Gao, F. Vortex shedding and vortex-induced vibration of piggyback pipelines in steady currents. In Proceedings of the Twenty-Second International Offshore and Polar Engineering Conference, Rhodes, Greece, 17–22 June 2012. [Google Scholar]
  11. Zang, Z.; Gao, F. Steady current induced vibration of near-bed piggyback pipelines: Configuration effects on VIV suppression. Appl. Ocean Res. 2014, 46, 62–69. [Google Scholar] [CrossRef]
  12. Zhao, M.; Yan, G. Numerical simulation of vortex-induced vibration of two circular cylinders of different diameters at low Reynolds number. Phys. Fluids 2013, 25, 083601. [Google Scholar] [CrossRef]
  13. Rahmanian, M.; Zhao, M.; Cheng, L.; Zhou, T. Two-degree-of-freedom vortex-induced vibration of two mechanically coupled cylinders of different diameters in steady current. J. Fluids Struct. 2012, 35, 133–159. [Google Scholar] [CrossRef]
  14. Khalak, A.; Williamson, C.H.K. Motions, forces and mode transitions in vortex-induced vibrations at low mass-damping. J. Fluids Struct. 1999, 13, 813–851. [Google Scholar] [CrossRef]
  15. Jauvtis, N.; Williamson, C.H.K. The effect of two degrees of freedom on vortex-induced vibration at low mass and damping. J. Fluid Mech. 2004, 509, 23–62. [Google Scholar] [CrossRef]
  16. Serta, C.P.V.; Janocha, M.J.; Yin, G.; Ong, M.C. Numerical simulations of flow-induced vibrations of two rigidly coupled cylinders with uneven diameters in the upper transition Reynolds number regime. J. Fluids Struct. 2021, 105, 103332. [Google Scholar] [CrossRef]
  17. Janocha, M.J.; Ong, M.C. Vortex-induced vibrations of piggyback pipelines near the horizontal plane wall in the upper transition regime. Mar. Struct. 2021, 75, 102872. [Google Scholar] [CrossRef]
  18. Chen, L.F.; Wu, G.X. Vortex-induced three-degree-of-freedom vibration of a piggyback circular cylinder system. Appl. Ocean. Res. 2022, 123, 103145. [Google Scholar] [CrossRef]
  19. Gao, Y.; Yang, S.; Wang, L.; Huan, C.; Zhang, J. Numerical Investigation on Vortex-Induced Vibrations of Two Cylinders with Unequal Diameters. J. Mar. Sci. Eng. 2023, 11, 377. [Google Scholar] [CrossRef]
  20. Yuan, W.; Sun, H.; Li, H.; Bernitsas, M.M. Flow-induced oscillation patterns for two tandem cylinders with turbulence stimulation and variable stiffness and damping. Ocean. Eng. 2020, 218, 108237. [Google Scholar] [CrossRef]
  21. Sukarnoor, N.I.M.; Quena, L.K.; Abu, A.; Siang, K.H.; Kuwano, N.; Desa, S.M. An investigation of the dynamic behaviour of two rigid cylinders in a tandem arrangement under vortex-induced vibration. J. Ocean Eng. Sci. 2022; in press. [Google Scholar]
  22. Pal, A.; Soti, A.K. Power harvesting from VIV of rigidly-coupled cylinders in tandem arrangement. In Proceedings of the 48th National Conference on Fluid Mechanics and Fluid Power (FMFP), BITS Pilani, Pilani Campus, Rajasthan, India, 27–29 December 2021. [Google Scholar]
  23. West, G.S.; Apelt, C.J. The effects of tunnel blockage and aspect ratio on the mean flow past a circular cylinder with Reynolds number between 104 and 105. J. Fluid Mech. 1982, 114, 361–377. [Google Scholar] [CrossRef]
  24. Xu, G.; Zhou, Y. Strouhal numbers in the wake of two incline cylinders. Expts. Fluids 2004, 37, 248–256. [Google Scholar] [CrossRef]
  25. Kline, S.J.; McClintock, F.A. Describing uncertainties in single experiments. Mech. Eng. 1953, 75, 3. [Google Scholar]
  26. Moffat, R.J. Using uncertainty analysis in the planning of an experiment. J. Fluids Eng. 1985, 107, 173. [Google Scholar] [CrossRef]
  27. Moffat, R.J. Describing the uncertainties in experimental results. Exp. Therm. Fluid Sci. 1988, 1, 3. [Google Scholar] [CrossRef]
  28. Hover, F.S.; Triantafyllou, M.S. Vortex-induced vibrations of a cylinder with tripping wires. J. Fluid Mech. 2001, 448, 175–195. [Google Scholar] [CrossRef]
  29. Franzini, G.R.; Fujarra, A.L.C.; Meneghini, J.R.; Korkischko, I.; Franciss, R. Experimental investigation of vortex-induced vibration on rigid, smooth and inclined cylinders. J. Fluids Struct. 2009, 25, 742–750. [Google Scholar] [CrossRef]
  30. Sumer, B.M.; Fredsøe, J. Hydrodynamics around Cylindrical Structures; World Scientific: Singapore, 2006. [Google Scholar]
  31. Feng, C.C. The measurement of vortex induced effects in flow past stationary and oscillating circular and D section cylinders. Master’s Thesis, University of British Columbia, Vancouver, BC, Canada, 1968. [Google Scholar]
  32. Sarpkaya, T. A critical review of the intrinsic nature of vortex-induced vibrations. J. Fluid Struct. 2004, 19, 389–447. [Google Scholar] [CrossRef]
  33. Wang, X.; Cheng, L. Vortex shedding around two circular cylinders of different diameters. In Proceedings of the Ninth International Offshore and Polar Engineering Conference, Brest, France, 30 May–4 June 1999. [Google Scholar]
Figure 1. Experimental setup. (a): Cylinder arrangements; (b) setup for the VIV tests.
Fluids 09 00039 g001
Figure 2. Free-decay tests for the single and piggyback cylinders. (a) Example of the free-decay vibration signal for the primary cylinder; (b) FFT of the vibration signals.
Fluids 09 00039 g002
Figure 3. Typical reading of the vibration time series from the LVDT. (a) Original reading; (b) a zoom-in view to highlight the transition period (80–110 s).
Fluids 09 00039 g003
Figure 4. Frequency ratio fs/fn of a single cylinder for different reduced velocities. ○: Present; □: Khalak and Williamson [14]; ●: Franzini et al. [29];   : linear the fit to [14] outside the lock-on region;   : linear the fit to the present data outside the lock-on region.
Fluids 09 00039 g004
Figure 5. Comparison of the non-dimensional vibration amplitudes for a single cylinder. ○: Present data (in air); Δ: Feng [31] (in air); □: Khalak and Williamson [14] (in water); ●: Franzini et al. [29] (in water).
Fluids 09 00039 g005
Figure 6. Comparison of vibration amplitudes of a single cylinder with those for the two-cylinder system at different gap ratios and position angles. (a) G/D = 0; (b) G/D = 0.1; (c) G/D = 0.2; (d) G/D = 0.3; (e) G/D = 0.4; (f) G/D = 0.5.
Fluids 09 00039 g006
Figure 7. Maximum vibration amplitudes for different gap ratios (G/D = 0–0.5) at various position angles.
Fluids 09 00039 g007
Figure 8. Maximum vibration amplitudes for different position angles (α = 0°–180°) at various gap ratios. The arrow pointing to the ordinate indicates the value for the single cylinder.
Fluids 09 00039 g008
Disclaimer/Publisher’s Note: The statements, opinions and data contained in all publications are solely those of the individual author(s) and contributor(s) and not of MDPI and/or the editor(s). MDPI and/or the editor(s) disclaim responsibility for any injury to people or property resulting from any ideas, methods, instructions or products referred to in the content.