Article

Characterization of Oscillatory Response of Light-Weight Wind Turbine Rotors under Controlled Gust Pulses

Department of Mechanical Engineering-Engineering Mechanics, Michigan Technological University, Houghton, MI 49931, USA
*
Author to whom correspondence should be addressed.
Fluids 2024, 9(4), 83; https://doi.org/10.3390/fluids9040083
Submission received: 31 January 2024 / Revised: 15 March 2024 / Accepted: 22 March 2024 / Published: 26 March 2024
(This article belongs to the Special Issue Computational Fluid Dynamics in Fluid Machinery)

Abstract

:
Given the industry-wide trend of continual increases in the size of utility-scale wind turbines, a point will come where reductions will need to be made in terms of the weight of the turbine’s blades to ensure they can be as long as needed without sacrificing structural stability. One such technique that may be considered is to decrease the material used for the shell and spar cap. While this will solve the weight issue, it creates a new one entirely—less material for the shell and spar cap will in turn create blades that are more flexible than what is currently used. This article aims to investigate how the oscillatory response of light-weight wind turbine rotors is affected by these flexibility changes. The object of our study is the Sandia National Lab National Rotor Testbed (SNL-NRT) wind turbine, which the authors investigated in the course of a research project supported by SNL. Using a reduced-order characterization (ROC) technique based on controlled gust pulses, introduced by the authors in a previous work, the aeroelastic dynamics of the NRT’s original baseline blade design and several of its flexible variations were studied via numerical simulations employing the CODEF multiphysics suite. Results for this characterization are presented and analyzed, including a generalization of the ROC of the SNL-NRT oscillatory dynamics to larger machines with geometrical similarity. The latter will prove to be valuable in terms of extrapolating results from the present investigation and other ongoing studies to the scale of current and future commercial machines.

1. Introduction

Considering the ongoing trend of continually increasing the overall size of wind turbines, their swept area and capacity, it is logical to conclude that a point will come when the blades for said state-of-the-art turbines will need to be adjusted due to size and manufacturing limitations. One such adjustment that can be expected is for blades to be made lighter by decreasing the overall material used in the creation of the blade, both the internal spar cap structure and the outer shell casing. This will, in turn, result in turbine blades that are more flexible during their operation. This increase in blade flexibility is then something that must be considered as turbine design moves forward so that appropriate control strategies can be devised to deal with this new and unique situation.
The issue, however, with needing to study such large turbines is that wind tunnel testing is precluded as an option, considering one of the largest wind tunnels in the world is only 24.4 by 36.6 meters [1]. On the other hand, the National Renewable Energy Laboratory (NREL) 5MW Reference Wind Turbine (5MW-RWT), designed in 2009, already had a hub height of 90 meters and a diameter of 126 meters (see Jonkman et al. [2]). Therefore, computational modeling is going to need to be used for results on large-scale turbines to be obtained.
In terms of the flow modeling, there are many different computational flow models that could be considered. Some of them are based on the classical Reynolds-Averaged Navier–Stokes (RANS) [3,4,5]; others use Large Eddy Simulation (LES) [6,7,8,9,10] or even Direct Numerical Solution (DNS) [11] or reduced-order analysis [12]. Given the range of available techniques, there is also a range of accuracy and computational cost [13,14]. The issue with these flow models is that they are not integrated with the structural models that would be needed to study blade oscillations.
Successful reduced-order models for integrated aeroelastic dynamics have been created with the Blade Element Momentum (BEM) technique (see Manwell et al. [15] and Burton et al. [16], among others). Given the large variety of BEM model implementations and the user-specific nature for the inputs into the system, BEM model results can vary widely, depending on their individual level of sophistication.
A new multiphysics modeling suite was developed and validated, compared with the NREL-5MW and other benchmark turbines (see Ponta et al. [17]). This new multiphysics suite, dubbed the Common ODE Framework (CODEF), was able to account for the dynamic aeroelastic response of wind turbine blades. The aeroelastic modules in CODEF ensure that any changes in rotor geometry due to blade deformation affecting blade-section attitude against the incoming wind are accounted for in real time. While some discussion is given in Section 2 regarding the inner workings of CODEF and its modules, full details can be read in Ponta et al. [17] and several other works by the authors, which cover the use of CODEF for wind turbine simulations under several different scenarios.
In previous works [18], the authors conducted a wide range of experiments on the DU-5MW-RWT [19], a stall-controlled alternative to the NREL-5MW benchmark turbine [2]. This was performed to assess the effects of rapid wind fluctuations on the turbine’s operational conditions in terms of the frequency content and time evolution of the rotor’s oscillatory aeroelastic response. Various gust conditions were tested at different wind speeds, which were represented by pulses of different amplitude and time-span. These gusts occurred in an otherwise constant wind regime. This allowed the study of the pure aeroelasto-inertial dynamics of the rotor’s response in a controlled manner, which reproduced each one of the different combinations of gusts found in real-word scenarios. At the end of the case study, a reduced-order characterization (ROC) of the rotor’s dynamics, as an oscillatory system, was created on the basis of energy transfer principles. The results obtained were then able to be readily generalized to any machine with geometrical similarity.
The purpose of this paper is to apply the same ROC technique to the analysis of the Sandia National Lab (SNL) National Rotor Testbed (NRT) wind turbine. The simulations presented here were able to provide valuable insight on several aspects of the underlying physics determining the NRT rotor dynamics.
The NRT rotor is designed to be installed and tested at SNL’s Scaled Wind Farm Technology (SWiFT) facility in Lubbock, Texas [20,21,22]. The tests reported include the NRT’s baseline blade rotor configuration and several constructive variations involving changes in blade flexibility. Important factors like the effect of blade flexibility and distributed mass in the level of aerodynamic damping and the associated decay time of shock-induced oscillations have been elucidated.
Another effort, discussed at the end of Section 3.3 in this article, involves a generalization of the ROC of the SNL-NRT oscillatory dynamics to larger machines with geometrical similarity. This will prove to be valuable in terms of extrapolating results from the present investigation and other ongoing studies conducted on the 27 m diameter SNL-NRT prototype to the scale of current and future commercial machines.

2. Materials and Methods: The CODEF Model and Its Aeroelastic Modules

The following section will focus on the theoretical background involved in CODEF and its aeroelastic sub-models: the Generalized Timoshenko Beam Model (GTBM) and the Dynamic Rotor Deformation–Blade Element Momentum (DRD-BEM) model. The CODEF suite also includes a farm flow simulation module, the Gaussian Vortex Lattice Model (GVLM). In order to make this paper self-contained, a brief description of GVLM will also be included, even though the focus of this article is on single-turbine simulation and blade deformation dynamics.

2.1. The CODEF Multiphysics Model for Wind Turbine/Wind Farm Dynamics and Its Modules

By using an adaptive multivariable ODE solution in time, the CODEF suite is able to simulate the multiphysics dynamics of wind turbines operating as individual units in the context of a wind farm collective. Utilizing a non-linear adaptive algorithm with both a variable time-step and variable order, a master ODE system is created by gathering the equations for modeling the rotor flow, blade structure, control system and electro-mechanical devices (see Figure 1).
To deal with such a complex multiphysics model, CODEF ensures stability and computational efficiency via the use of local truncation error evaluation after every time-step. All of this leads to the ability to model the complex aeroelastic dynamics that are associated with wind turbine blades during operation and due to needed control actions. With the use of the GVLM module, CODEF is also able to simulate wind-farm-scale flow, electrical interactions within the farm and overall control actions that may need to be taken by the wind farm collective.
The following details the key modules of CODEF:
  • Dynamic Blade Structural Model:
The CODEF blade structural module is based on the GTBM technique, which utilizes the same variables found in the classic Timoshenko Beam Theory; however, a modification was made that the hypothesis of beam sections remaining planar during deformation is no longer followed. Rather, interpolation by a 2-D finite-element mesh is used to simulate the actual warping of the beam that would occur. The original 3-D blade structure is then reduced to a 1-D finite-element problem. This 1-D problem is solved via the non-linear, time-dependent solution of an ODE system corresponding to an equivalently stiff complex beam characterized by a fully populated 6 × 6 stiffness matrix. This matrix does include coupled deformation modes, such as bend-twist, with the solution to the structural dynamics being obtained during each time-step of the ODE. A schematic representation of the GTBM process is shown in the bottom box of Figure 2. Further information can be found in the work of Ponta et al. [17] and the references cited in that work.
2.
Individual Turbine Flow Model:
A reformulation BEM technique allows DRD-BEM to provide a fully coupled aeroelastic model which, when paired with GTBM, fully includes dynamic rotor deformation effects. In its original form, DRD-BEM was developed as an individual turbine multiphysics model [17]. Additionally, it was also designed to interface with the farm-scale collective flow through integration with other numerical techniques, like GVLM. A brief description of the DRD-BEM is provided in Section 2.2.
3.
Wind Farm Flow Model:
With a moderate computational cost, the GVLM module of CODEF offers a high-fidelity option for collective farm-flow simulation. Consisting of an ensemble of Gaussian-core vortex filaments, GVLM represents the lattices generated by all the individual turbines in the farm. Flow information from the ensemble of the collective farm flow is shared by GVLM with all the individual turbines and with their corresponding DRD-BEM modules.
The Gaussian distribution of vorticity in the cores of the GVLM filaments all over the farm flow field account for the natural viscous decay of vortex cores. An overall freeing of computer memory results from the elimination of vortices that have already decayed to the point that their induced velocities are no longer relevant. This translates into less computational cost when compared to traditional vortex models that do not have vortex filament decay. High and unrealistic values of vortex-filament-induced velocity caused by close proximity between vortex filaments using the Biot–Savart law (with its singularity concentration of vorticity at the filaments’ axis) is also avoided.
Further details regarding the free vortex lattice technique and the related phenomenon of velocity induction by vortex filaments can be found in the work of Ponta and Jacovkis [23], Strickland et al. [24], Cottet and Koumoutsakos [25] and Karamcheti [26]. The theoretical principles behind Gaussian-core vortices and vortex core formation are extensively covered in the work of Ponta [27], Lamb [28], Batchelor [29], Trieling et al. [30], Flór and van Heijst [31] and Hooker [32].
With the general module structure of CODEF defined, more specifics will now be given about the DRD-BEM module.

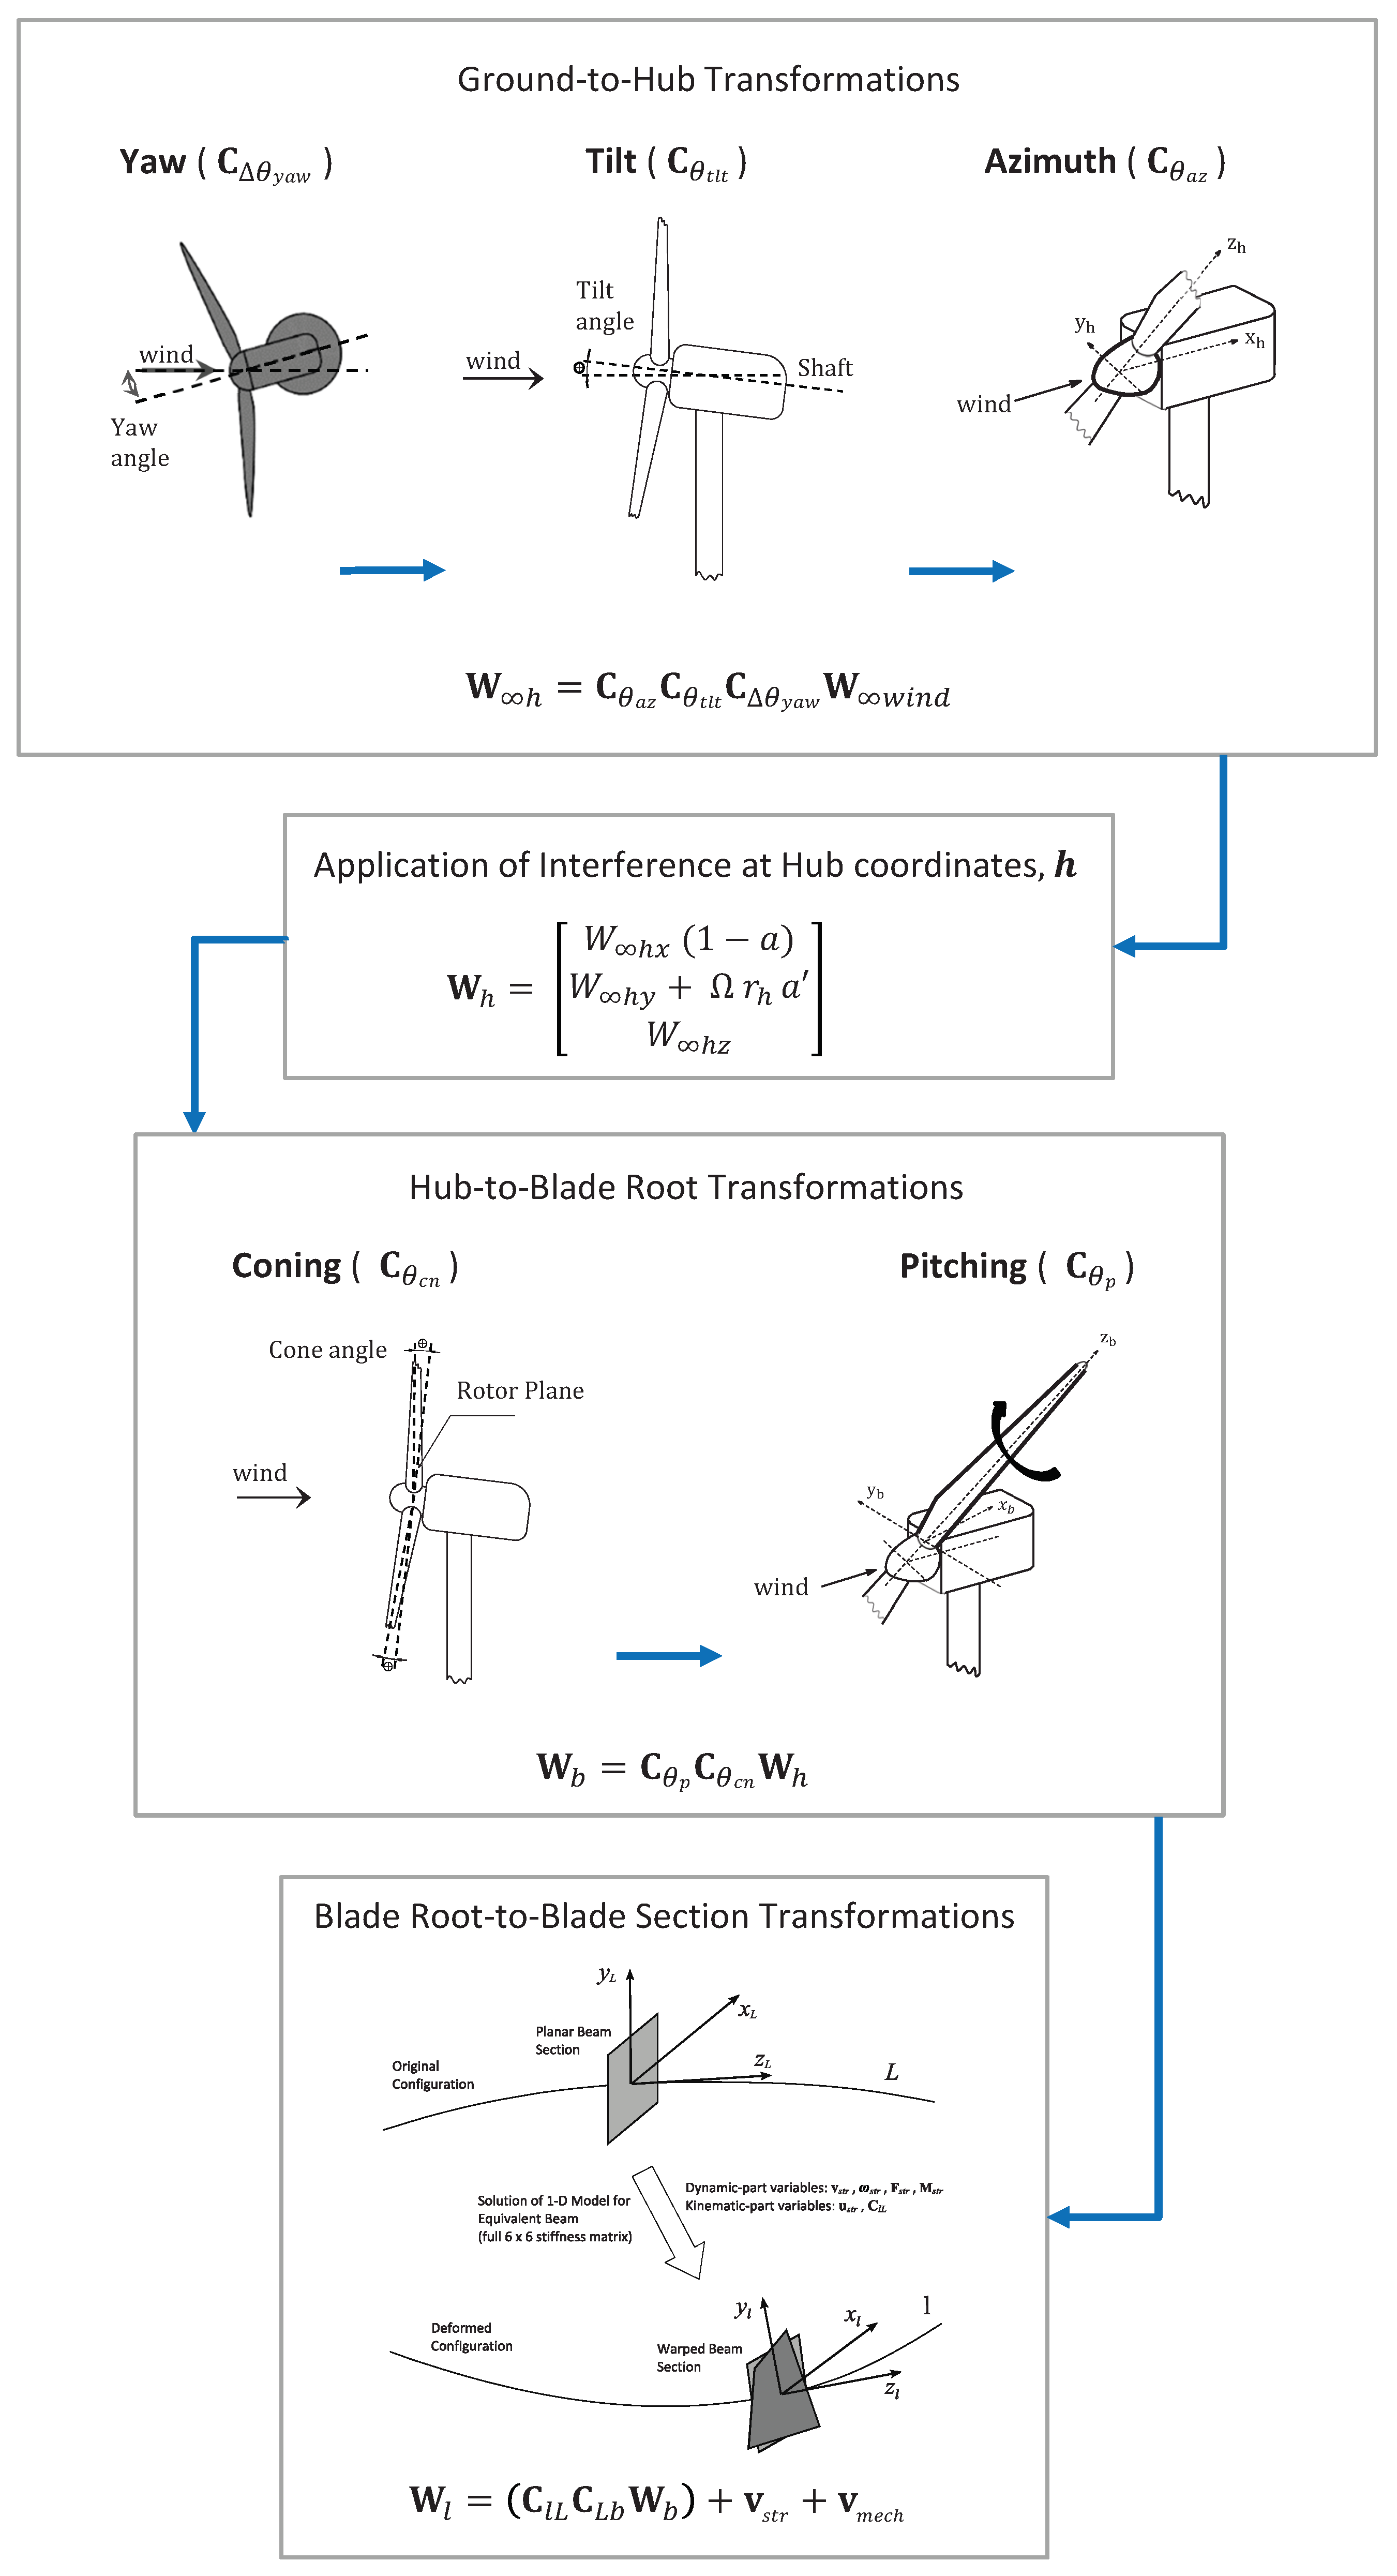
2.2. The DRD-BEM Model

In the DRD-BEM module, the incoming wind velocity in the ground reference system, W w i n d , is transformed through a series of orthogonal matrix linear operators. This gives the velocity vector in the system of coordinates of the blade section in its instantaneous deformed configuration, W l .
The DRD-BEM technique fully includes the effects of the misalignment induced by large rotations of the airfoil sections due to blade deformation in the computation of the aerodynamic forces acting on each blade element. It also includes misalignment induced by the action of mechanisms like yaw, pitch and main shaft rotation, by blade design features like twist, pre-bending and sweep and by rotor design features like tilt or coning.
Figure 2 shows a schematic flowchart diagram illustrating the series of coordinate transformations involved in the DRD-BEM process.
An example of an orthogonal matrix linear operator to account for pitch control actuation is:
C θ p = cos ( θ p ) sin ( θ p ) 0 sin ( θ p ) cos ( θ p ) 0 0 0 1 .
The first three transformation operations project the wind velocity defined in the ground coordinate system, W w i n d , into the undisturbed wind velocity referred to as the hub coordinate system
W h = C θ a z C θ t l t C Δ θ y a w W w i n d ,
where C θ a z accounts for blade rotation around the main shaft, C θ t l t accounts for nacelle tilt and C Δ θ y a w accounts for the turbine’s yaw offset.
Then, the undisturbed wind velocity in the hub coordinate system, W h , is modified to account for the rotor’s interference by the application of the axial and angular velocity induction factors, a and a :
W h = W h x ( 1 a ) W h y + Ω r h a W h z ,
where W h is the actual velocity field in the hub’s coordinate system, Ω is the angular velocity of the rotor and r h is the instantaneous radial distance of a generic blade section to the center of the hub.
Finally, W h is transformed into the blade section coordinates
W l = C l L C L b C θ p C θ c n W h + v s t r + v m e c h .
where W l is the wind velocity relative to the blade section, C θ c n is a linear operator taking into account the coning angle for the rotor, C θ p accounts for blade pitch rotation, C L b accounts for the rotation of the blade sections due to blade twist, pre-bending or back-sweep intrinsic to the blade’s geometrical design in its original (non-deformed) configuration and C l L accounts for the rotations of the blade section due to structural deformations and is provided by the solution of the structural model GTBM. Here, velocity components on the blade section due to structural vibration, v s t r , and the action of mechanisms, v m e c h , are also added.
Aerodynamic forces on the blade sections are computed by using the drag and lift coefficients of the sections’ airfoil profiles, the relative incident velocities and the angles of attack, to obtain the aerodynamic load for each blade element, δ F r e l , expressed in the blade section coordinate system. Then, δ F r e l is transformed back to the hub coordinates via the inverse of the linear operators (i.e., the transpose of the original orthogonal matrices) to obtain
δ F h = C θ c n T C θ p T C L b T C l L T C L t h a l δ F r e l ,
where C L t h a l is a linear operator that projects force components of lift and drag onto the chord-normal and chord-wise directions as defined in the bade airfoil section coordinate system l.
The axial and tangential components of δ F h are then equated to the change in linear and angular momentum in the incident flow to compute the a and a interference factors as in the classical BEM technique [15,16]. The aerodynamic forces on the blade sections are also used as input to the GTBM structural model. Full details about DRD-BEM’s mathematical derivations and other aspects could be found in Ponta et al. [17].
In terms of the computational infrastructure employed in the simulations presented here, these tests were conducted using the last version of CODEF, which has been expanded into a parallel evolution of the code that could be run in multi-core computers, in this particular case, a 64-core Lenovo, ThinkStation P620 workstation. Besides the possibility of running several single-turbine simulations simultaneously (as it was performed in the present study), this parallelization of CODEF allows the modeling suite to simulate large wind farms of up to 20 turbines in the current 64-core platform, with a potential expansion of up to 80 turbines in a 256-core platform that will be available in the foreseeable future.

3. Results: A Characterization of the Oscillatory Dynamics of the SNL-NRT Rotor

Various gust conditions were represented by specified pulses of different amplitude and time-span, applied onto an otherwise constant wind regime. This allowed the study of the pure aeroelasto-inertial dynamics of the rotor’s response in a controlled manner, which reproduced each one of the different combinations of gusts found in real-world scenarios. The potential sources of fluctuations in the rotor wind speed’s operational conditions that may occur in the real-world environment can be summarized into roughly four basic categories:
  • Pulses created by the cyclical motion of the blades traversing through a variable flow field: These correspond to an analysis situation of Steady-In-The-Average (SITA) wind conditions, where the stimuli of the aerodynamic load fluctuations come from the cyclical motion of the blades traversing through a variable flow field caused by wind shear, tilt and yaw.
    In these SITA cases, the frequency of fluctuations is mostly dominated by the rotor’s turning speed, which is comparatively slow versus other stimuli. It could be hypothesized that differences in dynamic response between the baseline blade and its more flexible variations are likely to become more intense when rapid temporal fluctuations, based on anemometry data, are added to the input wind. This is due to the fact that the different natural frequencies on the aeroelastic response of blades of different flexibility will be activated by short-term pulses in the wind signal. This will also affect the vortex-shedding process of the blades, altering the wake patterns for each of the different flexible variations.
  • Pulses in the time signals of wind speed registered in the anemometry data: These have been typified and classified, according to amplitude and duration, in the previous work by the authors presented in Jalal et al. [18]. Section 3.1 of the present study, which covers the dynamics of the SNL-NRT rotor and its flexible variations, adopts the same pulse classification.
  • Pulses created by the wake of a turbine located upwind: These have also been studied as part of the main body of the current research project. Because of the extension of that research thrust, results for those types of pulses are presented and discussed in a separate paper by the authors, which covers the aeroelastic response and wake characteristics of the SNL-NRT rotor and its flexible variations, when operating in a twin-turbine tandem configuration following a physical layout similar to the one at the SNL-SWiFT facility.
  • Pulses created by the rapid application of control actions, like variable-speed operation, pitching, yawing or the eventual operation of flow control devices such as flaps: For the set of tests planned for the present study, it was the first three categories of pulses that were of interest. Pulses related to control actions were not designed or tested for the NRT rotor. As an outlook for further work, appropriate control actions may be elucidated from the present study, which can then be tested to see how a control action pulse affects the flexible blades.

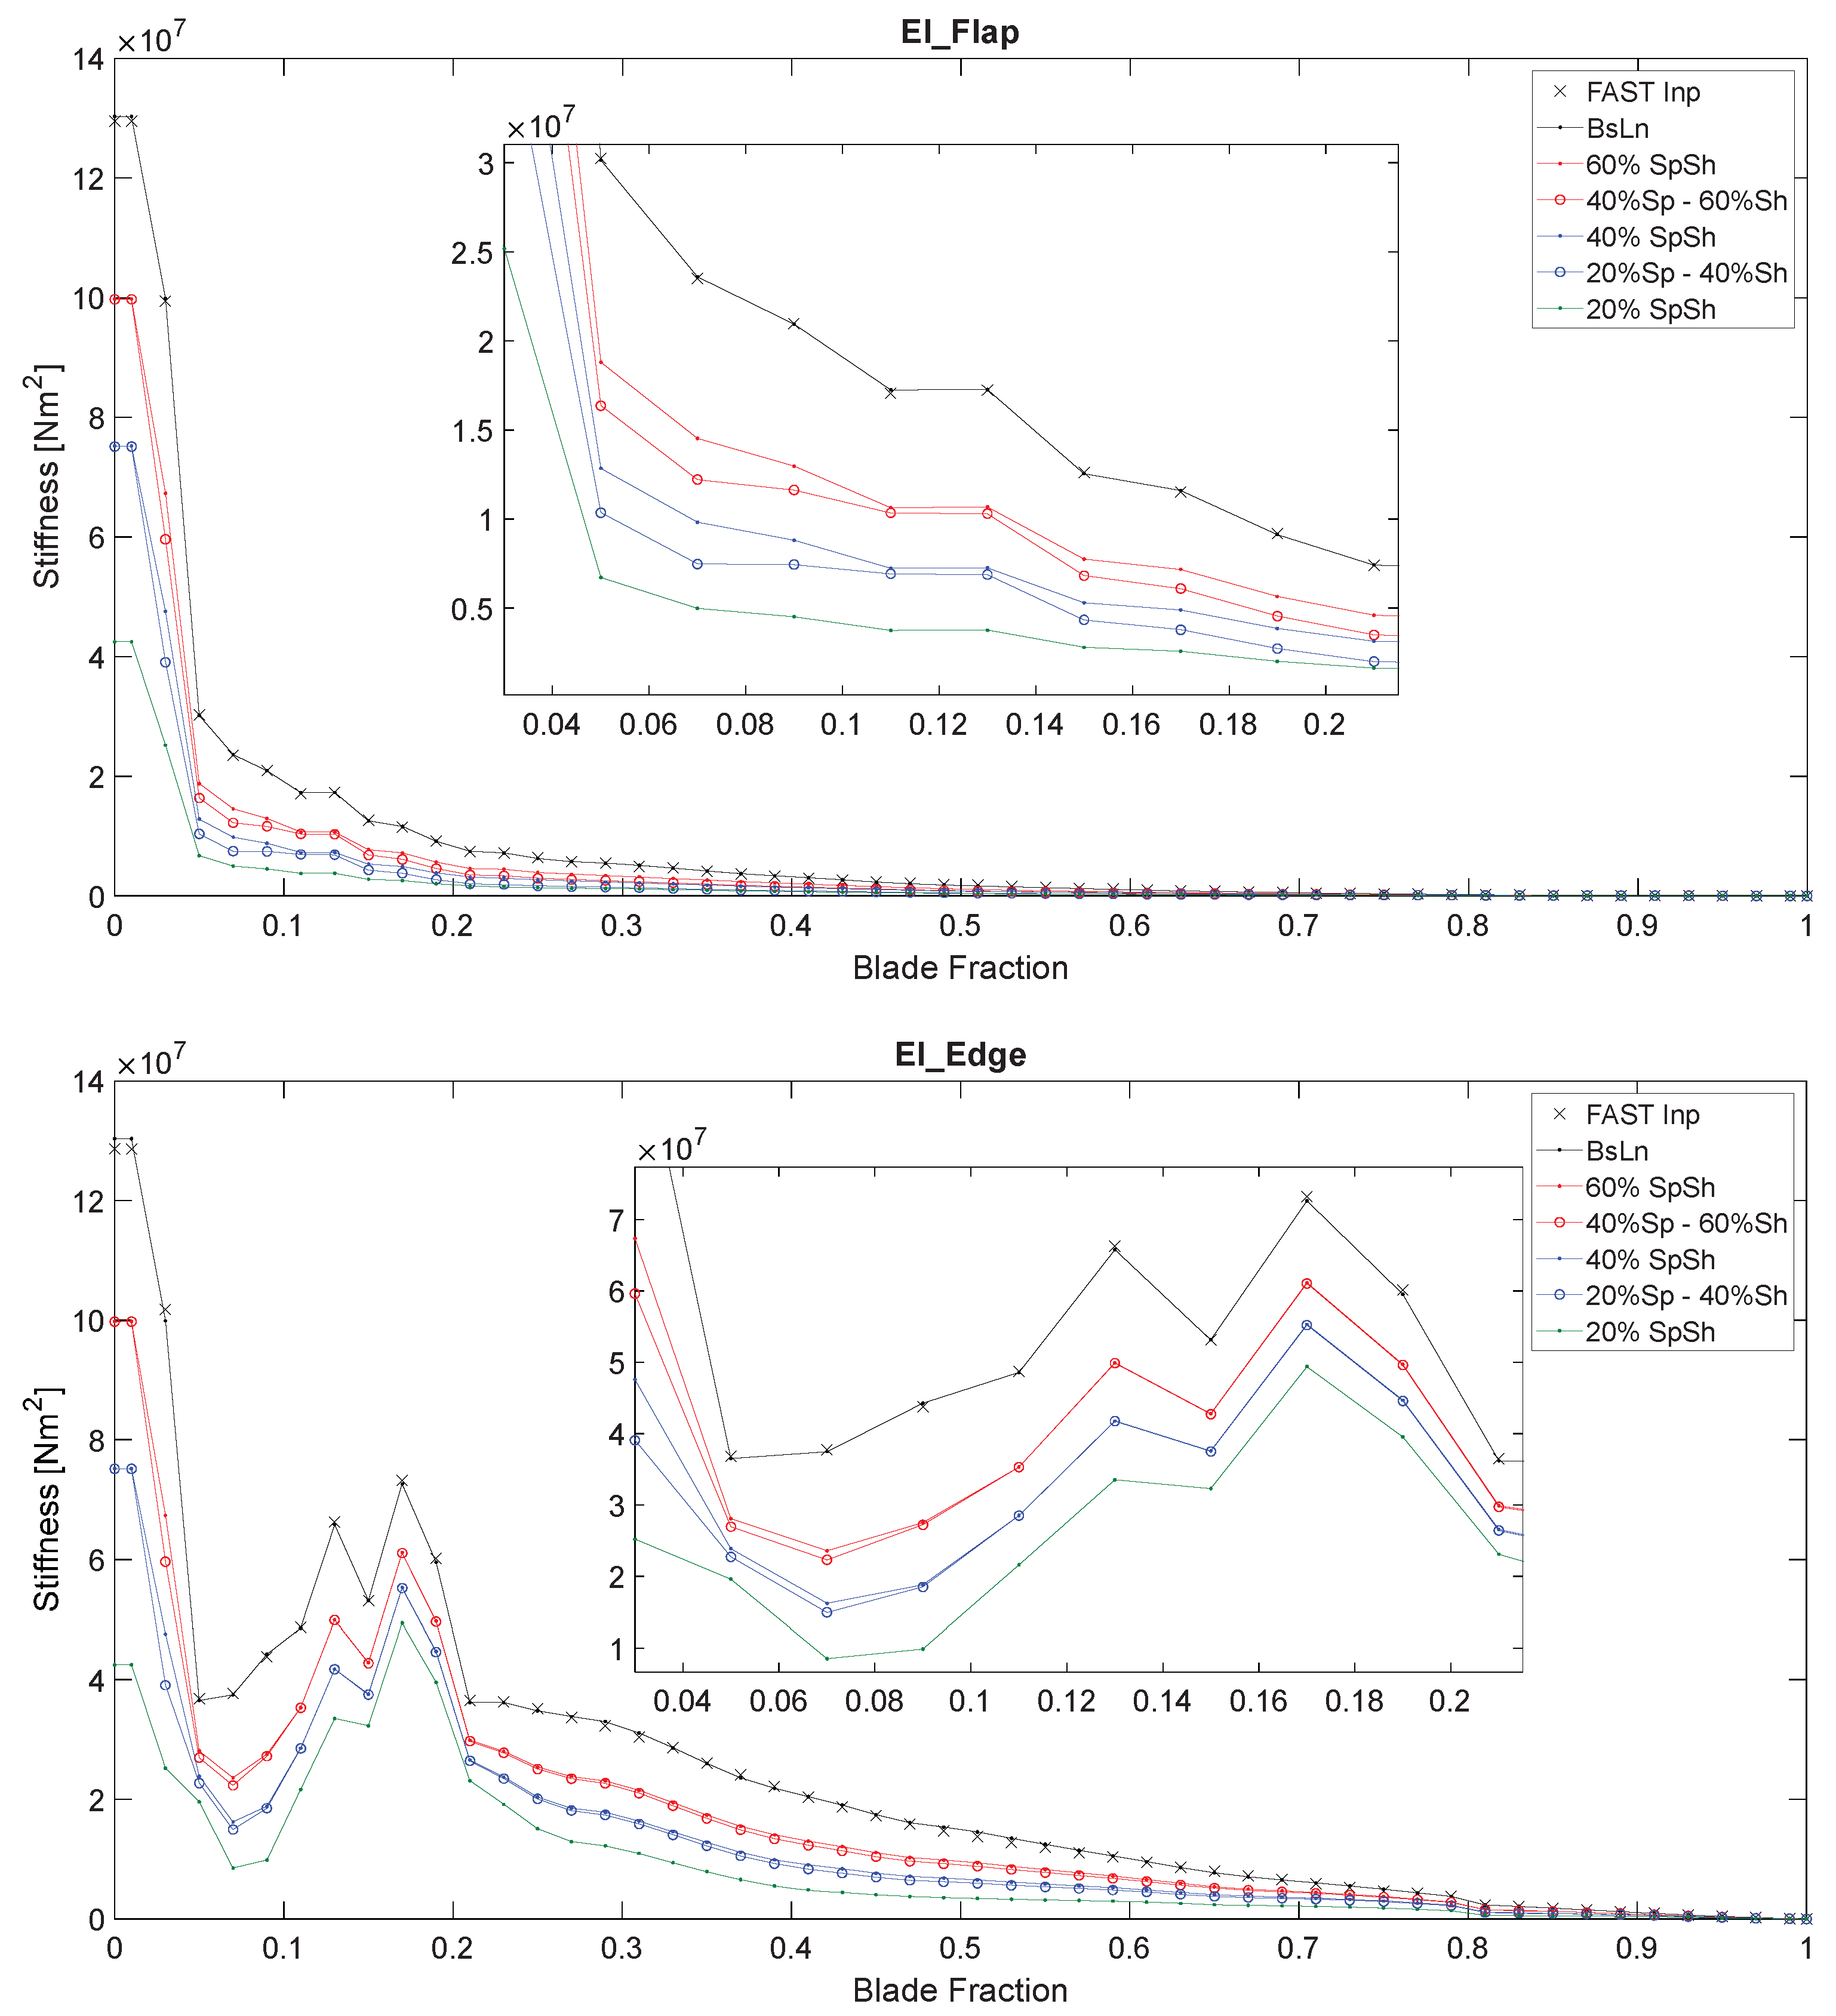
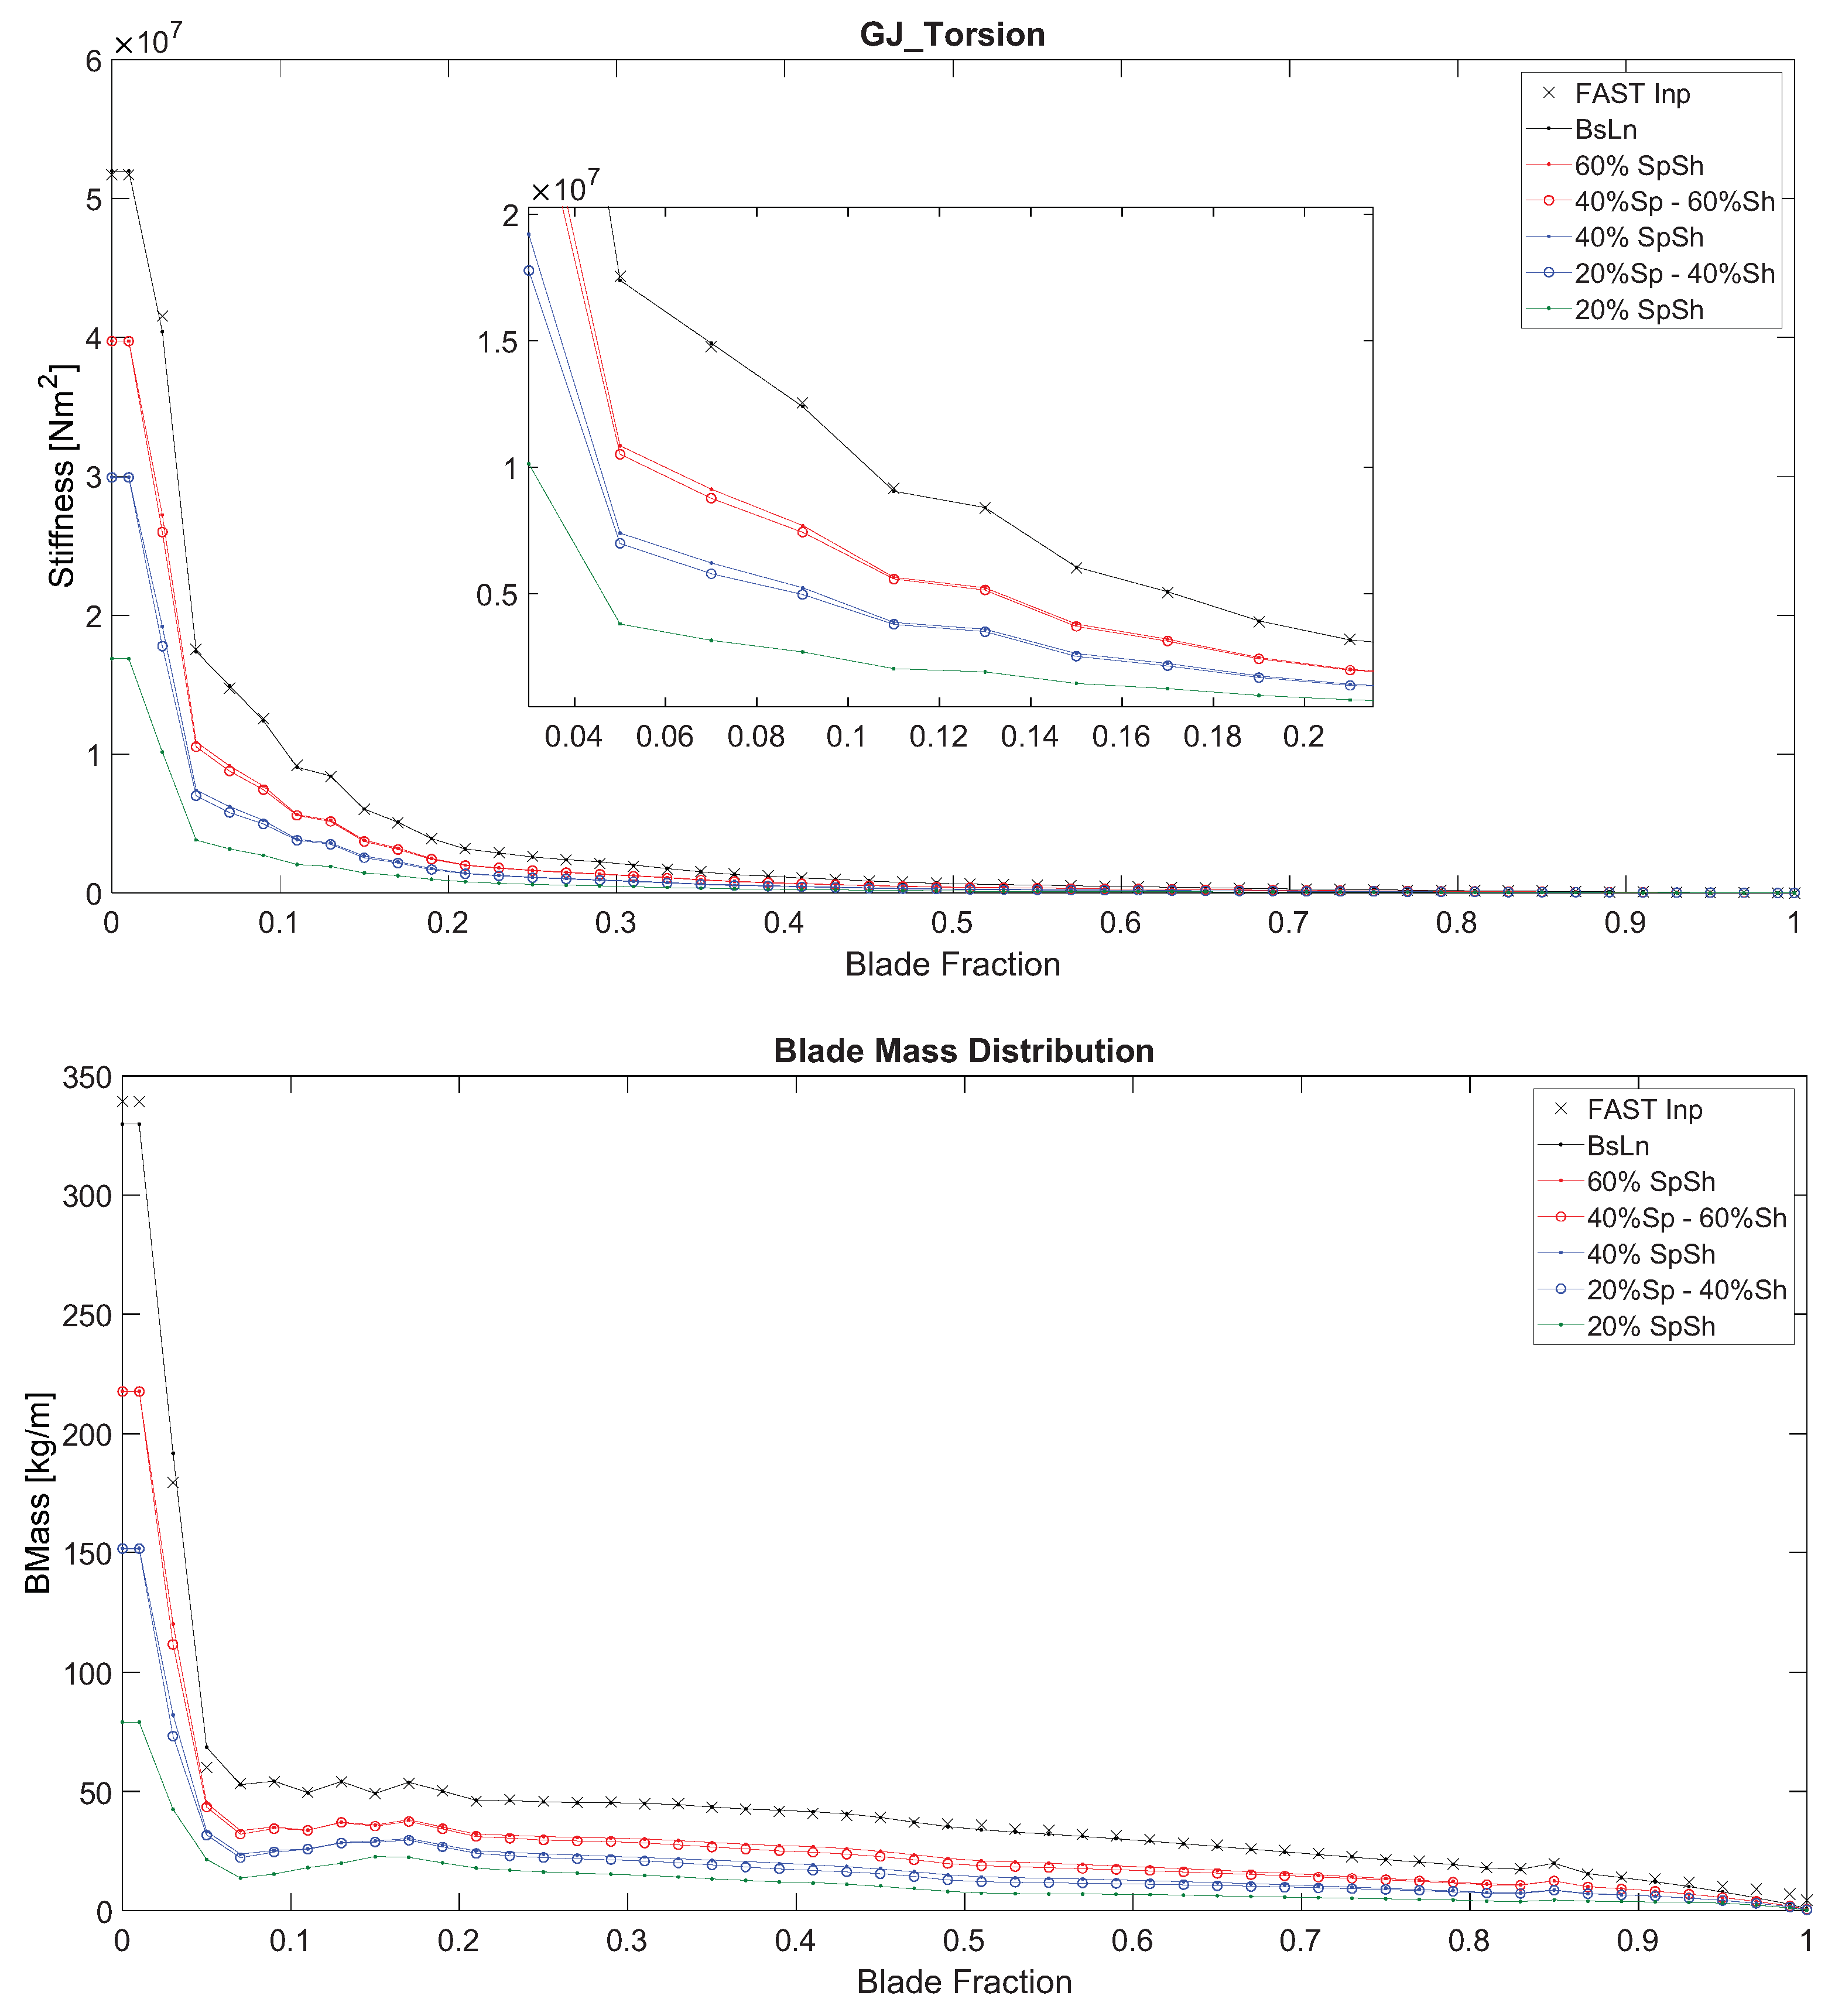
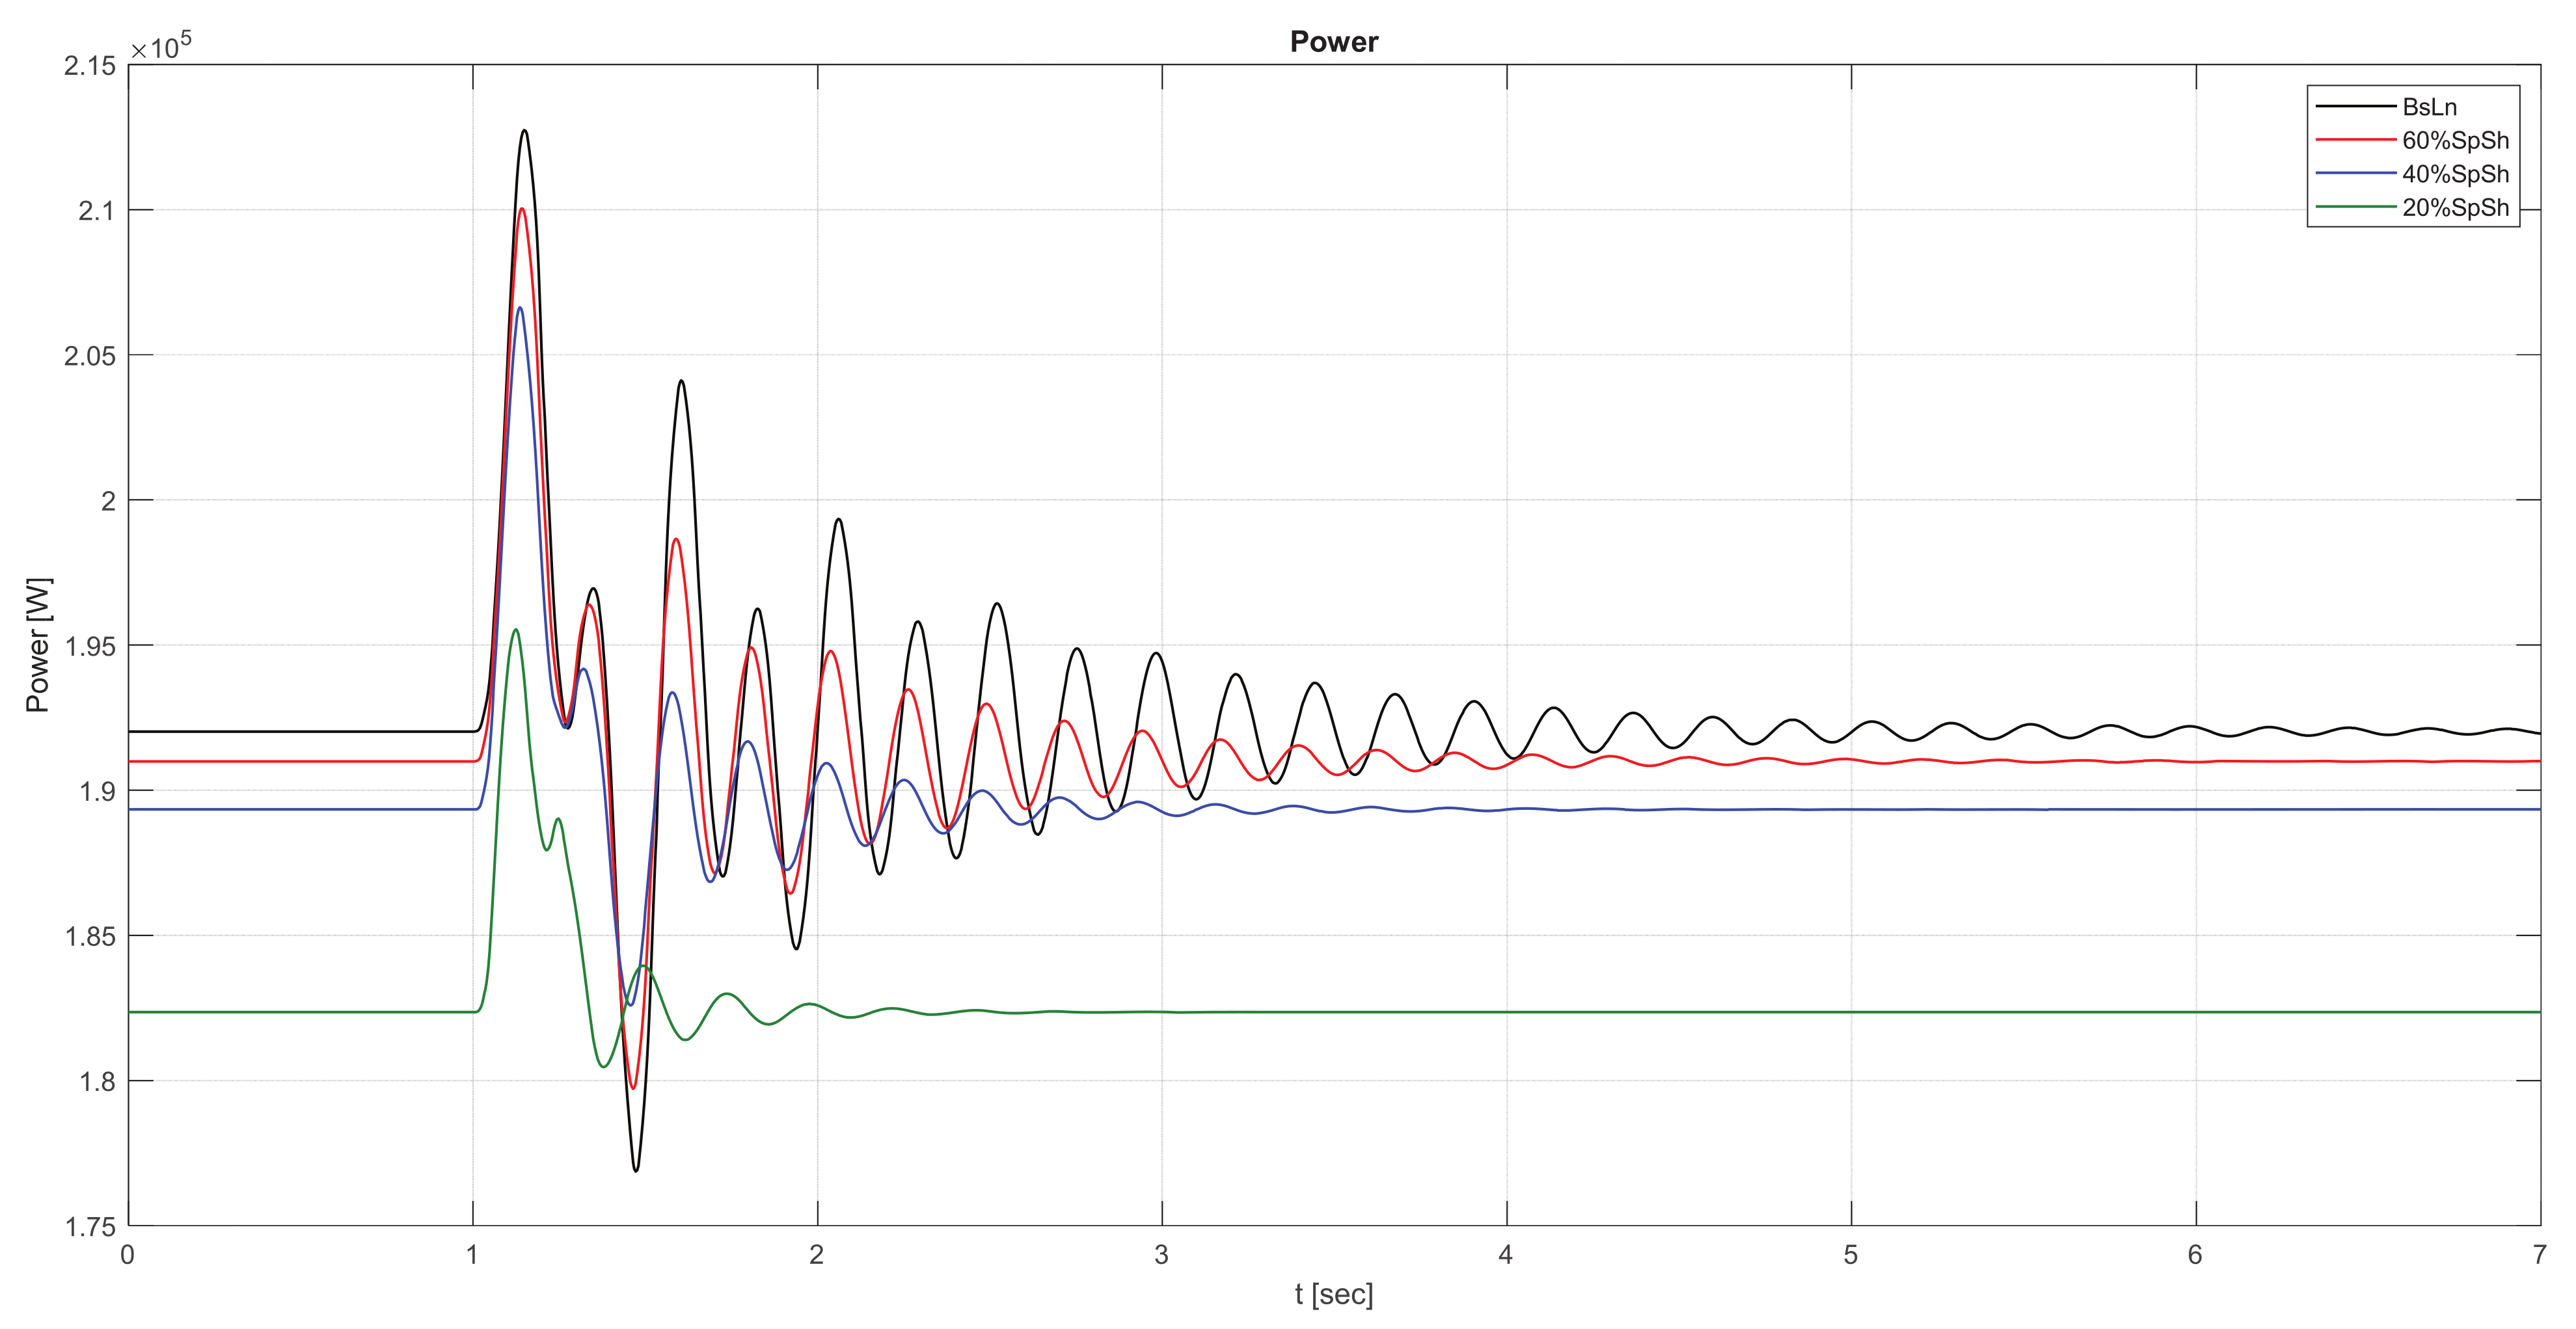
3.1. The Oscillatory Response of Flexible Variations on the SNL-NRT Rotor

As it was mentioned before, in this series of ROC tests on the SNL-NRT rotor, tests focused on the baseline blade design of the SNL-NRT rotor (see Kelley [33]), along with several flexible variations. Said variations were created by scaling down the thicknesses of the shell and the spar cap of the original internal structure of the SNL-NRT baseline blade to increase flexibility. A summary of the basic constructive and structural parameters of each flexible variation and the key used to identify them are described below:
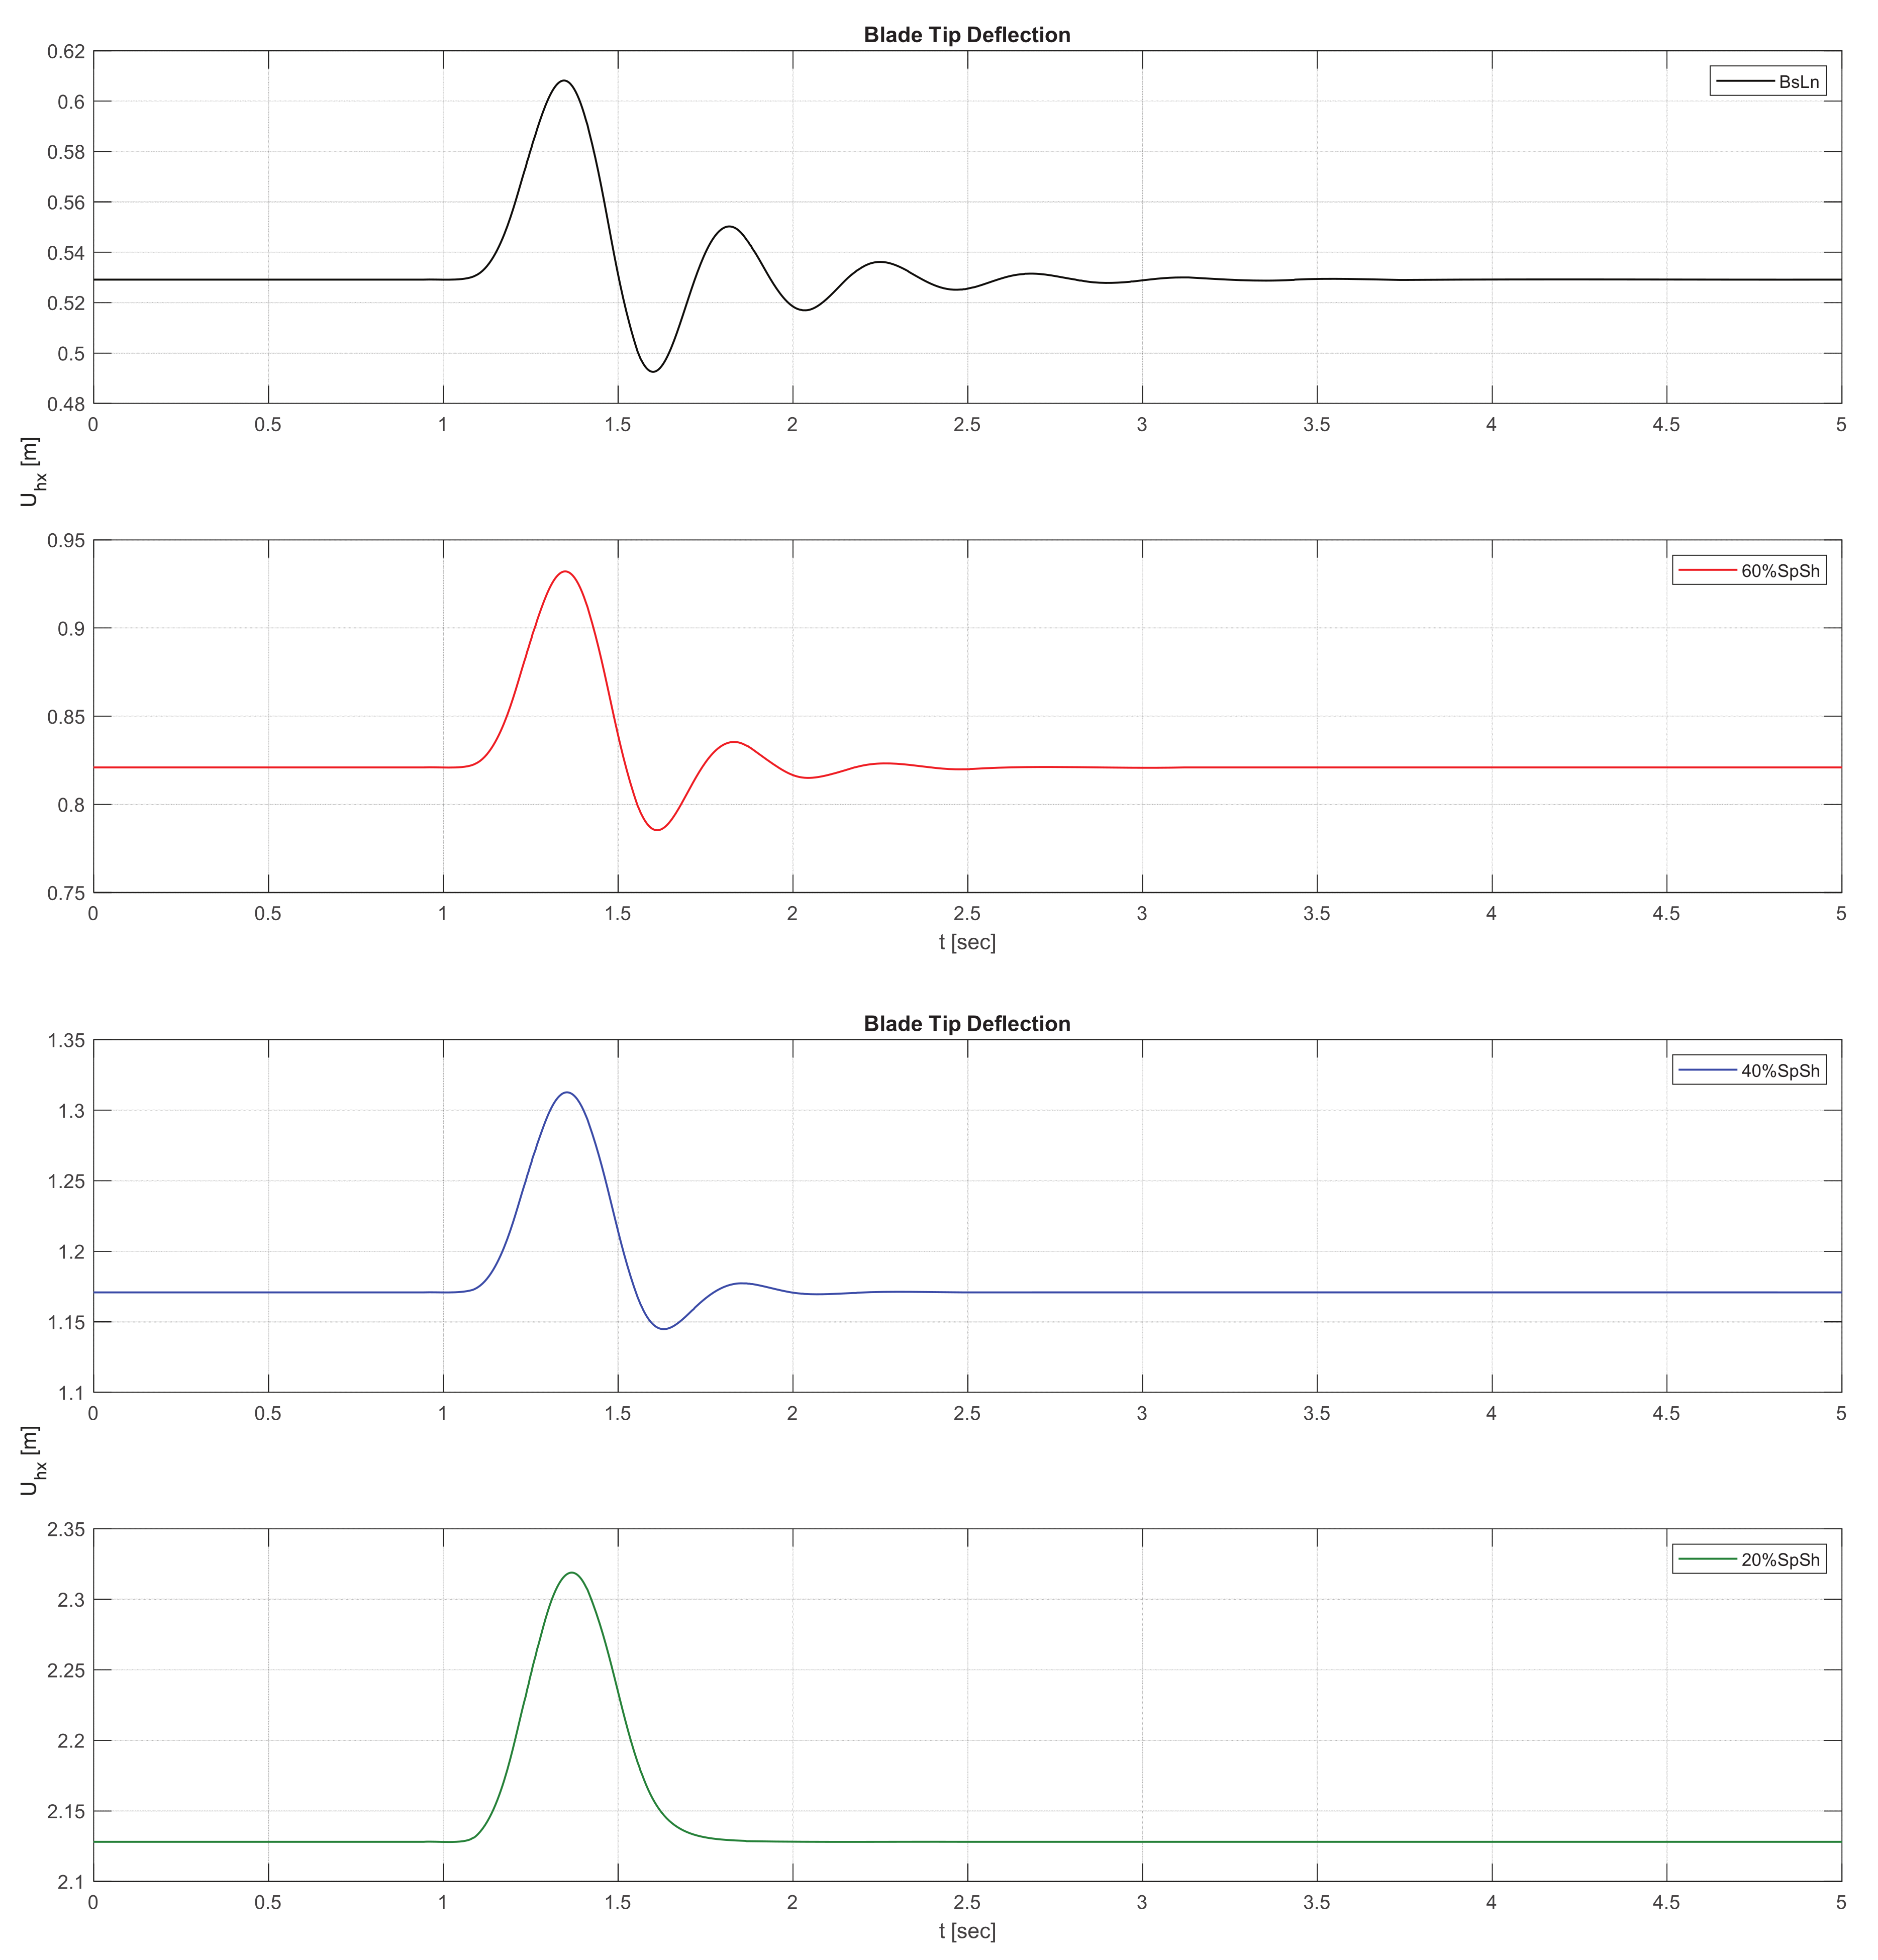
  • BsLn: Baseline blade case.
  • 60%SpSh: 60% shell and spar cap material.
  • 40%Sp–60%Sh: 40% spar cap and 60% shell material.
  • 40%SpSh: 40% shell and spar cap material.
  • 20%Sp–40%Sh: 20% spar cap and 40% shell material.
  • 20%SpSh: 20% shell and spar cap material.
The span-wise distributions of flap-wise, EI_Flap, and edge-wise, EI_Edge, stiffness for the different flex variations are plotted in Figure 3, alongside their baseline blade counterparts. Figure 4 shows the corresponding torsional stiffness, GJ_Torsion, and blade mass distributions.
The distribution curves from the NRT baseline blade’s FAST documentation [33] for each one of these parameters are also plotted for reference.
The total blade mass for each flex variation was then tabulated with its percentage versus the baseline (Table 1). The three flexible variations that were selected were “60%SpSh”, “40%SpSh” and “20%SpSh”.
One of the essential steps in the ROC study presented in the work of Jalal et al. [18] was to design controlled gust pulses that represented the speed fluctuations found in the real-world environment. One way of doing this was to identify and quantify pulses with a characteristic time-span and amplitude that represented typical oscillations in wind speed in a statistical sense. To that end, samples of anemometer data from different sources were collected and classified in an amplitude versus characteristic time-span chart, depicted here in Figure 5. Three distinguishable regions were found in this chart, which are indicated by the encircling dashed lines:
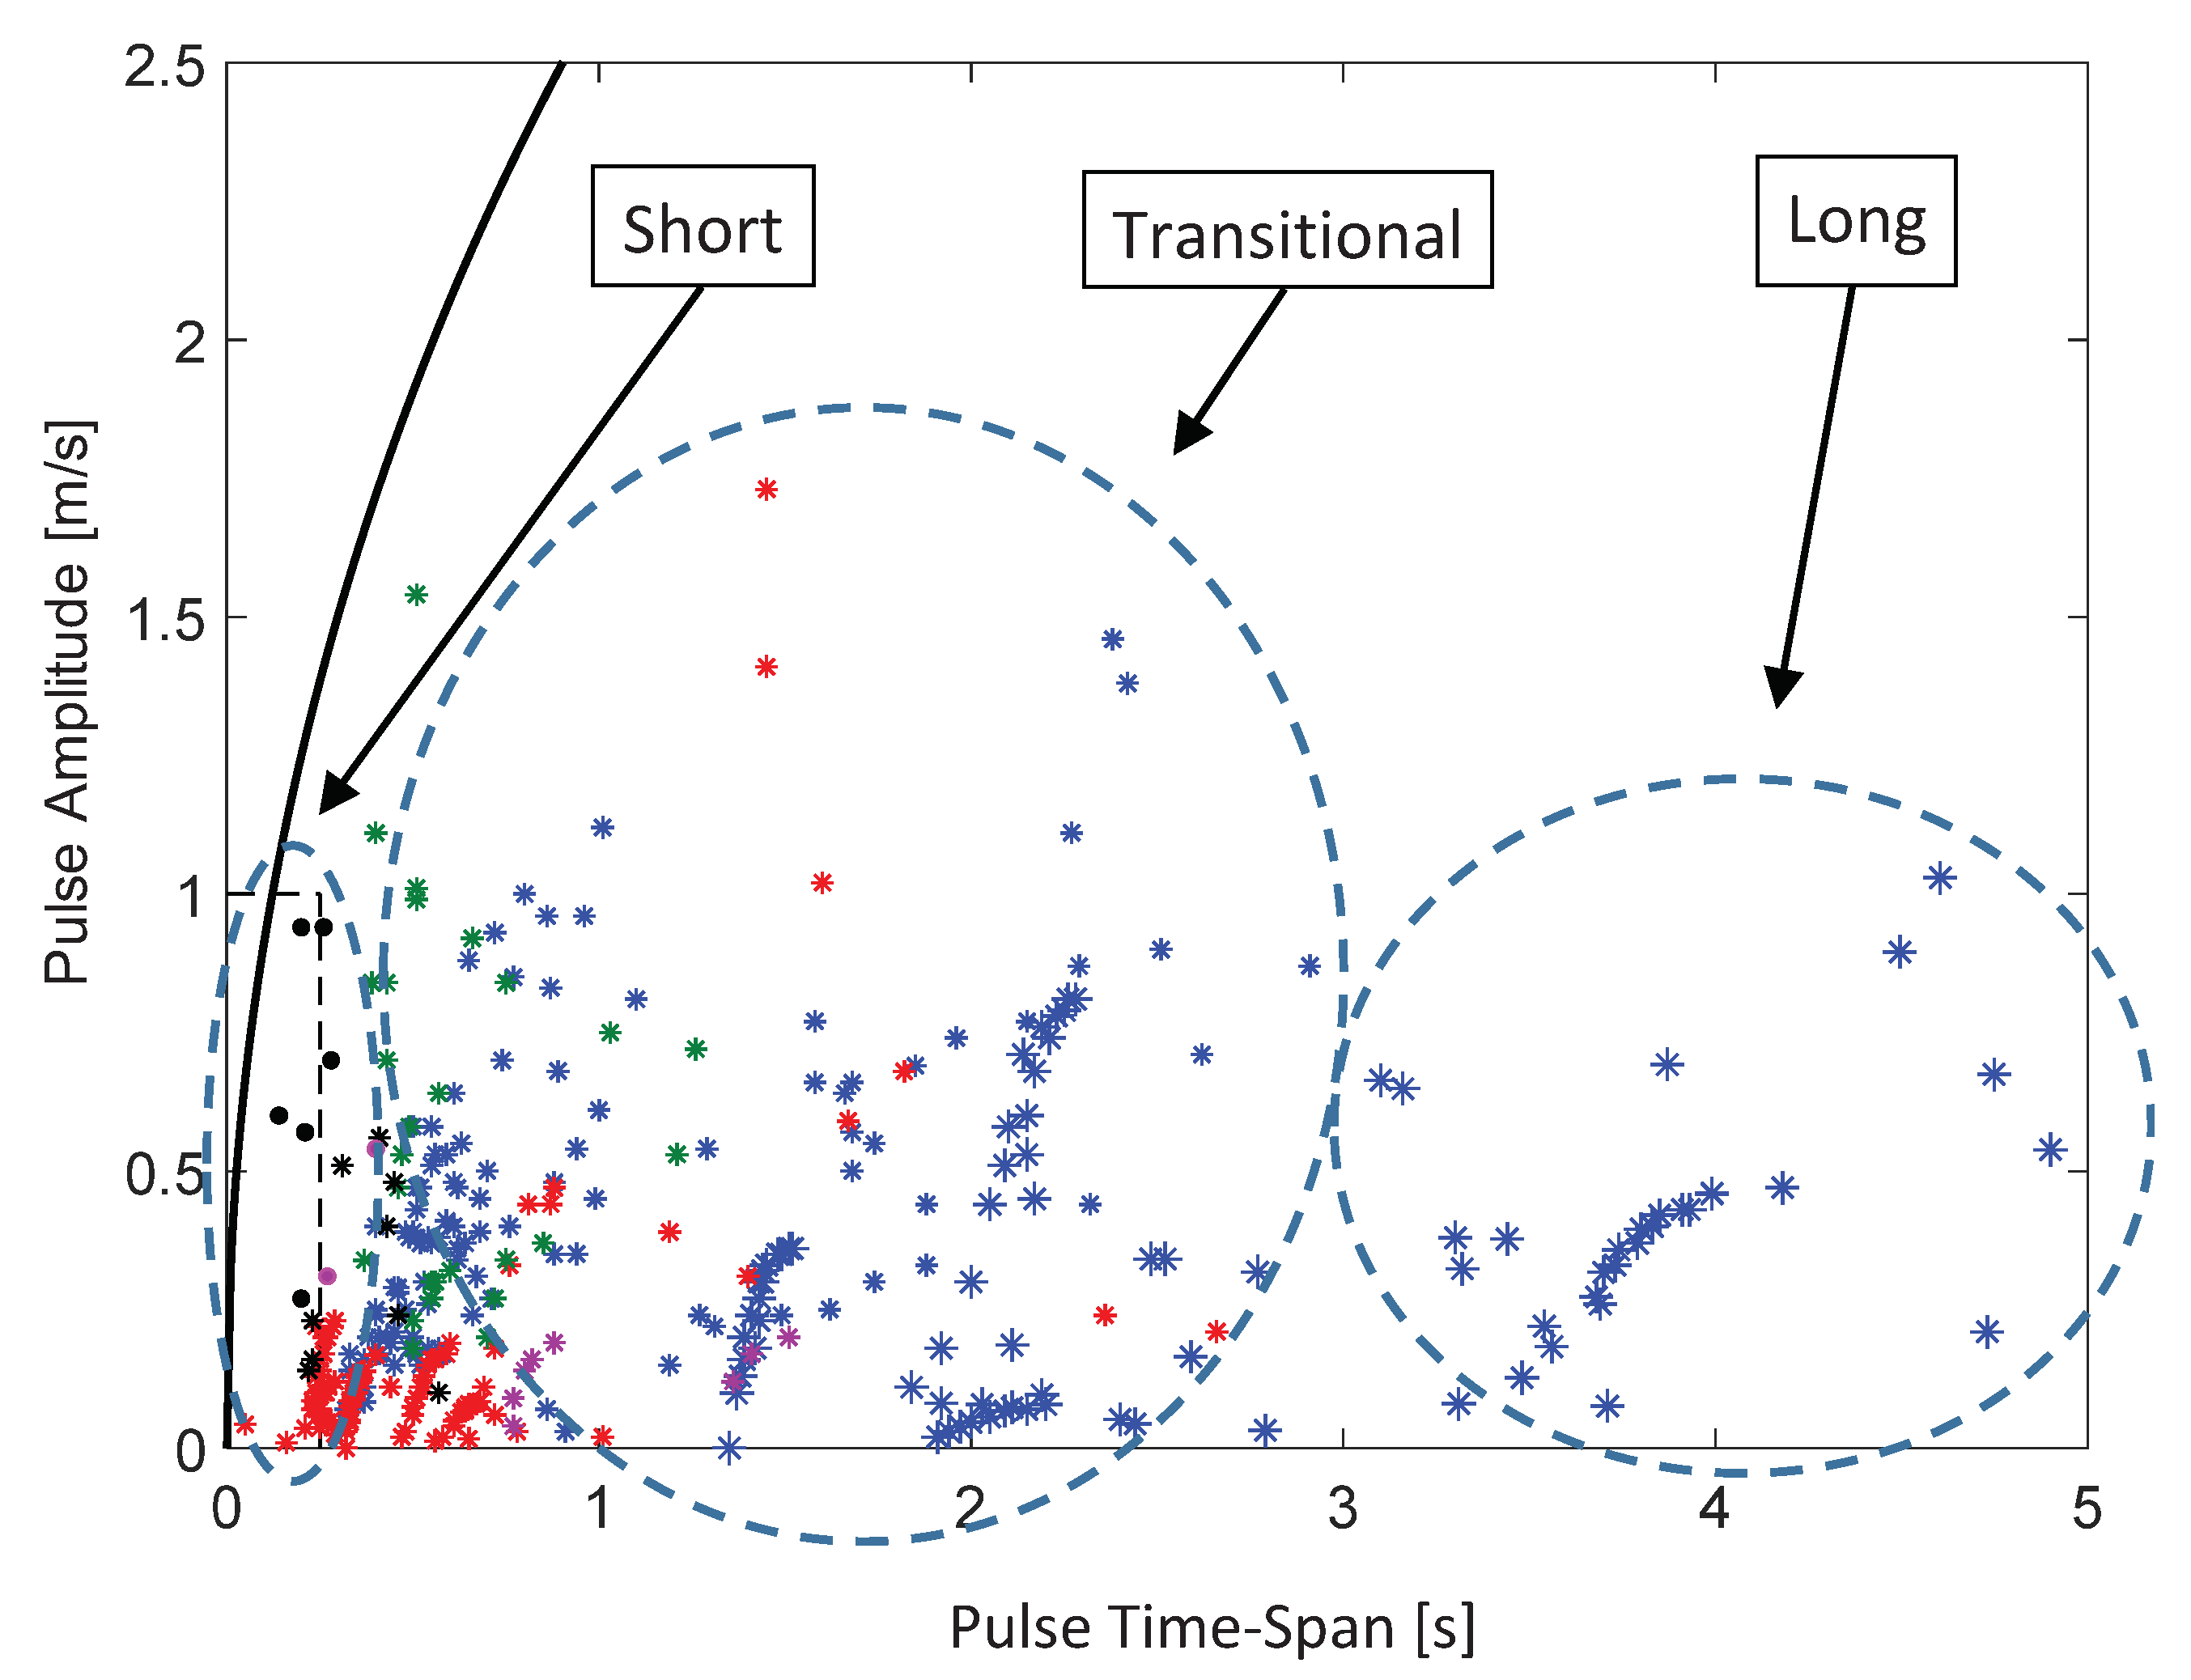
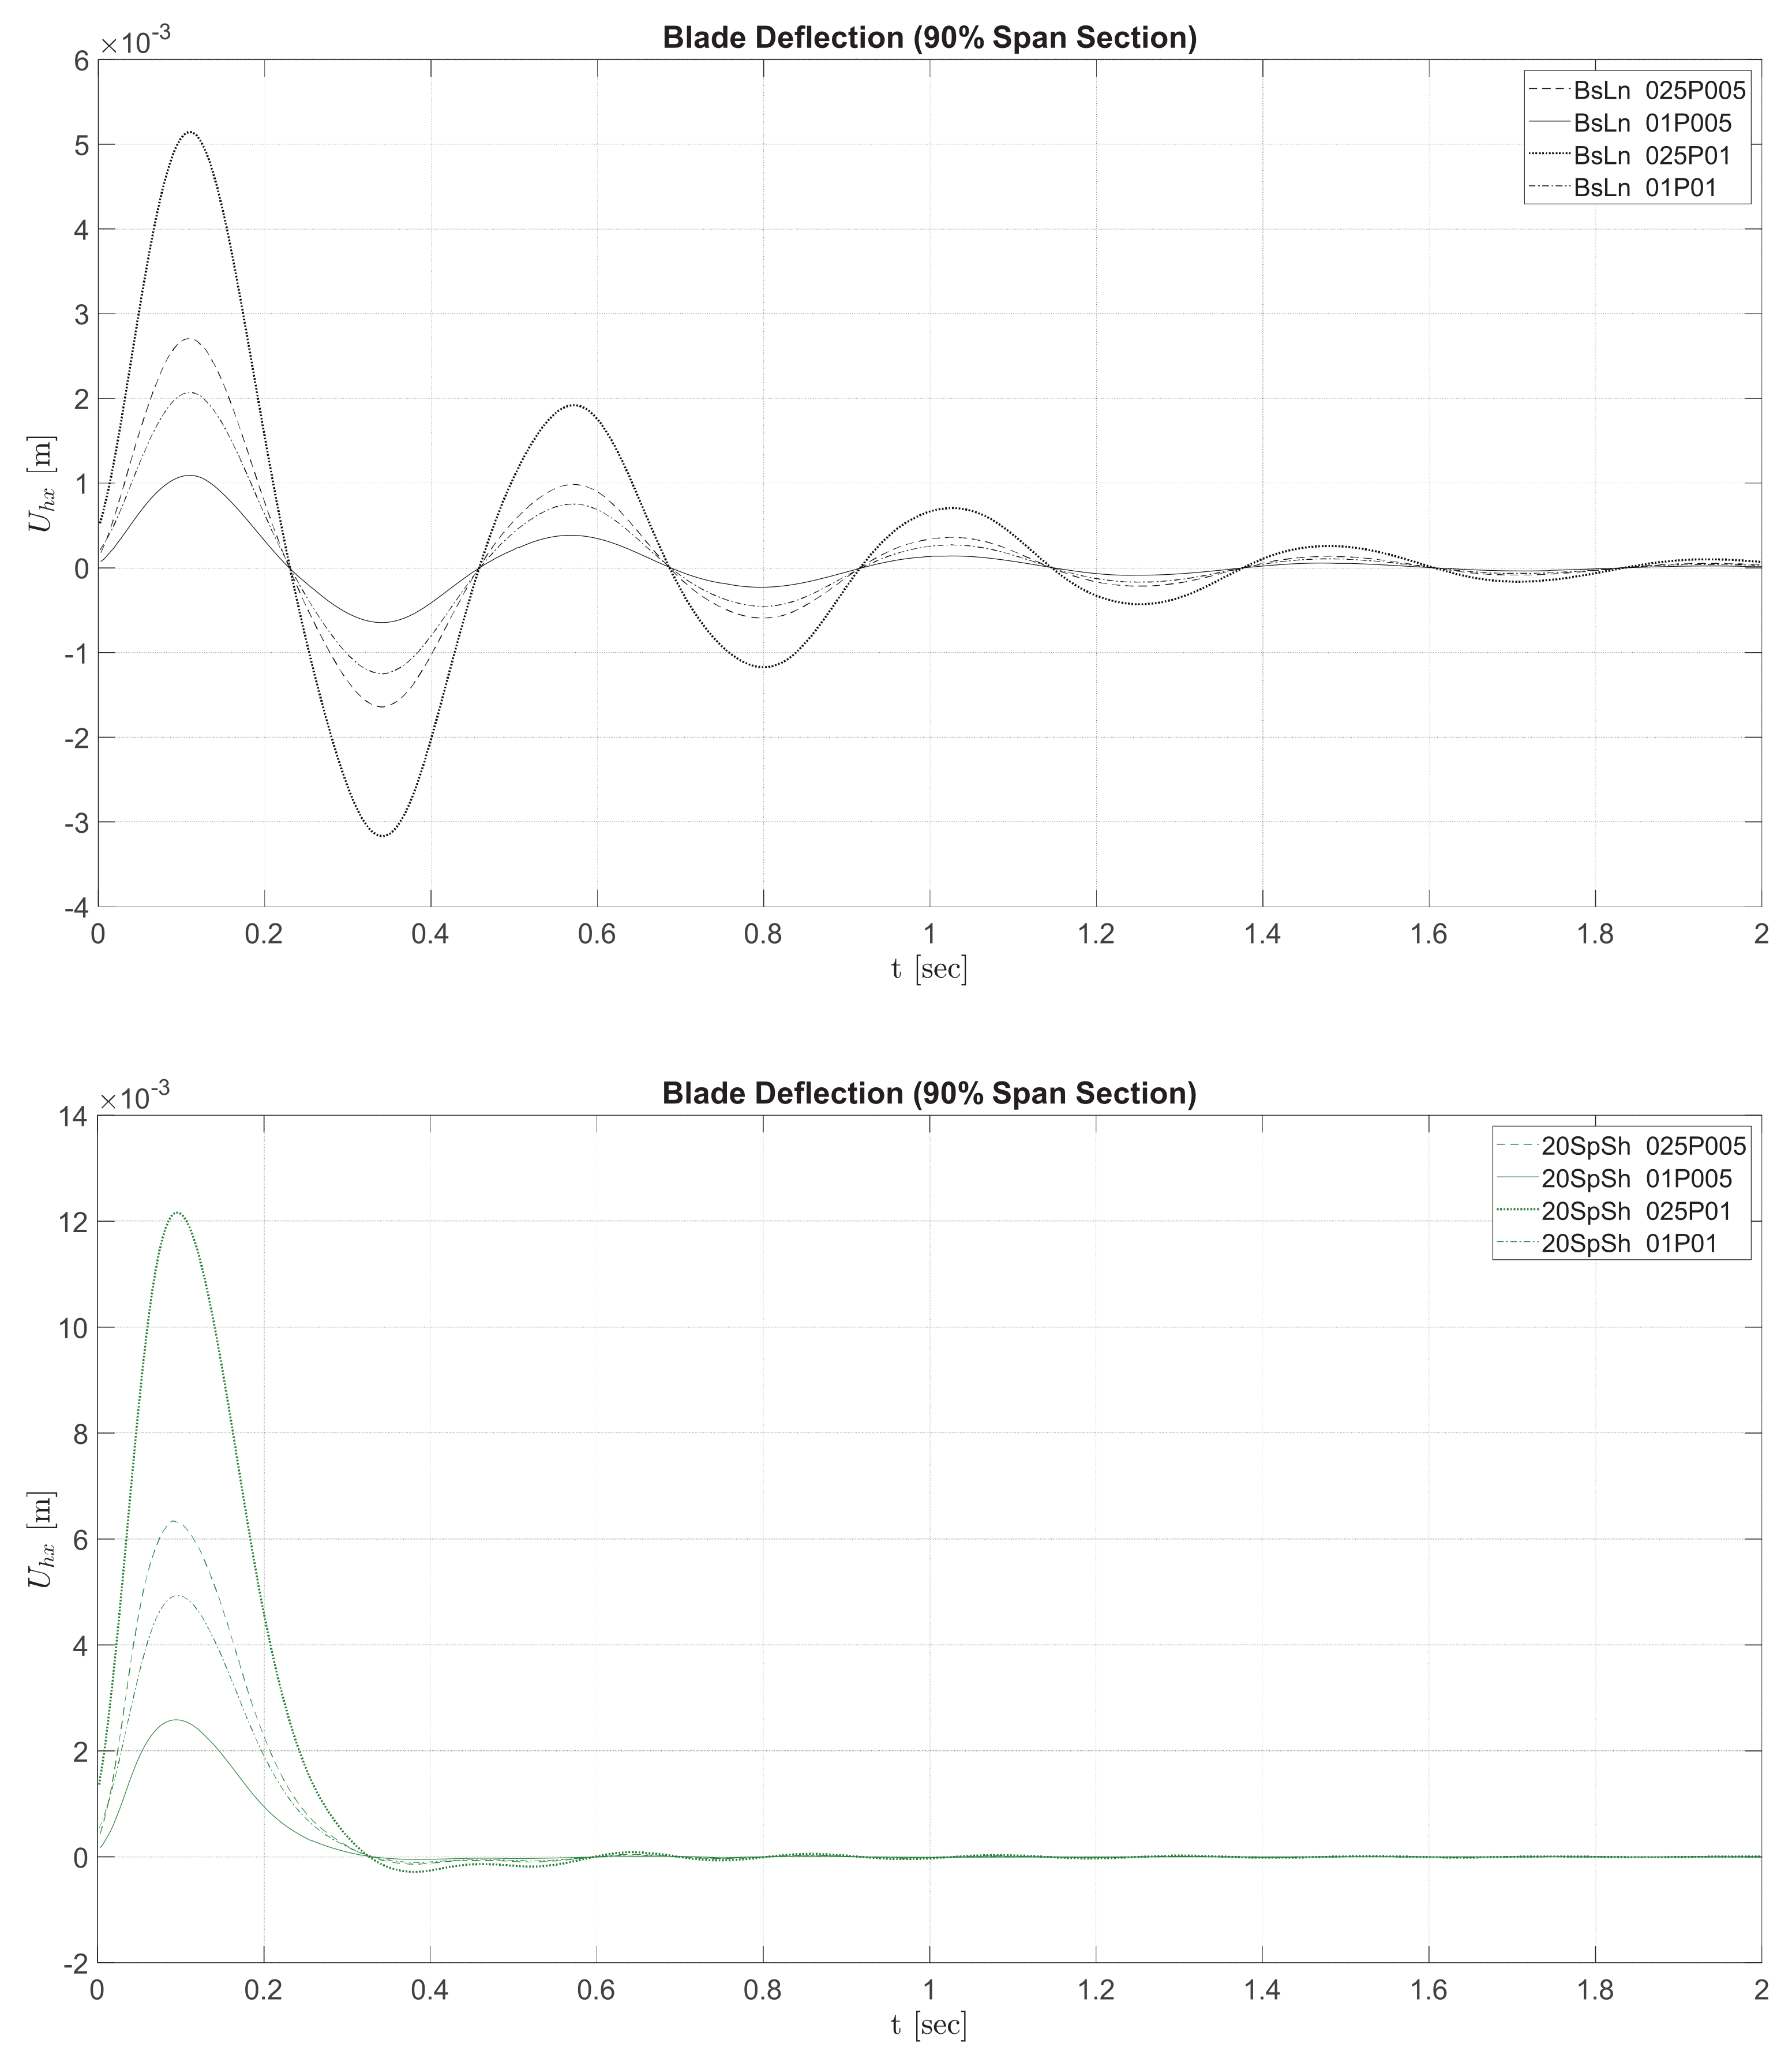
  • Short Pulses: Pulses in the “Short” category are the ones related with the small-scale motions on the wind flow turbulence spectrum. These pulses are sufficiently short so that they end before the blade reaches it first peak of oscillation. During an occurrence of a short pulse, there is a short initial time where the blades start to move and accumulate energy via inertia. The energy of a short pulse is then accumulated in the blades as mechanical potential energy via elastic deformation. Instantaneous blade deflection is then the only variable needed to characterize the overall evolution of the vibrational energy contained in the rotor as an oscillatory system.
  • Transitional Pulses: Transitional pulses occur for a long enough period of time that the turbine’s blades start to experience mechanical energy loss via aerodynamic damping before the pulse ends. This results in only some of the pulse’s energy being transferred into elastic energy in the blade. Blade deflection alone is no longer sufficient to characterize the pulse’s energy transfer into the oscillatory system of the blades.
  • Long Pulses: Pulses in the category of “Long” can be defined as being long enough to cause variations in the kinetic energy content of the incident flow which are gradual in nature, giving the blades enough time to absorb the pulse’s energy. These pulses may cause small, sometimes negligible, oscillations in the rotor’s system.
Proceeding with the ROC of the SNL-NRT rotor, focus was given to the Short Pulse category listed above, where energy transfer and subsequent evolution of the oscillatory dynamics can be characterized only by measuring the instantaneous blade deflection. Tests were conducted for a combination of scenarios covering the whole range of operational conditions for the NRT rotor. Figure 6 shows a selected sample of the time evolution of the blade tip axial deflection, U h x , for the SNL-NRT baseline blade and the three most significant flexible variations: 60%SpSh, 40%SpSh and 20%SpSh. Figure 6a shows the case for the rotor subjected to steady uniform-stream conditions at a wind speed (WS) of 6 m/s, with a controlled gust pulse of 1 m/s amplitude (Amp) and 0.5 sec time-span (Tsp). The rotor is operating at a tip speed ratio (TSR) of 9 and a blade pitch angle of 0°, which are the values corresponding to the original SNL-NRT design for that particular wind speed condition. The value of WS = 6 m/s in this sub-sample was selected because it represents the most frequent wind velocity registered at the SWiFT facility, where the NRT rotor is intended to be tested.
As it was mentioned before, for pulses in the Short Pulse category, U h x reflects the main component of the instantaneous amount of elastic energy stored in the rotor as an oscillatory system, which makes it valuable for understanding the evolution of the oscillatory dynamics. To complete this sample, Figure 6b shows the same time evolution of U h x for WS = 11.11 m/s, TSR = 6.197 and Pitch = 0°, which correspond to the operational conditions at the rated wind speed of the SNL-NRT design; and Figure 6c shows the case for WS = 15 m/s, TSR = 4.59, Pitch = 11.651°, which correspond to the conditions at the NRT’s cut-off wind speed.
In the previous work by the authors reported in the work of Jalal et al. [18], it was found that the time evolution of the blade’s oscillatory response was characterized by an exponential decay associated with aerodynamic damping, whose exponent was determined exclusively by the speed of the background wind. A novel aspect observed as a common factor in the current tests on the SNL-NRT rotor, where several flexible variations of the same blade geometry are involved, is that the rate of decay of the dominant mode of the oscillatory response increases as the flexibility of the blade increases. This seems to indicate that the higher the flexibility of the blade, the higher the associated aerodynamic damping is and the faster the oscillations induced by a gust pulse will be dissipated (see Figure 7, which shows close-up views for each individual blade type, in order of increasing flexibility, for the WS = 11.11 m/s case). These notions shall be revisited later in this section.
Other relevant operational parameters of the rotor show similar behavioral trends to the axial deflection. As an example, Figure 8 shows the time evolution of the power at the hub for one of the cases discussed before, WS = 11.11 m/s, which confirms the tendency to a faster dissipation of oscillations with increasing flexibility.

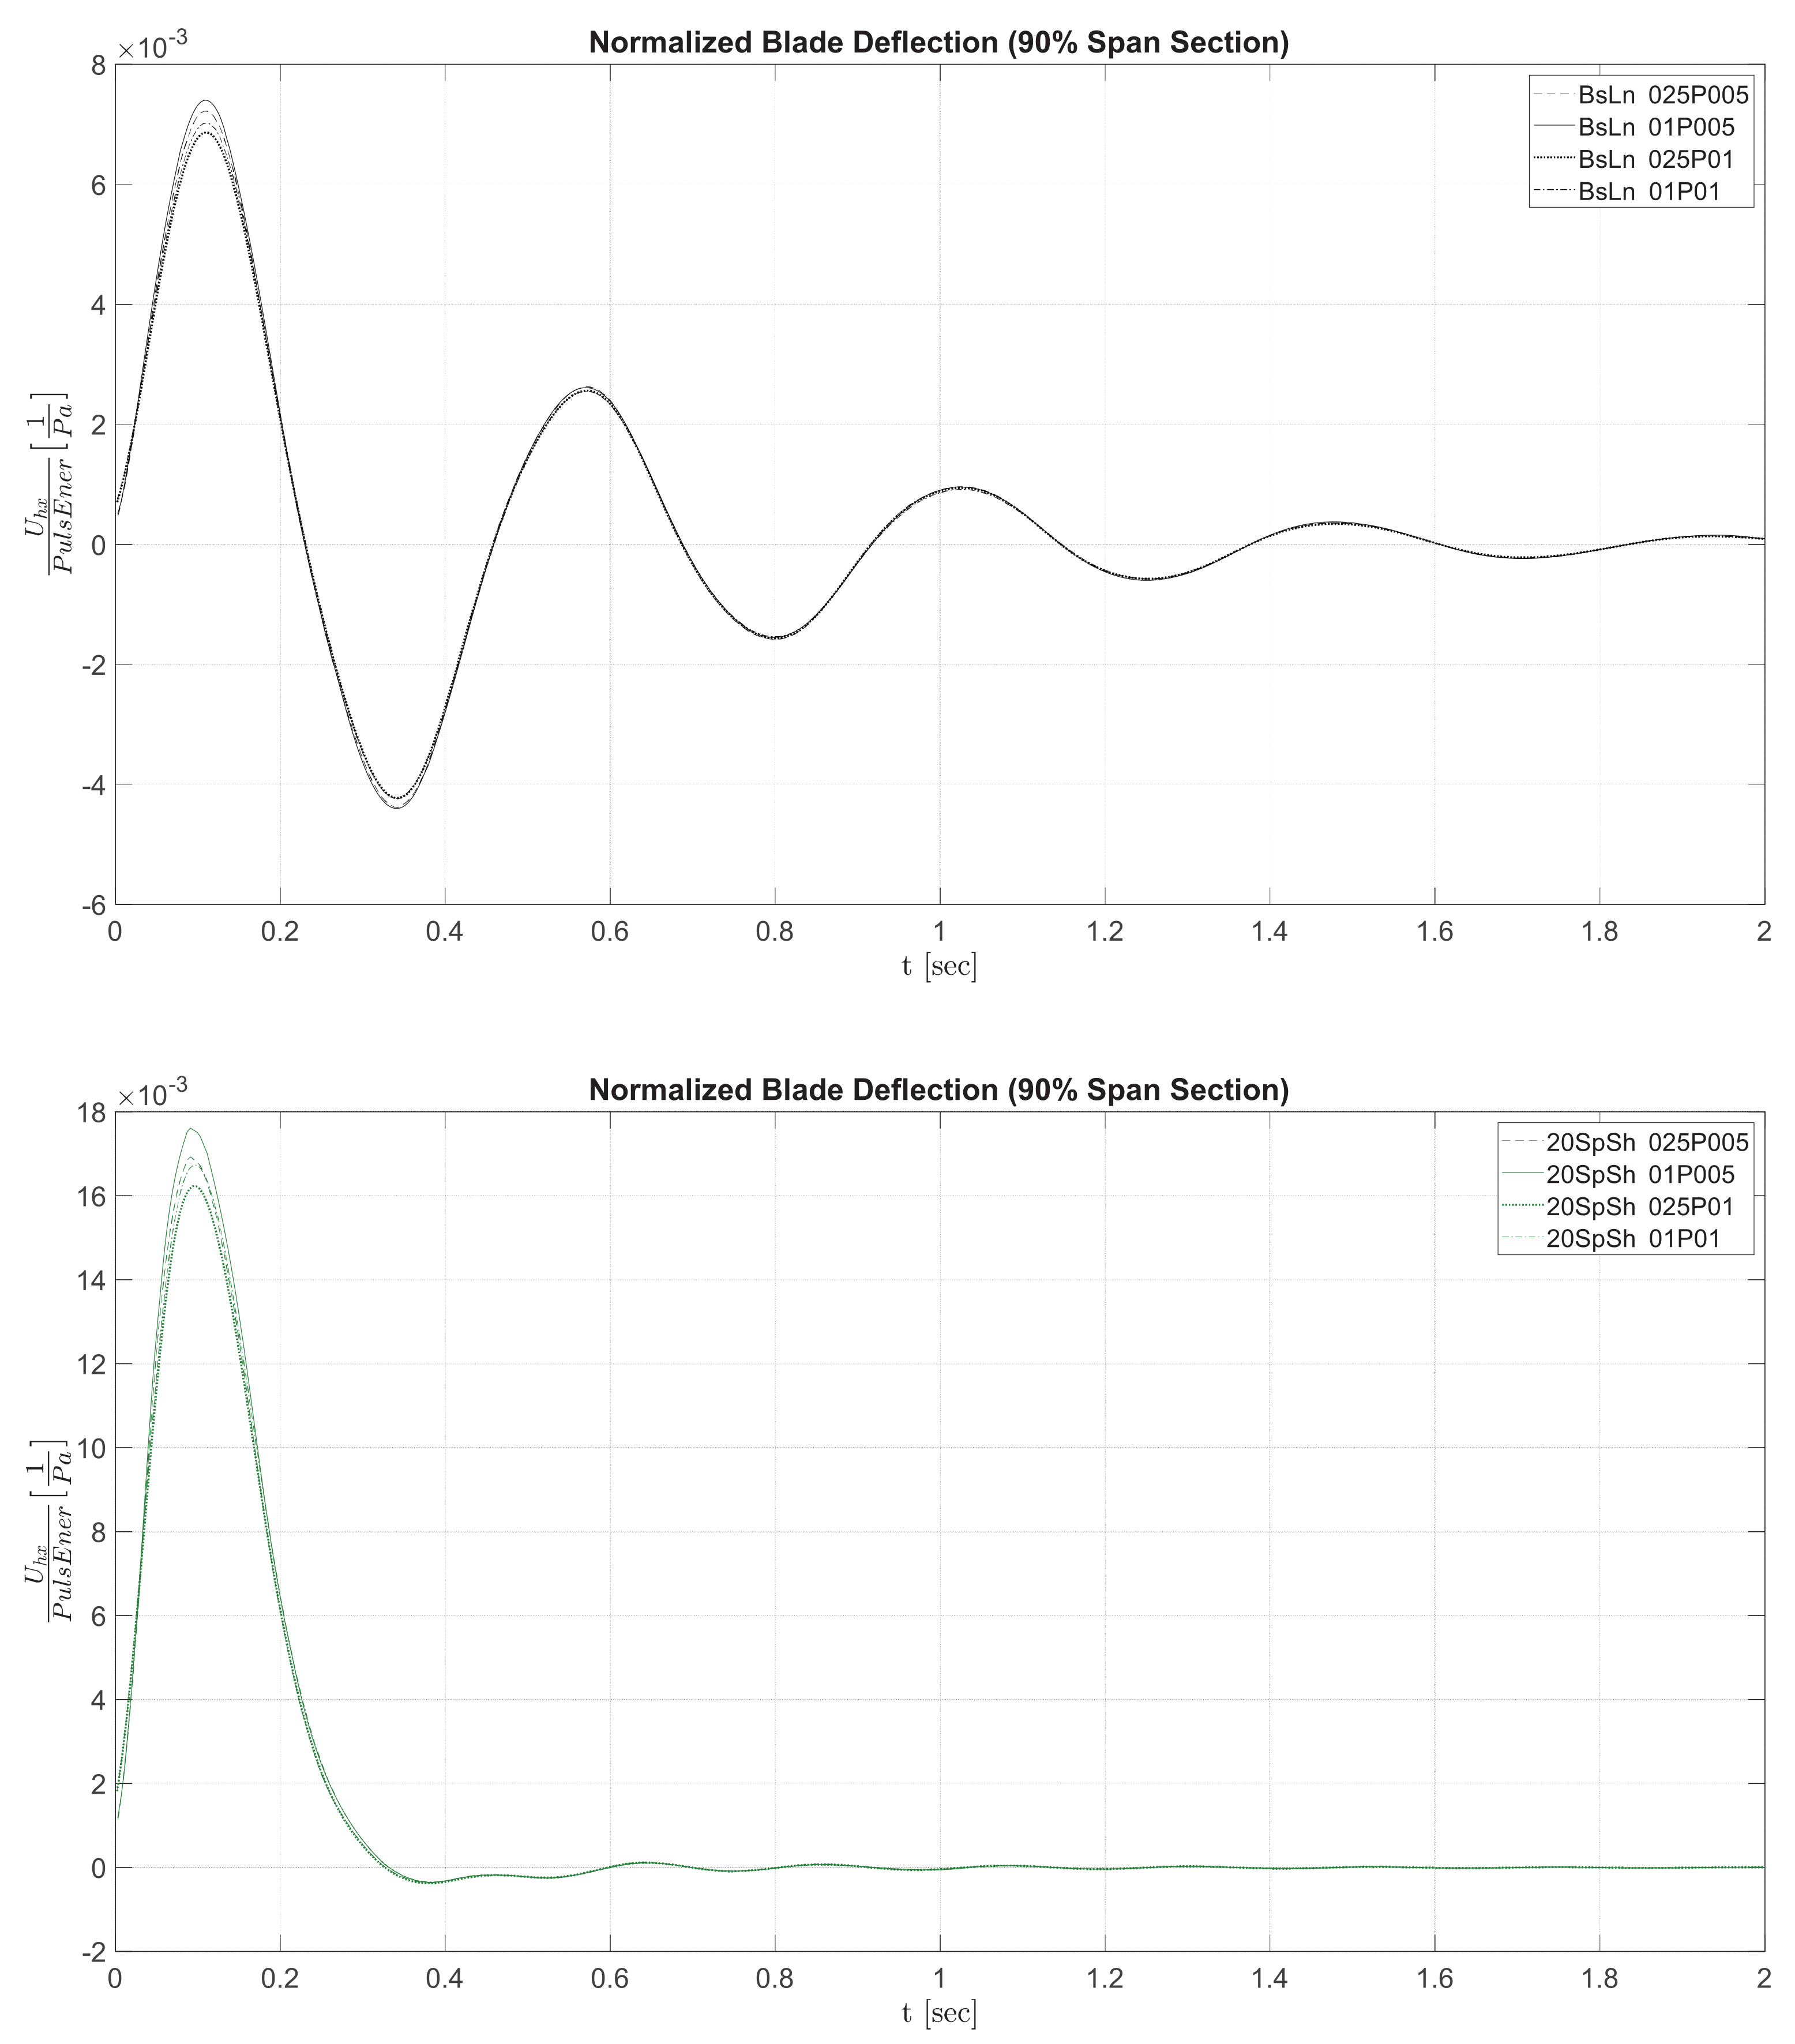
3.2. Energy Transfer Characterization of Gust Pulses

Another finding of the ROC study presented in the work of Jalal et al. [18] was that all the curves of flap-wise vibration, centered around the value of the mean blade deflection for a certain steady wind speed, collapse into a unique signal when they are normalized by the kinetic energy content of their respective pulses. That is, the time evolution of the blade deflection scales with the time evolution of the rotor’s elastic vibrational energy, which, in turn, scales with the content of kinetic energy density of the pulse, P u l s e E n e r , measured in Joules / m 2 .
Figure 9 shows selected examples of the time evolution of the axial blade deflection at a position located at 90% of the blade span, for a sample of pulses applied onto a mean wind speed with steady uniform-stream conditions at WS = 6 m/s, with TSR and pitch values corresponding to the SNL-NRT design for that operational condition. Observing the behavior of blade parameters at the blade section located at 90% of the span is particularly convenient as, being as close as possible to the blade tip, it allows us to easily detect vibrational and deformational effects, but, at the same time, it is still far enough from the blade tip to avoid aerodynamic disturbances associated with blade tip effects [34]. That is, the position at 90% of the span represents a good spot for the well-balanced observation of variables associated with the combined structural and aerodynamic response of the blade.
The blades shown in Figure 9 are the baseline blade and the 20%SpSh flexible variation, which correspond to the upper and lower limits of the range of flexibilities covered in the present study. The key for the pulse parameters in the samples shown in Figure 9 and subsequent figures is listed below with the parameter shorthand given first, followed by the parameter settings:
  • 025P005: Amp 0.25 m/s–Tsp 0.05 s.
  • 01P005: Amp 0.1 m/s–Tsp 0.05 s.
  • 025P01: Amp 0.25 m/s–Tsp 0.1 s.
  • 01P01: Amp 0.1 m/s–Tsp 0.1 s.
Comparing the oscillatory response of the baseline blade versus its most flexible variation clearly illustrates the trend in terms of vibration mitigation that was mentioned before. Even though the amplitude of the first peak of the oscillation is larger for the 20%SpSh than for the baseline blade, the subsequent peaks of the oscillatory signal are significantly reduced, to the point that they practically disappear. This is even clearer when observing the curves in Figure 10, which shows the pulse-energy-normalized counterpart of the same time evolution curves for the blade deflection previously shown in Figure 9. The collapse of the curves for all pulses applied clearly verifies that the principle of energy-based characterization of the blades oscillatory dynamics holds for the NRT.
The energy-normalized curve has the units of an equivalent flexibility, Pa 1 , which could also be interpreted as the inverse of a stiffness modulus, K e l 1 . The value of this equivalent flexibility depends not only on the stiffness of the blade but also on the value of the mean wind speed. The latter dependence of K e l 1 on the mean wind speed could be explained by the fact that the mean deflection of the blades, around which the oscillations occur, induces a “pre-stiffening” state, and the mean deflection is in itself essentially determined by the mean wind speed. The higher the mean wind speed is, the higher the value of this mean deflection and the higher the pre-stiffening effect would be. This energy-normalized description of the blade response leads to a further generalization of the characterization of the rotor’s dynamics, as it makes it independent of the particular characteristics of the pulse in terms of its combination of amplitude and time-span.
It is important to note that the sample of pulses shown here in Figure 9, Figure 10 and Figure 11 to illustrate the concept only represent a selected subset of all the pulses that were tested. Figure 11 shows selected examples of similar results for the baseline blade and all its flexible variations, for the values of mean wind speeds of 6 m/s, 11.11 m/s and 15 m/s, respectively. Each wind speed condition was tested at the TSR and pitch values corresponding to the original SNL-NRT design.

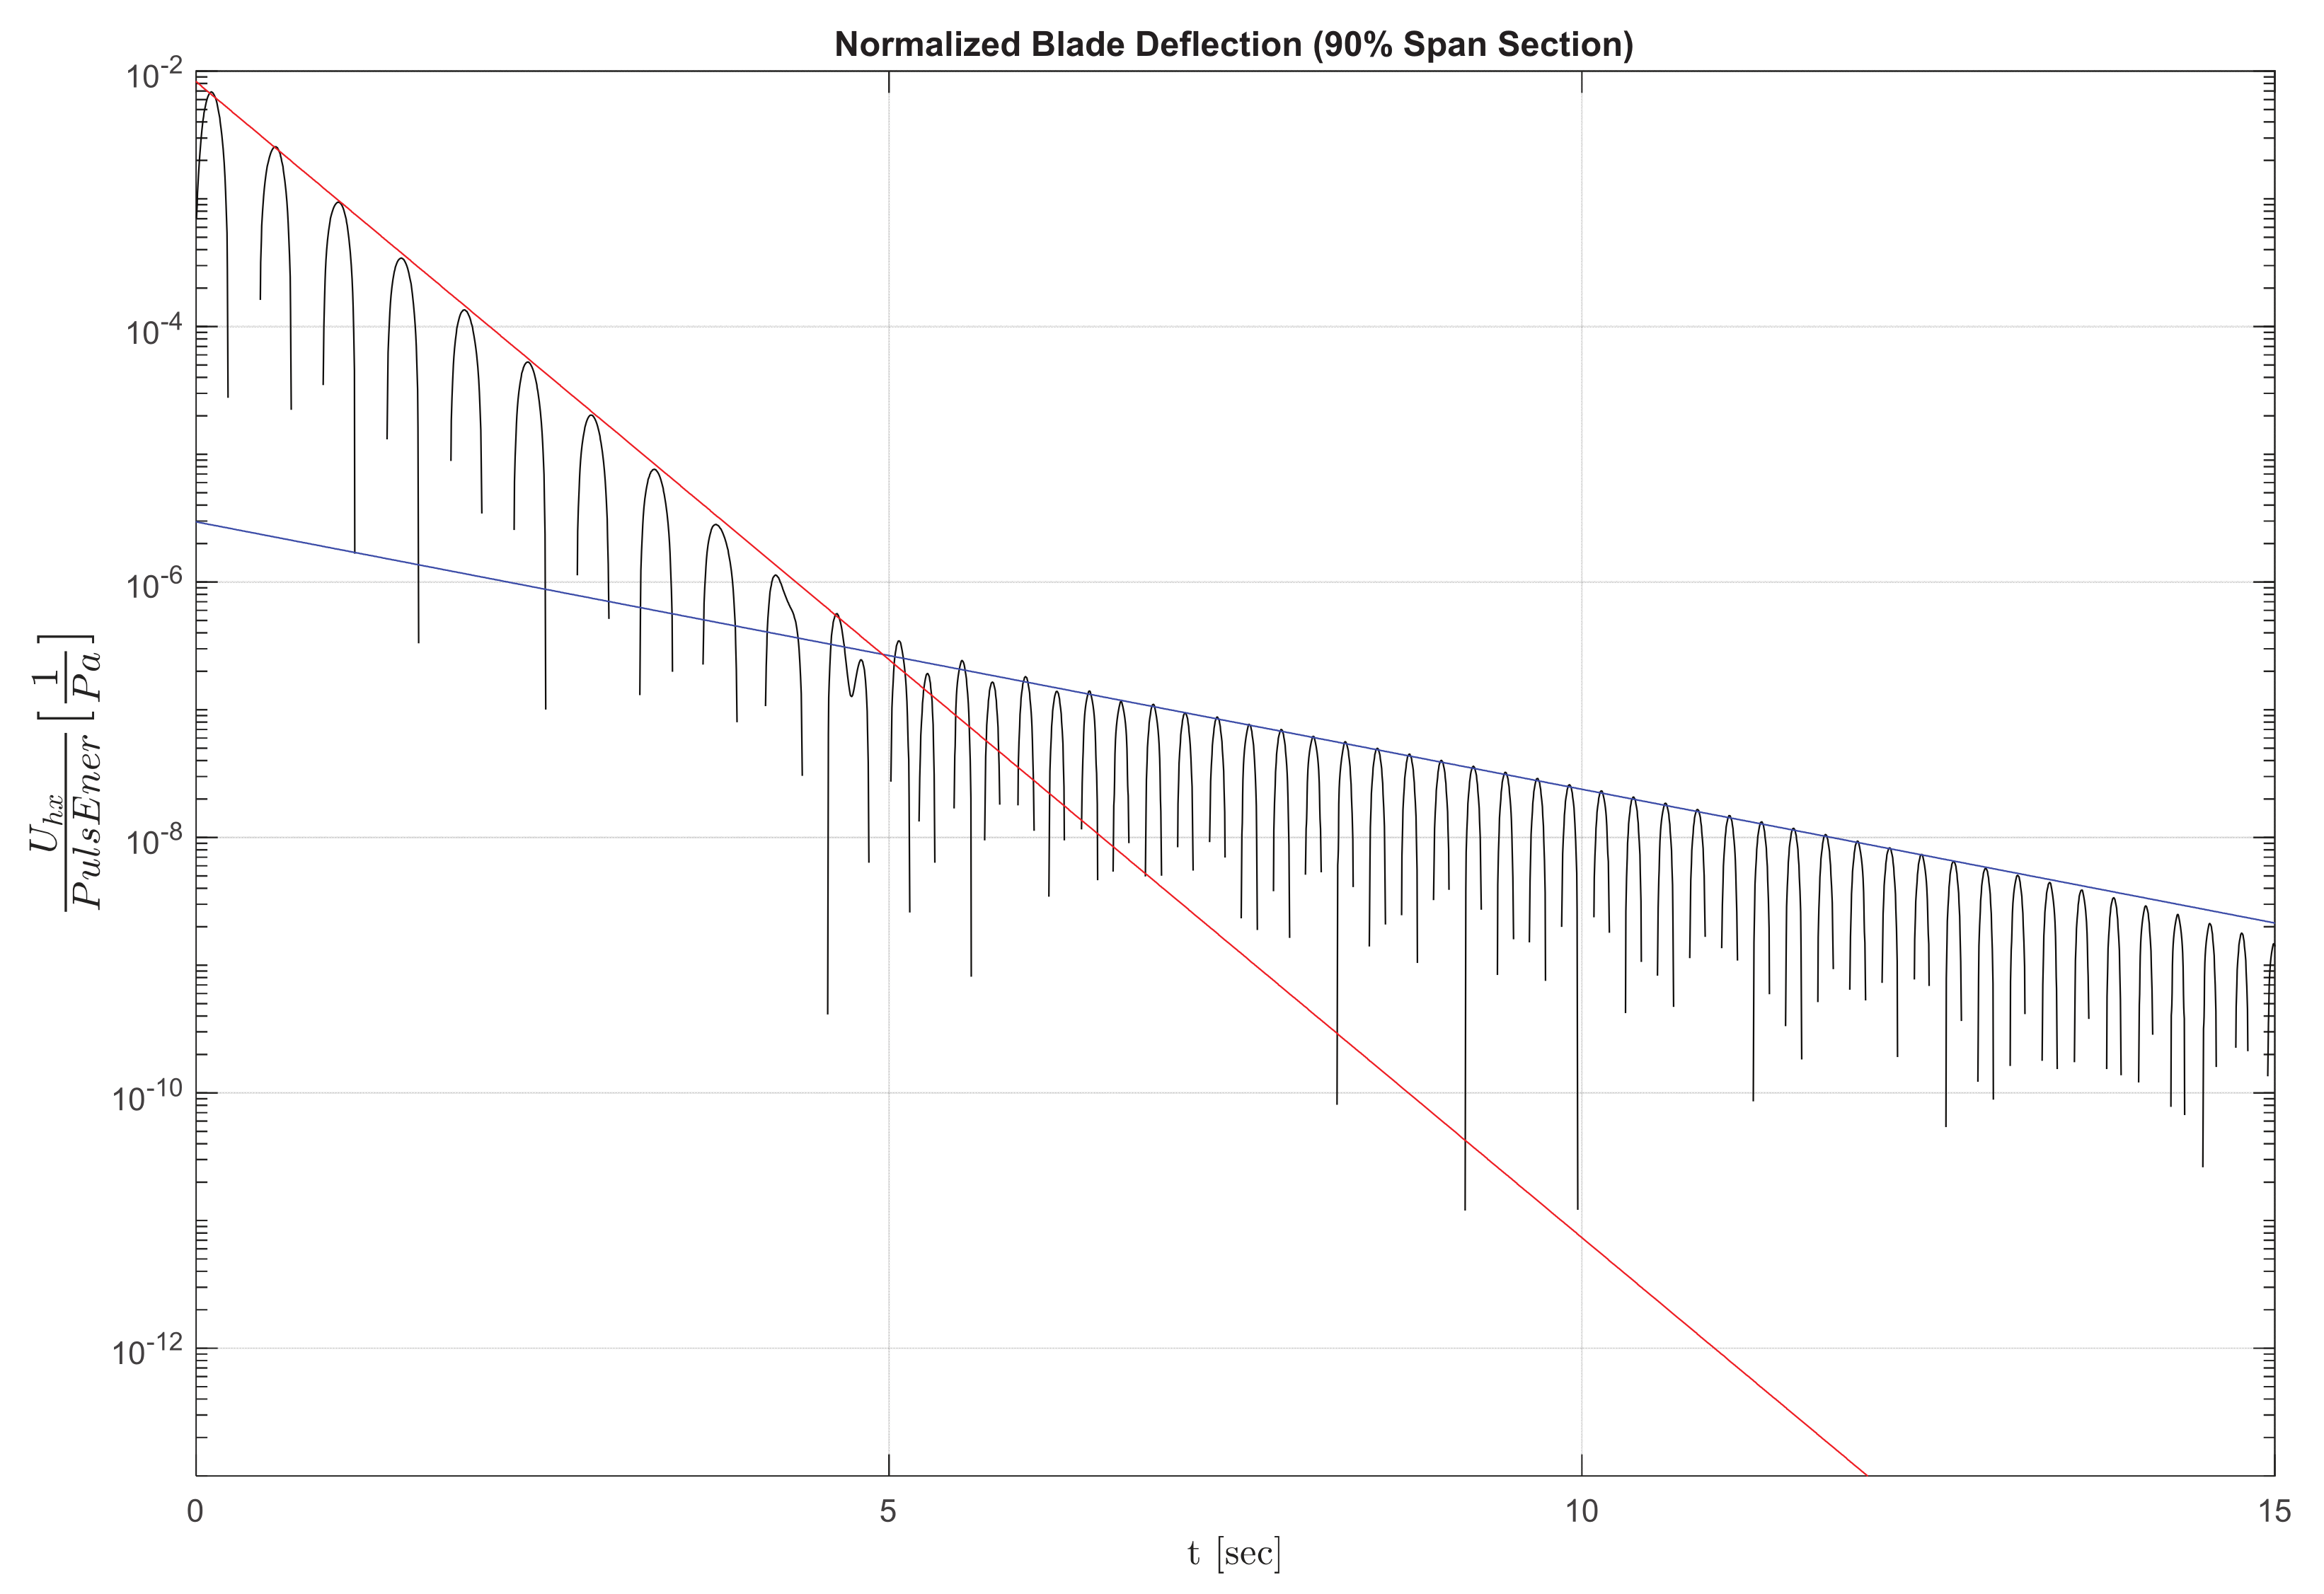
3.3. Exponential Decay of Gust-Pulse-Induced Oscillations

As previously mentioned, the ROC study presented in the work of Jalal et al. [18] found that the time evolution of the oscillatory response is characterized by an exponential decay associated with aerodynamic damping, which is exclusively determined by the speed of the background wind. The exponential nature of the oscillation’s decay also held for the SNL-NRT cases studied here. This fact becomes evident when analyzing the oscillating signals in a semi-log plot. Figure 12 shows one example of semi-log plot for the time evolution of the normalized blade deflection. It is clear that the time evolution of the oscillating signal exhibits an exponential enveloping curve, which is manifested as a linear relation when plotted in semi-log axes. This behavior was observed in all of the NRT cases analyzed.
The initial portion of the time evolution in Figure 12, in which the frequency of the first oscillatory mode (flap-wise) dominates, showed a greater exponential decay, λ 1 , given by the slope of the red line. On the other hand, the exponential decay associated with the frequency of the second oscillatory mode (edge-wise), λ 2 , given by the slope of the blue line, showed a lower value. That makes the second oscillatory mode dominant in the long term. This occurs even though, in general terms, the amplitude of the second oscillatory mode is substantially lower than the amplitude of the first mode, which is the frequency mode that determines the main features of the oscillatory response.
This was also consistent with the behavior reported by the authors in the work of Jalal et al. [18] for the case of the DU-5MW-RWT turbine along the entire range of operational wind speeds in that turbine’s stable oscillatory regime. This is summarized in Figure 13, shown here to illustrate the concept.
In the DU-5MW-RWT case, the exponential decay was identified for the first three frequencies observed therein. A similar study of the exponential decay factors for the complete velocity range of the operational regime of the SNL-NRT rotor is beyond the scope of the current work, but the results collected hitherto clearly indicate that a similar behavioral trend to the one observed in the DU-5MW-RWT case is present, both in the SNL-NRT’s baseline rotor and in its flexible variations.
As mentioned before, a generalization of the reduced-order characterization of the SNL-NRT rotor to larger machines with geometrical similarity could be valuable in terms of extrapolating results from the present investigation and other ongoing studies to the scale of current and future commercial machines. To explore this hypothesis, the previous results were followed by a sample test of a 10× scaled-up version of the baseline SNL-NRT rotor (i.e., from 27 m to 270 m in diameter), keeping geometrical and material similarity with the original.
Figure 14 shows a sample test with a comparison between the time evolution of the energy-normalized blade deflection for the original SNL-NRT baseline rotor and its 10x version, when subjected to a controlled gust pulse. The black curve shows the oscillatory response of the original SNL-NRT, 27 m diameter rotor, and the green curve is the response of the up-scaled rotor, the 270 m machine.
It is interesting to note that, for a basic cantilever beam of a constant section, the natural frequency of the first flap-wise mode scales inversely proportionally to the beam’s length. If the same basic notion is applied here to approximate the scaling of the first flap-wise mode frequency of the SNL-NRT blade, the period of the dominant oscillation of the up-scaled rotor would be 10 times higher. To test this hypothesis, a “time-corrected” version of the oscillatory signal for the 270 m rotor was computed, contracting the time axis by a factor of 10, to account for the change in frequency response due to the geometrical scaling. The blue line in Figure 14 shows this time-corrected version of the original green curve for the up-scaled rotor’s response.

4. Conclusions and Discussion

The results of the research efforts presented here seem to answer one of the basic questions concerning the role of blade mass and flexibility in determining the rotor’s dynamic response to typical pulses induced by turbulent fluctuations in the wind operational conditions.
The tests of controlled gust pulses imposed on a steady-state uniform wind, reported in Section 3.1 and Section 3.2, clearly confirm the principle that an increased blade flexibility enhances aerodynamic damping, thus accelerating the dissipation of the rotor’s oscillatory vibrations induced by turbulent fluctuations in operational conditions. With a moderate effort in terms of computational cost, important factors like the effect of blade flexibility and distributed mass in the level of aerodynamic damping and the associated decay time of shock-induced oscillations have been elucidated. These basic principles could be exploited in the future as a way to have passive-controlled mitigation of wind-turbulence-induced vibrations. With a minimal increase in terms of a turbine’s design and manufacturing costs, fatigue effects and operational life could be improved for the blades and for other components in the turbine’s drive train.
Moreover, as proven by the tests reported in Section 3.3, a generalization of the ROC of the SNL-NRT rotor to larger machines with geometrical similarity could be valuable in terms of extrapolating results from the present investigation and other ongoing studies to the scale of current and future commercial machines. As can be seen in Figure 14, when the shift in the natural frequency of the blade’s first flap-wise mode is considered, the new curve in blue practically coincides with the black curve of the oscillatory response of the original 27 m SNL-NRT machine.
This result was not in itself unexpected, as, even though a blade is a more complex structure, it is still essentially a cantilever beam in its reduced-order behavior. What was more remarkable was the fact that not only the dominant oscillating frequency but also the exponent of the vibrational decay (i.e., the enveloping curve of the oscillatory signal) scaled with length in the same exact manner. This latter notion is significant, as the exponential decay, being dependent on aerodynamic damping, is a parameter that is usually very difficult to predict because of the complexity of the aeroelastic phenomena associated with it.
As an outlook for further work, it may be observed that a generalization of the ROC of the SNL-NRT rotor to larger machines with geometrical similarity could be valuable in terms of extrapolating results from the present investigation and other ongoing studies to the scale of current and future commercial machines. In the same manner, a further study based on controlled pulses imposed on the wind samples of variable cross-flow profiles taken from the anemometer database of SNL’s SWiFT installation would also be worth exploring in the future. The latter study would help to determine how much coupling exists between oscillatory frequency modes associated with pulses originating on wind turbulence versus the cyclical pulses mentioned in the first category listed in the initial paragraphs of Section 3. Lastly, pulses caused by rapid control actions (like the ones studied in the past by the authors of [34]) are also worth looking into to determine how increases in flexibly change the oscillatory response of the turbine’s blades when those control actions are applied.

Author Contributions

Conceptualization, F.P., A.F., A.B. and N.Y.; methodology, F.P., A.F., A.B. and N.Y.; software, F.P., A.F., A.B. and N.Y.; validation, F.P., A.F., A.B. and N.Y.; formal analysis, F.P., A.F., A.B. and N.Y.; investigation, F.P., A.F., A.B. and N.Y.; resources, F.P., A.F., A.B. and N.Y.; data curation, F.P., A.F., A.B. and N.Y.; writing—original draft preparation, F.P., A.F., A.B. and N.Y.; writing—review and editing, F.P., A.F., A.B. and N.Y.; visualization, F.P., A.F., A.B. and N.Y.; supervision, F.P.; project administration, F.P.; funding acquisition, F.P. All authors have read and agreed to the published version of the manuscript.

Funding

The authors gratefully acknowledge the financial support of Sandia National Labs, USA, through awards PO-2074866 and PO-2159403, and the ME-EM Department at Michigan Technological University.

Data Availability Statement

Data are contained within the article.

Conflicts of Interest

The authors declare no conflicts of interest.

References

  1. Tabor, A. Testing on the Ground Before You Fly: Wind Tunnels at NASA Ames. 2020. Available online: https://www.nasa.gov/centers-and-facilities/ames/testing-on-the-ground-before-you-fly-wind-tunnels-at-nasa-ames/ (accessed on 20 January 2024).
  2. Jonkman, J.; Butterfield, S.; Musial, W.; Scott, G. Definition of A 5-MW Reference Wind Turbine for Offshore System Development; Technical Report NREL/TP-500-38060; National Renewable Energy Laboratory: Golden, CO, USA, 2009. [Google Scholar]
  3. Ekaterinaris, J.A. Numerical simulation of incompressible two-blade rotor flowfields. J. Propuls. Power 1998, 14, 367–374. [Google Scholar] [CrossRef]
  4. Duque, E.; Van Dam, C.; Hughes, S. Navier-Stokes simulations of the NREL combined experiment phase II rotor. In Proceedings of the 37th Aerospace Sciences Meeting and Exhibit, Reno, NV, USA, 11–14 January 1999; p. 37. [Google Scholar]
  5. Sorensen, N. Aerodynamic predictions for the unsteady aerodynamics experiment phase-II rotor at the National Renewable Energy Laboratory. In Proceedings of the 2000 ASME Wind Energy Symposium, Reno, NV, USA, 10–13 January 2000; p. 37. [Google Scholar]
  6. Hansen, M.; Sorensen, J.; Michelsen, J.; Sorensen, N.; Hansen, M.; Sorensen, J.; Michelsen, J.; Sorensen, N. A global Navier-Stokes rotor prediction model. In Proceedings of the 35th Aerospace Sciences Meeting and Exhibit, Reno, NV, USA, 6–10 January 1997; p. 970. [Google Scholar]
  7. Maronga, B.; Gryschka, M.; Heinze, R.; Hoffmann, F.; Kanani-Sühring, F.; Keck, M.; Ketelsen, K.; Letzel, M.O.; Sühring, M.; Raasch, S. The Parallelized Large-Eddy Simulation Model (PALM) version 4.0 for atmospheric and oceanic flows: Model formulation, recent developments, and future perspectives. Geosci. Model Dev. 2015, 8, 2515–2551. [Google Scholar] [CrossRef]
  8. Churchfield, M.; Lee, S.; Moriarty, P.; Martinez, L.; Leonardi, S.; Vijayakumar, G.; Brasseur, J. A large-eddy simulation of wind-plant aerodynamics. In Proceedings of the 50th AIAA Aerospace Sciences Meeting including the New Horizons Forum and Aerospace Exposition, Nashville, TN, USA, 9–12 January 2012; p. 537. [Google Scholar]
  9. Domino, S. Sierra Low Mach Module: Nalu Theory Manual 1.0. 2015. Available online: https://nalu.readthedocs.io/en/latest/source/theory/index.html (accessed on 20 January 2024).
  10. Sprague, M.A.; Ananthan, S.; Vijayakumar, G.; Robinson, M. ExaWind: A multifidelity modeling and simulation environment for wind energy. J. Phys. Conf. Ser. 2020, 1452, 012071. [Google Scholar] [CrossRef]
  11. Van Bussel, G.J. The Aerodynamics of Horizontal Axis Wind Turbine Rotors Explored with Asymptotic Expansion Methods. Ph.D. Thesis, Delft University of Technology, Delft, The Netherlands, 1995. [Google Scholar]
  12. Gebraad, P.M.; Teeuwisse, F.W.; Van Wingerden, J.; Fleming, P.A.; Ruben, S.D.; Marden, J.R.; Pao, L.Y. Wind plant power optimization through yaw control using a parametric model for wake effects—A CFD simulation study. Wind Energy 2016, 19, 95–114. [Google Scholar] [CrossRef]
  13. Doubrawa, P.; Quon, E.W.; Martinez-Tossas, L.A.; Shaler, K.; Debnath, M.; Hamilton, N.; Herges, T.G.; Maniaci, D.; Kelley, C.L.; Hsieh, A.S.; et al. Multimodel validation of single wakes in neutral and stratified atmospheric conditions. Wind Energy 2020, 23, 2027–2055. [Google Scholar] [CrossRef]
  14. Lignarolo, L.E.; Mehta, D.; Stevens, R.J.; Yilmaz, A.E.; van Kuik, G.; Andersen, S.J.; Meneveau, C.; Ferreira, C.J.; Ragni, D.; Meyers, J.; et al. Validation of four LES and a vortex model against stereo-PIV measurements in the near wake of an actuator disc and a wind turbine. Renew. Energy 2016, 94, 510–523. [Google Scholar] [CrossRef]
  15. Manwell, J.F.; McGowan, J.G.; Rogers, A.L. Wind Energy Explained: Theory, Design and Application; Wiley: Chichester, UK, 2009. [Google Scholar]
  16. Burton, T.; Sharpe, D.; Jenkins, N.; Bossanyi, E. Wind Energy Handbook; Wiley: Chichester, UK, 2001. [Google Scholar]
  17. Ponta, F.L.; Otero, A.D.; Lago, L.I.; Rajan, A. Effects of rotor deformation in wind-turbine performance: The Dynamic Rotor Deformation Blade Element Momentum model (DRD–BEM). Renew. Energy 2016, 92, 157–170. [Google Scholar] [CrossRef]
  18. Jalal, S.; Ponta, F.; Baruah, A.; Rajan, A. Dynamic Aeroelastic Response of Stall-Controlled Wind Turbine Rotors in Turbulent Wind Conditions. Appl. Sci. 2021, 11, 6886. [Google Scholar] [CrossRef]
  19. Jaimes, O.G. Design Concepts for Offshore Wind Turbines: A Technical and Economical Study on the Trade-off Between Stall and Pitch Controlled Systems. Ph.D. Thesis, Delft University of Technology, Delft, The Netherlands, 2010. [Google Scholar]
  20. Kelley, C.L.; Ennis, B.L. SWiFT Site Atmospheric Characterization; Technical Report SAND2016-0216; Sandia National Lab.: Albuquerque, NM, USA, 2016. [Google Scholar]
  21. Berg, J.; Bryant, J.; LeBlanc, B.; Maniaci, D.C.; Naughton, B.; Paquette, J.A.; Resor, B.R.; White, J.; Kroeker, D. Scaled wind farm technology facility overview. In Proceedings of the 32nd ASME Wind Energy Symposium, National Harbor, MD, USA, 13–17 January 2014; p. 1088. [Google Scholar]
  22. Barone, M.F.; White, J. DOE/SNL-TTU Scaled Wind Farm Technology Facility; Technical Report SAND2011-6522; Sandia National Lab.: Albuquerque, NM, USA, 2011. [Google Scholar]
  23. Ponta, F.L.; Jacovkis, P.M. A vortex model for Darrieus turbine using finite element techniques. Renew. Energy 2001, 24, 1–18. [Google Scholar] [CrossRef]
  24. Strickland, J.H.; Webster, B.T.; Nguyen, T. A Vortex Model of the Darrieus Turbine: An Analytical and Experimental Study. J. Fluids Eng. 1979, 101, 500–505. [Google Scholar] [CrossRef]
  25. Cottet, G.H.; Koumoutsakos, P.D. Vortex Methods: Theory and Practice; Cambridge University Press: London, UK, 2000. [Google Scholar]
  26. Karamcheti, K. Principles of Ideal-Fluid Aerodynamics; Wiley: New York, NY, USA, 1966. [Google Scholar]
  27. Ponta, F.L. Vortex decay in the Kármán eddy street. Phys. Fluids 2010, 22, 093601. [Google Scholar] [CrossRef]
  28. Lamb, H. Hydrodynamics, 6th ed.; Cambridge University Press: Cambridge, UK, 1932. [Google Scholar]
  29. Batchelor, G.K. An Introduction to Fluid Dynamics; Cambridge University Press: Cambridge, UK, 2000. [Google Scholar]
  30. Trieling, R.R.; van Wesenbeeck, J.M.A.; van Heijst, G.J.F. Dipolar vortices in a strain flow. Phys. Fluids 1998, 10, 144–159. [Google Scholar] [CrossRef]
  31. Flór, J.B.; van Heijst, G.J.F. An experimental study of dipolar structures in a stratified fluid. J. Fluid Mech. 1994, 279, 101–133. [Google Scholar] [CrossRef]
  32. Hooker, S.G. On the action of viscosity in increasing the spacing ration of a vortex street. Proc. Roy. Soc. 1936, A154, 67–89. [Google Scholar]
  33. Kelley, C.L. Aerodynamic Design of the National Rotor Testbed; Technical Report SAND2015-8989; Sandia National Lab.: Albuquerque, NM, USA, 2015. [Google Scholar]
  34. Menon, M.; Ponta, F. Aeroelastic Response of Wind Turbine Rotors under Rapid Actuation of Flap-Based Flow Control Devices. Fluids 2022, 7, 129. [Google Scholar] [CrossRef]
Figure 1. Block schematics of CODEF, with expanded capabilities for farm simulations.
Fluids 09 00083 g001
Figure 2. A schematic representation of the DRD-BEM coordinate transformations for the projection of velocities and forces by orthogonal matrix linear operators, including a schematic representation of the GTBM process in the bottom box.
Fluids 09 00083 g002
Figure 3. The span distribution of flap-wise stiffness (top) and edge-wise stiffness (bottom) for the SNL-NRT baseline blade and its flex variations.
Fluids 09 00083 g003
Figure 4. The span distribution of torsional stiffness (top) and mass distribution (bottom) for the SNL-NRT baseline blade and its flex variations.
Fluids 09 00083 g004
Figure 5. Amplitude vs. time-span chart for a sample of typical fluctuations in wind speed [18].
Fluids 09 00083 g005
Figure 6. Examples of the time evolution of the blade tip axial deflection for the baseline blade and its three flexible variations. Pulse: 1 m/s Amp, 0.5 s Tsp over steady uniform-stream conditions. (a): WS = 6 m/s. TSR = 9, Pitch = 0°. (b): WS = 11.11 m/s, TSR = 6.197, Pitch = 0°. (c): WS = 15 m/s, TSR = 4.59, Pitch = 11.651°.
Fluids 09 00083 g006
Figure 7. The time evolution of the blade tip axial deflection. Pulse: 1 m/s Amp, 0.5 s Tsp over steady uniform-stream conditions at WS = 11.11 m/s, TSR = 6.197, Pitch = 0°. Baseline blade plus three flexible variations, with close-up views for each individual blade type.
Fluids 09 00083 g007
Figure 8. Time evolution of power at hub. Steady uniform-stream conditions, WS = 11.11 m/s, TSR = 6.197, Pitch = 0°. Pulse: 0.5 m/s Amp, 0.2 s Tsp. Baseline blade plus three flexible variations.
Fluids 09 00083 g008
Figure 9. The time evolution of the axial blade deflection for a sample of pulses applied onto a steady uniform-stream mean wind of WS = 6 m/s, TSR = 9 and Pitch = 0°. (Top): Baseline blade. (Bottom): 20%SpSh flexible variation.
Fluids 09 00083 g009
Figure 10. Pulse-energy-normalized counterpart of the same time evolution curves for the blade deflection previously shown in Figure 9.
Fluids 09 00083 g010
Figure 11. A sample of the time evolution curves of energy-normalized axial blade deflection for different wind conditions covering the operational range of the SNL-NRT rotor. (a): WS = 6 m/s, TSR = 9, Pitch = 0°. (b): WS = 11.11 m/s, TSR = 6.197, Pitch = 0°. (c): WS = 15 m/s, TSR = 4.59, Pitch = 11.651°.
Fluids 09 00083 g011
Figure 12. A semi-log plot of the time evolution of the normalized blade deflection at 90% span, for a pulse of 0.25 m/s Amp and 0.1 sec Tsp, applied onto a steady uniform-stream mean wind of WS = 6 m/s, TSR = 9, Pitch = 0°. The slopes of the red and blue lines indicate the exponential decays of the first and second oscillatory modes, respectively.
Fluids 09 00083 g012
Figure 13. The variation in the exponential decay of the aerodynamic damping for the complete range of operational wind speeds in the stable oscillatory regime of the DU-5MW-RWT rotor from the findings of Jalal et al. [18] (shown here to illustrate the concept).
Fluids 09 00083 g013
Figure 14. A sample test of a comparison between the time evolution of the energy-normalized blade deflection for the original SNL-NRT baseline rotor and the 10× scaled-up version of geometrical and material similarity, when subjected to a controlled gust pulse. The blue line shows a time-corrected version of the green curve for the response of the up-scaled rotor. The lower panel shows a close-up view of the first 5 s of the signal.
Fluids 09 00083 g014
Table 1. Total blade mass for the SNL-NRT baseline blade and its flex variations.
Blade VariantMass (Kg)% BsLn Mass
BsLn551.157100.000
60%SpSh360.59465.425
40%Sp–60%Sh344.86362.571
40%SpSh260.44547.254
20%Sp–40%Sh244.60144.380
20%SpSh156.28628.356
Disclaimer/Publisher’s Note: The statements, opinions and data contained in all publications are solely those of the individual author(s) and contributor(s) and not of MDPI and/or the editor(s). MDPI and/or the editor(s) disclaim responsibility for any injury to people or property resulting from any ideas, methods, instructions or products referred to in the content.

