Abstract
Characterization of the physiological hemodynamic environment in normal pulmonary arteries is a key factor in understanding pathological conditions. This study aimed to analyze the morphology and hemodynamics in the healthy adult pulmonary bifurcation in comparison to age-matched repaired Tetralogy of Fallot (rTOF) geometries. The pulmonary trunk of five healthy volunteers was reconstructed from 4D Flow-MRI data and was compared to rTOF results. Subject-specific boundary conditions were assigned in both the inlet and outlets of the models, and flow characteristics were analyzed computationally. The morphological and flow features were consistent among the healthy geometries, highlighting the ability of an averaged geometry derived from this small cohort to capture the main flow characteristics. A slightly higher mean time-averaged wall shear stress (TAWSS) was found in the right pulmonary artery, which was also the branch with a higher mean curvature and local Reynolds number. Compared to rTOF results, the averaged healthy geometry demonstrated more than an 8-fold lower value in TAWSS, with the individual patient-specific healthy volunteers showing further reduced TAWSS than the rTOF patients. These observations could be useful in clinical assessment and decision making based on hemodynamic indices.
1. Introduction
The pulmonary arteries are distinct vessels with a complex anatomy and unique biomechanical characteristics. Under normal conditions, the pulmonary bifurcation is characterized as a low-resistance, low-pressure, and high-flow environment [1]. Changes in blood pressure have been shown to modify the wall compliance and thickness, influencing the proximal and distal pulmonary vasculature [2,3]. Knowledge of the hemodynamic environment in healthy pulmonary arteries is a key factor in understanding pathological conditions which can disturb the flow environment or lead to remodeling of the pulmonary arteries [4,5,6,7]. The relationship between anatomical geometry and hemodynamic features appears significant in both health [8] and disease [9,10], and requires further investigation.
Previous studies have attempted to perform the hemodynamic assessment of normal pulmonary arteries. Tang et al. (2011) combined computational fluid dynamics (CFD) tools with magnetic resonance imaging (MRI) to investigate the blood flow in six healthy subjects (median age of 33 years old, range 21–51 years), under rest and exercise conditions [11]. Their study focused mainly on the wall shear stress (WSS), and showed an increase in the WSS values with exercise [11]. Bächler et al. (2013) analyzed the 4D flow patterns in eighteen healthy volunteers with a mean age of 30.3 ± 5.7 years old [12]. Utilizing magnetic resonance velocity mapping, they found that helical structures develop in the right pulmonary artery (RPA) and left pulmonary artery (LPA) branches [12]. More recently, Capuano et al. (2019) analyzed the blood flow in an anatomical averaged model, derived from five young subject-specific models (age range 4–18 years old), and concluded that the pulmonary bifurcation is hemodynamically efficient in healthy volunteers [8]. In addition, they explained the mechanism of the helical structure formation in RPA, being linked to the main pulmonary artery (MPA) curvature, leading to boundary layer detachment [8]. Finally, Hu et al. (2020) utilized 4D flow cardiac magnetic resonance to investigate the relationship between hemodynamic changes and right heart function and associated increased peak WSS and energy loss with pulmonary hemodynamic changes in the main and right pulmonary arteries [13].
In this new study, we analyze in detail five new subject-specific models from healthy volunteers (age range 27–59 years old) and present their anatomical averaged geometry to investigate the morphological features and the blood flow environment with computational tools. We further provide new information on the comparison of healthy geometries to age-matched adult repaired Tetralogy of Fallot (rTOF) [14,15,16,17,18] results (age range 19 to 54 years) presented previously by Boumpouli et al. (2021) [19]. To the best of our knowledge, this is the first study attempting to quantify differences between healthy and rTOF geometries.
2. Materials and Methods
2.1. Cohorts and Extraction of DICOM Stacks
Retrospective data from five healthy subjects (n = 5) were used to study the blood flow in the pulmonary bifurcation of healthy volunteers (mean age 44.6 ± 14.2 years, see Table 1 for demographic data). Four-dimensional flow MRI images were acquired using an MRI research 4D flow sequence with retrospective electrocardiogram (ECG) gating and respiratory gating (Figure 1A), a spatial resolution of 3.6 mm × 2.4 mm × 2.6 mm, and velocity encoding (VENC) of 150 cm/s. The 4D flow MRI datasets were then imported into Circle Cardiovascular Imaging Software (cvi42®, Calgary, AB, Canada, v. 5.11) for further analysis, in a novel process described in detail in Black et al. (2023) [20]. Briefly, mask correction was utilized to distinguish static tissue and regions of blood flow, while instantaneous velocity streamlines (Figure 1B) of the entire region of interest (ROI), including the pulmonary arteries, were visualized at systolic acceleration (SA), peak systole (PS), and systolic deceleration (SD). At each time-step, the continuous ROI was discretized to create a set of axial, coronal, and sagittal slices, resulting in a complete Digital Imaging and Communications in Medicine (DICOM) stack (Figure 1C). Pixel intensity within the lumen was proportional to the velocity magnitude of blood. A temporal composite image at each slice was then created from the SA, PS, and SD images, which were combined via superimposition (Figure 1D) and imported into ITK-Snap for segmentation and reconstruction (Figure 1E; see Section 2.3). The clinical data were part of a research dataset from the Queen Elizabeth Hospital, Glasgow, UK (see Institutional Review Board Statement).
Results from the healthy group were compared with retrospective clinical data from five adult rTOF patients (n = 5) presented previously by Boumpouli et al. (2021) [19], with a mean age of 33.4 ± 14.2 years. Further information on the rTOF data can be found in [19].
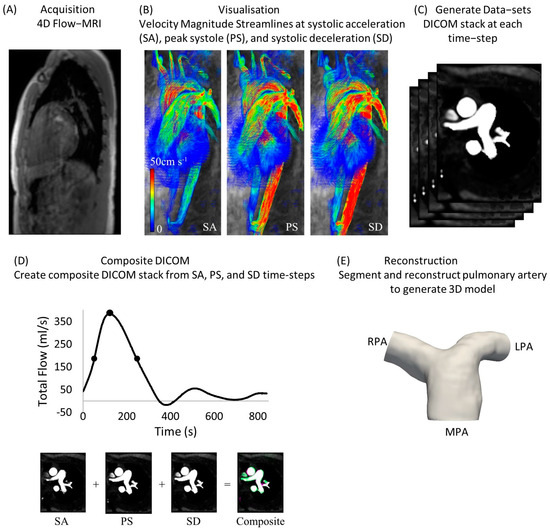
Figure 1.
Analysis of 4D flow MRI data from healthy volunteers for the creation of a DICOM stack [20]. (A) Acquisition of 4D flow MRI data; (B) instantaneous velocity streamlines at systolic acceleration (SA), peak systole (PS) and systolic deceleration (SD); (C) generation of datasets at each time-step; (D) creation of a composite DICOM stack from SA, PS, and SD time-steps; (E) reconstruction of pulmonary arterial model.
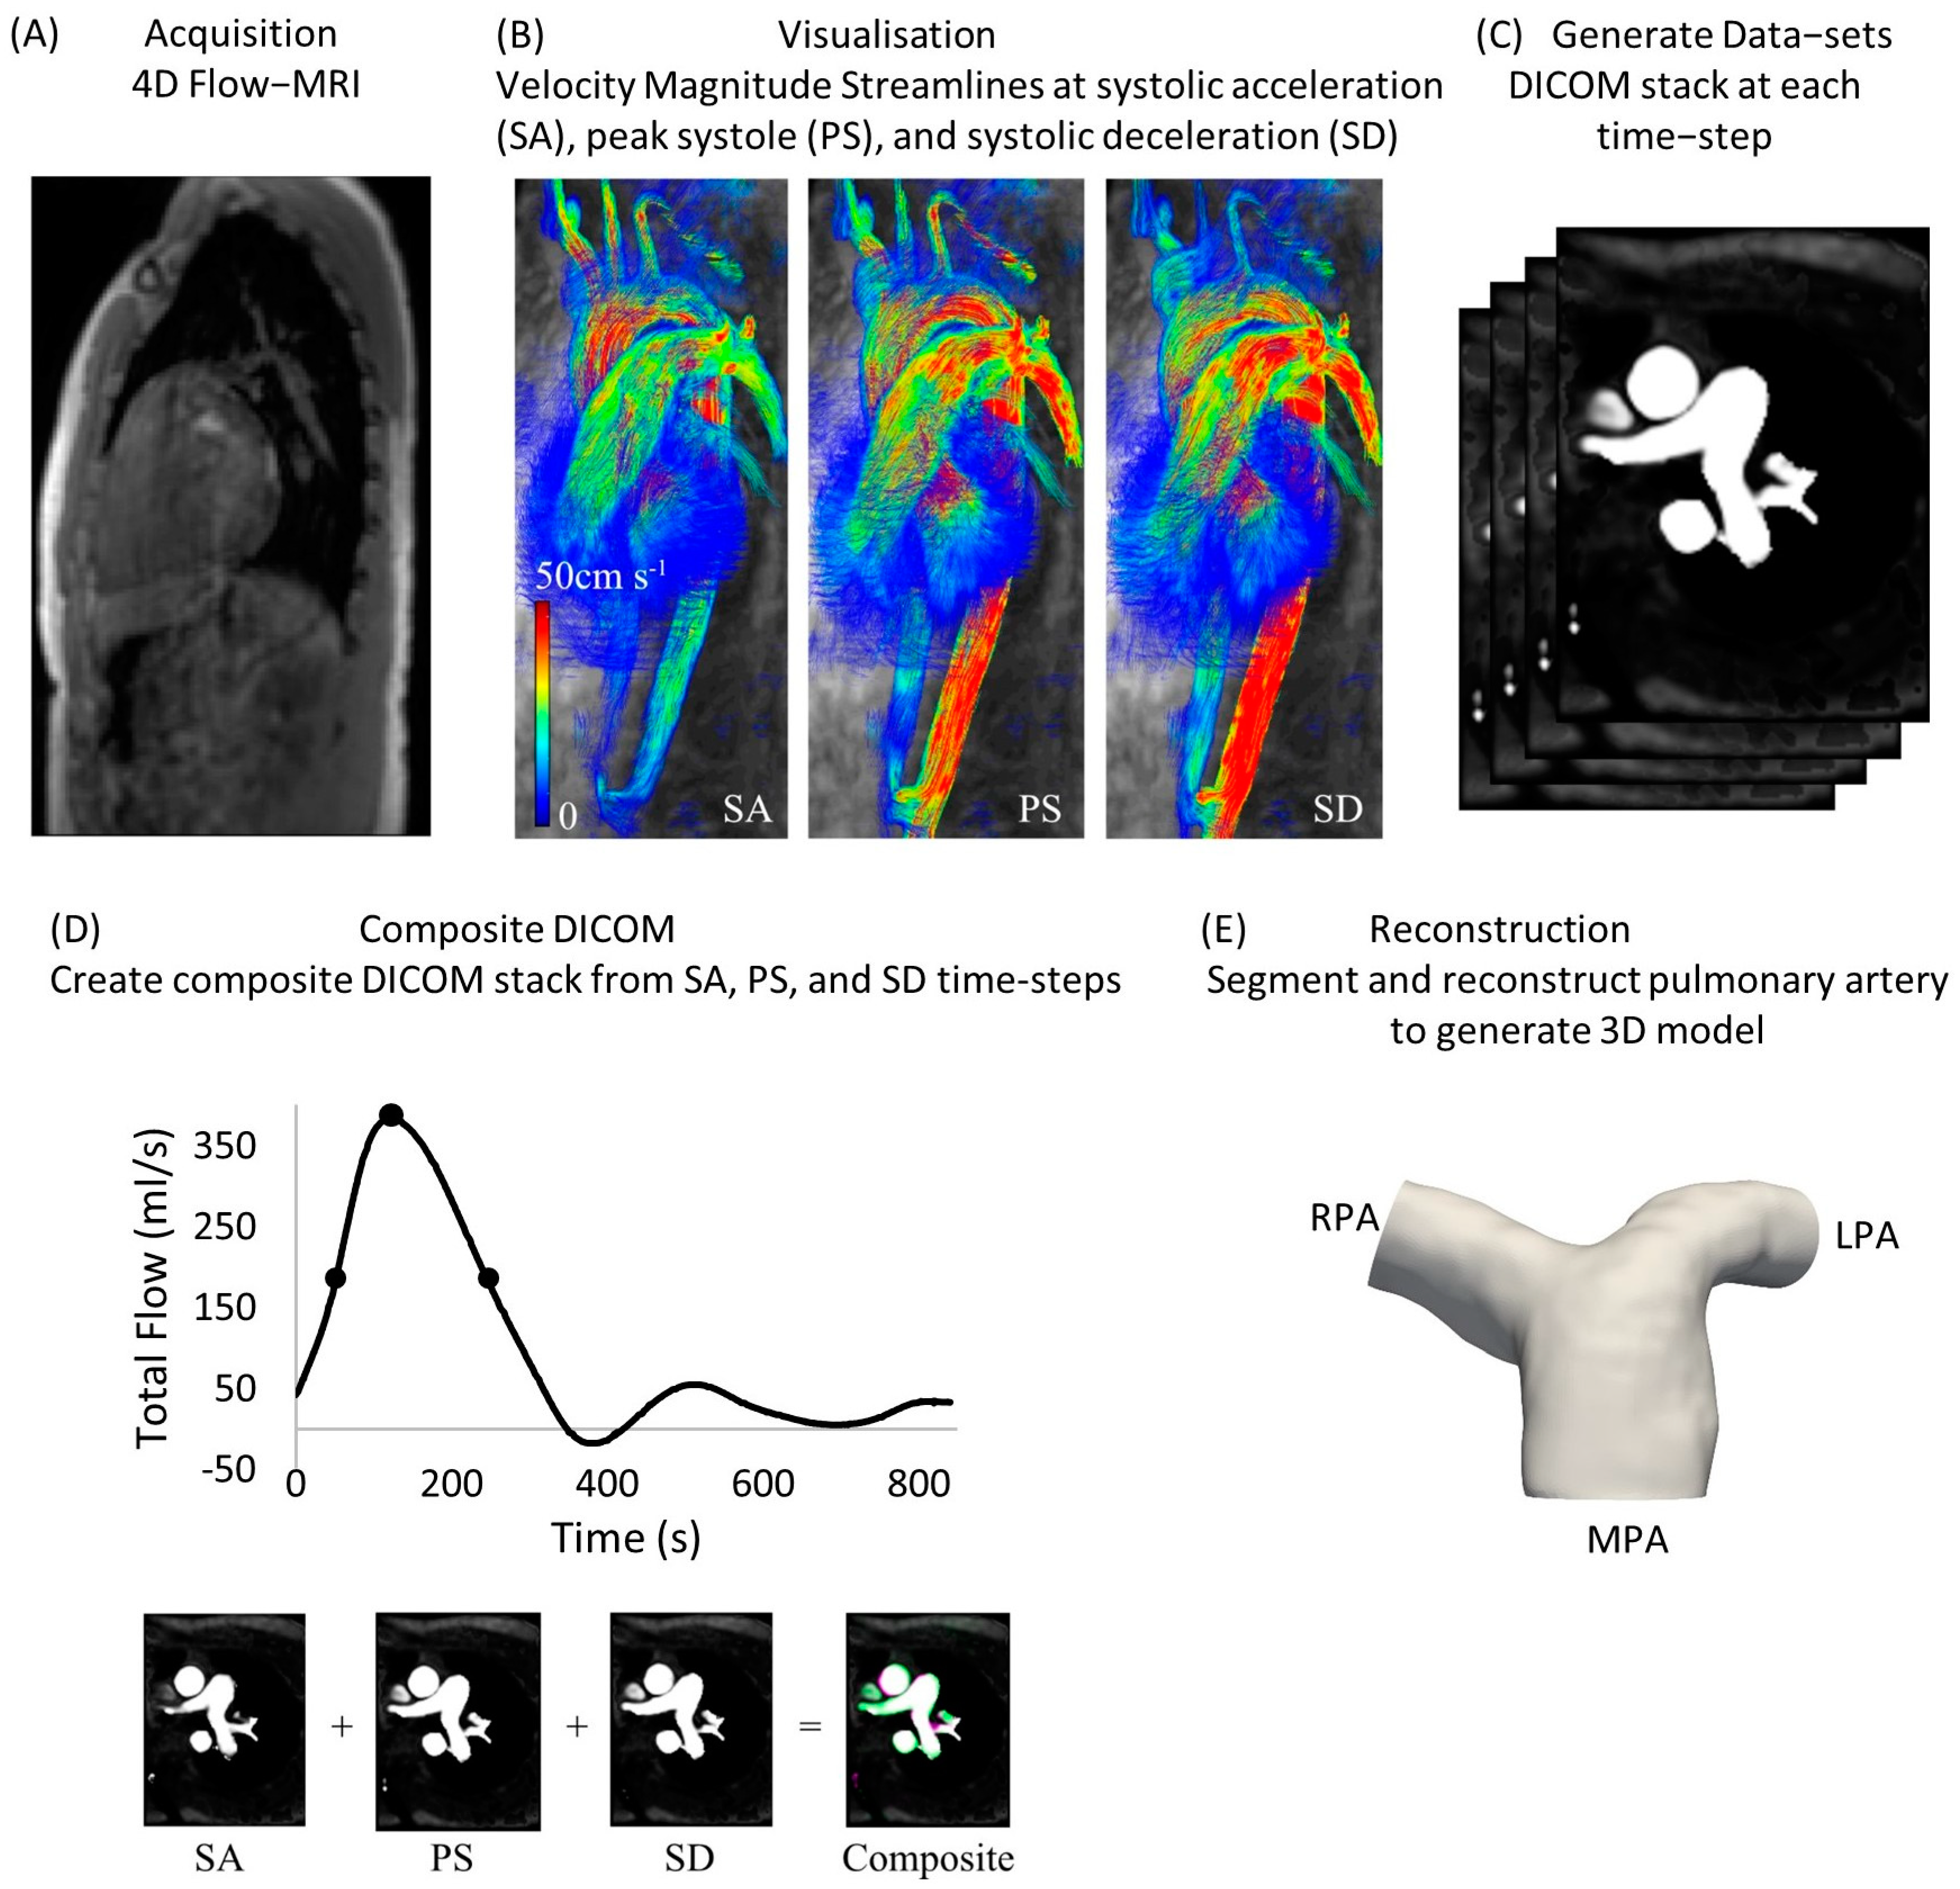

Table 1.
Demographic data of the five healthy subjects, and the RPA and LPA flow splits used as outflow boundary conditions (as described in Section 2).
Table 1.
Demographic data of the five healthy subjects, and the RPA and LPA flow splits used as outflow boundary conditions (as described in Section 2).
| Healthy Subject | Sex | Age at Scan | Flow Split (QRPA:QLPA) |
|---|---|---|---|
| 1 | Female | 47 years | 56.2:43.8 |
| 2 | Male | 59 years | 53.2:46.8 |
| 3 | Male | 33 years | 52.2:47.8 |
| 4 | Male | 57 years | 54.1:45.9 |
| 5 | Male | 27 years | 44.0:56.0 |
| Mean value | - | 44.6 ± 14.2 years | 52.0:48.0 |
2.2. Flow Information
The flow information was extracted from the 4D flow MRI data using the cvi42® software (v. 5.11). The pulmonary trunk was isolated, and centerlines along the MPA and the main daughter branches were created. The threshold for each tracked branch was adapted to ensure the best fit, while slices perpendicular to each branch were obtained.
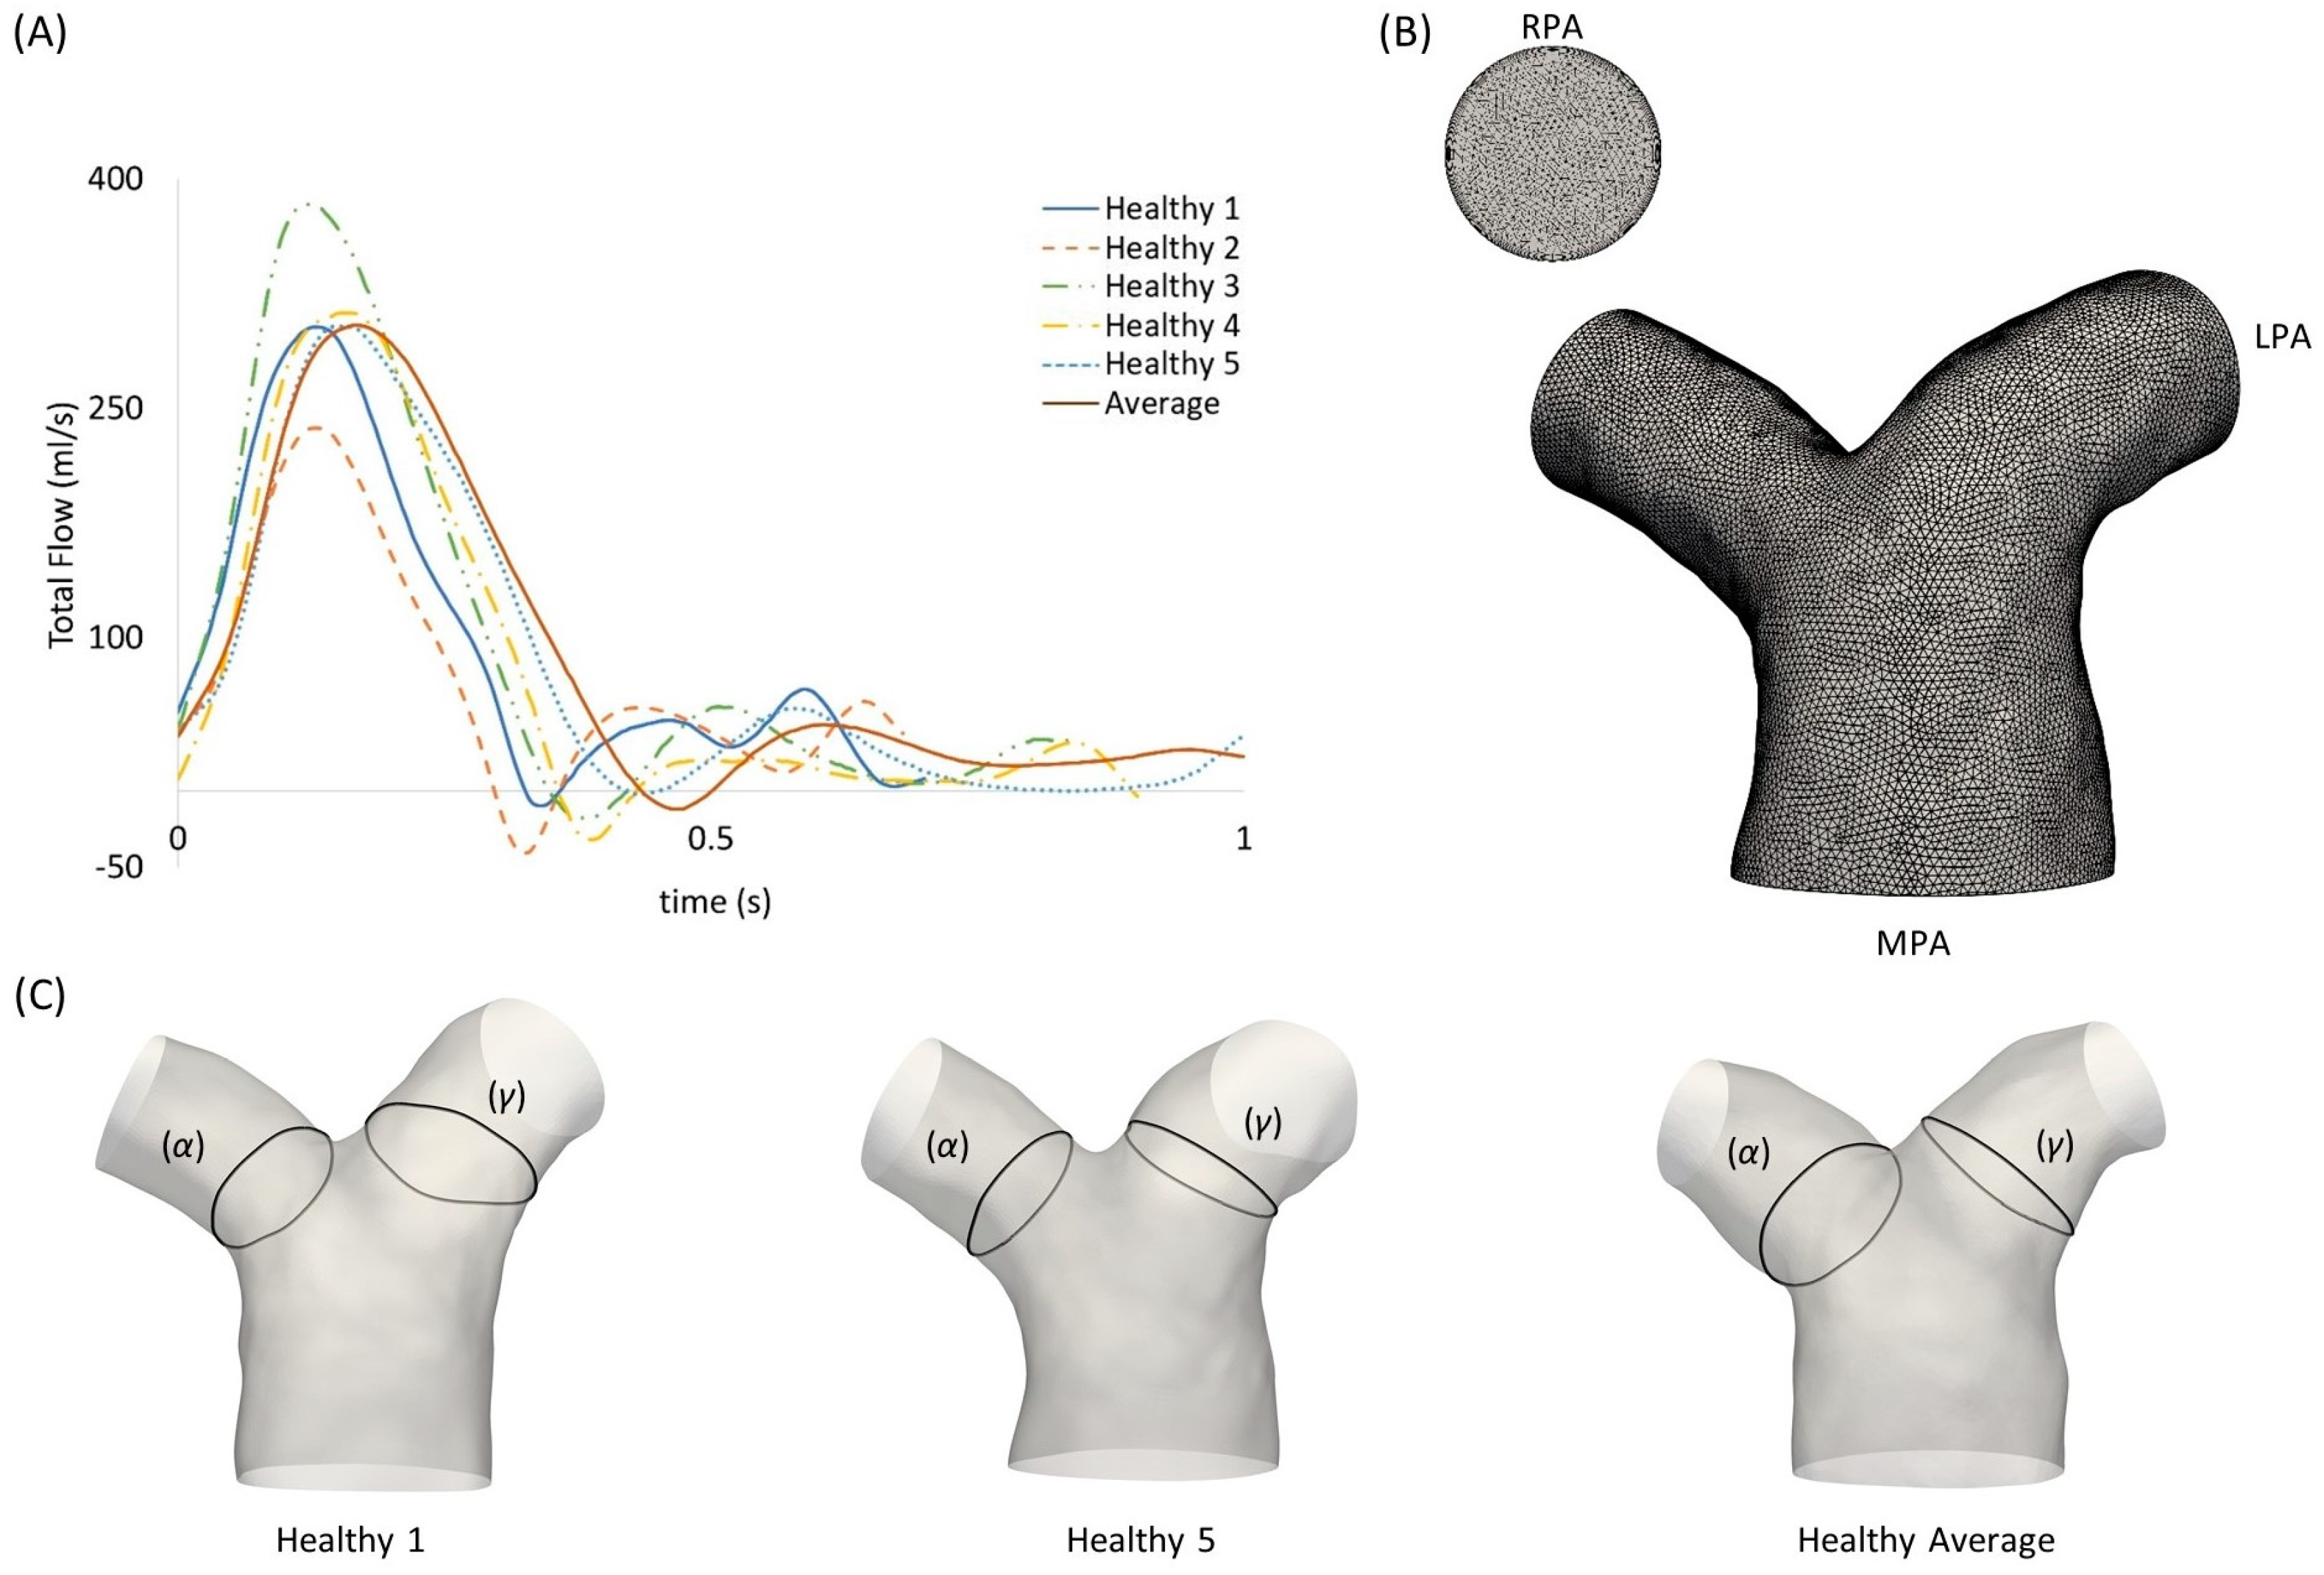
The inlet flow rate waveforms of each subject are presented in Figure 2A. An average flow rate waveform was calculated based on the five healthy patient waveforms, normalized in time using the respective period of the cardiac cycle of each subject. The mean and maximum values of the flow rates were also measured. Table 2 presents the mean and standard deviation of the diameters, mean flow rate, and mean and maximum velocities of the MPA, RPA and LPA branches for the healthy subjects (n = 5), in comparison to the rTOF mean values (n = 5). The individual values for each healthy subject and the averaged model are provided in the Supplementary Materials (Table S1). Flow waveforms from the RPA and the LPA were further acquired from the 4D flow MRI data. The net volumes from the RPA and LPA flow rates, defined as the forward minus backward volume, in mL, over the cardiac cycle, were used to estimate the flow splits in the daughter branches, as described in Boumpouli et al. (2021) [19] (presented in Table 1 for all healthy subjects). The average flow split was found to be approximately 52%:48% (QRPA-av:QLPA-av).
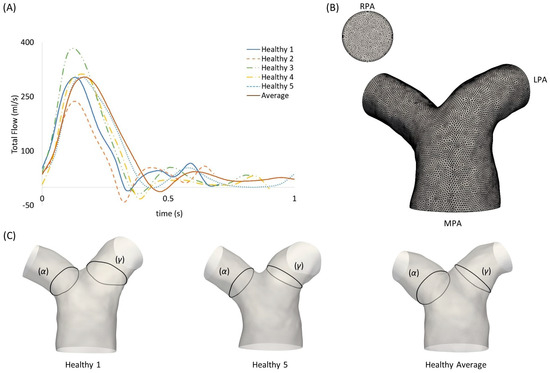
Figure 2.
(A) Subject-specific pulsatile inlet flow rate waveform for the five healthy subjects and the average flow rate waveform, normalized in time by the respective period of each cardiac cycle. (B) Computational mesh of the averaged geometry with 7 prismatic layers for the boundary layer mesh visible in the RPA branch outlet. (C) Anatomical landmarks of the cross-sections (α) and (γ) shown in healthy geometries 1 and 5, and the healthy averaged model.

Table 2.
The mean and standard deviation of the diameters, mean flow rate, and mean and maximum velocities for the MPA, RPA and LPA branches of the healthy subjects (n = 5) and the age-matched adult rTOF patients (n = 5).
2.3. Subject-Specific and Anatomical Averaged Models
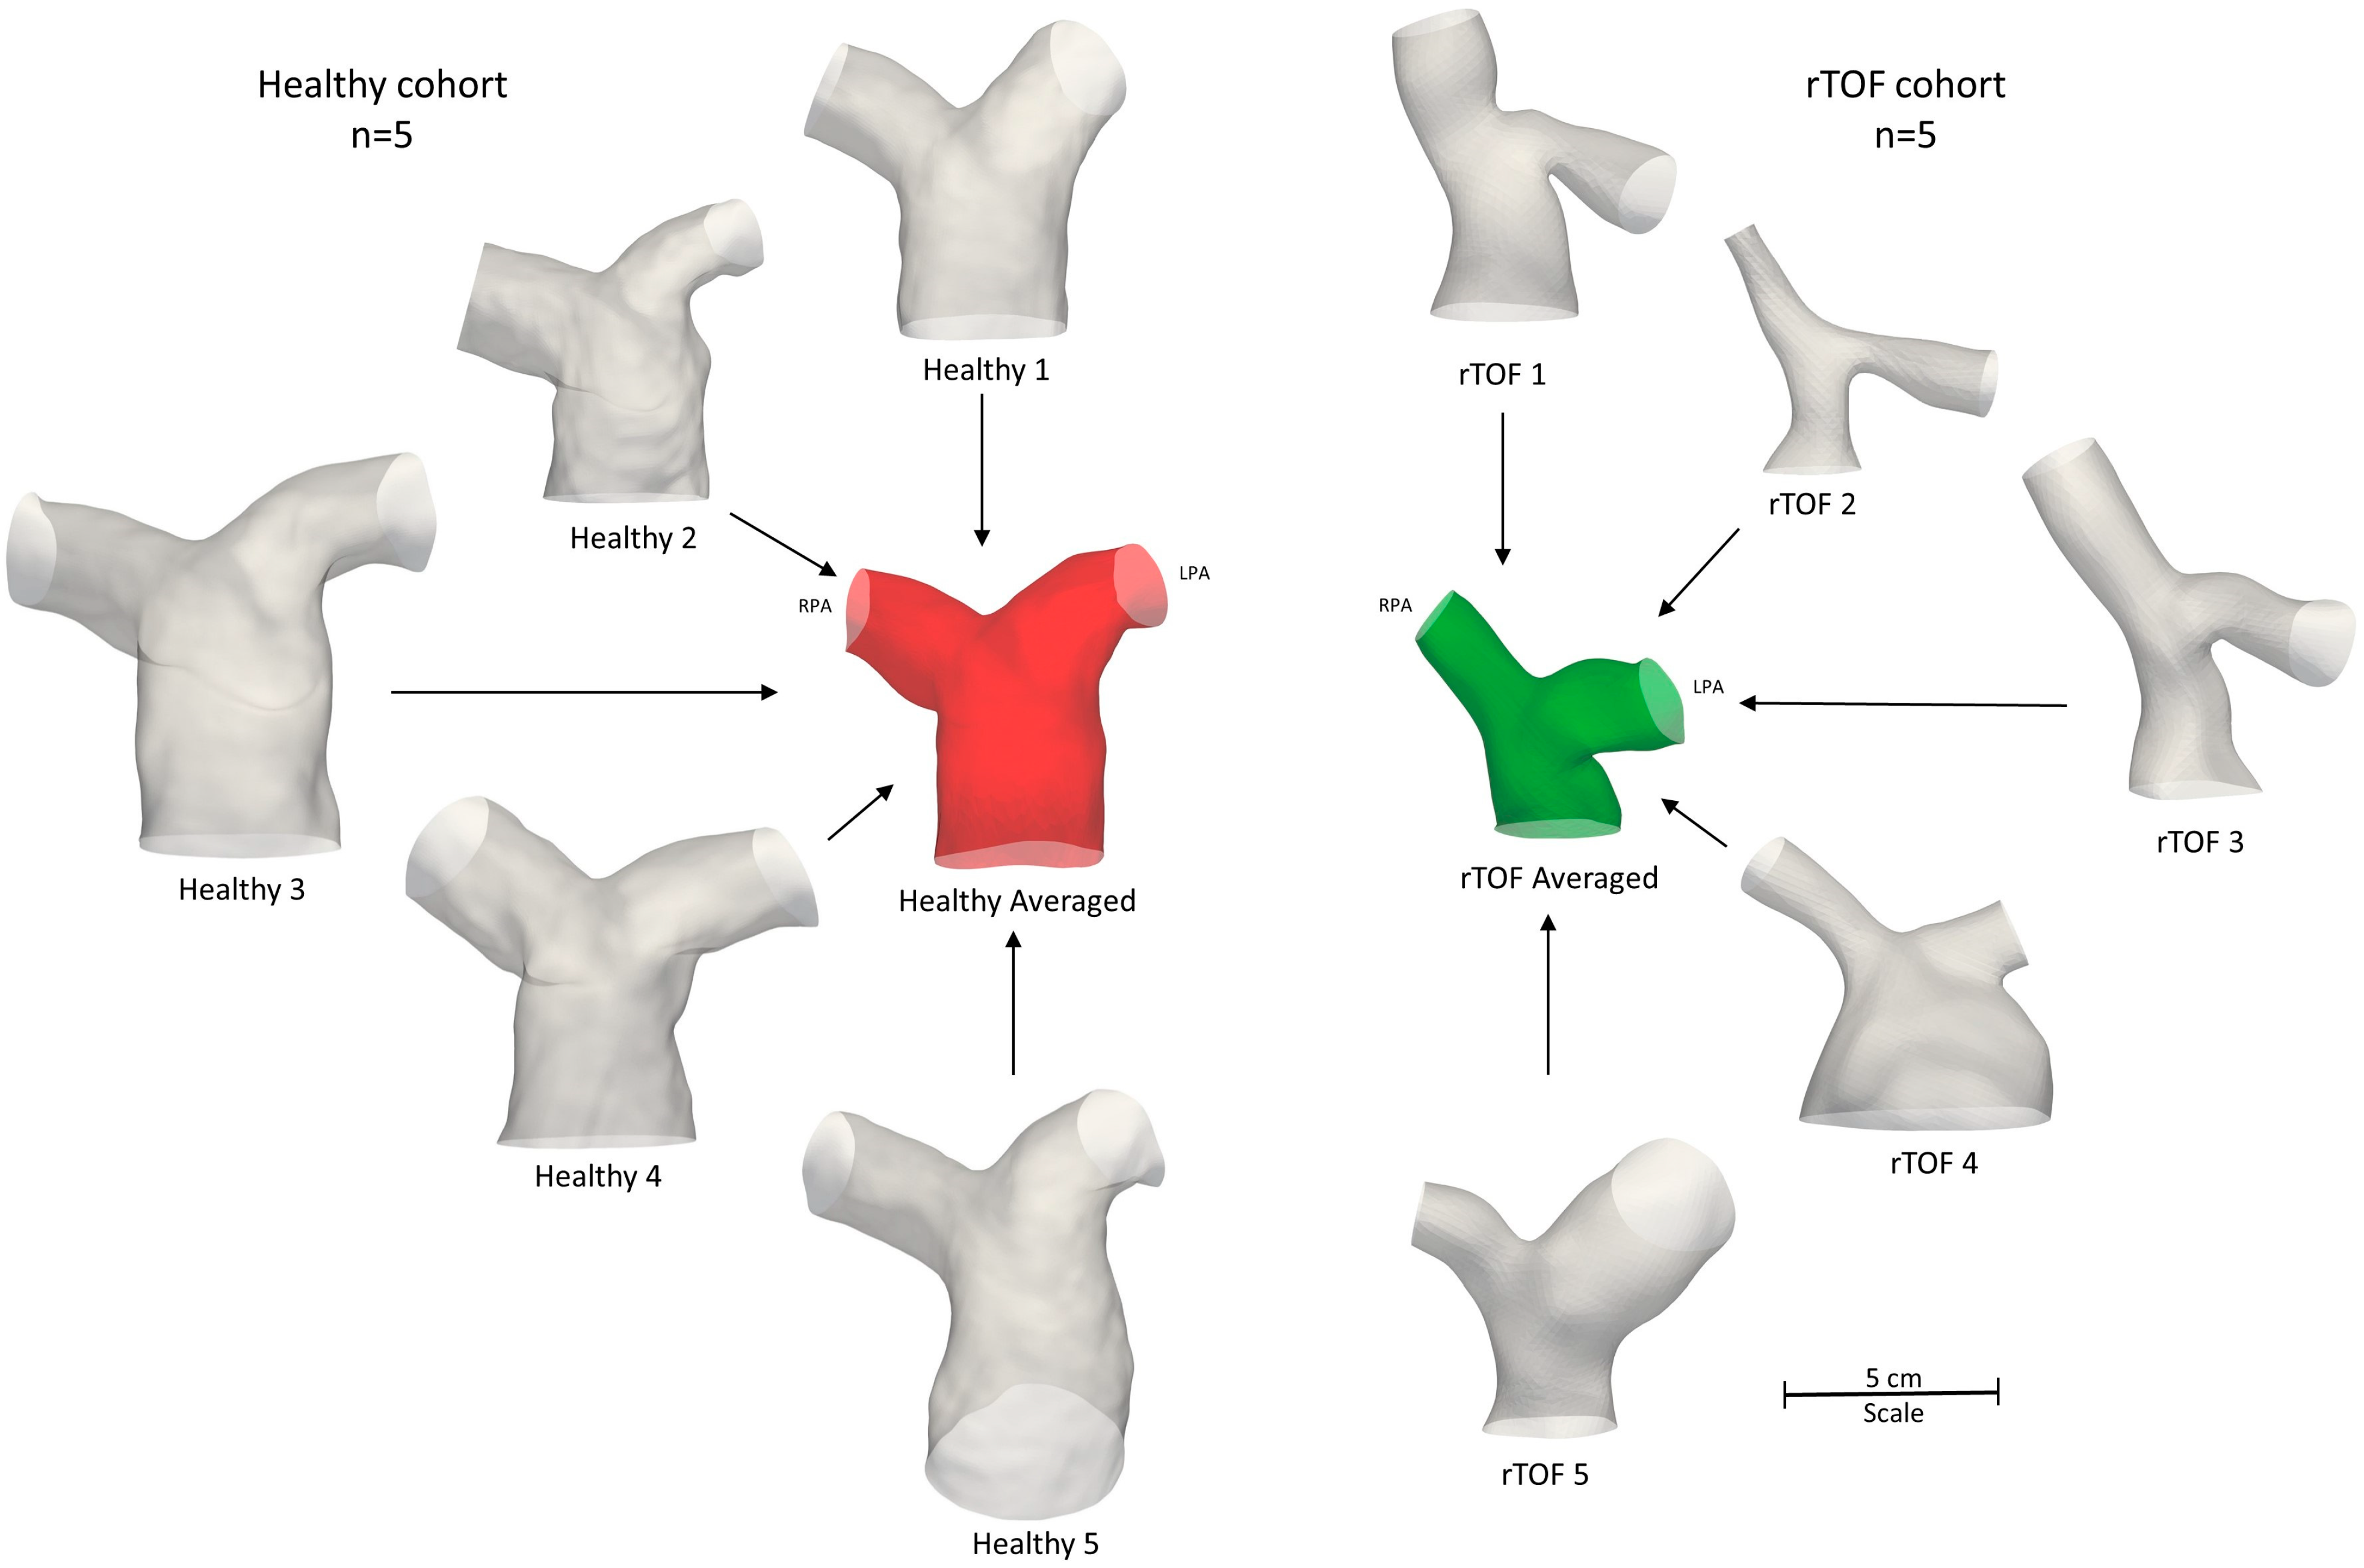
To segment the subject-specific structures, a combination of semi-automatic and manual segmentation was used in the open-source software ITK-SNAP (www.itksnap.org, v.3.8.0, accessed on 15 December 2020) [21], as described in Boumpouli et al. (2021) [19]. The segmentation was extended until the first daughter branch on the right and left pulmonary branches and branch extensions were added to avoid boundary effects. An anatomical averaged geometry was also created using Deformetrica (www.deformetrica.org/, v.4.3.0, accessed on 20 January 2021) [22], a statistical shape analysis tool, following the methodology described in [19] for the rTOF patient geometries. Statistical shape analysis has gained a lot of attention over the past few years in cardiovascular research as it enables a better understanding of geometric patterns within a population [8,9,23,24,25]. Briefly, the model of the 1st subject was used as the initial template model, and the process was repeated five times, with the calculated template utilized as the reference geometry at each further iteration. The final averaged model was decided based on the maximum surface distance between the reference and the calculated model, which was approximately 1% in the final iteration. The five healthy models with the final averaged geometry (red) are presented on the left of Figure 3, together with the five rTOF patient models and the rTOF averaged geometry (green) [19] (right of Figure 3).
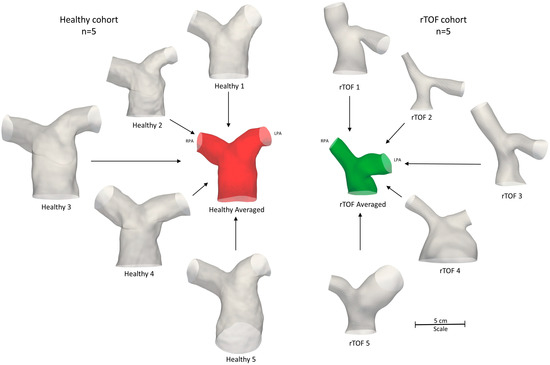
Figure 3.
Anatomical averaged geometry of all healthy subjects (red, n = 5) and anatomical averaged geometry of the adult rTOF patients (green, n = 5) [19]. The respective healthy (left) and patient-specific (right) models are also shown. All geometries are to scale.
2.4. Morphological Analysis
A geometric analysis was conducted in the open-source software VMTK (www.vmtk.org, v.1.4.0, accessed on 1 February 2021), to quantify (i) the curvature κ(s) of the RPA and LPA branches, measuring the deviation of a curve from a straight line [26], according to , where c(s) represents the centerlines of the models, with (s) being the curvilinear abscissa [27]; (ii) the tortuosity, describing the relative increment from a straight line along the length of the curve [26]; (iii) the minimum inscribed sphere radius along the daughter branches [28]; and (iv) the in-plane and (v) out-of-plane angles, measuring the bifurcation angle and planarity, respectively [29].
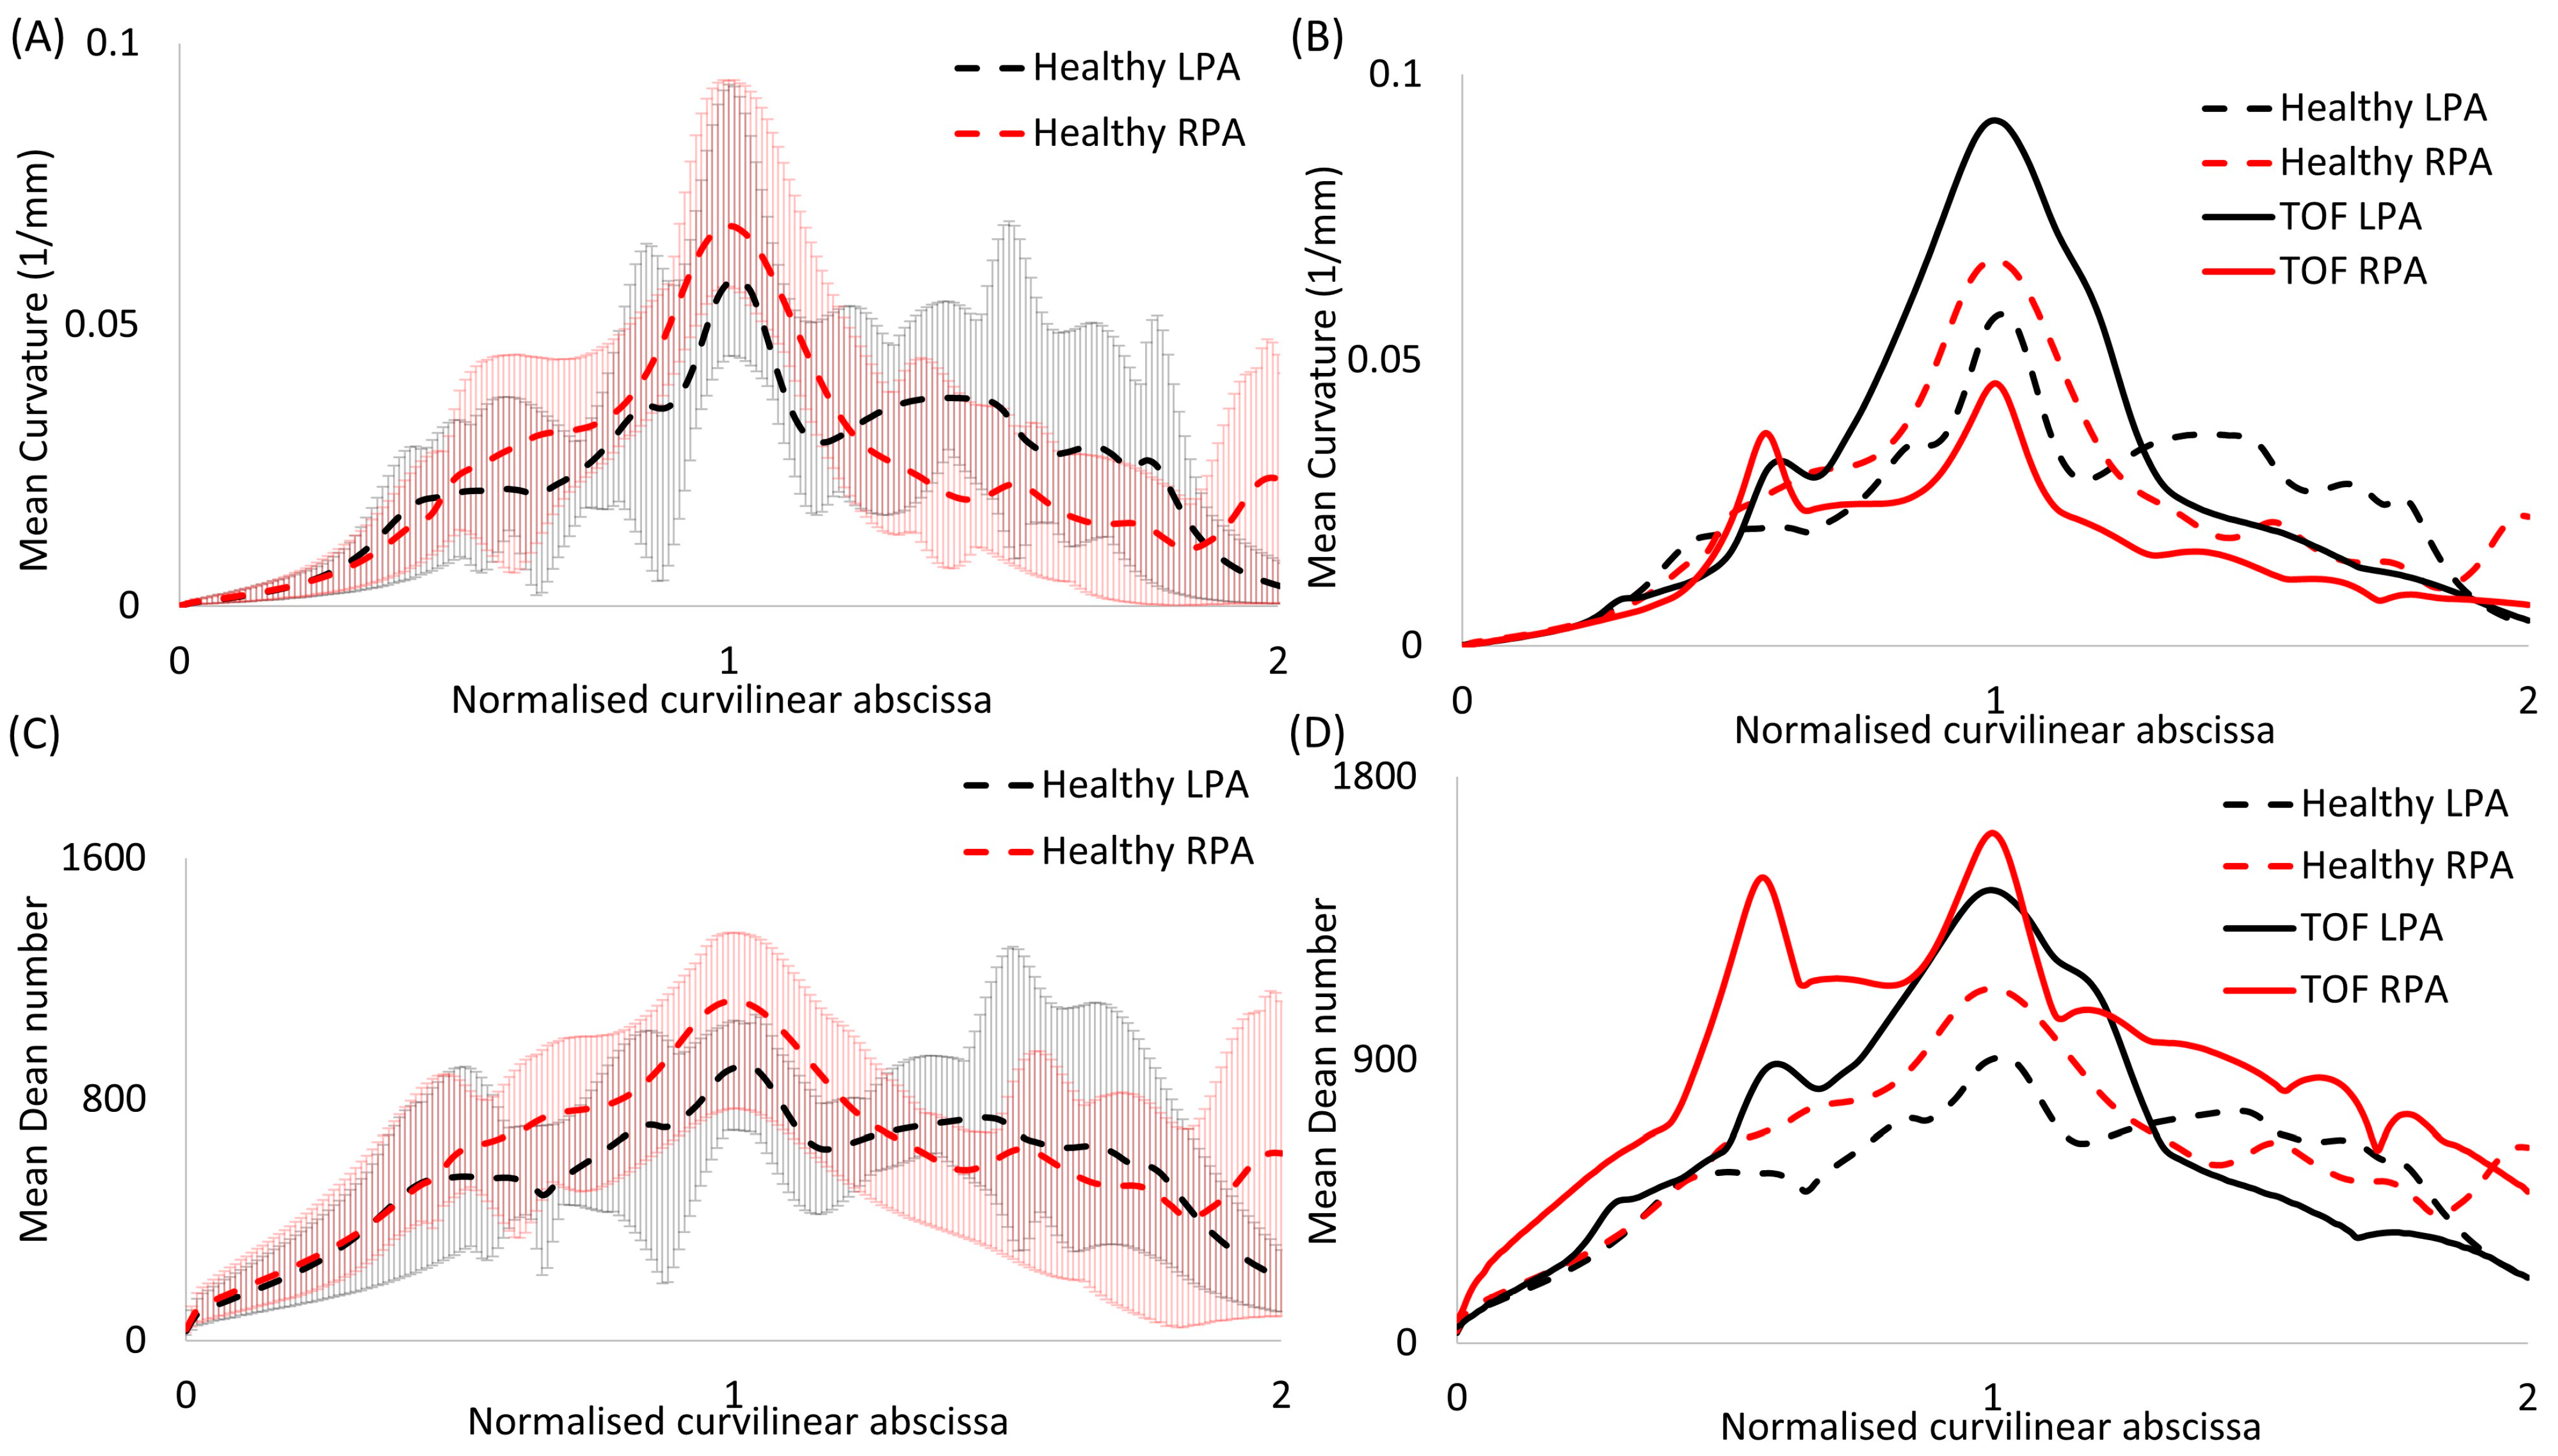
Curvature and torsion were estimated along the centreline of each model. A calculated average plot of curvature is presented for the healthy LPA and RPA branches in Figure 4A. The curvilinear abscissa was normalized by the distance corresponding to the peak curvature closer to the bifurcating LPA and RPA branches. Error bars were used to denote the deviation of the subject-specific values from the calculated average.
The differences in the anatomical characteristics between healthy and patient populations are important to identify, especially in cases of clinical intervention or the evaluation of disease progression. Therefore, the mean curvature, as calculated for the healthy models, was compared with the corresponding calculated mean values of the rTOF patient models [19] (Figure 4B).
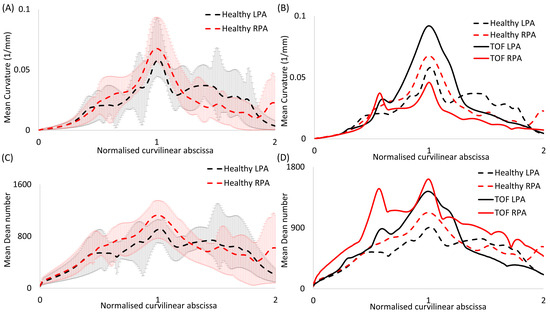
Figure 4.
Plots of (A,B) mean curvature and (C,D) mean Dean number for (A,C) the healthy models alone and (B,D) in comparison with rTOF patient results [19]. Error bars are shown in (A,C) to indicate the variability between subject-specific values and the calculated mean values. The value corresponding to the peak curvature (closer to the bifurcation) was used to normalize the curvilinear abscissa.
2.5. Computational Methods
The computational mesh was generated using the commercial software ANSA (BETA CAE Systems, v. 20.0), and the volume mesh consisted primarily of tetrahedral elements (Figure 2B). A boundary layer mesh composed of 7 layers of prismatic cells was added, with the first layer at a distance of 0.005 cm away from the wall, while the total number of elements was around 2.5 million, based on a mesh independence test. The y+ value was calculated based on the maximum WSS values [30] and was found to be smaller than 1.
For the flow simulations, the k-ω shear stress transport (SST) turbulence model was assumed, which utilizes the turbulent kinetic energy, k, and the dissipation rate, ω, differential transport equations [31]. Patient-specific pulsatile inlet waveforms with a plug velocity profile were specified at the inlet of the models and the patient-specific flow splits (shown in Table 1) were assigned at the outlets of the models. In the averaged model, the mean pulsatile, the inlet waveform with a plug velocity profile and the mean flow splits (Table 1) were considered at the model’s inlet and outlets, respectively. The walls were assumed to be rigid, and the no-slip boundary condition was assigned. All numerical simulations were performed with blood, considered as a Newtonian, incompressible fluid, governed by the Reynolds-averaged Navier–Stokes equation [32]:
where is the mean velocity field and p is the pressure. The blood density (ρ) was assumed to be 1060 kg/m3 and the viscosity (μ) was approximated as 4 × 10⁻³ Pa s, respectively. The pressure-implicit with splitting operators (PISO) solver of the OpenFOAM® library was utilized, recommended for transient incompressible turbulent flows. The second-order divergence scheme and differential scheme were specified, similar to Boumpouli et al. (2021) [19]. A rigorous investigation of the effects of the boundary conditions and computational methods has previously been conducted [30,33,34]. A pulsatile laminar model and a k-omega SST model using the same mesh in various geometries (pulmonary arteries, aorta) [30,33,34,35] were compared and the wall shear stress results were both qualitatively and quantitatively very similar for all cases. In addition, the effects of Newtonian and non-Newtonian models and the assumption of rigid walls were investigated, resulting in only marginal differences in the wall shear stress and velocity developed at the pulmonary bifurcation of idealized models [30,33].
The time-averaged wall shear stress was calculated according to the equation , where is the magnitude of the instantaneous WSS vector and T is the period of the cardiac cycle. The TAWSS distribution was normalized by the value at the inlet of each model (denoted as TAWSSn), with the values being 1.1 Pa, 0.7 Pa, 0.8 Pa, 0.6 Pa, 0.5 Pa and 1.0 Pa, for the healthy subjects 1 to 5, and the averaged geometry, respectively.
In addition, the Reynolds (), Womersley () and Deanmax () numbers were calculated for all models; D is the diameter of the MPA inlet, ω is the angular frequency (equal to 2π/T), ν is the kinematic viscosity (equal to μ/ρ) and R is the radius of curvature (1/curvature). The calculated average plots of the Dean number, as estimated along the centerline of each model, are presented in Figure 4C for the LPA and RPA branches. The average healthy plots are further compared with the corresponding calculated average of the rTOF models (Figure 4D) [19].
A more extensive analysis of the individual values of the flow information, the morphological analysis, and the dimensionless numbers for the 5 healthy models and the anatomical averaged geometry, can be found in the Supplementary Materials. In addition, the min/mean/max torsion, the change in the maximum inscribed sphere radius along the RPA and LPA branches, the streamlines of velocity and the secondary flows at the cross-sections (α) and (γ) are also provided in the Supplementary Material.
3. Results
The results from the morphological characterization of the models (Section 3.1), the dimensionless numbers (Section 3.2), and the computational hemodynamic analysis (Section 3.3) are presented in the following paragraphs.
3.1. Morphological Analysis
The mean and standard deviation of the morphological analysis conducted for the 5 healthy subjects are displayed in Table 3, together with the respective values for the five adult rTOF patients. All the individual values for the 5 healthy subjects and the averaged model can be found in the Supplementary Materials (Tables S2 and S3). Average curvature plots are presented in Figure 4A.

Table 3.
Mean and standard deviation of morphological analysis characteristics (curvature, tortuosity, minimum inscribed sphere radius along the daughter branches, and in-plane and out-of-plane angles) for the healthy (n = 5) and adult rTOF patients (n = 5).
Similar values of the mean and maximum curvature and mean in-plane angle (Table 3) were noticed between the right and left healthy pulmonary branches, with a slightly higher mean value of curvature observed in the RPA branch (Table 3, Figure 4A). The curvature of the RPA, based on the mean curvature plot, appeared to decrease more rapidly further downstream, compared to the LPA curvature (Figure 4A). Tortuosity was found to be higher in the LPA, with a mean value of 0.115, compared to the 0.083 calculated for the RPA branch. Finally, the out-of plane angles indicated a clockwise shift of the RPA and an anti-clockwise shift of the LPA branch, with the LPA displaying higher planarity (Table 3). These results are markedly different from those reported for the rTOF population, where the maximum curvature and tortuosity of the LPA branch are comparatively lower in the healthy population, the radius of the RPA is smaller compared to the LPA, the in-plane angle of the LPA branch is more acute, and there is a change and higher rotation in the out-of-plane angles of both the RPA and LPA branches (Table 3).
A comparison between the mean curvature in the LPA and RPA branches for the healthy and rTOF cohorts is presented in Figure 4B, where a considerable increase is evident in the mean curvature of the LPA branch in the diseased population, with a relative decrease in the curvature of the RPA branch. A detailed morphological analysis for the individual rTOF geometries of Figure 4B can be found in [19].
The total geometric volumes of the healthy and rTOF geometries, as presented in Figure 3, were also calculated and are provided in Table 4. Overall, the pulmonary arteries of the healthy population had a much higher volume compared to the rTOF patients (mean healthy volume of 7352.7 mm3 vs. mean rTOF volume of 5436.5 mm3). The differences in the volume when comparing the individual geometries were also adequately captured by the averaged geometries (6577.6 mm3 for the healthy averaged geometries vs. 4491.2 mm3 for the rTOF averaged geometries).

Table 4.
Geometric volume (mm3) of the healthy and rTOF models, as presented in Figure 3.
Figure S1 of the Supplementary Material shows the decrease in the maximum inscribed sphere radius along the centerlines of the LPA (Figure S1A) and RPA branches (Figure S1B) of the healthy geometries.
3.2. Dimensionless Numbers
The mean Re numbers for the MPA, RPA and LPA and the Wo and De numbers of the healthy subjects were calculated and are reported in Table 5, together with the respective mean values for the adult rTOF patients. These parameters are associated with alterations in the wall shear stress [36,37] and secondary flow patterns [38,39,40,41]. A mean Remean of 1006 was calculated for the MPA, which dropped to 737 and 705 for the RPA and LPA, respectively. Contrary to this trend, the highest mean Re number was reported at the RPA branch of the rTOF population (1180), followed by the Remean of the MPA (852). Wo had a mean value of 20.8, which was similar to that calculated for the rTOF patients (Wo = 21.2). Finally, similar maximum Dean numbers were calculated locally for the RPA and the LPA branches of the healthy subjects (1231 for the RPA and 1240 for the LPA), while higher mean De numbers were reported for the rTOF population (1945 for the RPA and 1594 for the LPA). Dean number plots for the LPA and RPA branches were compared for the healthy and rTOF geometries (Figure 4D). The peak Dean number was elevated in both the RPA and LPA branches of the rTOF patients, while Demax appeared to be slightly higher in the RPA branch in both cases. The Dean number is proportional to the square root of the curvature, which is also presented in Figure 4. Both the RPA and LPA are slightly curved vessels and although the characteristic Dean vortices in the peak flow were not visible in the healthy geometries, transient vortical structures existed at the mid-deceleration in the systole and mid-diastole (Figure S2 of the Supplementary Materials). Figure S3 of the Supplementary Materials also displays the secondary flows in the cross-sections (α) and (γ) in the healthy pulmonary arterial models 1, 2 and 4, indicating that there is not much disturbance to flow during peak flow. A small vortex was visible in the RPA branch of the healthy 1 model, while a stable focus was visible in the healthy 4 model (Figure S3).

Table 5.
Mean and standard deviation of the mean and maximum Reynolds (Re), maximum Dean (De) and Womersley (Wo) numbers for the healthy (n = 5) and adult rTOF patients (n = 5).
3.3. Time-Averaged Wall Shear Stress
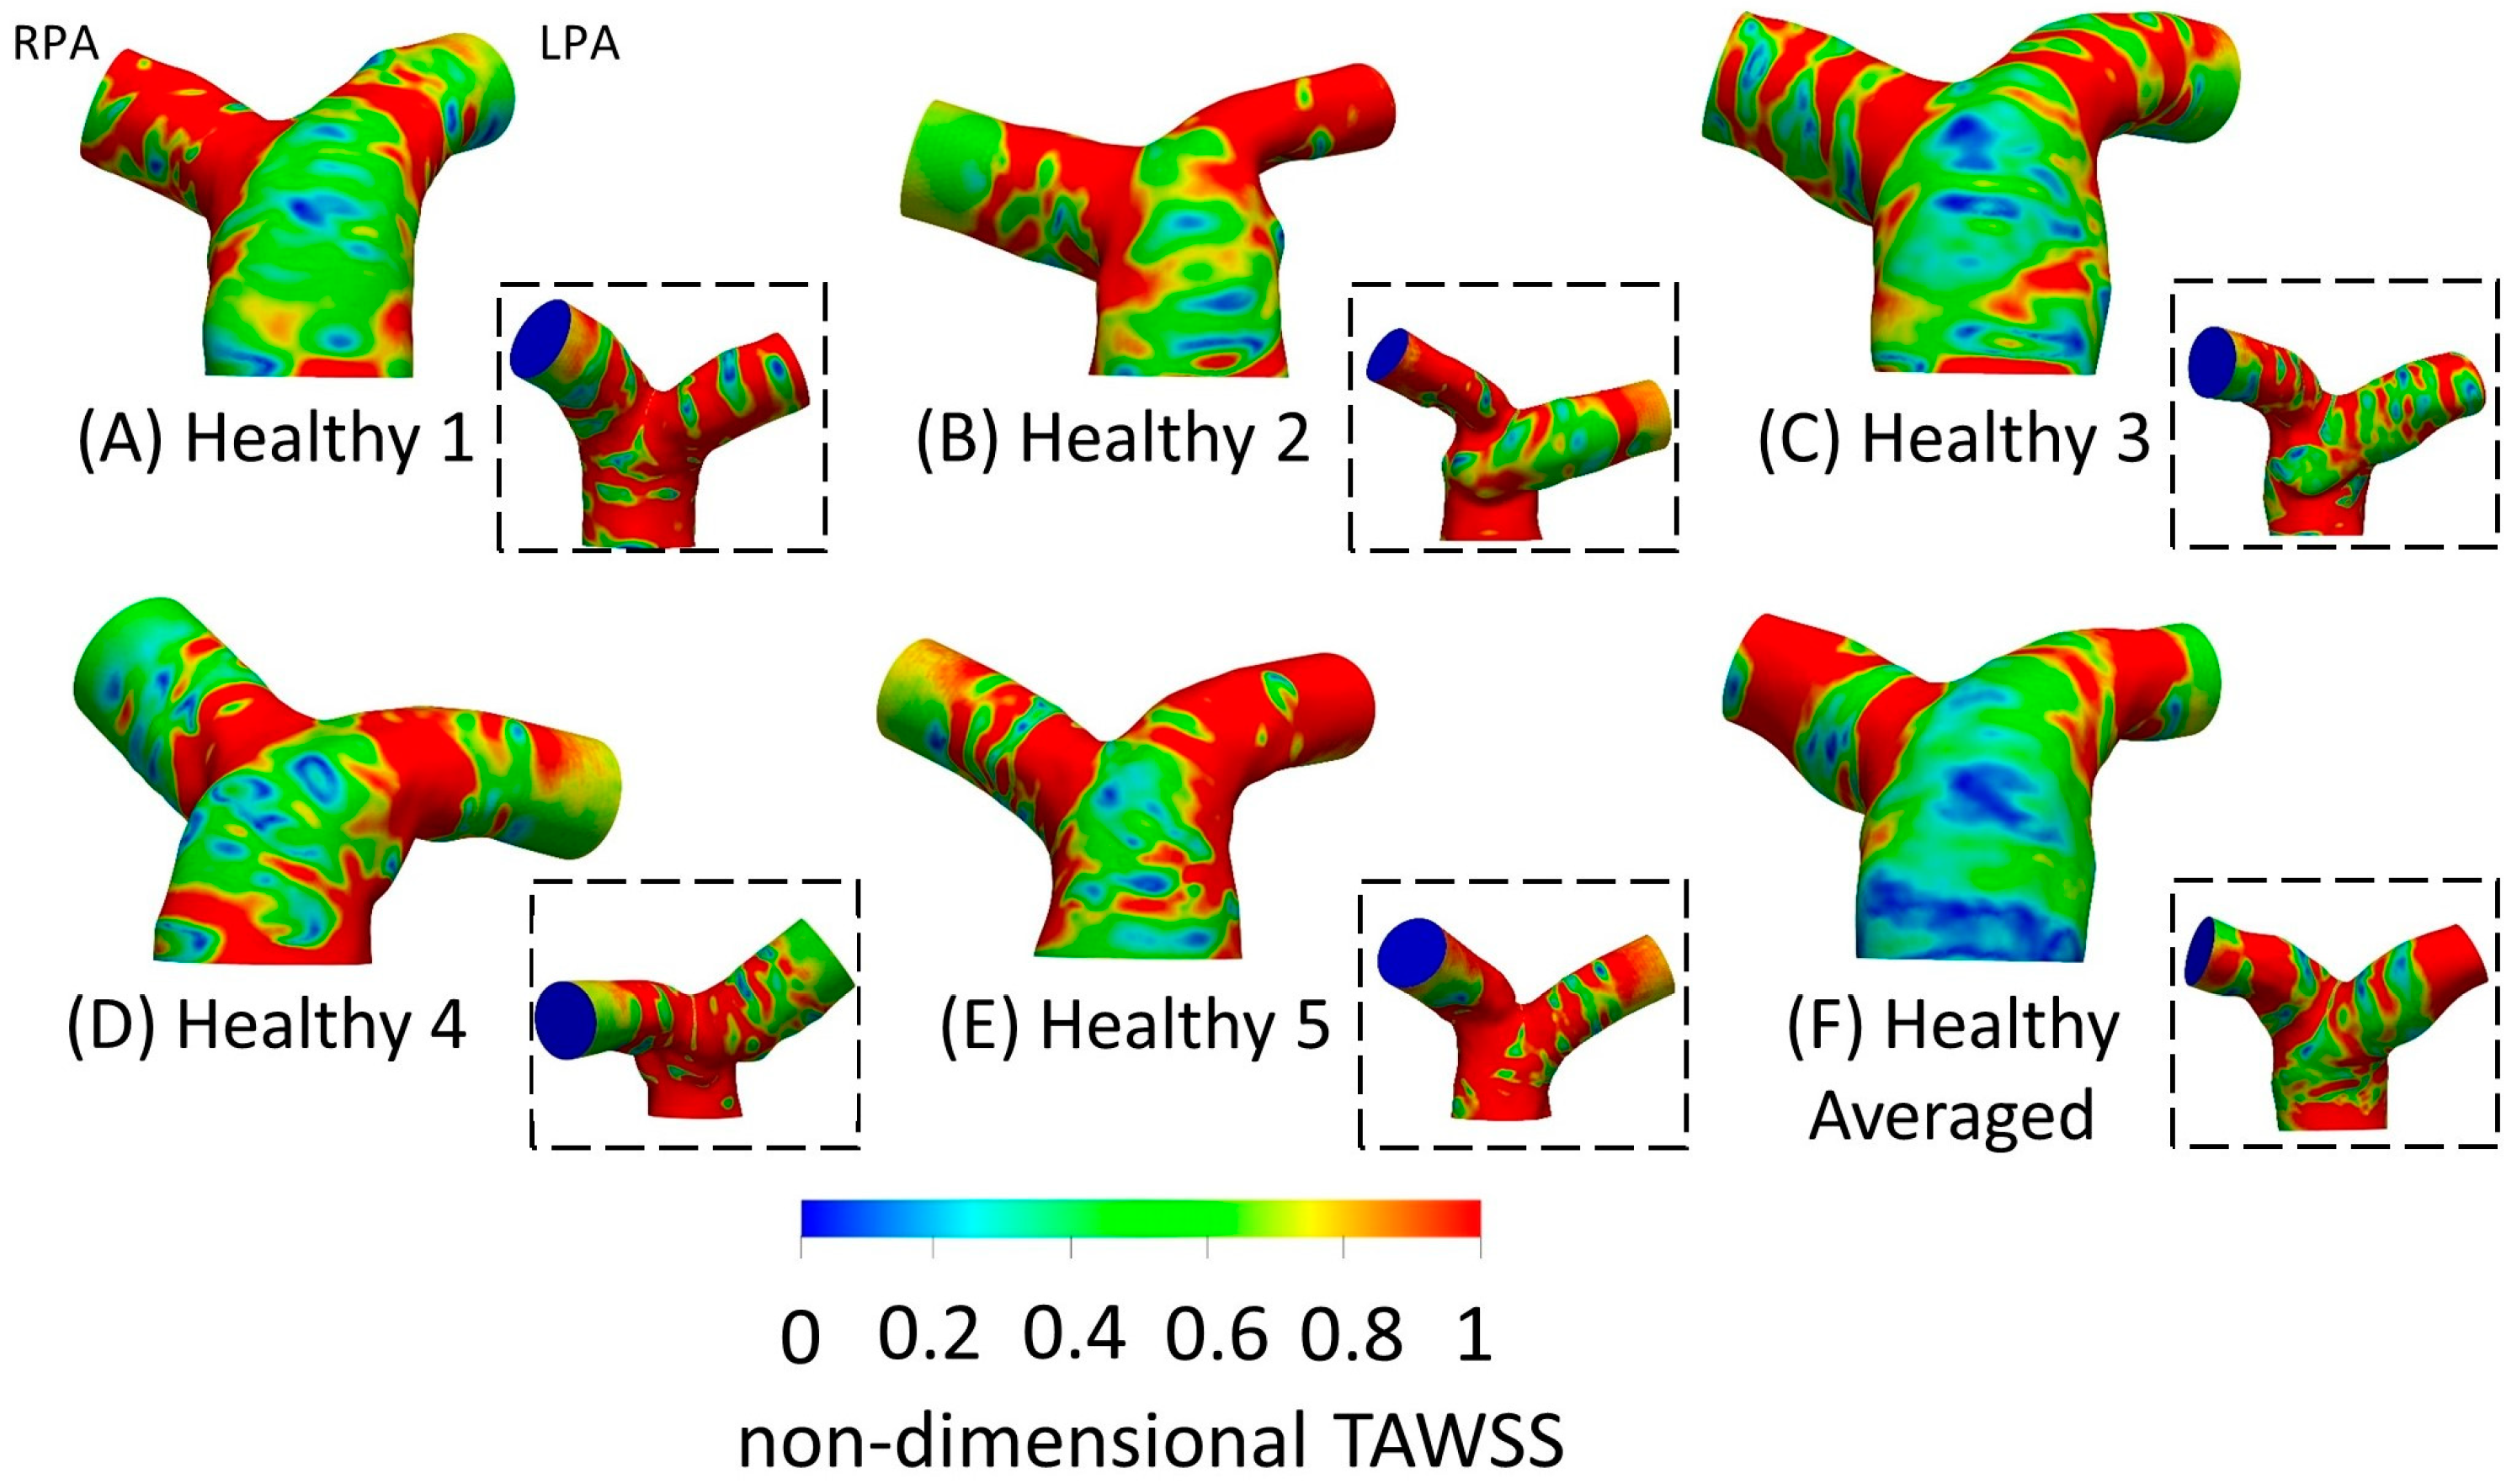
TAWSSn distribution, normalized by the TAWSS value at the inlet of each respective geometry, is presented in Figure 5. Higher wall shear stresses were observed at the entrance of the LPA and RPA branches, while the wall shear stress distribution along the MPA and the pulmonary junction of the healthy subjects appeared relatively uniform. The highest TAWSSn values were observed at the RPA of geometries 1 and 4 (Figure 5A,D), and the LPA of geometry 2 (Figure 5B). The lowest TAWSSn values were found at the MPA of the averaged geometry (Figure 5F). Our results indicate that the wall shear stress was highest at the locations of highest curvature (Figure 4A) in the LPA and RPA branches, which also correlate with the max Dean numbers (Figure 4C).
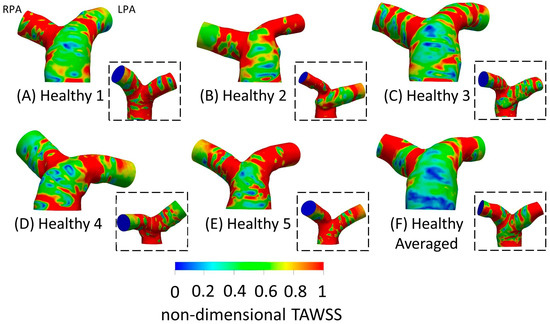
Figure 5.
Non-dimensional time-averaged wall shear stress (TAWSSn) distribution, normalized with the wall shear stress developed at the inlet wall of each model, respectively, for the healthy (A) 1; (B) 2; (C) 3; (D) 4; (E) 5; and (F) anatomical averaged geometries. Insets show the back view of the geometries. The RPA and the LPA branches are denoted in (A).
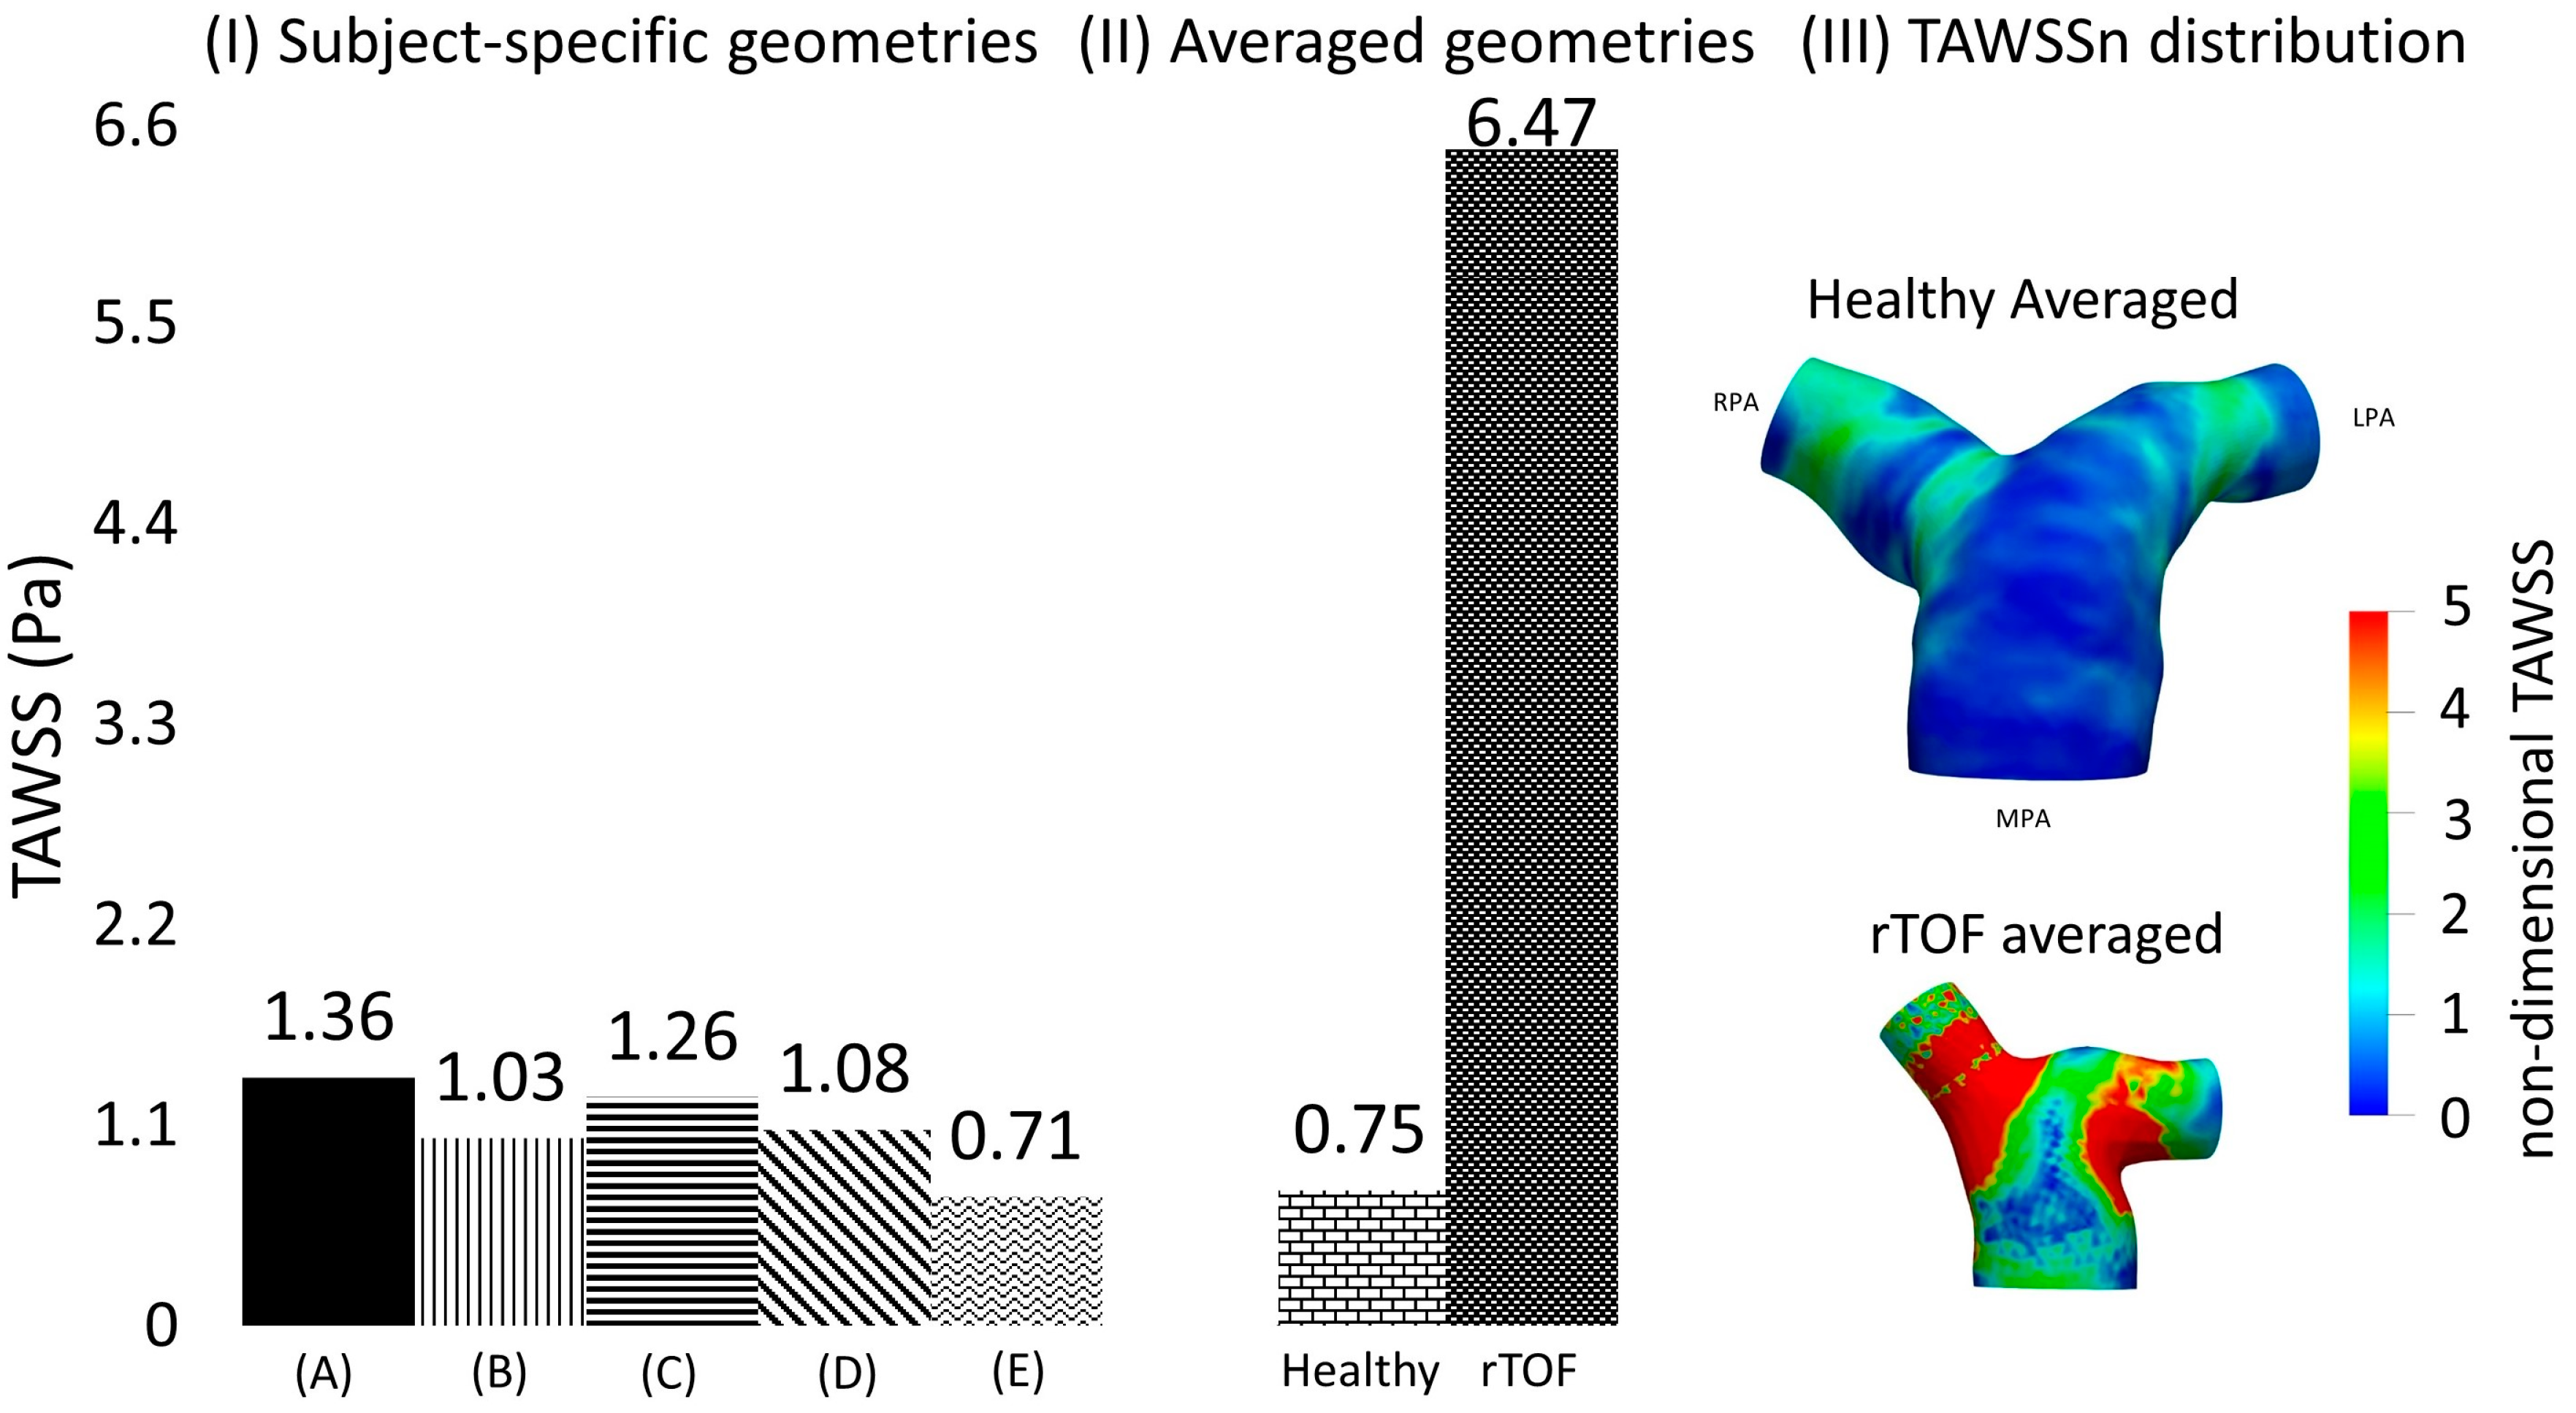
To quantify the differences in the TAWSS values among the different geometries, two cross-sections (α) and (γ) were assumed (see Figure 2C), located at a distance of 0.4D from the point of branch splitting, and matching the slices displayed in Figure 1 in Boumpouli et al. (2021) [19]. Eight points, equally distanced, were selected from the wall of each cross-section, and a mean TAWSS was calculated for all subject-specific and anatomical averaged geometries. A mean TAWSS was then calculated for geometries 1–5 and the results of each cross-section are presented in Table 6 in Pascal. The mean TAWSS value was compared with the TAWSS value calculated for the healthy anatomical averaged geometry. The TAWSS values of the healthy averaged geometry were slightly lower compared to the mean values calculated from the individual healthy geometries 1–5 (0.743 Pa vs. 0.822 Pa for the cross-section (α) in the RPA, and 0.748 Pa vs. 1.35 Pa for the cross-section (γ) in LPA), while there was no great variation in the TAWSS values of the different geometries. The mean TAWSS as calculated in the cross-section (α) of RPA was lower compared to the mean value calculated in the cross-section (γ) of LPA (Table 6). The mean TAWSS values calculated based on the (α) and (γ) cross-sections of each subject were plotted and are presented in Figure 6I. The range of the TAWSS values was between 0.71 and 1.36 Pa, with the lowest value calculated for geometry 5 (Figure 6IE) and the highest value for geometry 1 (Figure 6IA). The TAWSS value of the healthy anatomical averaged model (Figure 6II left) was at a lower level (~0.75 Pa), but within the range calculated for the subject-specific geometries (Figure 6I).

Table 6.
Mean TAWSS in Pascal. The values were derived based on the TAWSS values of selected points along the cross-sections (α) and (γ), as shown in Figure 2C. For comparison, the mean TAWSS values of rTOF patients [19] are also provided.
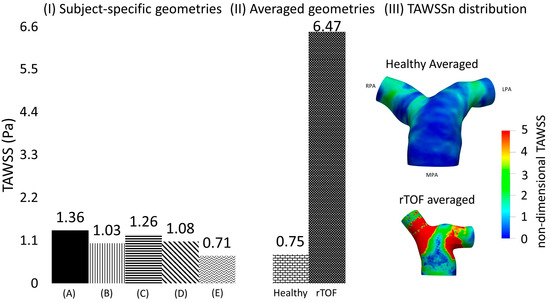
Figure 6.
(I) Time-averaged wall shear stress (TAWSS) plot, calculated based on the mean TAWSS values of selected points located along the cross-sections (α) and (γ), shown in Figure 2C, and presented here in Pascal, for the healthy (A) 1; (B) 2; (C) 3; (D) 4; and (E) 5; and (II) for the anatomical averaged geometries derived from the healthy (n = 5) and rTOF geometries (n = 5), the latter presented in detail in [19]). (III) TAWSSn distribution for the averaged healthy and rTOF [19] geometries, normalized with the wall shear stress developed at the inlet wall of each model.
3.4. Averaged Healthy vs. Averaged rTOF Geometries
The TAWSS of the averaged healthy geometry was also compared with shear stress values developed based on the averaged rTOF model. Although the pattern of TAWSSn distribution (Figure 6III) between the two models was relatively similar, with higher values of TAWSSn at the LPA and RPA branches than at the MPA, the magnitude of TAWSSn was evidently much higher in the rTOF averaged model. Figure 6II quantifies the difference in the cross-sections (α) and (γ), where a value of approximately 6.47 Pa was calculated for the rTOF averaged geometry, compared to only 0.75 Pa for the healthy averaged model (more than 8-fold difference). Table 6 also displays the mean TAWSS values (in Pascal) of the individual subject-specific models at each cross-section. TAWSS was elevated in the rTOF patient population, with the TAWSS at the RPA cross-section being slightly higher than that at the LPA. Conversely, TAWSS appears to be higher at the LPA cross-section for the healthy population.
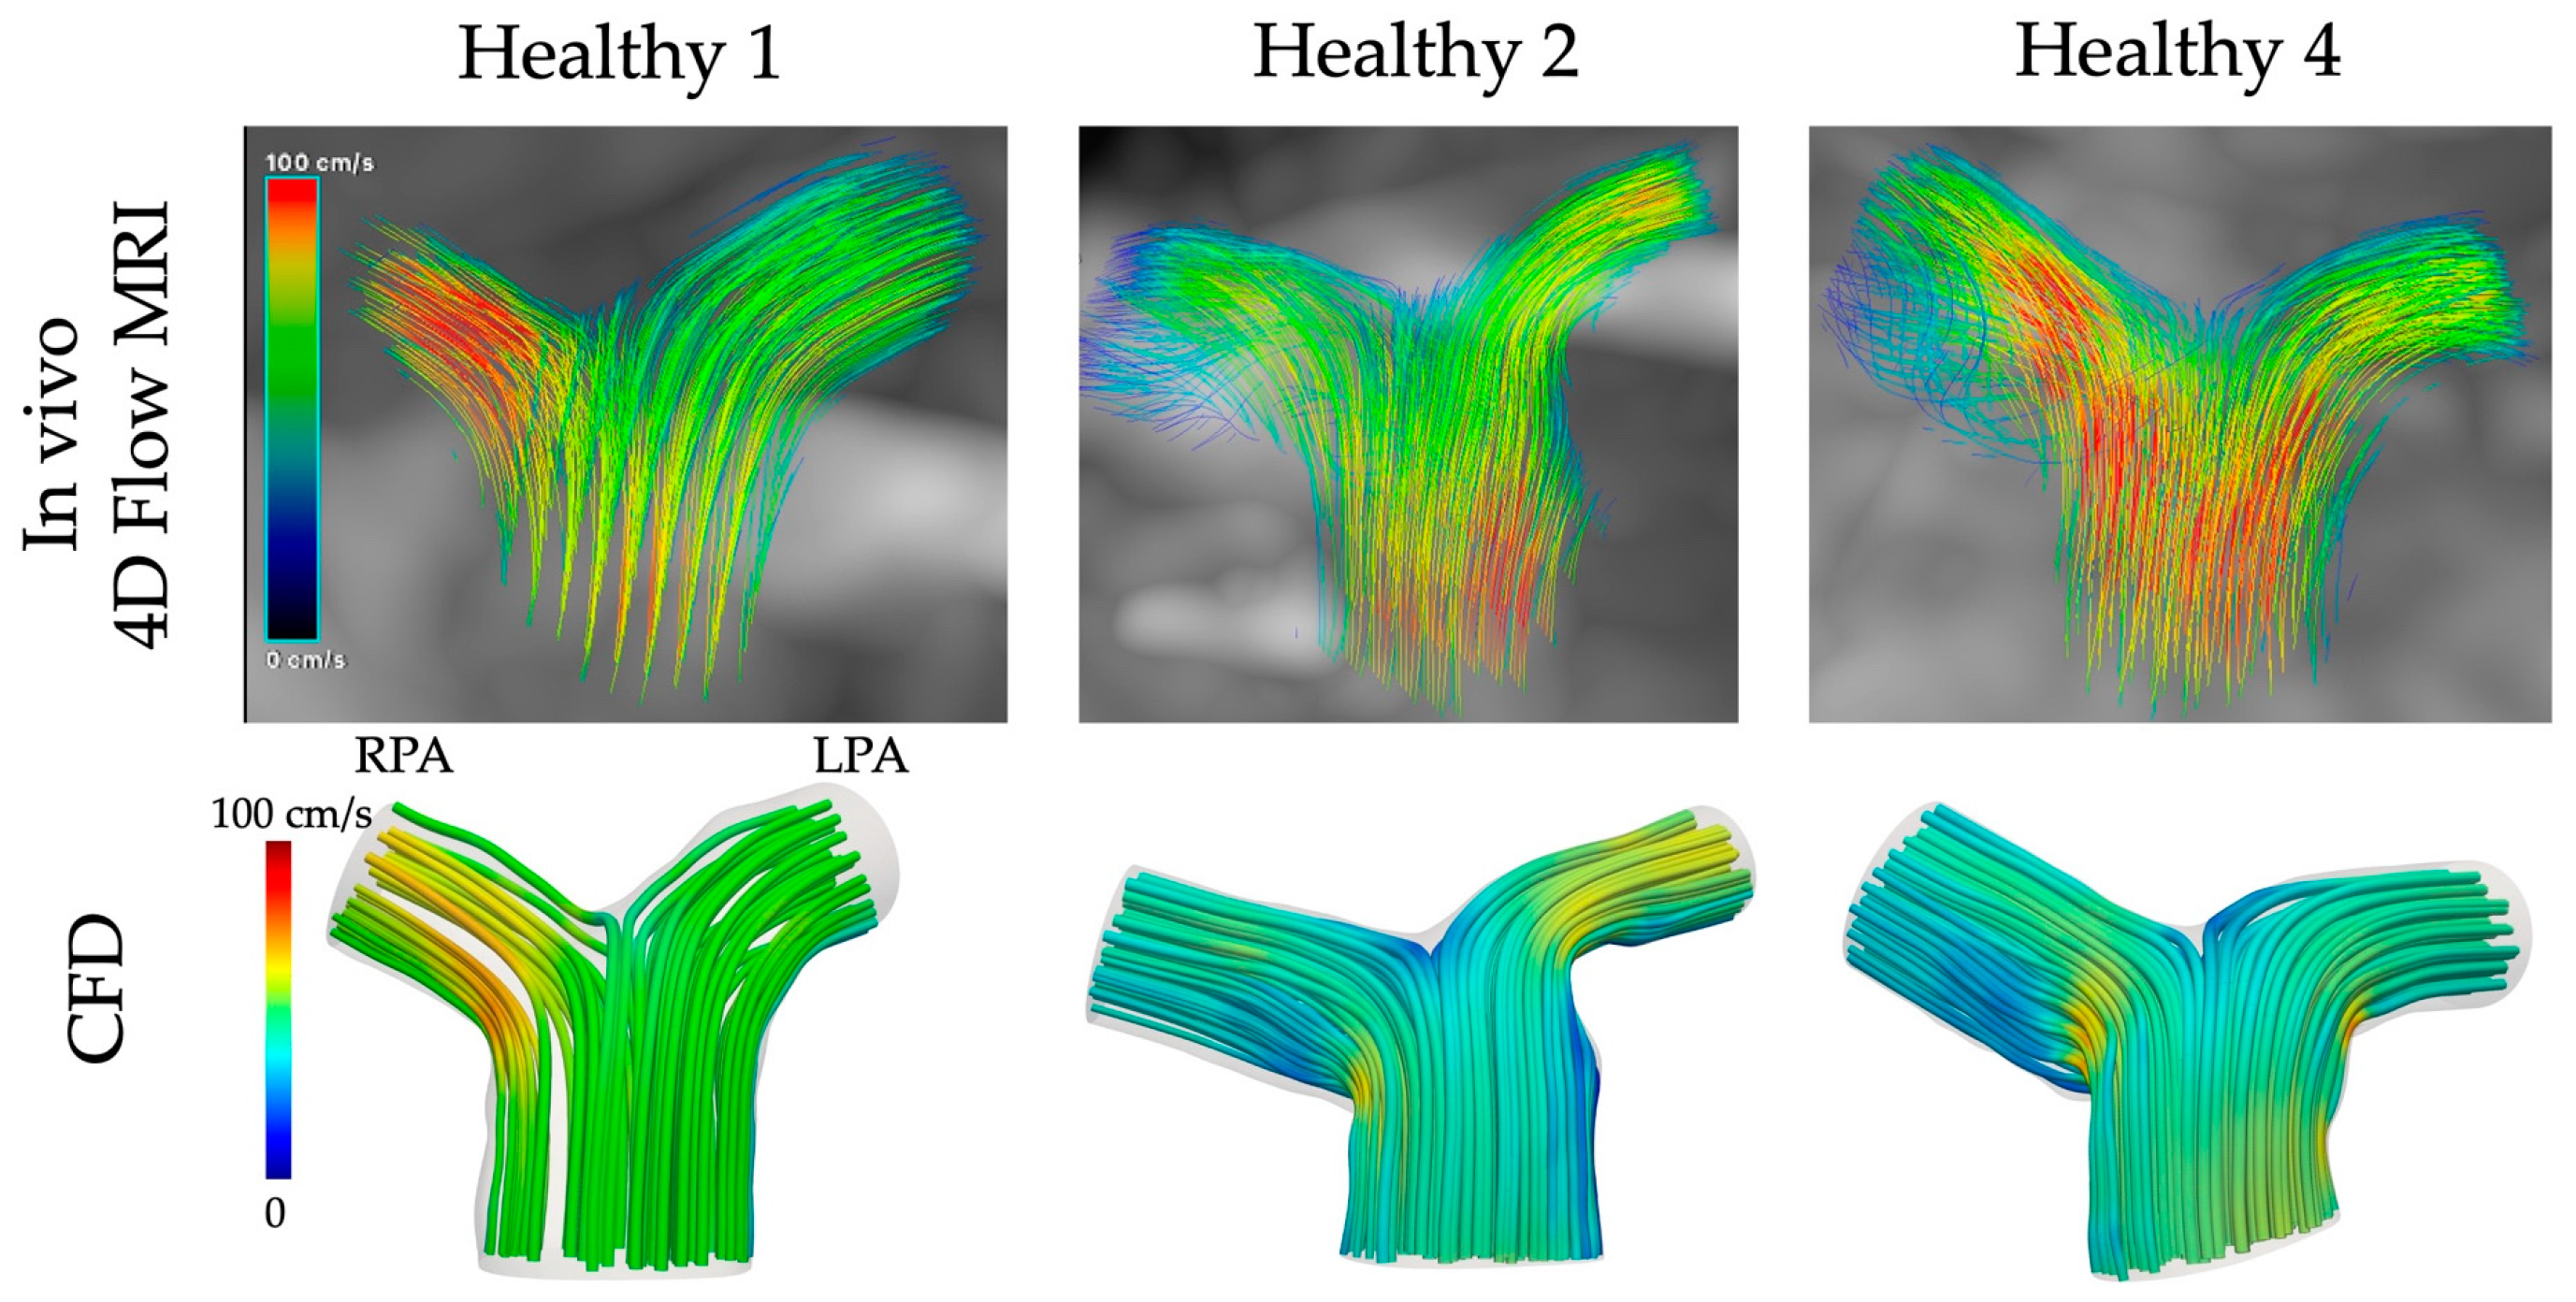
3.5. CFD vs. In Vivo 4D Flow MRI
Streamlines of velocity exported from the computational simulations for the healthy models 1, 2 and 4 were compared with those obtained directly in vivo from the 4D flow MRI data (Figure 7, cvi42® v. 6.0.2). The CFD results were qualitatively similar to the in vivo data, with higher velocities developed in the RPA branch of models 1 and 4 and the LPA branch of model 2. Nevertheless, some quantitative differences existed, with the CFD underestimating the blood flow velocity, especially at the MPA of models 2 and 4.
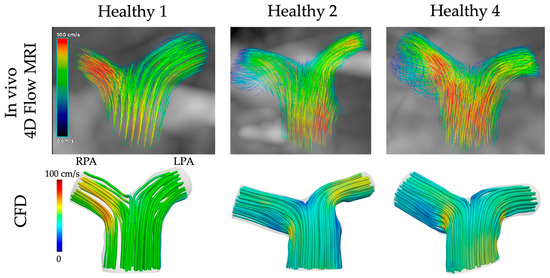
Figure 7.
Comparison of CFD with in vivo 4D flow MRI data for the healthy models 1, 2, and 4.
4. Discussion
Characterization of the hemodynamic environment of healthy arteries is important for a better understanding of the underlying mechanisms of pathological alterations, disease diagnosis and progression, as well as treatment [42,43,44,45,46,47,48,49]. The morphology of the pulmonary arteries is considered a crucial factor in flow development, mostly correlated with the reversal of flow [50,51,52], while the flow conditions affect the wall shear stress, a biomechanical factor related to the endothelial cell function and disease progression [53,54,55]. Nevertheless, the number of studies investigating the blood flow in healthy pulmonary arterial models is still limited, even though it has grown in the past few years for both healthy and patient populations [8,9,13,19,56,57,58,59]. This study contributes to our current knowledge by evaluating in detail the morphological and flow characteristics of a new cohort of subject-specific geometries of the healthy adult pulmonary bifurcation and presenting their anatomical averaged model. It further offers new information by comparing and quantifying computationally, for the first time according to our knowledge, differences between healthy adults and age-matched rTOF patients [19]. The rTOF patient population [19] showed a significantly higher mean curvature and a characteristically more acute in-plane angle in the LPA branch than that of their healthy counterparts (Figure 3 and Figure 4B), while the mean curvature of the RPA branch was relatively smaller in the diseased population. In general, the total geometric volumes of rTOF anatomies were smaller than healthy geometries (Table 4). The TAWSS was also more than 8-fold higher in the averaged rTOF geometry than in the averaged healthy geometry (Figure 6II,III, Table 6), and the individual patient-specific rTOF patient models had much higher TAWSS values than the healthy volunteers.
The morphological analysis in this study suggests that the curvature and the in-plane angles are very similar between the RPA and the LPA branches of healthy adults. The minimum sphere radius was smaller for the LPA, indicating a smaller diameter of the LPA branch. Finally, a clockwise rotation was observed for the RPA branch caused by the average of the out-of-plane angles, and an anti-clockwise rotation was observed for the LPA branch. A steeper curvature and a smaller section area in the RPA branch are also reported in the study of Capuano and his co-workers [8] in healthy pulmonary arteries of children (age range 4–18 years old).
The Reynolds, Womersley and Deanmax numbers were also calculated, and a small range of values were observed in the healthy population. These parameters are associated with alterations in the wall shear stress [36,37] and secondary flow patterns [38,39,40,41]. The highest mean Re was found in the healthy MPA, while the RPA and LPA displayed similar Re values. Wo was approximately 20, while De was similar between the RPA (DeRPA = 1231) and LPA (DeLPA = 1240) in the healthy population, which is smaller than the De number reported for rTOF, especially for the RPA branch (DeRPA = 1945, DeLPA = 1594) [19]. These dimensionless numbers, as estimated in this study, are in line with those presented in previous studies for the pulmonary arteries of healthy subjects [8,60,61].
A higher TAWSSn was observed at the entrance of the RPA and LPA branches (Figure 5), which coincides with the location of highest curvature and consequently Deanmax numbers (Figure 4A,C). The TAWSS values (calculated from the cross-sections (α) and (γ)) reported in this study for the healthy models were up to 1.36 Pa (Figure 6IA), which is comparable to those of healthy control volunteers presented in previous studies (up to 2.05 Pa), and of patients with pulmonary arterial hypertension (up to 1.01 Pa) [11,53]. The importance of initial BCs [62] is highlighted when the TAWSS values in the cross-sections (α) and (γ) are compared. A slightly higher mean TAWSS value (Table 6) was found in the LPA, which is the branch with a higher mean tortuosity and mean De number. The TAWSS value, calculated from both cross-sections (α) and (γ), of the averaged healthy geometry (~0.75 Pa) was further compared with the TAWSS value of the averaged rTOF geometry in Figure 6II [19]; the latter was found to be highly elevated (~6.47 Pa), i.e., ~8.6 times higher than that of the averaged healthy geometry. Since the simulations for the averaged geometries were conducted under the same respective conditions, and the averaged boundary conditions were calculated using the same process, this result indicates that the rTOF population is characterized by significantly higher TAWSS values, also evident from the TAWSSn distribution of the averaged models (Figure 6III).
Considering all data from the small cohort study of healthy and rTOF patients, the rTOF population clearly had an increased RPA flow split; in six out of seven rTOF cases, the flow was diverted to the RPA, of which four had over 60% of the flow. The mean initial flow rates, as presented here, in Table 2, did not vary significantly between healthy and diseased individuals [19], but the reversal of flow was higher in the rTOF patients [19]. The maximum velocities developed in the daughter branches of the rTOF population (Table 2) were also evidently higher than the healthy pulmonary arteries. In addition, the calculated maximum Re and De numbers were found to be elevated in the rTOF patients [19], as compared to the healthy population (Table 5). The results of this study, therefore, suggest that (i) the flow splits and flow reversal based on the initial flow conditions and (ii) the curvature of the LPA, the diameter, and the planarity of both daughter branches from the morphological characteristics are some key parameters that affect the health of the pulmonary environment.
Finally, some discrepancies were found between the blood velocity calculated with CFD modelling and those exported from the 4D flow MRI data. Such differences are unavoidable, and some of the reasons for them include the spatiotemporal resolution, which is higher with CFD, and the data interpolation used to calculate the blood velocity in vivo due to the coarser spatial resolution of the 4D scanner [20,63,64,65]. In addition, WSS values extracted as part of post-processing 4D flow MRI data are considered qualitatively inaccurate due to a tendency to underestimate WSS [66,67]; therefore, the authors did not attempt a comparison with the TAWSS values presented in this study.
Limitations
This study was limited to a small sample size of volunteers; nevertheless, all of them were healthy adults with no known underlying pathological conditions and four out of five were males. Previous studies in both healthy and diseased arterial models have gained insights from small cohorts [8,68], and thus, we are confident that this cohort is a good representation of the healthy adult population. The assumption of rigid walls is another limitation of this study, although previous studies that have investigated the effect of arterial wall compliance found no significant differences in the flow patterns [8,30,33,69,70]. Peripheral pulmonary vascular resistance [71] was also neglected but was compensated with the assignment of subject-specific flow splits at the models’ outlets. Another limitation of this work was the inlet velocity, which only varied with time, while the spatial variability of the flow, induced by the movement of the valve, was not captured [72,73]. Finally, a more detailed investigation is needed to assess the suitability of the k-omega SST turbulence model for studying detailed flow patterns in addition to wall shear stress.
5. Conclusions and Future Work
This study provides new information on the characterization of the morphology and hemodynamic environment of healthy adult pulmonary arteries, which appeared mostly similar among participants. This was in high contrast to geometric and flow features observed in diseased (rTOF) adult pulmonary arteries [19]. Despite the small cohort size, the averaged healthy geometry effectively captured the main flow characteristics of the subject-specific models and helped to highlight the differences between healthy and diseased pulmonary branches. Future work will seek access to a larger sample of healthy volunteers and rTOF patients to further confirm the findings of this study and will consider the pulmonary vascular resistance and compliance of both healthy and diseased populations. The latter could potentially help clarify the remodeling mechanism in the pulmonary arteries due to diseased downstream conditions, assisting clinical decisions for further surgical interventions based on hemodynamic indices.
Supplementary Materials
The following supporting information can be downloaded at: https://www.mdpi.com/article/10.3390/fluids9040085/s1, Table S1: Analysis of the MPA, RPA and LPA branches of each model. The diameters, mean flow rate, and mean and maximum velocities are provided for the 5 healthy subjects and the anatomical averaged geometry. Table S2: Morphological analysis of the curvature and torsion for the 5 healthy subjects and the anatomical averaged geometry. The mean value and standard deviation (SD) are based on the analysis of all six geometries (5 patients and anatomical averaged). Table S3: Morphological analysis of the tortuosity, minimum inscribed sphere radius along the daughter branches, and in-plane and out-of-plane angles for the 5 healthy subjects and the anatomical averaged geometry. The mean value and standard deviation (SD) are based on the analysis of all six geometries. Figure S1: Change of the maximum inscribed sphere radius along the (A) LPA and (B) RPA branch. X-axis is normalized based on the maximum inscribed sphere radius at the level of the MPA inlet. Y-axis is normalized with the value corresponding to the peak curvature (closer to the bifurcation) of each geometry, similar to Figure 4 of the paper. Table S4: Flow analysis of the subject-specific models. The Reynolds (Re), Dean (De) and Womersley (Wo) numbers are provided for the 5 healthy subjects and the anatomical averaged geometry. The mean value and standard deviation (SD) are based on the analysis of all six geometries. Figure S2: Subject-specific flow waveforms for the healthy (A) 1; (B) 2; (C) 3; (D) 4; (E) 5 geometries, and (F) the healthy anatomical averaged geometry, at (I) peak flow, (II) mid-deceleration at systole, and (III) mid-diastole, respectively. Streamlines of velocity are also presented, colored by non-dimensionalized velocity. Non-dimensionalization is based on division with the maximum velocity corresponding to each healthy subject. The RPA and the LPA branches are indicated in (A.I). Figure S3: Secondary flows visualised by in-plane velocity vectors, at slices (α) and (γ), during peak flow, for the (A) healthy 1; (B) healthy 2; and (C) healthy 4 models.
Author Contributions
All roles according to CRediT (contributor roles taxonomy). A.K. and M.B.: software, conceptualization, investigation, methodology, formal analysis, visualization, data curation, writing—review and editing. M.B.: writing—original draft. S.M.B.: methodology, writing. A.K.: resources, supervision, funding acquisition, project administration. All authors contributed to the article and approved the submitted version. All authors have read and agreed to the published version of the manuscript.
Funding
M.B. was supported by the University of Strathclyde Research Studentship Scheme (SRSS) Research Excellence Awards (REA) Project No 1208 and the UK Research and Innovation (UKRI) Engineering and Physical Sciences Research Council (EPSRC) through a pump-priming project of the Inclusion Matters grant EP/S012133/1. SB was supported by the EPSRC Award Ref. EP/L015595/1 through the University of Strathclyde Centre of Doctoral Training. A.K. has received research grants from the EPSRC Transformative Healthcare Technologies Award Ref. EP/W004860/1 and EP/X033686/1, and the European Union’s Horizon 2020 research and innovation programme under the Marie Skłodowska-Curie grant agreement No. 749185.
Institutional Review Board Statement
The analysis of clinical CT and 4D flow MRI data involving human participants was reviewed and approved by the South-East Scotland Research Ethics Committee (IRAS Project ID: 287048, REC Reference: 20/SS/0118). The clinical data are part of a research dataset from the Queen Elizabeth Hospital, Glasgow, UK (approved by the local ethics committee, Glasgow CRIF approval group, and written informed consent was obtained from all participants. Research Ethics Committee West of Scotland REC3, reference 16/WS/0220).
Informed Consent Statement
Informed consent was obtained from all subjects involved in the study.
Data Availability Statement
The averaged healthy and rTOF geometries are openly available from the University of Strathclyde KnowledgeBase (https://pureportal.strath.ac.uk/en/datasets/data-for-computational-analysis-of-blood-flow-in-healthy-pulmonar, accessed on 3 April 2020).
Acknowledgments
We thank P. Hall Barrientos for her assistance. The authors greatly acknowledge the support from the Queen Elizabeth Hospital (Glasgow, UK), the University of Strathclyde and the STEM equals project. The results were obtained using the ARCHIE-WeSt High Performance Computer (www.archie-west.ac.uk, accessed on 4 April 2020) based at the University of Strathclyde.
Conflicts of Interest
The authors declare that the research was conducted in the absence of any commercial or financial relationships that could be construed as potential conflicts of interest.
Nomenclature
| ASO | Arterial switch operation |
| CFD | Computational fluid dynamics |
| De | Dean number |
| DICOM | Digital Imaging and Communications in Medicine |
| LPA | Left pulmonary artery |
| MPA | Main pulmonary artery |
| MRI | Magnetic resonance imaging |
| PAH | Pulmonary arterial hypertension |
| PS | Peak systole |
| Re | Reynolds number |
| RPA | Right pulmonary artery |
| rTOF | repaired Tetralogy of Fallot |
| SA | Systolic acceleration |
| SD | Systolic deceleration |
| TAG | Transposition of great arteries |
| TAWSS | Time averaged wall shear stress |
| TOF | Tetralogy of Fallot |
| VENC | Velocity encoding |
| Wo | Womersley number |
References
- Tan, W.; Madhavan, K.; Hinter, K.S.; Park, D.; Stenmark, K.R. Vascular stiffening in pulmonary hypertension: Cause or consequence? (2013 Grover Conference series). Pulm. Circc. 2014, 4, 560–580. [Google Scholar] [CrossRef] [PubMed]
- Galié, N.; Torbicki, A.; Barst, R.; Dartevelle, P.; Haworth, S.; Higenbottan, T.; Dartevelle, P.; Haworth, S.; Higenbottam, T.; Olschewski, H.; et al. Guidelines on diagnosis and treatment of pulmonary arterial hypertension: The task force on diagnosis and treatment of pulmonary arterial hypertension of the European Society of Cardiology. Eur. Heart J. 2004, 25, 2243–2278. [Google Scholar] [CrossRef] [PubMed][Green Version]
- Humphrey, J. Mechanisms of arterial remodeling in hypertension: Coupled roles of wall shear and intramural stress. Hypertension 2008, 52, 195–200. [Google Scholar] [CrossRef] [PubMed]
- Hanna, B.D. Blood flow in normal and diseased pulmonary arteries. In Ventricular Function and Blood Flow in Congenital Heart Disease; Wiley-Blackwell: Hoboken, NJ, USA, 2005; pp. 275–285. [Google Scholar] [CrossRef]
- Caro, C.; Pedley, T.; Schroter, R.; Seed, W.; Parker, K. The pulmonary circulation. In The Mechanics of the Circulation; Cambridge University Press: Cambridge, UK, 2011; pp. 467–506. [Google Scholar] [CrossRef]
- Shaher, R.M. Complete and inverted transposition of the great vessels. Br. Heart J. 1964, 26, 51–66. [Google Scholar] [CrossRef] [PubMed]
- Villafañe, J.; Lantin-Hermoso, M.R.; Bhatt, A.B.; Tweddell, J.S.; Geva, T.; Nathan, M.; Elliott, M.J.; Vetter, V.L.; Paridon, S.M.; Kochilas, L.; et al. D-transposition of the great arteries: The current era of the arterial switch operation. J. Am. Coll. Cardiol. 2014, 64, 498–511. [Google Scholar] [CrossRef] [PubMed]
- Capuano, F.; Loke, Y.-H.; Balaras, E. Blood Flow Dynamics at the Pulmonary Bifurcation. Fluids 2019, 4, 190. [Google Scholar] [CrossRef]
- Louvelle, L.; Doyle, M.; Van Arsdell, G.; Amon, C. The Effect of Geometric and Hemodynamic Parameters on Blood Flow Efficiency in Repaired Tetralogy of Fallot Patients. Ann. Biomed. Eng. 2021, 49, 2297–2310. [Google Scholar] [CrossRef] [PubMed]
- Ntsinjana, H.N.; Capelli, C.; Biglino, G.; Cook, A.C.; Tann, O.; Derrick, G.; Taylor, A.M.; Schievano, S. 3D Morphometric Analysis of the Arterial Switch Operation Using In Vivo MRI Data. Clin. Anat. 2014, 27, 1212–1222. [Google Scholar] [CrossRef] [PubMed]
- Tang, B.T.; Fonte, T.A.; Chan, F.R.; Tsao, P.S.; Feinstein, J.A.; Taylor, C.A. Three-dimensional hemodynamics in the human pulmonary arteries under resting and exercise conditions. Ann. Biomed. Eng. 2011, 39, 347–358. [Google Scholar] [CrossRef]
- Bächler, P.; Pinochet, N.; Sotelo, J.; Crelier, G.; Irarrazaval, P.; Tejos, C.; Uribe, S. Assessment of normal flow patterns in the pulmonary circulation by using 4D magnetic resonance mapping. Magn. Reson. Imaging 2013, 31, 178–188. [Google Scholar] [CrossRef]
- Hu, L.; Ouyang, R.; Sun, A.; Wang, Q.; Guo, C.; Peng, Y.; Qin, Y.; Zhang, Y.; Xiang, Y.; Zhong, Y. Pulmonary artery hemodynamic assessment of blood characteristics in repaired tetralogy of Fallot patients versus healthy child volunteers. Quant. Imaging Med. Surg. 2020, 10, 921–933. [Google Scholar] [CrossRef] [PubMed]
- Bailliard, F.; Anderson, R.H. Tetralogy of Fallot. Orphanet. J. Rare Dis. 2009, 4, 2. [Google Scholar] [CrossRef] [PubMed]
- Rao, B.N.S.; Anderson, R.C.; Edwards, J.E. Anatomic variations in the tetralogy of Fallot. Am. Heart J. 1971, 81, 361–371. [Google Scholar] [CrossRef] [PubMed]
- Geva, T. Repaired tetralogy of Fallot: The roles of cardiovascular magnetic resonance in 728 evaluating pathophysiology and for pulmonary valve replacement decision support. J. Cardiovasc. Magn. Reson. 2011, 13, 24. [Google Scholar] [CrossRef] [PubMed]
- Kordybach Prokopiuk, M.; Kowalski, M.; Spiewak, M.; Piotrowicz, E.; Hoffman, P. What can 731 pulmonary regurgitation indices reflect in patients after tetralogy of Fallot repair? Kardiol. Pol. 2015, 73, 31–39. [Google Scholar] [CrossRef] [PubMed]
- Babu-Narayan, S.V.; Gatzoulis, M.A. Management of Adults with Operated Tetralogy of Fallot. Curr. Treat. Options Cardiovasc. Med. 2003, 5, 389–398. [Google Scholar] [CrossRef]
- Boumpouli, M.; Sauvage, E.L.; Capelli, C.; Schievano, S.; Kazakidi, A. Characterization of flow dynamics in the pulmonary bifurcation of patients with repaired Tetralogy of Fallot: A computational approach. Front. Cardiovasc. Med. 2021, 8, 703717. [Google Scholar] [CrossRef]
- Black, S.M.; Maclean, C.; Hall Barrientos, P.; Ritos, K.; Kazakidi, A. Reconstruction and Validation of Arterial Geometries for Computational Fluid Dynamics Using Multiple Temporal Frames of 4D Flow-MRI Magnitude Images. Cardiovasc. Eng. Technol. 2023, 14, 655–676. [Google Scholar] [CrossRef] [PubMed]
- Yushkevich, P.A.; Piven, J.; Hazlett, H.C.; Smith, R.G.; Ho, S.; Gee, J.C.; Gerig, G. User-guided 3D active contour segmentation of anatomical structures: Significantly improved efficiency and reliability. NeuroImage 2006, 31, 1116–1128. [Google Scholar] [CrossRef]
- Bone, A.; Colliot, O.; Durrleman, S. Learning Distributions of Shape Trajectories from Longitudinal Datasets: A Hierachical model on a manifold of diffeomorphisms. In Proceedings of the IEEE/CVF Conference on Computer Vision and Pattern Recognition, Salt Lake City, UT, USA, 18–22 June 2018; pp. 9271–9280. [Google Scholar] [CrossRef]
- Suinesiaputra, A.; Ablin, P.; Albà, X.; Alessandrini, M.; Allen, J.; Bai, W.; Çimen, S.; Claes, P.; Cowan, B.R.; D’hooge, J.; et al. Statistical shape modeling of the left ventricle: Myocardial infarct classification challenge. IEEE J. Biomed. Health Inform. 2018, 22, 503–515. [Google Scholar] [CrossRef]
- Biglino, G.; Capelli, C.; Bruse, J.L.; Bosi, G.M.; Taylor, A.M.; Schievano, S. Computational modelling for congenital heart disease: How far are we from clinical translation? Heart 2016, 103, 98–103. [Google Scholar] [CrossRef] [PubMed]
- Bruse, J.L.; McLeod, K.; Biglino, G.; Ntsinjana, H.N.; Capelli, C.; Hsia, T.-Y.; Sermesant, M.; Pennec, X.; Taylor, A.M.; Schievano, S. A statistical shape modelling framework to extract 3D shape biomarkers from medical imaging data: Assessing arch morphology of repaired coarctation of the aorta. BMC Med. Imaging 2016, 16, 40. [Google Scholar] [CrossRef] [PubMed]
- Piccinelli, M.; Veneziani, A.; Steinman, D.A.; Remuzzi, A.; Antiga, L. A framework for geometric analysis of vascular structures: Application to cerebral aneurysms. IEEE Trans. Med. Imaging 1987, 28, 1141–1155. [Google Scholar] [CrossRef] [PubMed]
- Antiga, L.; Piccinelli, M.; Botti, L.; Ene-Iordache, B.; Remuzzi, A.; Steinman, D.A. An image-based modeling framework for patient-specific computational hemodynamics. Med. Biol. Eng. Comput. 2008, 46, 1097–1112. [Google Scholar] [CrossRef] [PubMed]
- Doyle, M.G.; Crawford, S.A.; Osman, E.; Eisenberg, N.; Tse, L.; Amon, C.H.; Forbes, T.L. Analysis of Iliac Artery Geometric Properties in Fenestrated Aortic Stent Graft Rotation. Vasc. Endovasc. Surg. 2018, 52, 188–194. [Google Scholar] [CrossRef] [PubMed]
- Thomas, J.B.; Antiga, L.; Che, S.L.; Milner, J.S.; Steinman, D.A.H.; Spence, J.D.; Rutt, B.K.; Steinman, D.A. Variation in the carotid bifurcation geometry of young versus older adults. Implications for geometric risk of atherosclerosis. Stroke 2005, 36, 2450–2456. [Google Scholar] [CrossRef]
- Boumpouli, M.; Danton, M.H.D.; Gourlay, T.; Kazakidi, A. Blood flow simulations in the pulmonary bifurcation in relation to adult patients with repaired tetralogy of Fallot. Med. Eng. Phys. 2020, 85, 123–138. [Google Scholar] [CrossRef] [PubMed]
- Menter, F.R.; Kuntz, M.; Langtry, R. Ten Years of Industrial Experience with the SST Turbulence Model. Turbulence, Heat and Mass Transfer 4. In Proceedings of the Fourth International Symposium on Turbulence, Heat and Mass Transfer, Antalya, Turkey, 12–17 October 2003; pp. 625–632. [Google Scholar]
- Liu, M.; Martino, S.; Salerno, M.; Quadrio, M. On the Turbulence Modeling of the Blood Flow in a Stenotic Vessel. J. Biomed. Eng. 2020, 142, 011009. [Google Scholar] [CrossRef]
- Boumpouli, M. Blood Flow Dynamics in Surviving Patients with Repaired Tetralogy of Fallot. Ph.D. Thesis, University of Strathclyde, Glasgow, UK, 2021. [Google Scholar]
- Johnston, L.; Allen, R.; Hall-Barrientos, P.; Mason, A.; Kazakidi, A. Hemodynamic Abnormalities in the Aorta of Turner Syndrome Girls. Front. Cardiovasc. Med. 2021, 8, 670841. [Google Scholar] [CrossRef]
- Hyde-Linaker, G.; Barientos, P.H.; Stoumpos, S.; Kingsmore, D.B.; Kazakidi, A. Patient specific computational haemodynamics associated with surgical creation of an arteriovenous fistula. Med. Eng. Phys. 2022, 105, 103814. [Google Scholar] [CrossRef]
- Kazakidi, A.; Sherwin, S.J.; Weinberg, P.D. Effect of Reynolds number and flow division on patterns of haemodynamic wall shear stress near branch points in the descending thoracic aorta. J. R. Soc. Interface 2009, 6, 539–548. [Google Scholar] [CrossRef]
- Kazakidi, A.; Plata, A.M.; Sherwin, S.J.; Weinberg, P.D. Effect of reverse flow on the pattern of wall shear stress near arterial branches. J. R. Soc. Interface 2011, 8, 1594–1603. [Google Scholar] [CrossRef] [PubMed]
- Evergen, P.; Fuchs, L.; Revstedt, J. On the secondary flow through bifurcating pipes. Phys. Fluids 2010, 22, 103601. [Google Scholar] [CrossRef]
- Yoon, K.; Jung, H.W.; Chun, M.-S. Secondary Dean flow characteristics of inelastic Bird-Carreau fluid in curved microchannels. Korea-Aust. Rheol. J. 2020, 32, 61–70. [Google Scholar] [CrossRef]
- Zhao, Q.; Yuan, D.; Zhang, J.; Li, W. A Review of Secondary Flow in Inertial Microfluidics. Micromachines 2020, 11, 461. [Google Scholar] [CrossRef]
- Chassagne, F.; Barbour, M.C.; Chivukula, V.K.; Machicoane, N.; Kim, L.J.; Levitt, M.R.; Aliseda, A. The effect of Dean, Reynolds and Womersley numbers on the flow in a spherical cavity on a curved round pipe. Part 1. Fluid mechanics in the cavity as a canonical flow representing intracranial aneurysms. J. Fluid Mech. 2021, 915, A123. [Google Scholar] [CrossRef]
- Migliavacca, F.; de Level, M.R.; Dubini, G.; Pietrabissa, R.; Fumero, R. Computational fluid dynamic simulations of cavopulmonary connections with an extracardiac lateral conduit. Med. Eng. Phys. 1999, 21, 187–193. [Google Scholar] [CrossRef] [PubMed]
- Migliavacca, F.; Kilner, P.J.; Pennati, G.; Dubini, G.; Pietrabissa, R.; Fumero, R.; de Leval, M.R. Computational fluid dynamics and magnetic resonance analyses of flow distribution between the lungs after total cavopulmonary connection. IEEE Trans. Biomed. Eng. 1999, 46, 393–399. [Google Scholar] [CrossRef]
- Migliavacca, F.; Dubini, G.; Bove, E.L.; de Leval, M.R. Computational fluid dynamics simulations in realistic 3-D geometries of the total cavopulmonary anastomosis: The influence of the inferior caval anastomosis. J. Biomech. Eng. 2003, 125, 805–813. [Google Scholar] [CrossRef]
- Ensley, A.E.; Ramuzat, A.; Healy, T.M.; Chatzimavroudis, G.P.; Lucas, C.; Sharma, S.; Pettigrew, R.; Yoganathan, A.P. Fluid mechanic assessment of the total cavopulmonary connection using magnetic resonance phase velocity mapping and digital particle image velocimetry. Ann. Biomed. Eng. 2000, 28, 1172–1183. [Google Scholar] [CrossRef]
- Marsden, A.L.; Vignon-Clementel, I.E.; Chan, F.P.; Feinstein, J.A.; Taylor, C.A. Effects of Exercise and Respiration on Hemodynamic Efficiency in CFD Simulations of the Total Cavopulmonary Connection. Ann. Biomed. Eng. 2007, 35, 250–263. [Google Scholar] [CrossRef]
- De Leval, M.R.; Kilner, P.; Gewillig, M.; Bull, C.; McGoon, D.C. Total cavopulmonary connection: A logical alternative to atriopulmonary connection for complex Fontan operations: Experimental studies and early clinical experience. J. Thorac. Cardiovasc. Surg. 1988, 96, 682–695. [Google Scholar] [CrossRef]
- Dubini, G.; de Leval, M.R.; Pietrabissa, R.; Montevecchi, F.M.; Fumero, R. A numerical fluid mechanical study of repaired congenital heart defects. Appl. Total Cavopulmonary Connect. J. Biomech. 1996, 29, 111–121. [Google Scholar] [CrossRef]
- Spazzapan, M.; Sastry, P.; Dunning, J.; Nordsletten, D.; de Vecchi, A. The use of Biophysical Flow Models in the Surgical Management of Patients Affected by Chronic Thromboembolic Pulmonary Hypertension. Front. Physiol. 2018, 9, 341819. [Google Scholar] [CrossRef] [PubMed]
- Zhang, W.; Liu, J.; Yan, Q.; Liu, J.; Hong, H.; Mao, L. Computational haemodynamic analysis of left pulmonary artery angulation effects on pulmonary blood flow. Interact. Cardiovasc. Thorac. Surg. 2016, 23, 519–525. [Google Scholar] [CrossRef] [PubMed]
- Chern, M.J.; Wu, M.T.; Wang, H.L. Numerical investigation of regurgitation phenomena in pulmonary arteries of Tetralogy of Fallot patients after repair. J. Biomech. 2008, 41, 3002–3009. [Google Scholar] [CrossRef]
- Chern, M.J.; Wu, M.T.; Wei-Her, S. Numerical Study for Blood Flow in Pulmonary Arteries after Repair of Tetralogy of Fallot. Comput. Math. Methods Med. 2012, 2012, 198108. [Google Scholar] [CrossRef] [PubMed]
- Tang, B.T.; Pickard, S.S.; Chan, F.P.; Tsao, P.S.; Taylor, C.A.; Feinstein, J.A. Wall shear stress is decreased in the pulmonary arteries of patients with pulmonary arterial hypertension: An image-based, computational fluid dynamics study. Pulm. Circ. 2012, 2, 470–476. [Google Scholar] [CrossRef]
- Gimbrone, M.A. Vascular Endothelium: An Integrator of Pathophysiologic Stimuli in Atherosclerosis. Am. J. Cardiol. 1995, 75, 67B–70B. [Google Scholar] [CrossRef]
- Sabri, M.R.; Daryoushi, H.; Gharipour, M. Endothelial function state following repair of cyanotic congenital heart disease. Cardiol. Young 2015, 25, 222–227. [Google Scholar] [CrossRef]
- Capuano, F.; Loke, Y.H.; Cronin, I.; Olivieri, L.J.; Balaras, E. Computational Study of Pulmonary Flow Patterns after Repair of Transposition of Great Arteries. J. Biomech. Eng. 2019, 141, 051008. [Google Scholar] [CrossRef] [PubMed]
- Bordones, A.D.; Leroux, M.; Kheyfets, V.O.; Wu, Y.-A.; Chen, C.-Y.; Final, E.A. Computational Fluid Dynamics Modeling of the Human Pulmonary Arteries with Experimental Validation. Ann. Biomed. Eng. 2018, 46, 1309–1324. [Google Scholar] [CrossRef] [PubMed]
- Robinson, J.D.; Rose, M.J.; Joh, M.; Jarvis, K.; Schnell, S.; Barker, A.J.; Rigsby, C.K.; Markl, M. 4-D flow magnetic-resonance-imaging-derived energetic biomarkers are abnormal in children with repaired tetralogy of Fallot and associated with disease severity. Pediatr. Radiol. 2019, 49, 308–317. [Google Scholar] [CrossRef] [PubMed]
- Fanni, B.M.; Gasparotti, E.; Vignali, E.; Capelli, C.; Positano, V.; Celi, S. An integrated in-vitro and in-silico workflow to study the pulmonary bifurcation hemodynamics. Comput. Fluids 2023, 260, 105912. [Google Scholar] [CrossRef]
- Loke, Y.-H.; Capuano, F.; Mandell, J.; Cross, R.R.; Cronin, I.; Mass, P.; Balaras, E.; Olivieri, L.J. Abnormal Pulmonary Artery Bending Correlates With Increased Right Ventricular Afterload Following the Arterial Switch Operation. World J. Pediatr. Congenit. Heart Surg. 2019, 10, 572–581. [Google Scholar] [CrossRef] [PubMed]
- Sloth, E.; Houlind, K.C.; Oyre, S.; Kim, W.Y.; Pedersen, E.M.; Jørgensen, H.S.; Hasenkam, J.M. Three-dimensional visualization of velocity profiles in the human main pulmonary artery with magnetic resonance phase-velocity mapping. Am. Heart J. 1994, 128, 1130–1138. [Google Scholar] [CrossRef]
- Johnston, L.; Boumpouli, M.; Kazakidi, A. Hemodynamics in the Aorta and Pulmonary Arteries of Congenital Heart Disease Patients: A Mini Review. J. Cardiol. Cardiovasc. Sci. 2021, 5, 1–5. [Google Scholar] [CrossRef]
- Misaki, K.; Futami, K.; Uno, T.; Nambu, I.; Yoshikawa, A.; Kamide, T.; Nakada, M. Inflow hemodynamics of intracranial aneurysms: A comparison of computational fluid dynamics and 4D flow magnetic resonance imaging. J. Stroke Cerebrovasc. Dis. 2021, 30, 105685. [Google Scholar] [CrossRef]
- Shahid, L.; Rice, J.; Berhane, H.; Rigsby, C.; Robinson, J.; Griffin, L.; Markl, M.; Roldán-Alzate, A. Enhanced 4D flow MRI-based CFD with adaptive mesh refinement for flow dynamics assessment in coarctation of the aorta. Ann. Biomed. Eng. 2022, 50, 1001–1016. [Google Scholar] [CrossRef]
- Black, S.M.; Maclean, C.; Barrientos, P.H.; Ritos, K.; McQueen, A.; Kazakidi, A. Calibration of patient-specific boundary conditions for coupled CFD models of the aorta derived from 4D Flow-MRI. Front. Bioeng. Biotechnol. 2023, 11, 1178483. [Google Scholar] [CrossRef]
- Stokes, C.; Bonfanti, M.; Li, Z.; Xiong, J.; Chen, D.; Balabani, S.; Díaz-Zuccarini, V. A novel MRI-based data fusion methodology for efficient, personalised, compliant simulations of aortic haemodynamics. J. Biomech. 2021, 129, 110793. [Google Scholar] [CrossRef]
- Szajer, J.; Ho-Shon, K. A comparison of 4D flow MRI-derived wall shear stress with computational fluid dynamics methods for intracranial aneurysms and carotid bifurcations—A review. Magn. Reson. Imaging 2018, 48, 62–69. [Google Scholar] [CrossRef] [PubMed]
- Johnston, L.; Allen, R.; Mason, A.; Kazakidi, A. Morphological characterisation of pediatric Turner syndrome aortae: Insights from a small cohort study. Med. Eng. Phys. 2023, 120, 104045. [Google Scholar] [CrossRef] [PubMed]
- Jin, S.; Oshinski, J.; Giddens, D.P. Effects of Wall Motion and Compliance on Flow Patterns in the Ascending Aorta. J. Biomech. Eng. 2003, 125, 347–354. [Google Scholar] [CrossRef]
- Bazilevs, Y.; Hsu, M.C.; Benson, D.J.; Sankaran, S.; Marsden, A.L. Computational fluid structure interaction: Methods and application to a total cavopulmonary connection. Comput. Mech. 2009, 45, 77–89. [Google Scholar] [CrossRef]
- Cowley, J.; Luo, X.; Stewart, G.D.; Shu, W.; Kazakidi, A. A mathematical model of blood loss during renal resection. Fluids 2023, 8, 316. [Google Scholar] [CrossRef]
- Van Doormaal, M.A.; Kazakidi, A.; Wylezinska, M.; Hunt, A.; Tremoleda, J.L.; Prottis, A.; Bohraus, Y.; Gsell, W.; Weinberg, P.D.; Ethier, C.R. Haemodynamics in the mouse aortic arch computed from MRI-derived velocities at the aortic root. J. R. Soc. Interface 2012, 9, 2834–2844. [Google Scholar] [CrossRef]
- Armour, C.H.; Guo, B.; Pirola, S.; Saitta, S.; Liu, Y.; Dong, Z.; Xu, X.Y. The influence of inlet velocity profile on predicted flow in type B aortic dissection. Biomech. Model. Mechanobiol. 2021, 20, 481–490. [Google Scholar] [CrossRef]
Disclaimer/Publisher’s Note: The statements, opinions and data contained in all publications are solely those of the individual author(s) and contributor(s) and not of MDPI and/or the editor(s). MDPI and/or the editor(s) disclaim responsibility for any injury to people or property resulting from any ideas, methods, instructions or products referred to in the content. |
© 2024 by the authors. Licensee MDPI, Basel, Switzerland. This article is an open access article distributed under the terms and conditions of the Creative Commons Attribution (CC BY) license (https://creativecommons.org/licenses/by/4.0/).

