Article

Aeroacoustic Coupling in Rectangular Deep Cavities: Passive Control and Flow Dynamics

1
Mechanical Engineering Department, Beirut Arab University, Tripoli 1300, Lebanon
2
Mechanical Engineering Department, Prince Mohammad Bin Fahd University, Al Khobar 34218, Saudi Arabia
3
LASIE UMR CNRS 7356, La Rochelle University, 17000 La Rochelle, France
*
Author to whom correspondence should be addressed.
Fluids 2024, 9(8), 187; https://doi.org/10.3390/fluids9080187
Submission received: 27 June 2024 / Revised: 8 August 2024 / Accepted: 15 August 2024 / Published: 17 August 2024
(This article belongs to the Special Issue Flow Visualization: Experiments and Techniques)

Abstract

:
Deep cavity configurations are common in various industrial applications, including automotive windows, sunroofs, and many other applications in aerospace engineering. Flows over such a geometry can result in aeroacoustic coupling between the cavity shear layer oscillations and the surrounding acoustic modes. This phenomenon can result in a resonance that can lead to significant noise and may cause damage to mechanical structures. Flow control methods are usually used to reduce or eliminate the aeroacoustic resonance. An experimental set up was developed to study the effectiveness of both a cylinder and a profiled cylinder positioned upstream from the cavity in reducing the flow resonance. The cavity flow and the acoustic signals were obtained using particle image velocimetry (PIV) and unsteady pressure sensors, respectively. A decrease of up to 36 dB was obtained in the sound pressure levels (SPL) using the passive control methods. The profiled cylinder showed a similar efficacy in reducing the resonance despite the absence of a high-frequency forcing. Time-space cross-correlation maps along the cavity shear layer showed the suppression of the feedback mechanism for both control methods. A snapshot proper orthogonal decomposition (POD) showed interesting differences between the cylinder and profiled cylinder control methods in terms of kinetic energy content and the vortex dynamics behavior. Furthermore, the interaction of the wake of the control device with the cavity shear layer and its impact on the aeroacoustic coupling was investigated using the POD analysis.

1. Introduction

Cavity flow is found in various industrial applications, and numerous researchers have utilized various experimental and numerical methods to investigate the mechanism involved in such flows since the 1950s [1,2]. The aeroacoustic mechanism in such flows results from a coupling between the surrounding acoustic modes and the aerodynamic modes. The flow instability present in the cavity shear layer generates pressure waves upon its impact on the trailing corner of the cavity. The generated pressure waves travel the flow upstream (forming a feedback loop) to control the shear layer near its formation at the cavity’s leading corner. The high acoustic levels inside a cavity, or resonance, and the flow fluctuations are caused by the coupling between periodic oscillations of the flow shear layer and the acoustic modes of the surrounding geometry [3,4,5,6,7,8,9,10]. Therefore, several approaches have been attempted to explore the impact of these fluctuations on flow properties, including drag and heat transfer [11,12].
The highly unsteady flow field, the oscillating shear layer, and the production of acoustic waves are fundamental characteristics of cavity flows. However, cavities were classified in different ways, based on the incoming flow, their geometry, or even by the static pressure distribution. Cavity flow has been observed over a wide variety of geometries, as well as Reynolds and Mach numbers. This led to one of the initial classifications, proposed by Charwat et al. [13], who demonstrated that cavities can be categorized as either open or closed. Rossiter [14] added a third category known as transitional. This classification was based on the differences in aspect ratio and the static pressure distribution for each category. However, open cavities can be categorized as deep and shallow cavities. Based on earlier experiments [15,16,17], deep cavities have a depth greater than their length (L/H < 1), while shallow cavities have aspect ratio greater than 1 (L/H > 1). This paper focuses on the open deep cavity type, characterized (aspect ratio L/H < 10 [15]). All cavities within this range share a common characteristic; they have a boundary layer separating at the upstream corner and reattaching at the downstream edge.
Rockwell et al. [18] stated that both shallow and deep cavities exhibit fluid oscillations know as self-sustaining oscillations. For deep cavities, a forcing mechanism acts in the shear layer with resonant waves propagating in the transverse direction. This may induce further aeroacoustic couplings that lead to resonance [19,20,21]. On the other hand, shallow cavities are associated with longitudinal acoustic standing waves [22]. Experiments have also shown that propagating disturbances also affect the shear layer of shallow cavities at low subsonic speeds [23].
A reference model for predicting self-sustained cavity oscillations was constructed by Rossiter [24], who developed a semi-empirical analytical model to evaluate the proper frequency of the flow. The production of a high level of noise is often the result of coupling between an acoustic resonance and a certain periodic instability in the flow. Indeed, a portion of the energy is extracted from the flow to sustain the acoustic oscillation. The model proposed by Rossiter evaluates the fundamental frequency of the flow over a cavity, based on a comprehensive description of the interaction between the mixing layer and the acoustic waves. The expression of the Rossiter model is given by
S t = f r × L U 0 = n α M + 1 k ,
where S t is the Strouhal number, f r is the acoustic frequency, n is the cavity mode, L is the length of the cavity, U0 is the free stream velocity, M represents the Mach number, k = u c U 0 represents the ratio between the velocities of the external flow and that of the structures convection in the shear layer, and α represents the delay in time between the impingement of the vortices and the creation of an acoustic disturbance. The parameter α is considered an empirical value and is corrected based on experiments.
In addition to analyzing cavity flow properly, it is highly important to propose control methods that can eliminate resonance without significant energy cost or a substantial increase in drag. Therefore, numerous control methods have been proposed by various authors [25]. These methods include passive control techniques, which involve altering the cavity geometry [26,27] or adding external devices, particularly on the leading edge (such as spoilers [24] or cylinder [28,29], etc.). These methods have shown their effectiveness in eliminating resonance and modifying the flow behavior in the shear layer. Furthermore, some limitations of passive control in certain applications have drawn attention to active control techniques, which involve the use of devices requiring external energy. Active control techniques can be classified as either open-loop or closed-loop, and they demonstrate significant potential in achieving attenuation [30].
In this study, we utilized the same configurations used by El Hassan et al. [28], where two passive control techniques were employed: the use of a cylindrical cylinder and the use of a profiled cylinder. The reduction of noise level using such a device has been studied by Stanek et al. [31,32,33] for subsonic and supersonic flows. These authors propose the following explanation for the effectiveness of the rod: the high-frequency forcing stabilizes the hydrodynamic stability of the flow and thus reduces the pressure levels inside the cavity. However, this is just one hypothesis among others, as the addition of the rod involves complex, highly nonlinear physics, as well as several mechanisms involved in the suppression of pressure fluctuations. Both passive and active control methods were used to attenuate cavity resonance [34]. The control of a cavity flow has been studied to a limited extent for a deep cavity (El Hassan et al. [29]). In most studies, the flow velocity was high (applied to military aviation). At relatively low velocities, the control of deep cavity flow finds application in the automotive and railway fields.
Proper orthogonal decomposition (POD), presented by Lumley in 1967 [35], involves decomposing the random vector field into a set of functions that effectively represent the turbulent motion and organization of the flow through POD modes. It enables the capture of the flow’s total fluctuating kinetic energy [36]. Over the years, various POD methods have been developed for numerous fluid dynamic applications [37,38,39,40], including cavity flow [41,42,43]. Overall, these studies highlight the diverse applications of POD in analyzing cavity flows, showcasing its efficacy in capturing dominant flow features, identifying coherent structures, and investigating flow instability. By extracting crucial information on flow features such as frequency, amplitude, and spatial distribution, POD enables researchers to understand the impact of design parameters on these flow characteristics. However, one of the main objectives of utilizing POD in the case of deep cavity flows is to gain insights into the flow physics of the complex flow phenomena. This involves analyzing and identifying coherent structures and recirculating zones that play an important part in describing the flow behavior. Understanding the flow mechanism leading to flow separation, turbulence, and drag is of utmost importance in deep cavity flow analysis.
In this study, a circular cylinder and a profiled cylinder were employed to alter the aeroacoustic resonance within a deep, large cavity subjected to low subsonic flow. Hot wire and pressure measurements were conducted to investigate the acoustic resonance of the cavity. The particle image velocimetry (PIV) technique is employed to investigate the flow dynamics in both cases of the circular and profiled cylinders. Examination of the spatiotemporal development of vortical structures is derived from consecutive snapshots. Statistical support for interpreting the primary mechanisms is provided through both spatiotemporal cross-correlation maps and proper orthogonal decomposition (POD).

2. Materials and Methods

2.1. Cavity and Control Mechanism

A deep cavity inside a closed-circuit wind tunnel of a cross-sectional area of 2 × 2 m2 and a length of 10 m (test section) and allowing a maximum velocity of 60 m/s was used to conduct our experiments. In this study, a freestream velocity of U0 = 43 m/s was used [28].
The geometry of the considered cavity is defined as follows: length (L) = 10.4 cm, depth (H) = 52 cm, and width (W) = 200 cm. The cavity is located on the lateral wall of the working area of the wind tunnel. Its leading corner is 8 m far from the inlet of the test section. To assess the boundary layer characteristics, velocity profiles were measured using hotwire measurements immediately upstream from the leading corner of the cavity. In the experimental setup, a cylinder of 0.6 cm in diameter was located 3 cm upstream from the cavity leading corner in the transverse direction. The cylinder was placed at a vertical position of yc = 10 mm from the wall. This specific positioning was selected to achieve an effective control of the resonance of the cavity. The same position was used for the profiled cylinder which has the dimensions shown in Figure 1.

2.2. Hot-Wire Measurements

A hot wire probe (Dantec55P15, manufactured by Dantec Dynamics, Skovlunde, Denmark) is located at x/L = 0.1 from the leading corner of the cavity. Acquisition and storage of C.T.A. signals (Constant Temperature Anemometry, DANTEC 90C10, manufactured by Dantec Dynamics, Skovlunde, Denmark) were conducted thanks to the software “Streamline 3.0” from DANTEC Dynamics, Skovlunde, Denmark. Through this procedure, we obtain a voltage signal related to the flow velocity signal at the sensor location.

2.3. Acoustic Measurements

The nominal sensitivity of Kulite sensors used for this study is 275 mV/bar. For each sensor, the output was connected to a multi-channel conditioner that allows for the adjusting of the gain while keeping an average around zero. At the output of the conditioner, the pressure signal is transferred to an analog-to-digital acquisition card with a resolution of 12 bits. The chosen sampling frequency was 6 KHz, and the number of samples was 180,000 per channel, corresponding to an acquisition time of 30 s. A low-pass filter (cut-off at 3 KHz) was implemented to eliminate the aliasing effect.

2.4. PIV Velocity Measurements

Particle image velocimetry (PIV) offers non-invasive and highly accurate results for several flow configurations, making it an attractive choice for researchers investigating complex fluid phenomena in numerous applications. The PIV system is based upon a time resolved PIV Dantec “DynamicStudio” system, including a 2 × 10 mJ dual YAG laser and a 3 kHz Photron Ultima APX-RS Camera (1024 × 1024 pixels), used at 2 kHz frequency (1 kHz vector map). The time delay between two laser pulses was 30 μs. The PIV camera was mounted on a traversing system, perpendicular to the light sheet plane of the laser. PIV measurements were taken in a streamwise plane (x, y), normal to the wall.
In this study, the PIV technique was employed at a sampling rate of 15 Hz, while the freestream velocity was maintained at 43 m/s. PIV differs from other flow measurement and visualization techniques in several ways. It enables the instantaneous determination of the kinematic field, offering good spatial coverage in a 2D or 3D plane but with limited temporal resolution ranging from 1/15 s to 1/1000 s, depending on the experimental setup. PIV works by seeding the flow with particles and capturing images then analyzing these images to determine the velocity field of the fluid.
A typical PIV system includes a laser sheet that illuminates a plane in the flow, and the particles in this plane are captured by a camera pre-processed to improve the data quality, including filtering and other processing measures. Multiple particle images are then created, and these particles are tracked to determine the displacement of all particles, providing information about the flow velocity.
PIV is subjected to uncertainties in velocity measurements due to multiple sources, such as camera calibration or an incorrect choice of the time interval between two images, among other factors. This makes uncertainty analysis important for minimizing errors through the quantification of uncertainty using statistical methods.
The complexity of the PIV system generates measurement errors related to several parameters. Some PIV measurement errors, such as those due to camera calibration, can be minimized by refining the settings, but other errors cannot be eliminated and must be estimated. The main PIV measurement uncertainties can be summarized as follows.
Errors Related to Particle Size and Displacement: The precision of PIV measurements is primarily related to particle size, density, and their average displacement relative to the size of the interrogation zones. When the ratio of the particle image diameter (dpar) to the pixel size (dpix) is less than 2, the energy spectrum is overestimated due to the “peak-locking” phenomenon [44]. Prasad et al. [45] recommend an optimal particle image size according to the relation 3 < dpar/dpix < 4. In this case, the measurement uncertainty is estimated at about 1/10 to 1/20 of the particle image diameter.
In our case, PIV image magnification shows that the average particle diameter is approximately 28 to 32 μm, implying a dpar/dpix ratio of 3.1 to 3.6. Consequently, pixel resolution is adequate, and the uncertainty in particle displacement measurement is approximately 1/15 of the particle image size. Normalizing this uncertainty with the average particle displacement results in a relative error of 1.6%.
The bias error, related to the accuracy of sub-pixel interpolation (Gaussian interpolation), is estimated in our case to be 1/10 of a pixel size with 8-bit images [46]. Thus, the velocity bias error is calculated using the equation:
U e r r = 0.1 × T p i x e l × M e c h t ,
where T pixel is the pixel size (9 μm), Mech is the image scale factor, and ∆t is the time between two laser pulses, with Mech = 3 and ∆t = 66 ms; the bias error is approximately 0.04 × 10⁻³ m/s.
Errors Due to the Number of Samples: A sufficient number of samples, N, must be taken when calculating the average velocity fields. The larger the number N, the closer the velocity distribution function, approximates a Gaussian function. Theoretically, the mean velocity value approaches its exact value as N tends to infinity. The central limit theorem shows that the uncertainty in the mean velocity, ϵn, is σ/N (where σ is the standard deviation of the measured velocities). In our case, the standard deviation is obtained with a 95% confidence interval, so ϵn = 1.96σ/√N. For our study, the highest value for this type of error does not exceed 10−2 U0.

3. Results

3.1. Acoustic Field

The primary objective if the present work is to reduce significantly or eliminate the resonance resulting from the aeroacoustic coupling. Therefore, a simple control method that consists of two mechanisms of control—a cylindrical rod and a profiled cylinder placed transversely upstream of the cavity—is proposed (Figure 1).
Stanek et al. [31] linked the performance of the cylinder to the high-frequency forcing phenomenon induced by the vortex shedding after the cylinder. He suggested that the frequency of shedding must be much higher (at least 10 times) than that of cavity modes. Illy et al. [47] varied the cylinder diameter to observe the impact of the vortex shedding frequency on the control effectiveness, and they found contradiction with Stanek’s hypothesis.
Thus, the idea behind implementing a profiled cylinder is to have a body similar to the cylinder but with a profile that prevents the formation of high-frequency vortex shedding in order to explore the effectiveness of such a control and its relationship with the vortex shedding behind the cylinder.
Figure 2 shows the spectrum of the sound pressure level (SPL) of the pressure signal in the absence of control. In the same figure, we plotted the spectrum of the normalized velocity acquired through the hot wire technique. One can notice that both the normalized velocity and SPL present a peak at a frequency of 155 Hz, indicating a strong relation between the shedding vortices and the acoustic field produced in such a flow. This result confirms the existence of a self-sustained loop, where the vortices impinge on the trailing corner of the cavity, thus creating a pressure wave at the same frequency under optimal conditions of energy transfer from the aerodynamic field to the acoustic one.
In the pressure level spectrum Figure 3a, it is noticeable that in the presence of the profiled cylinder, the noise reduction is almost identical to that obtained with the cylinder (About 30 dB of reduction). In the spectrum of the normalized velocity obtained from hot-wire measurements (Figure 3b), it can be noted that the peak of the Rossiter mode has indeed disappeared with the use of the streamlined cylinder, as well as the vortex shedding behind the cylinder. It can also be noted that the energy distribution has shifted towards higher frequencies to a lesser range when the profiled cylinder is employed. This result confirms that the noise reduction is not due to high-frequency forcing.

3.2. Kinematic Field

Velocity fields were derived from PIV snapshots to describe the flow. PIV enabled the measurement of mean velocity distribution for both longitudinal and transverse velocity components. Figure 4 illustrates the mean longitudinal velocity distribution, and Figure 5 illustrates the vorticity magnitude, offering valuable information on the flow dynamics, for all three studied cases. In Figure 4a, it is observed that the flow leaving the leading edge undergoes a transition from a boundary-layer flow to a shear layer flow. Consequently, the shear layer, which develops after the boundary layer separation at the cavity leading corner, expands and thickens as it progresses from the separation point to the trailing corner of the cavity. Figure 4b,c show a decrease in velocity in the wake zone of both control mechanisms (cylinder and profiled cylinder). This decrease leads to the thickening of the shear layer in the presence of the cylinders. Similar findings were reported by Illy et al. [48], who considered the impact of a cylinder on the flow of a deep cavity (L/H = 0.42).
Figure 5a shows the presence of high vorticity magnitude at the point of flow separation and along the cavity shear layer. It also shows a region of deficiency (70 mm < X < 93 mm) just before the flow impinges on the cavity trailing corner, where vorticity rises once more. In Figure 5b, it is shown that the streamwise vorticity produced by the cylinder has considerably reduced within the shear layer of the cavity. This indicates the suppression of large-scale vortices in the wake of the cylinder. In Figure 5c, one can note that for the profiled cylinder, the vorticity distribution within the shear layer of the cavity closely resembles that observed without control. This distribution suggests that the profiled cylinder induces a minimal disturbance within the shear layer of the flow.
The normalized turbulent kinetic energy (TKE) is plotted in Figure 6. In absence of control (Figure 6a), elevated values of TKE are exhibited in the downstream region of the cavity shear layer, attributed to the development of large-scale vortices as they travel toward the cavity trailing corner. Introducing the cylinder (Figure 6b) results in a significant rise of TKE in the upstream region. Two peaks in the TKE distribution can be distinguished (at X = 40 mm) and are associated with the shedding from the cylinder. With the profiled cylinder (Figure 6c) compared to the case with cylinder, one can notice that the wake of the profiled cylinder presents dramatic decrease in the TKE. The TKE values in most of the cavity shear layer are even lower than that without control (Figure 6a). This could be related to a configuration where the aeroacoustic coupling is not optimized or suppressed when the profiled cylinder is used despite the elimination of high-frequency forcing (control with cylinder). When the cylinder is employed, it is interesting to observe lower TKE magnitudes in the downstream part of the shear layer as compared to the case without control. These effects will be further investigated using the analysis of the instantaneous velocity fields.
For vortex identification purpose, the Lambda-2 criterion, which detects the center of rotating structures by assuming the minimum local pressure at the vortex centre, is used [49]. Essentially, it is a mathematical tool based on the eigenvalues of the velocity gradient tensor that helps in identifying of coherent structures exhibiting strong rotational behavior. Lambda-2 criterion is favored since it gives clearer visualizations of purely rotational structures without capturing regions of high strain, and it does not require the complex calculations involved, respectively, in the Q-criterion and Delta criterion methods. In Figure 7, Lambda-2 fields are displayed for successive phases, following the presentation method used by Assoum (FDR 2013). This presentation reveals the vortex patterns along the shear layer of the cavity flow. Observing Figure 7a for the case without control, one can notice a single pattern of vortices which is dominated by that of the shear layer of the cavity flow. In the case of control with a cylinder (Figure 7b), two main vortex paths are observed: the first path is linked to the vortices in the cavity shear layer, and the second path in the upper part of this figure (10 < Y < 20) corresponds to the shedding vortices from the cylinder. One can also observe a lower concentration of large-scale vortices near the cavity downstream corner when the cylinder is used. In Figure 7c, when a profiled cylinder is used, one can see that the upper path of vortices observed when a cylinder was used almost disappears.
Using both control methods, a spatial shift of the cavity shear layer towards inside the cavity is obtained, with a more pronounced shift in the middle region of the cavity shear layer, especially for the cylinder case. The interaction between the wake of the control devices and the cavity shear layer seem to weaken the impact of the large scale vortical structures on the downstream edge, thus dramatically reducing the aeroacoustic coupling and thus the generated noise.
To better apprehend these complex flows, time–space cross-correlation maps are established to provide more characterization of the cavity–wake interaction.

3.3. Cross-Correlation Maps

In order to acquire more understanding of the cavity–wake interaction, we propose time–space cross-correlation maps. Fluctuation transverse velocity at a specific point chosen as a reference undergoes cross-correlations across the whole field. The cross-correlation coefficient is given by
R v v = 1 N 1 N v ( x , y , t ) v ( x 0 , y 0 , t ) R M S ( v x , y ) × R M S ( v x 0 , y 0 ) .
In this investigation, many points were considered as reference points starting from the cavity leading corner (just downstream from the location of the control devices) towards the impingement zone. These points can be observed in Figure 8 at the positions where R v v = 1 (which corresponds to an autocorrelation). These points were chosen in order to observe the relationship between the cylinder’s wake and the cavity shear layer.
As compared to the case of controlled flow with a cylinder, it is obvious that the profiled cylinder does not have high-frequency shedding. This confirms that an effective control of the aeroacoustic coupling does not require high-frequency forcing.
In the case of no control, it is interesting to see a correlation between the impingement zone (below the downstream corner) and the location where the vortices are generated after the boundary layer separation, just downstream from the cavity leading corner. Such a mechanism (explained by the feedback loop) is absent for the cylinder and profiled cylinder.

3.4. Proper Orthogonal Decomposition (POD)

In confined deep cavity flow, the interactions between the fluid and the cavity walls can lead to complex fluid motion. Velocity fields data can be analyzed using the POD to identify the most frequent and influential fluid patterns in the flow. POD is recognized as a valuable method in providing insights and improving the understanding of fluid flow dynamics. It consists of finding an optimal basis that represents the main flow features. In the current study, the snapshot POD was performed using 550 snapshots taken at regular intervals (acquisition frequency of 15 Hz). Figure 9 displays the cumulative energy sum over the POD modes and the energy fraction for each mode.
In case of no control, the first POD mode contains almost 30% of the flow kinetic energy (KE), and the first five POD modes contain nearly 50% of the total KE. When the profiled cylinder was used, it was found that the first mode contains 27% of the KE, whereas the cumulative KE of the first five POD modes is 40% of the total KE. This result is in agreement with Figure 6a,c, where a small effect of the profiled cylinder on the TKE of the cavity flow was observed. It should, however, be noted that only 15% of the KE is contained in the first POD mode when the cylinder is used, and the cumulative energy for the first five modes is reduced to 31% (Figure 9). This result may be affirmed by Figure 5b, where the vorticity magnitude was found to be significantly decreased in the shear layer of the flow; therefore, the vortices are weakened. Thus, the POD projection attributes less energy to the first POD modes since they are related are related to these coherent structures.
The five most energetic spatial POD modes obtained from longitudinal velocities are illustrated in Figure 10 for controlled and non-controlled flows. Without control, the most energetic POD modes are linked to the advection of the large vortices in the downstream flow of the cavity. The profiled cylinder case presents some similarities with the case without control. However, one can distinguish the higher KE content shifted toward the modes where the vortices are oriented upward near the cavity trailing corner. This might, in part, explain the weak and less organized pressure waves following the impingement of the vortices in the case of the profiled cylinder when compared to the non-controlled flow. With the cylinder, it is noted that the first two POD modes are linked to the cylinder shedding, whereas the three other modes reflect the interaction of the cylinder wake with the cavity shear layer.

4. Conclusions

The state-of-the-art experimental techniques used in this study provide accurate qualitative and quantitative descriptions (within the uncertainties presented in the experimental section) of the aeroacoustics, which is the focus of the present work. The complex studied flow dynamics (the fully turbulent incoming boundary layer, its separation at the cavity leading edge, and the development of cavity shear layer) make it very difficult to predict using analytical methods. To the best of the authors’ knowledge, no analytical predictions exist in the literature for the same cavity geometry and operating flow regimes. However, the aeroacoustic characteristics of similar flows were compared to both semi-empirical and analytical predictions, which were already discussed in the study of El Hassan et al. [21].
Experimental characterization of the interaction between the cavity vortex system and the wake of a control mechanism consisting of a cylinder and a profiled cylinder has been conducted. Different experimental methods were employed to establish this analysis. The main conclusions can be summarized as follows:
  • Achieving a similar significant reduction in noise with both the cylindrical and profiled cylindrical configurations confirms that this reduction is not attributable to high-frequency forcing.
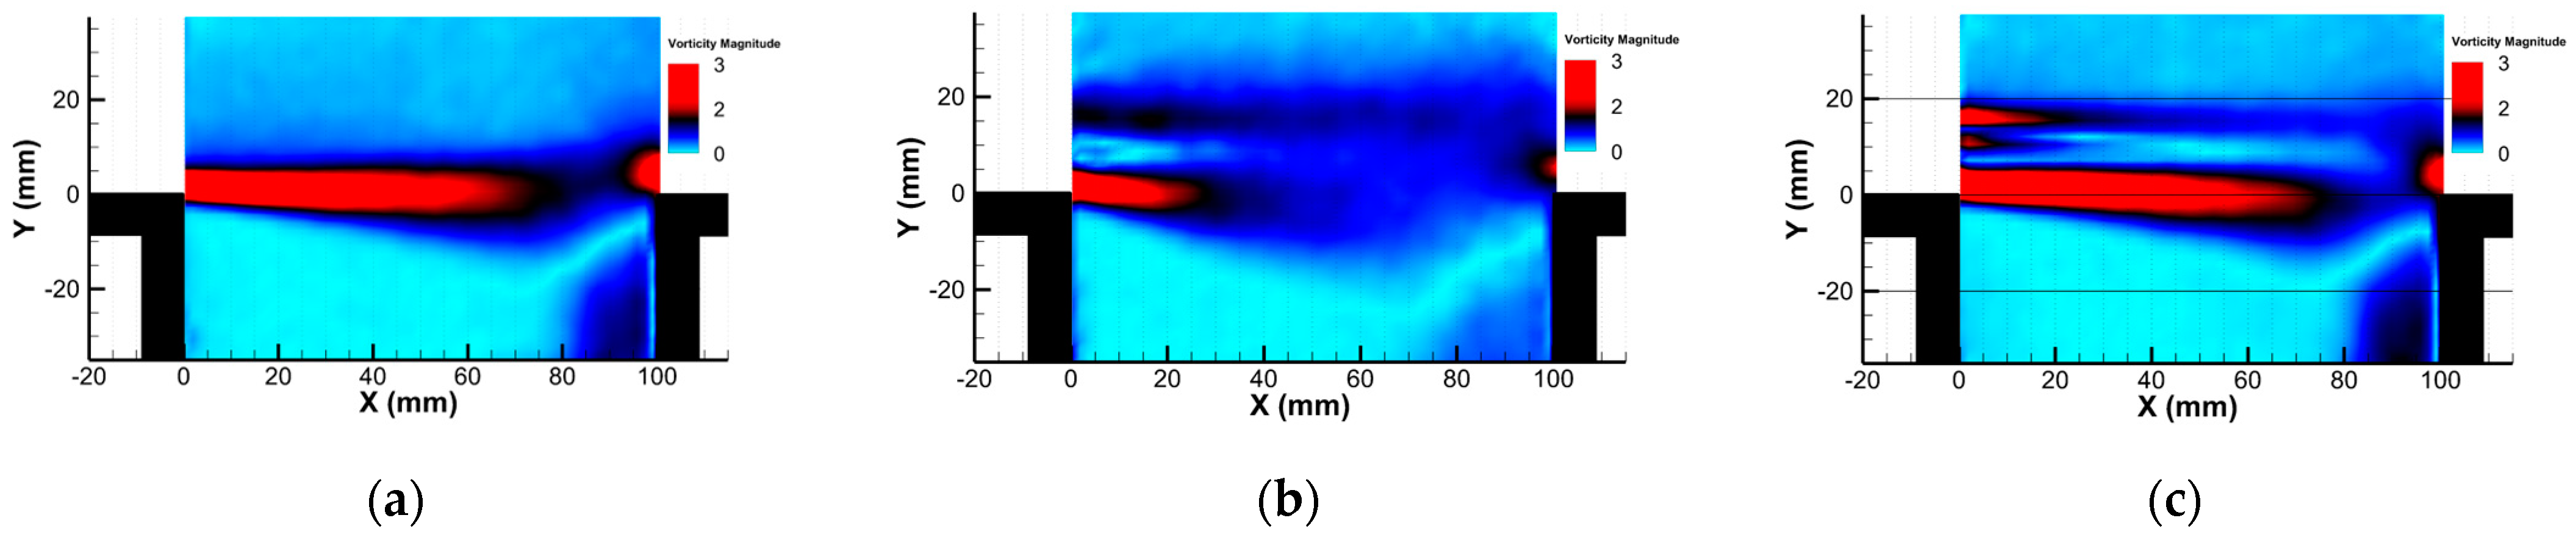
  • Vorticity distribution suggests that the presence of the profiled cylinder introduces minimal disturbance within the cavity shear layer compared to the circular cylinder;
  • The distribution of normalized turbulent kinetic energy (TKE) significantly decreases with the profiled cylinder, indicating lower TKE compared to the uncontrolled flow.
  • Lambda-2 fields reveal two primary vortex paths in the case of control with a cylinder: one linked to vortices in the cavity shear layer and the other related to the cylinder shedding.
  • Cross-correlation maps validate that effective control of aeroacoustic coupling does not necessitate high-frequency forcing.
  • Snapshot POD analysis indicates that in the absence of control, and with control using a profiled cylinder, the first POD mode contains nearly 30% of the flow’s KE, while only 15% of the KE is contained in the first POD mode when using the standard cylinder. This aligns with the decreased vorticity distribution in the shear layer of the flow controlled with the cylinder, resulting in weakened vortical structures. Consequently, the POD projection attributes less energy to the first POD modes since they are associated with these coherent structures.
  • Spatial modes reveal that the higher KE content shifts towards modes where vortical structures are oriented upward near the cavity trailing edge. This may partially explain the weak and less-organized pressure waves following the impingement of vortices with the controlled flow compared to the uncontrolled case.
  • Many perspectives could be proposed:
  • In this study, the focus was on reducing noise near deep cavities. It is worth noting that this noise reduction, achieved by adding a cylinder upstream of the cavity, may lead to an increase in drag and could therefore be detrimental to aerodynamic efficiency. Measurement of friction (estimation of drag) should be considered with the aim of optimizing both aerodynamic and aeroacoustic aspects.
  • Investigating energetic transfers from the aerodynamic field towards the acoustic field with and without the control mechanisms would be of interest in a future investigation.

Author Contributions

A.H.J.: writing—original draft preparation, Data analysis. M.E.H.: Conceptualization, writing—review and editing. A.H.: Supervision. A.S.: Resources and funding acquisition. H.H.A.: Supervision, writing—review and editing. All authors have read and agreed to the published version of the manuscript.

Funding

This research received no external funding.

Data Availability Statement

Data available on request due to restrictions (e.g., privacy, legal or ethical reasons). The data presented in this study are available on request from the corresponding author (accurately indicate status).

Conflicts of Interest

The authors declare no conflict of interest.

References

  1. Powell, A. On Edge Tones and Associated Phenomena. 1953. Available online: https://www.ingentaconnect.com/search/article?option2=author&value2=Powell%2c+Alan&pageSize=10&index=7 (accessed on 28 February 2020).
  2. Krishnamurty, K. Acoustic Radiation from Two-Dimensional Rectangular Cutouts in Aerodynamic Surfaces; NTRS: Washington, DC, USA, 1955. [Google Scholar]
  3. Assoum, H.H.; Hamdi, J.; Hassan, M.; Abed-Meraim, K.; Kheir, M.E.; Mrach, T.; Asmar, S.E.; Sakout, A. Turbulent kinetic energy and self-sustaining tones: Experimental study of a rectangular impinging jet using high Speed 3D tomographic Particle Image Velocimetry. J. Mech. Eng. Sci. 2020, 14, 6322–6333. [Google Scholar] [CrossRef]
  4. Hamdi, J.; Assoum, H.H.; Abed-Meraïm, K.; Sakout, A. Volume reconstruction of a plane jet impinging on a slotted plate using the phase averaging technique. Energy Procedia 2017, 139, 404–409. [Google Scholar] [CrossRef]
  5. Assoum, H.H.; El Hassan, M.; Abed-Meraim, K.; Sakout, A. The vortex dynamics and the self sustained tones in a plane jet impinging on a slotted plate. Eur. J. Mech.-B/Fluids 2014, 48, 231–235. [Google Scholar] [CrossRef]
  6. El Zohbi, B.; Assoum, H.H.; Alkheir, M.; Afyouni, N.; Meraim, K.A.; Sakout, A.; El Hassan, M. Experimental investigation of the Aero-Acoustics of a rectangular jet impinging a slotted plate for different flow regimes. Alex. Eng. J. 2024, 87, 404–416. [Google Scholar] [CrossRef]
  7. Afyouni, N.E.; Alkheir, M.; Assoum, H.; El Zohbi, B.; Abed-Meraim, K.; Sakout, A.; El Hassan, M. Effect of a Control Mechanism on the Interaction between a Rectangular Jet and a Slotted Plate: Experimental Study of the Aeroacoustic Field. Fluids 2023, 8, 309. [Google Scholar] [CrossRef]
  8. Assoum, H.H.; El Kheir, M.; Afyouni, N.E.; El Zohbi, B.; Meraim, K.A.; Sakout, A.; El Hassan, M. Control of a rectangular impinging jet: Experimental investigation of the flow dynamics and the acoustic field. Alex. Eng. J. 2023, 79, 354–365. [Google Scholar] [CrossRef]
  9. Alkheir, M.; Assoum, H.H.; Hamdi, J.; Mrach, T.; Hassan, M.; Sakout, A. Experimental study of the vortex organization in a rectangular impinging jet in the presence of self-sustained tones. Energy Rep. 2021, 8, 1486–1492. [Google Scholar] [CrossRef]
  10. Assoum, H.H.; Hamdi, J.; Alkheir, M.; Meraim, K.A.; Sakout, A.; Obeid, B.; El Hassan, M. Tomographic Particle Image Ve-locimetry and Dynamic Mode Decomposition (DMD) in a Rectangular Impinging Jet: Vortex Dynamics and Acoustic Gen-eration. Fluids 2021, 6, 429. [Google Scholar] [CrossRef]
  11. Jabado, A.H.; Assoum, H.H.; Hammoud, A.; Meraim, K.A.; Sakout, A.; El Hassan, M. Review-Heat Transfer Inside Cavity Flows Trends. IOP Conf. Series Earth Environ. Sci. 2022, 1008, 012002. [Google Scholar] [CrossRef]
  12. Jabado, A.H.; El Hassan, M.; Assoum, H.H.; Hammoud, A.; Meraim, K.A.; Sakout, A. A review of cavity heat transfer under separated/reattached flow conditions. Energy Rep. 2021, 8, 949–956. [Google Scholar] [CrossRef]
  13. Charwat, A.; Roos, J.; Dewey, F., Jr.; Hitz, J. An investigation of separated flows-Part I: The pressure field. J. Aerosp. Sci. 1961, 28, 457–470. [Google Scholar] [CrossRef]
  14. Rossiter, J. The Effects of Cavities on the Buffeting of Aircraft. RAE Technical Memorandum No. Aero 754. 1962. Available online: https://www.semanticscholar.org/paper/The-effects-of-cavities-on-the-buffeting-of-Rossiter/6643bd3131210206868827364f0cb8cd5ecf40ae (accessed on 14 August 2024).
  15. East, L. Aerodynamically induced resonance in rectangular cavities. J. Sound Vib. 1966, 3, 277–287. [Google Scholar] [CrossRef]
  16. Plumblee, H.; Gibson, J.; Lassiter, L. A Theoretical and Experimental Investigation of the Acoustic Response of Cavities in an Aerodynamic Flow; Flight Dynamics Laboratory, Aeronautical Systems Division, Air Force Systems: Wright-Patterson AFB, OH, USA, 1962. [Google Scholar]
  17. Heller, H.; Holmes, D.; Covert, E. Flow-induced pressure oscillations in shallow cavities. J. Sound Vib. 1971, 18, 545–553. [Google Scholar] [CrossRef]
  18. Rockwell, D.; Naudascher, E. Review—Self-Sustaining Oscillations of Flow Past Cavities. J. Fluids Eng. 1978, 100, 152–165. [Google Scholar] [CrossRef]
  19. El Hassan, M.; Labraga, L.; Keirsbulck, L. Aero-Acoustic Oscillations inside Large Deep Cavities. 2007. Available online: https://espace.library.uq.edu.au/data/UQ_120829/Hassan_afmc_16_07.pdf?Expires=1723967529&Key-Pair-Id=APKAJKNBJ4MJBJNC6NLQ&Signature=GeOqc~Fgk-VhHIpIcKlbwYVBOvgOUEaGSVAleFBUb8Y-hXBY9EDHReUO8D0ifQH5lmgpI3XWPujvibc8P3MEtaHuogmkfxrP-jpntFHGom4bhc2bNeAxwFM9m2JUiJ9uDgQaA5-Hn6VOhvHcuYTgtvbe8nd4Ru2PbhMF-yJpGJalPybwbQRoVZVVcdVAUmS5tCSCW~wIcugfNJaMbczTxxPskxgJG0l~MOGl6dg6WclsKRGCDjG2xA0rkppW5jzK0NQbPpH0f0jVFvS1cd-k1vG4DvOT6Q5YQI80fPpGnkqAM1EDL9PJHCIn7QO5lvga3QvxRVZ9KaddBKiy2NeRQA__ (accessed on 15 August 2024).
  20. El Hassan, M.; Keirsbulck, L.; Labraga, L. Non-oscillating/Oscillating Shear Layer over a Large Deep Cavity at Low-Subsonic Speeds. Flow, Turbul. Combust. 2008, 82, 359–374. [Google Scholar] [CrossRef]
  21. El Hassan, M.; Keirsbulck, L.; Labraga, L. Aero-Acoustic Coupling Inside Large Deep Cavities at Low-Subsonic Speeds. J. Fluids Eng. 2008, 131, 011204. [Google Scholar] [CrossRef]
  22. Sinha, J.; Arora, K. Review of the flow-field analysis over cavities. In Proceedings of the 2017 International Conference on Infocom Technologies and Unmanned Systems (Trends and Future Directions) (ICTUS), Dubai, United Arab Emirates, 18–20 December 2017; pp. 870–876. [Google Scholar]
  23. Sarohia, V. Experimental investigation of oscillations in flows over shallow cavities. AIAA J. 1977, 15, 984–991. [Google Scholar] [CrossRef]
  24. Rossiter, J. Wind-Tunnel Experiments on the Flow over Rectangular Cavities at Subsonic and Transonic Speeds; Cranfield University: Bedford, UK, 1964. [Google Scholar]
  25. Lawson, S.; Barakos, G. Review of numerical simulations for high-speed, turbulent cavity flows. Prog. Aerosp. Sci. 2011, 47, 186–216. [Google Scholar] [CrossRef]
  26. Vikramaditya, N.; Kurian, J. Pressure oscillations from cavities with ramp. AIAA J. 2009, 47, 2974–2984. [Google Scholar] [CrossRef]
  27. Kok, J.C.; Soemarwoto, B.I.; van der Ven, H. X-LES simulations using a high-order finite-volume scheme. Notes Numer. Fluid Mech. Multidiscip. Des. 2008, 97, 87. [Google Scholar]
  28. El Hassan, M.; Keirsbulck, L. Passive control of deep cavity shear layer flow at subsonic speed. Can. J. Phys. 2017, 95, 894–899. [Google Scholar] [CrossRef]
  29. El Hassan, M.; Keirsbulck, L.; Labraga, L.; Lippert, M. Control of deep cavity tones using a spanwise cylinder at low-subsonic speeds. HEFAT 2008, 2008, 5. [Google Scholar]
  30. Cattafesta, L.N., III; Song, Q.; Williams, D.R.; Rowley, C.W.; Alvi, F.S. Active control of flow-induced cavity oscillations. Prog. Aerosp. Sci. 2008, 44, 479–502. [Google Scholar] [CrossRef]
  31. Stanek, M.; Ross, J.; Odedra, J.; Peto, J. High Frequency Acoustic Suppression-The Mystery of the Rod-in-Crossflow Revealed. In Proceedings of the 41st Aerospace Sciences Meeting and Exhibit, Reno, NV, USA, 6–9 January 2003. [Google Scholar]
  32. Stanek, M.; Raman, G.; Kibens, V.; Ross, J.; Odedra, J.; Peto, J. Control of cavity resonance through very high frequency forcing. In Proceedings of the 6th Aeroacoustics Conference and Exhibit, Hartford, CT, USA, 4–6 June 1980. [Google Scholar]
  33. Stanek, M.; Raman, G.; Ross, J.; Odedra, J.; Peto, J.; Alvi, F.; Kibens, V. High Frequency Acoustic Suppression—The Role of Mass Flow & The Notion of Superposition. In Proceedings of the 8th AIAA/CEAS Aeroacoustics Conference & Exhibit, Breckenridge, CO, USA, 17–19 June 2002. [Google Scholar]
  34. Shaw, L.; Clark, R.; Talmadge, D. F-111 generic weapons bay acoustic environment. J. Aircr. 1988, 25, 147–153. [Google Scholar] [CrossRef]
  35. Lumley, J.L. The structure of inhomogeneous turbulent flows. Atmos. Turbul. Radio Wave Propag. 1967, 166–178. [Google Scholar]
  36. Weiss, J. A Tutorial on the proper orthogonal decomposition. In Proceedings of the AIAA Aviation 2019 Forum, Dallas, TX, USA, 17–21 June 2019. [Google Scholar]
  37. Berkooz, G.; Holmes, P.; Lumley, J.L. The proper orthogonal decomposition in the analysis of turbulent flows. Annu. Rev. Fluid Mech. 1993, 25, 539–575. [Google Scholar] [CrossRef]
  38. Ribau, M.; Gonçalves, N.D.; Ferrás, L.L.; Afonso, A.M. Flow Structures Identification through Proper Orthogonal Decompo-sition: The Flow around Two Distinct Cylinders. Fluids 2021, 6, 384. [Google Scholar] [CrossRef]
  39. Delville, J. Characterization of the organization in shear layers via the Proper Orthogonal Decomposition. Flow, Turbul. Combust. 1994, 53, 263–281. [Google Scholar] [CrossRef]
  40. Hamdi, J.; Assoum, H.; Abed-Meraïm, K.; Sakout, A. Volume reconstruction of an impinging jet obtained from stereoscopic-PIV data using POD. Eur. J. Mech.-B/Fluids 2018, 67, 433–445. [Google Scholar] [CrossRef]
  41. Podvin, B.; Fraigneau, Y.; Lusseyran, F.; Gougat, P. A Reconstruction Method for the Flow Past an Open Cavity. J. Fluids Eng. 2005, 128, 531–540. [Google Scholar] [CrossRef]
  42. Rowley, C.; Colonius, T.; Murray, R. POD based models of self-sustained oscillations in the flow past an open cavity. In Proceedings of the 6th Aeroacoustics Conference and Exhibit, Hartford, CT, USA, 4–6 June 1980. [Google Scholar]
  43. Lawson, S.; Barakos, G.; Simpson, A. Understanding cavity flows using proper orthogonal decomposition and signal pro-cessing. J. Algorithms Comput. Technol. 2010, 4, 47–69. [Google Scholar] [CrossRef]
  44. Westerweel, J. Digital Particle Image Velocimetry; Delft University Press: Delft, The Netherlands, 1993. [Google Scholar]
  45. Prasad, A.; Adrian, R.; Landreth, C.; Offutt, P. Effect of resolution on the speed and accuracy of particle image ve-locimetry interrogation. Exp. Fluids 1992, 13, 105–116. [Google Scholar] [CrossRef]
  46. Raffel, M.; Willert, C.E.; Kompenhans, J. Particle Image Velocimetry: A Practical Guide; SPIE Optical Engineering Press: Bellingham, WA, USA, 1998. [Google Scholar]
  47. Illy, H.; Geffroy, P.; Jacquin, L. Control of cavity flow by means of a spanwise cylinder. In Proceedings of the 21th International Congress of Theoretical and Applied Mechanics, IUTAM, Warsaw, Poland, 15–21 August 2004. [Google Scholar]
  48. Illy, H.; Geffroy, P.; et Jacquin, L. Contrôle des oscillations de cavité au moyen d’un cylinder placé transversalement l’écoulement. In Proceedings of the 17me Congrès Français de mécanique, Troyes, France, 29 August–2 September 2005. [Google Scholar]
  49. Jeong, J.; Hussain, F. On the identification of a vortex. J. Fluid Mech. 1995, 285, 69–94. [Google Scholar] [CrossRef]
Figure 1. Experimental configuration: (a) rectangular cavity; (b) control device (profiled cylinder).
Fluids 09 00187 g001
Figure 2. Spectrum of the sound pressure level (SPL) and that of normalized velocity without control.
Fluids 09 00187 g002
Figure 3. Spectrum of (a) the sound pressure level (SPL) and (b) the normalized velocity for different configurations.
Fluids 09 00187 g003
Figure 4. Mean longitudinal velocity distribution: (a) without control; (b) with cylinder; (c) with profiled cylinder.
Fluids 09 00187 g004
Figure 5. Vorticity magnitude: (a) without control; (b) with cylinder; (c) with profiled cylinder.
Fluids 09 00187 g005
Figure 6. Normalized total kinetic energy: (a) without control; (b) with cylinder; (c) with profiled cylinder.
Fluids 09 00187 g006
Figure 7. Turbulent structures using Lambda-2 criterion: (a) without control; (b) with cylinder; (c) with profiled cylinder.
Fluids 09 00187 g007
Figure 8. Cross correlation maps: (a) without control; (b) with cylinder; (c) with profiled cylinder.
Fluids 09 00187 g008aFluids 09 00187 g008b
Figure 9. Energy portion and cumulative energy of the POD modes for the longitudinal velocity (U).
Fluids 09 00187 g009
Figure 10. POD spatial modes: (a) without control; (b) with cylinder; (c) with profiled cylinder.
Fluids 09 00187 g010aFluids 09 00187 g010b
Disclaimer/Publisher’s Note: The statements, opinions and data contained in all publications are solely those of the individual author(s) and contributor(s) and not of MDPI and/or the editor(s). MDPI and/or the editor(s) disclaim responsibility for any injury to people or property resulting from any ideas, methods, instructions or products referred to in the content.

