
MiR-4646-5p Acts as a Tumor-Suppressive Factor in Triple Negative Breast Cancer and Targets the Cholesterol Transport Protein GRAMD1B

 , , , ,
  and
and 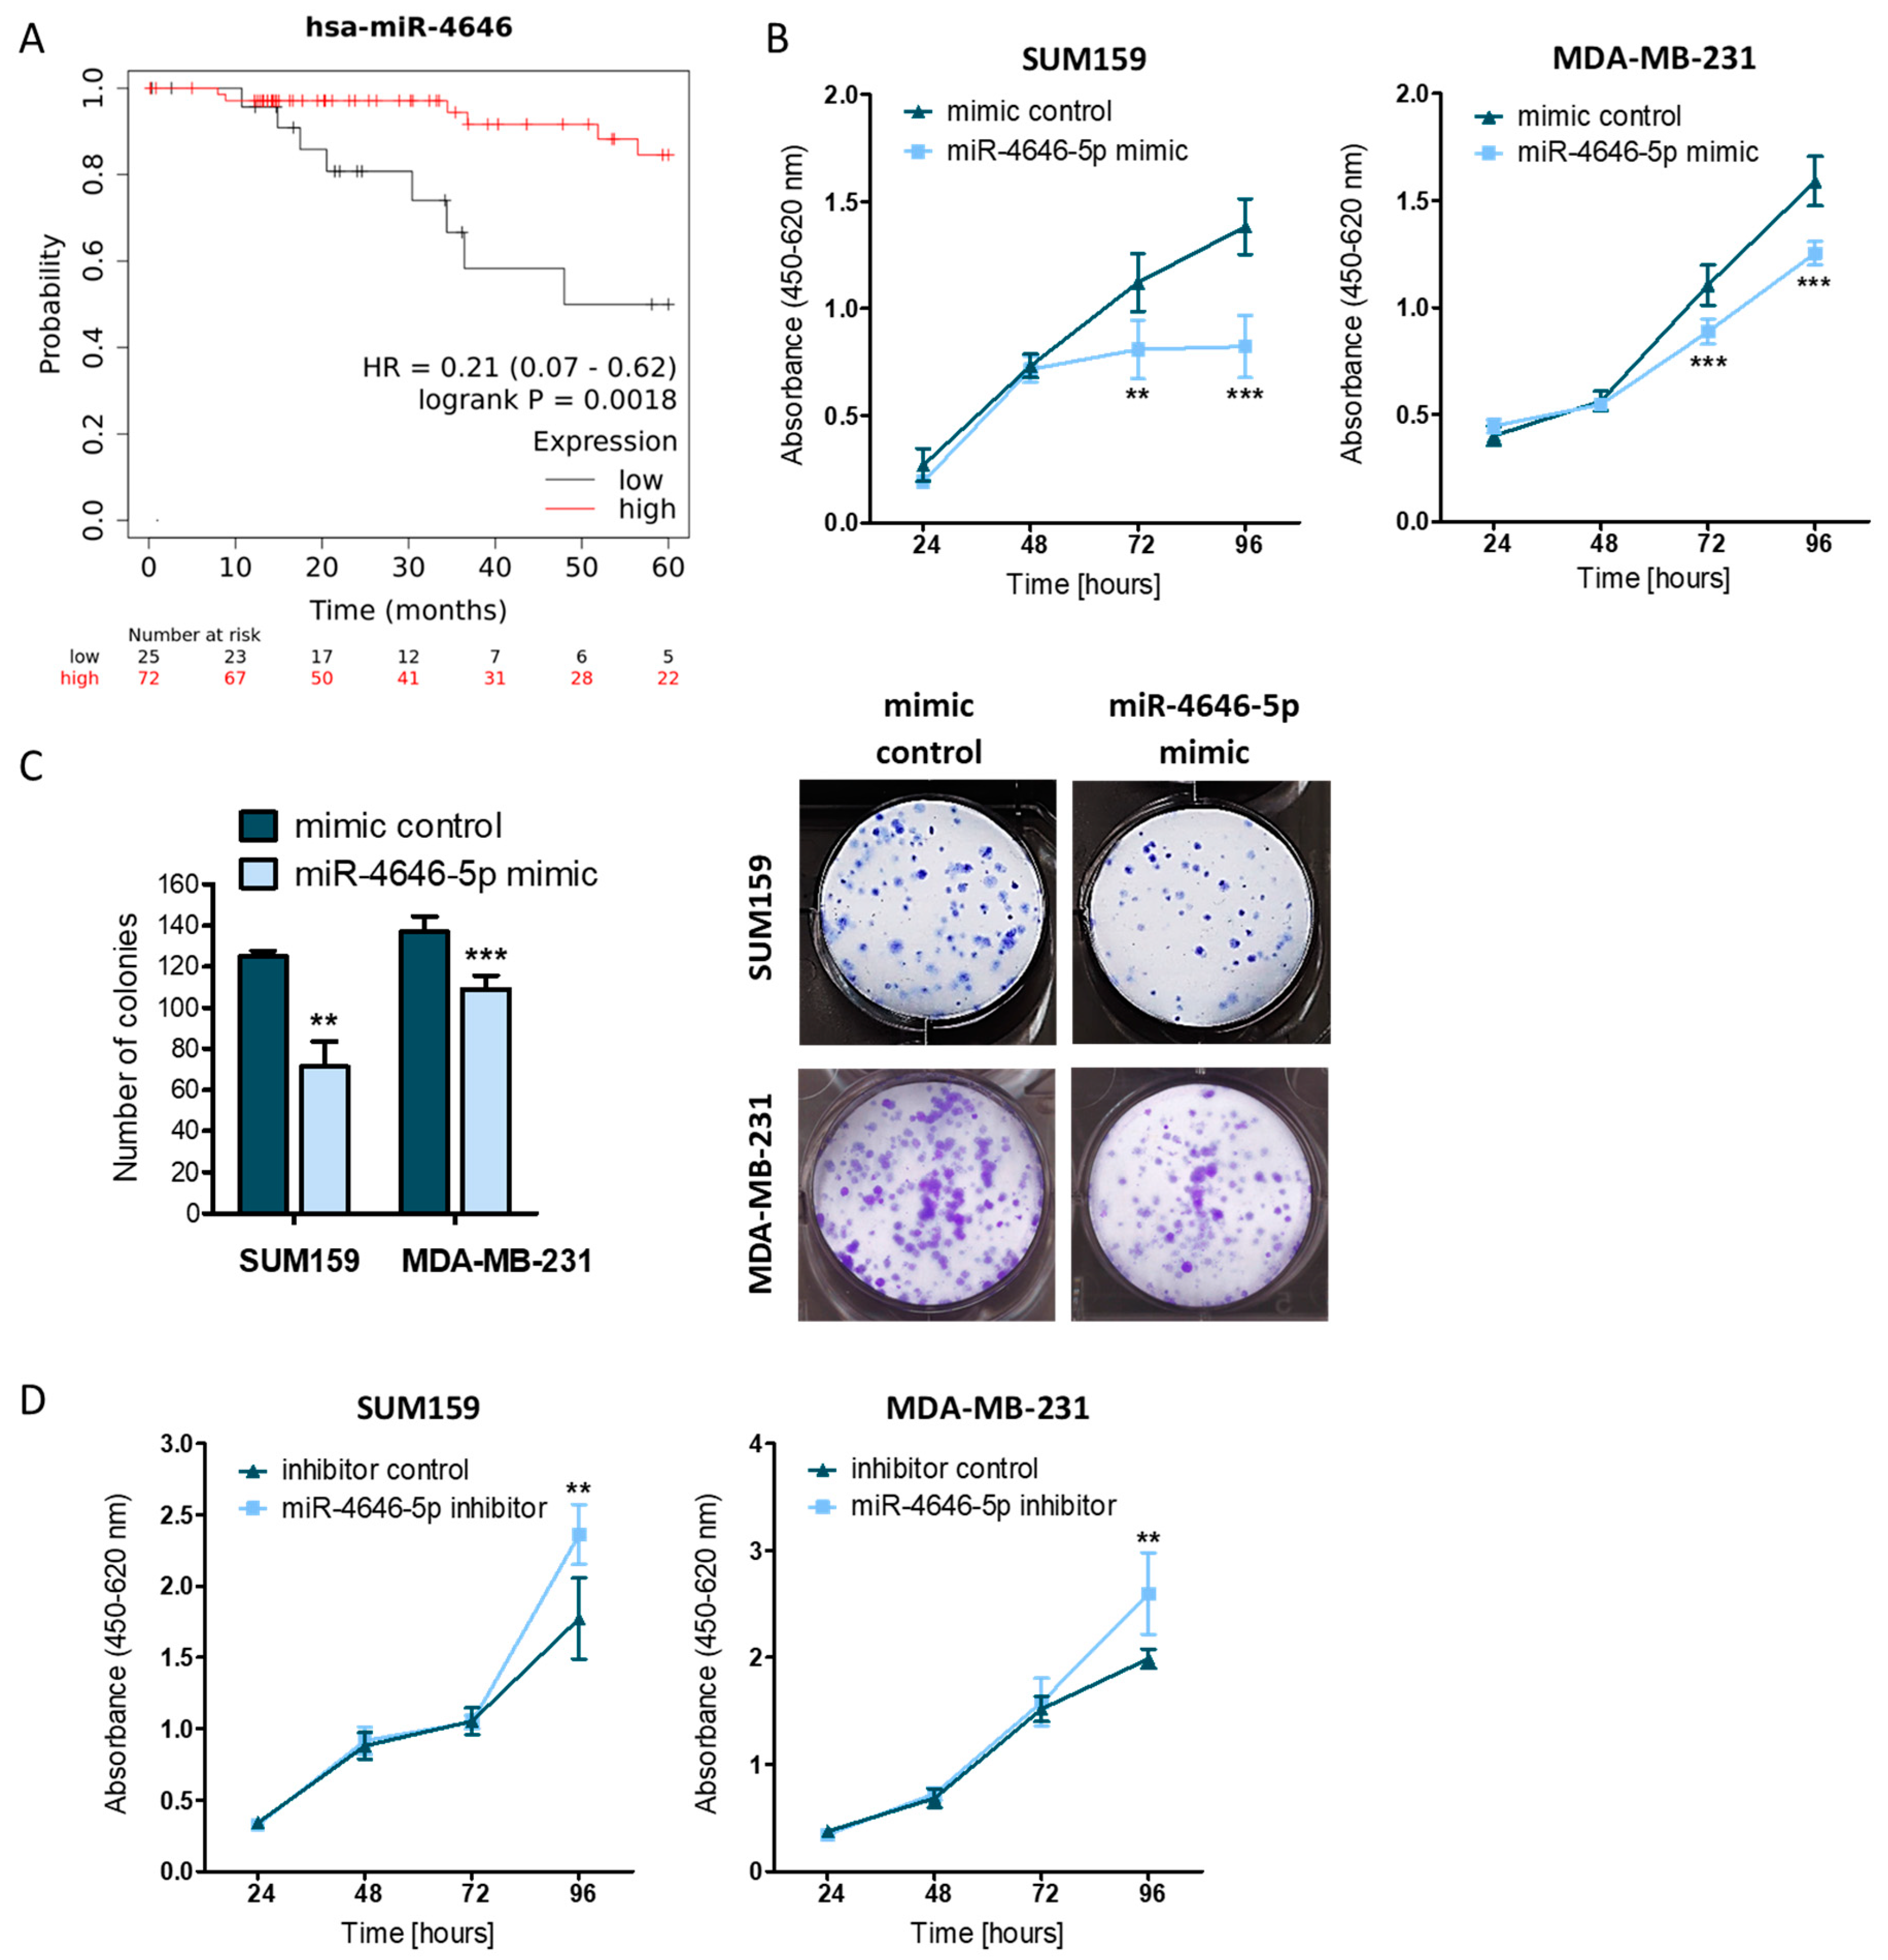
Abstract
1. Introduction
2. Results
2.1. MiR-4646-5p Levels Are Associated with Survival in TNBC Patients, and Ectopic miR-4646-5p Overexpression Reduces Growth and Proliferation, and Induces Apoptosis in TNBC Cells
2.2. MiR-4646-5p Reduces the Migration of TNBC Cells
2.3. MiR-4646-5p Reduces In Vitro Tube Formation of Endothelial Cells
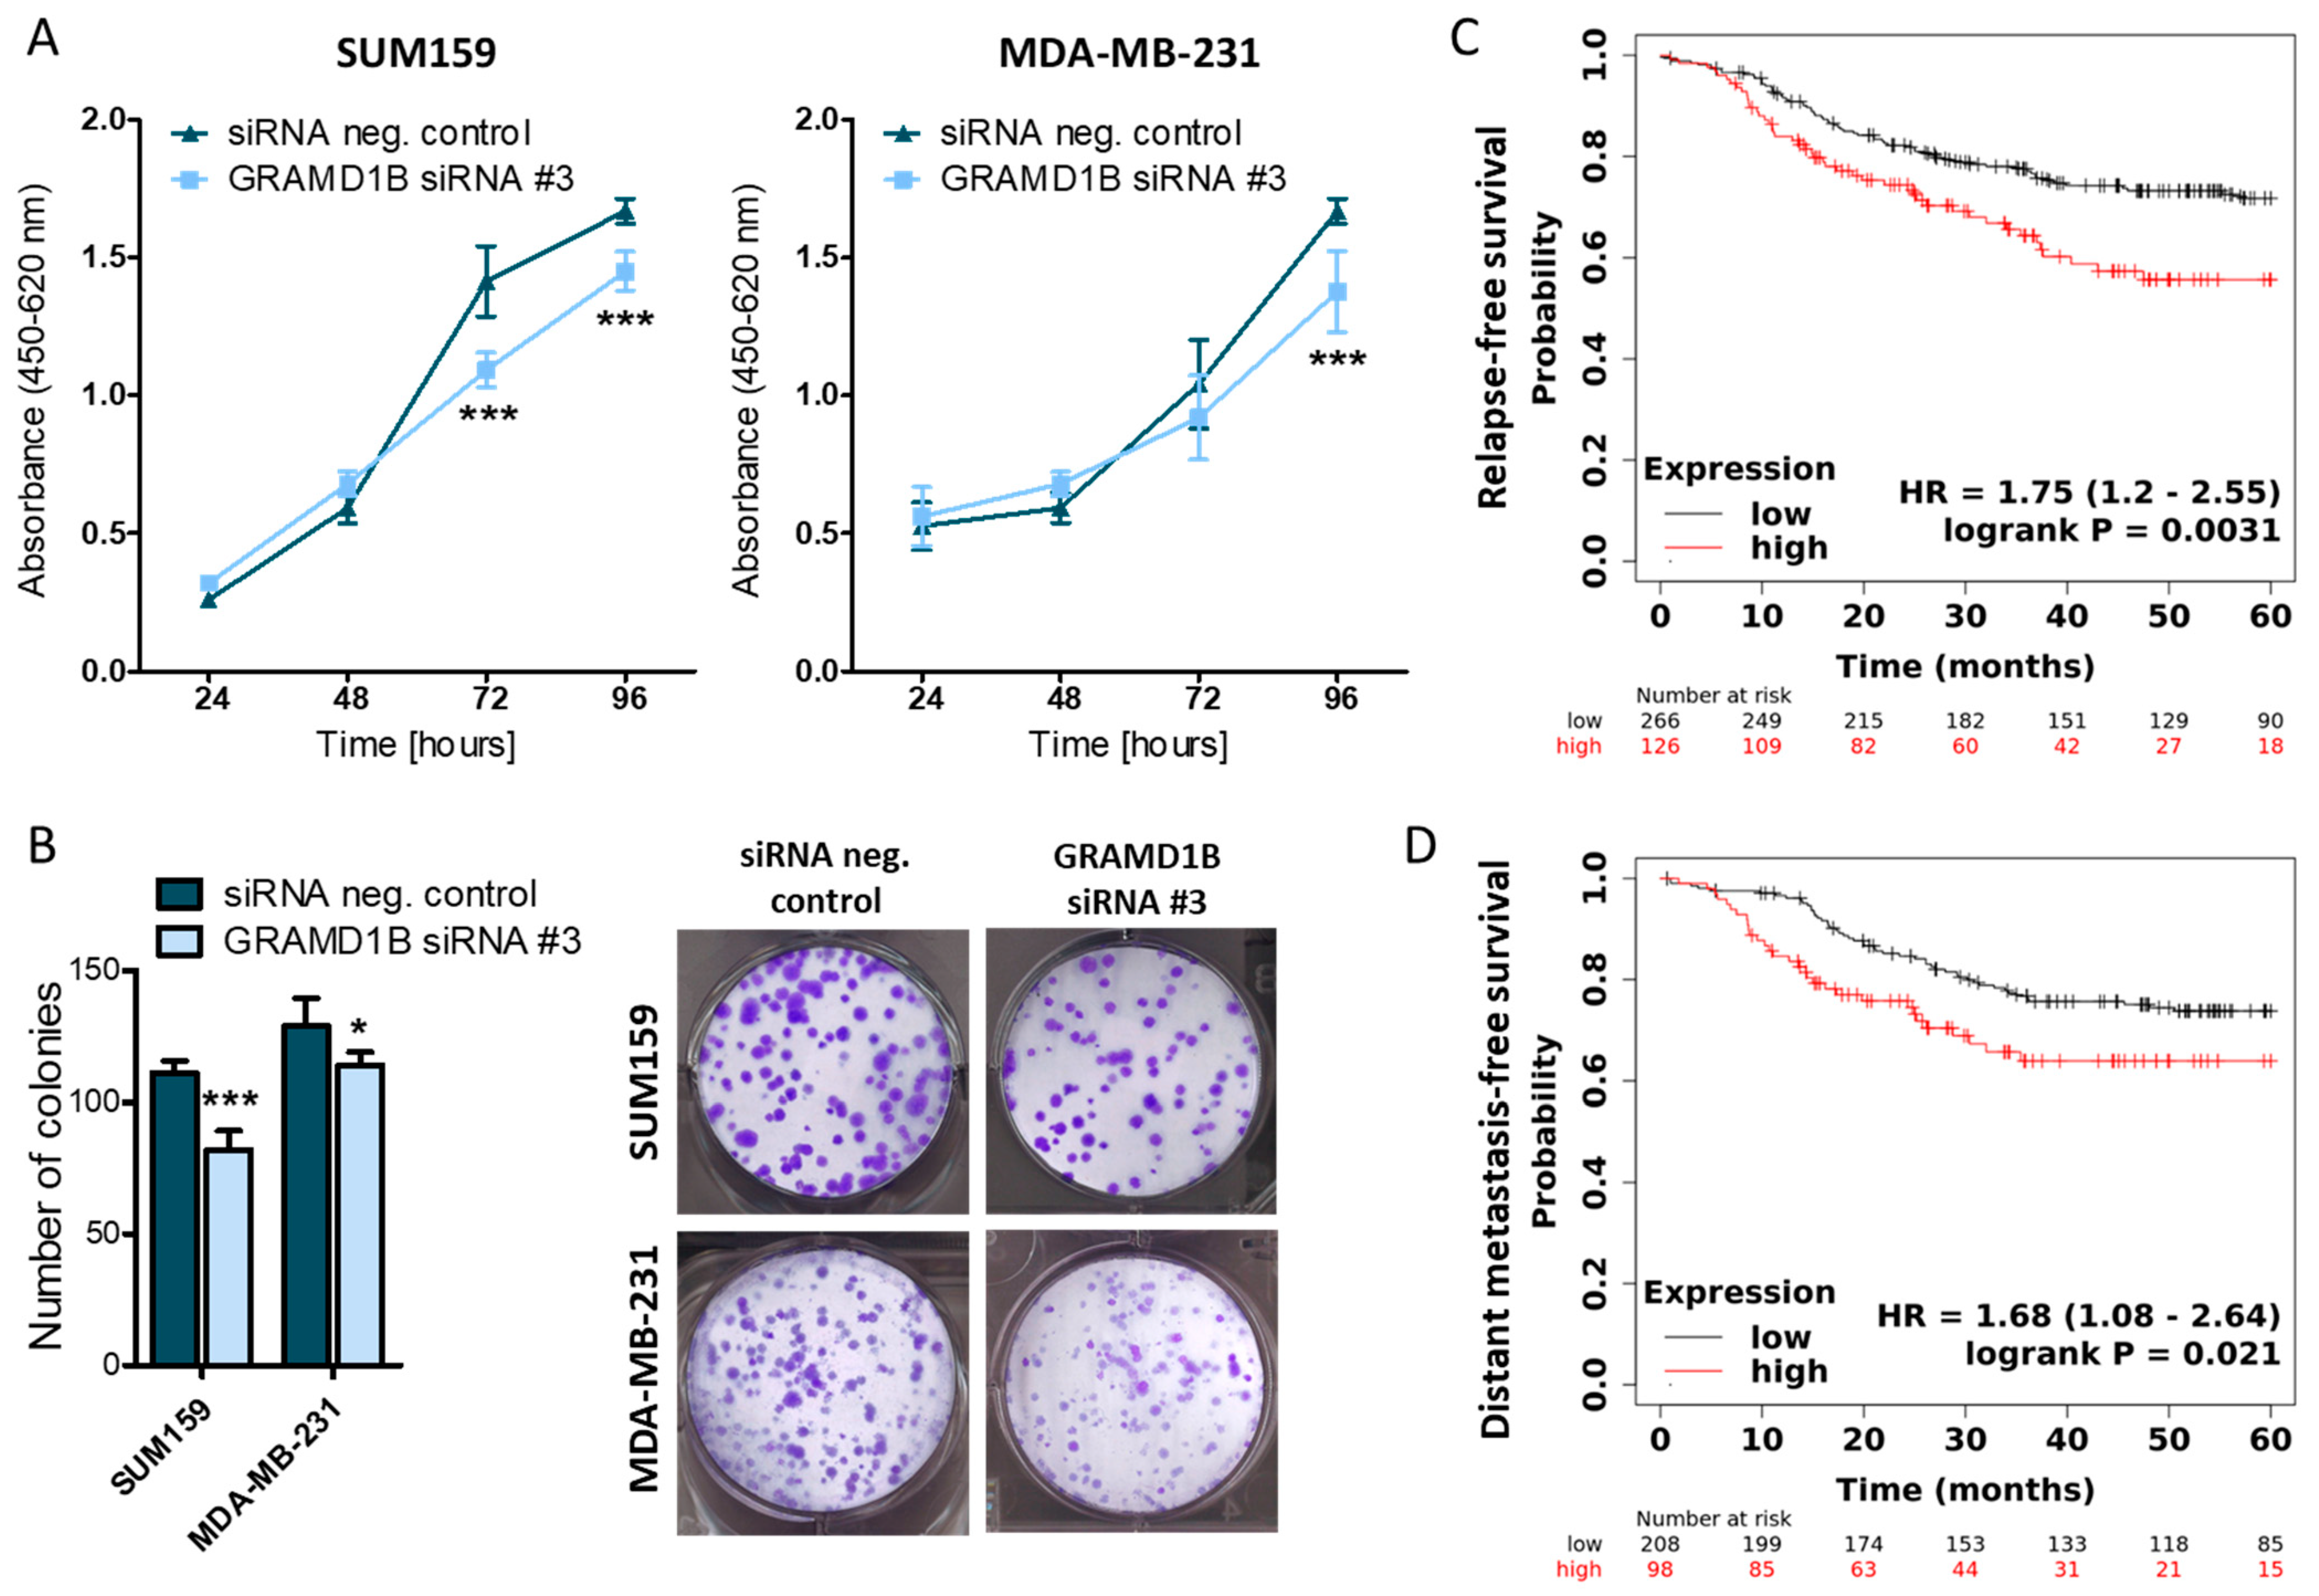
2.4. GRAM Domain-Containing Protein 1B (GRAMD1B) Is a Direct Target of miR-4646-5p and Affects the Growth of TNBC Cells
2.5. MiR-4646-5p Has Pathway-Spanning Effects on Cholesterol Biosynthesis and Cytokine Signaling in TNBC Cells
3. Discussion
4. Materials and Methods
4.1. In Silico Analysis and Patient Cohorts
4.2. Cell Lines and Cell Culture Conditions
4.3. Transient miR-4646-5p Mimic/Inhibitor Transfection and Transient GRAMD1B Knockdown
4.4. Generation of Stable SUM159 miR-4646-5p Inhibitor Cells by Lentiviral Transduction
4.5. RNA Isolation and cDNA Synthesis
4.6. Quantitative RT-PCR (RT-qPCR)
4.7. WST-1 Cell Growth Assay
4.8. Colony Formation Assay
4.9. EdU Proliferation Assay
4.10. Caspase-3/7 and Caspase-9 Activity Assay
4.11. Protein Extraction and Western Blotting
4.12. Scratch Assay
4.13. Transwell Migration Assay
4.14. Tube Formation Assay
4.15. Transcriptome Analysis and Identification of Potential miR-4646-5p Targets
4.16. Dual Luciferase Reporter Assay
4.17. G-CSF and IL-6 ELISA
4.18. Statistical Analysis
5. Conclusions
Supplementary Materials
Author Contributions
Funding
Institutional Review Board Statement
Informed Consent Statement
Data Availability Statement
Acknowledgments
Conflicts of Interest
References
- Visvader, J.E. Keeping abreast of the mammary epithelial hierarchy and breast tumorigenesis. Genes Dev. 2009, 23, 2563–2577. [Google Scholar] [CrossRef] [PubMed]
- Yin, L.; Duan, J.-J.; Bian, X.-W.; Yu, S. Triple-negative breast cancer molecular subtyping and treatment progress. Breast Cancer Res. 2020, 22, 61. [Google Scholar] [CrossRef] [PubMed]
- Johnson, J.M.; Edwards, S.; Shoemaker, D.; Schadt, E.E. Dark matter in the genome: Evidence of widespread transcription detected by microarray tiling experiments. Trends Genet. 2005, 21, 93–102. [Google Scholar] [CrossRef] [PubMed]
- Mattick, J.S.; Makunin, I.V. Non-coding RNA. Hum. Mol. Genet. 2006, 15, R17–R29. [Google Scholar] [CrossRef] [PubMed]
- Ling, H.; Vincent, K.; Pichler, M.; Fodde, R.; Berindan-Neagoe, I.; Slack, F.J.; Calin, G.A. Junk DNA and the long non-coding RNA twist in cancer genetics. Oncogene 2015, 34, 5003–5011. [Google Scholar] [CrossRef]
- Lagos-Quintana, M.; Rauhut, R.; Lendeckel, W.; Tuschl, T. Identification of Novel Genes Coding for Small Expressed RNAs. Science 2001, 294, 853–858. [Google Scholar] [CrossRef]
- Bartel, D.P. MicroRNAs. Cell 2004, 116, 281–297. [Google Scholar] [CrossRef]
- Lee, Y. MicroRNA maturation: Stepwise processing and subcellular localization. EMBO J. 2002, 21, 4663–4670. [Google Scholar] [CrossRef]
- Lee, Y.; Ahn, C.; Han, J.; Choi, H.; Kim, J.; Yim, J.; Lee, J.; Provost, P.; Rådmark, O.; Kim, S.; et al. The nuclear RNase III Drosha initiates microRNA processing. Nature 2003, 425, 415–419. [Google Scholar] [CrossRef]
- Cullen, B.R. Transcription and Processing of Human microRNA Precursors. Mol. Cell 2004, 16, 861–865. [Google Scholar] [CrossRef]
- Hutvágner, G.; McLachlan, J.; Pasquinelli, A.E.; Bálint, É.; Tuschl, T.; Zamore, P.D. A Cellular Function for the RNA-Interference Enzyme Dicer in the Maturation of the let-7 Small Temporal RNA. Science 2001, 293, 834–838. [Google Scholar] [CrossRef] [PubMed]
- Hammond, S.M.; Bernstein, E.; Beach, D.; Hannon, G.J. An RNA-directed nuclease mediates post-transcriptional gene silencing in Drosophila cells. Nature 2000, 404, 293–296. [Google Scholar] [CrossRef] [PubMed]
- Gregory, R.I.; Chendrimada, T.P.; Cooch, N.; Shiekhattar, R. Human RISC Couples MicroRNA Biogenesis and Posttranscriptional Gene Silencing. Cell 2005, 123, 631–640. [Google Scholar] [CrossRef]
- Ruby, J.G.; Jan, C.H.; Bartel, D.P. Intronic microRNA precursors that bypass Drosha processing. Nature 2007, 448, 83–86. [Google Scholar] [CrossRef] [PubMed]
- Kohlhapp, F.J.; Mitra, A.K.; Lengyel, E.; Peter, M.E. MicroRNAs as mediators and communicators between cancer cells and the tumor microenvironment. Oncogene 2015, 34, 5857–5868. [Google Scholar] [CrossRef] [PubMed]
- Rupaimoole, R.; Calin, G.A.; Lopez-Berestein, G.; Sood, A.K. miRNA Deregulation in Cancer Cells and the Tumor Microenvironment. Cancer Discov. 2016, 6, 235–246. [Google Scholar] [CrossRef] [PubMed]
- Loh, H.-Y.; Norman, B.P.; Lai, K.-S.; Rahman, N.M.A.N.A.; Alitheen, N.B.M.; Osman, M.A. The Regulatory Role of MicroRNAs in Breast Cancer. Int. J. Mol. Sci. 2019, 20, 4940. [Google Scholar] [CrossRef]
- Dragomir, M.P.; Knutsen, E.; Calin, G.A. Classical and noncanonical functions of miRNAs in cancers. Trends Genet. 2022, 38, 379–394. [Google Scholar] [CrossRef]
- Schwarzenbacher, D.; Klec, C.; Pasculli, B.; Cerk, S.; Rinner, B.; Karbiener, M.; Ivan, C.; Barbano, R.; Ling, H.; Wulf-Goldenberg, A.; et al. MiR-1287-5p inhibits triple negative breast cancer growth by interaction with phosphoinositide 3-kinase CB, thereby sensitizing cells for PI3Kinase inhibitors. Breast Cancer Res. 2019, 21, 20. [Google Scholar] [CrossRef]
- Song, Y.; Zeng, S.; Zheng, G.; Chen, D.; Li, P.; Yang, M.; Luo, K.; Yin, J.; Gu, Y.; Zhang, Z.; et al. FOXO3a-driven miRNA signatures suppresses VEGF-A/NRP1 signaling and breast cancer metastasis. Oncogene 2021, 40, 777–790. [Google Scholar] [CrossRef]
- Zeng, F.; Yao, M.; Wang, Y.; Zheng, W.; Liu, S.; Hou, Z.; Cheng, X.; Sun, S.; Li, T.; Zhao, H.; et al. Fatty acid β-oxidation promotes breast cancer stemness and metastasis via the miRNA-328-3p-CPT1A pathway. Cancer Gene Ther. 2022, 29, 383–395. [Google Scholar] [CrossRef] [PubMed]
- Surapaneni, S.K.; Bhat, Z.R.; Tikoo, K. MicroRNA-941 regulates the proliferation of breast cancer cells by altering histone H3 Ser 10 phosphorylation. Sci. Rep. 2020, 10, 17954. [Google Scholar] [CrossRef] [PubMed]
- Kim, Y.; Ko, J.Y.; Lee, S.-B.; Oh, S.; Park, J.W.; Kang, H.-G.; Kim, D.-H.; Chung, D.; Lim, S.; Kong, H.; et al. Reduced miR-371b-5p expression drives tumor progression via CSDE1/RAC1 regulation in triple-negative breast cancer. Oncogene 2022, 41, 3151–3161. [Google Scholar] [CrossRef] [PubMed]
- Kashyap, D.; Kaur, H. Cell-free miRNAs as non-invasive biomarkers in breast cancer: Significance in early diagnosis and metastasis prediction. Life Sci. 2020, 246, 117417. [Google Scholar] [CrossRef] [PubMed]
- Kara, G.; Arun, B.; Calin, G.A.; Ozpolat, B. miRacle of microRNA-Driven Cancer Nanotherapeutics. Cancers 2022, 14, 3818. [Google Scholar] [CrossRef] [PubMed]
- Ho, P.T.B.; Clark, I.M.; Le, L.T.T. MicroRNA-Based Diagnosis and Therapy. Int. J. Mol. Sci. 2022, 23, 7167. [Google Scholar] [CrossRef] [PubMed]
- Pichler, M.; Calin, G.A. MicroRNAs in cancer: From developmental genes in worms to their clinical application in patients. Br. J. Cancer 2015, 113, 569–573. [Google Scholar] [CrossRef] [PubMed]
- Dontu, G.; Abdallah, W.M.; Foley, J.M.; Jackson, K.W.; Clarke, M.F.; Kawamura, M.J.; Wicha, M.S. In vitro propagation and transcriptional profiling of human mammary stem/progenitor cells. Genes Dev. 2003, 17, 1253–1270. [Google Scholar] [CrossRef]
- He, L.; Wick, N.; Germans, S.K.; Peng, Y. The Role of Breast Cancer Stem Cells in Chemoresistance and Metastasis in Triple-Negative Breast Cancer. Cancers 2021, 13, 6209. [Google Scholar] [CrossRef]
- Yang, L.; Hou, Y.; Du, Y.; Li, Q.; Zhou, F.; Li, Y.; Zeng, H.; Jin, T.; Wan, X.; Guan, S.; et al. Mirtronic miR-4646-5p promotes gastric cancer metastasis by regulating ABHD16A and metabolite lysophosphatidylserines. Cell Death Differ. 2021, 28, 2708–2727. [Google Scholar] [CrossRef]
- Lánczky, A.; Nagy, Á.; Bottai, G.; Munkácsy, G.; Szabó, A.; Santarpia, L.; Győrffy, B. miRpower: A web-tool to validate survival-associated miRNAs utilizing expression data from 2178 breast cancer patients. Breast Cancer Res. Treat. 2016, 160, 439–446. [Google Scholar] [CrossRef]
- Torres, A.G.; Fabani, M.M.; Vigorito, E.; Gait, M.J. MicroRNA fate upon targeting with anti-miRNA oligonucleotides as revealed by an improved Northern-blot-based method for miRNA detection. RNA 2011, 17, 933–943. [Google Scholar] [CrossRef] [PubMed]
- Svoronos, A.A.; Engelman, D.M.; Slack, F.J. OncomiR or Tumor Suppressor? The Duplicity of MicroRNAs in Cancer. Cancer Res. 2016, 76, 3666–3670. [Google Scholar] [CrossRef] [PubMed]
- Friedl, P.; Wolf, K. Tumour-cell invasion and migration: Diversity and escape mechanisms. Nat. Rev. Cancer 2003, 3, 362–374. [Google Scholar] [CrossRef] [PubMed]
- Chambers, A.F.; Groom, A.C.; MacDonald, I.C. Dissemination and growth of cancer cells in metastatic sites. Nat. Rev. Cancer 2002, 2, 563–572. [Google Scholar] [CrossRef] [PubMed]
- Banerjee, S.; Dowsett, M.; Ashworth, A.; Martin, L.-A. Mechanisms of Disease: Angiogenesis and the management of breast cancer. Nat. Clin. Pract. Oncol. 2007, 4, 536–550. [Google Scholar] [CrossRef] [PubMed]
- Hussen, B.M.; Salihi, A.; Abdullah, S.T.; Rasul, M.F.; Hidayat, H.J.; Hajiesmaeili, M.; Ghafouri-Fard, S. Signaling pathways modulated by miRNAs in breast cancer angiogenesis and new therapeutics. Pathol.-Res. Pract. 2022, 230, 153764. [Google Scholar] [CrossRef]
- Agarwal, V.; Bell, G.W.; Nam, J.-W.; Bartel, D.P. Predicting effective microRNA target sites in mammalian mRNAs. eLife 2015, 4, e05005. [Google Scholar] [CrossRef] [PubMed]
- Dweep, H.; Gretz, N. miRWalk2.0: A comprehensive atlas of microRNA-target interactions. Nat. Methods 2015, 12, 697. [Google Scholar] [CrossRef]
- Chen, Y.; Wang, X. miRDB: An online database for prediction of functional microRNA targets. Nucleic Acids Res. 2020, 48, D127–D131. [Google Scholar] [CrossRef]
- Gatta, A.T.; Wong, L.H.; Sere, Y.Y.; Calderón-Noreña, D.M.; Cockcroft, S.; Menon, A.K.; Levine, T.P. A new family of StART domain proteins at membrane contact sites has a role in ER-PM sterol transport. eLife 2015, 4, e07253. [Google Scholar] [CrossRef] [PubMed]
- Ercan, B.; Naito, T.; Koh, D.H.Z.; Dharmawan, D.; Saheki, Y. Molecular basis of accessible plasma membrane cholesterol recognition by the GRAM domain of GRAMD1b. EMBO J. 2021, 40, e106524. [Google Scholar] [CrossRef] [PubMed]
- Khanna, P.; Chua, P.J.; Wong, B.S.E.; Yin, C.; Thike, A.A.; Wan, W.K.; Tan, P.H.; Baeg, G.H. GRAM domain-containing protein 1B (GRAMD1B), a novel component of the JAK/STAT signaling pathway, functions in gastric carcinogenesis. Oncotarget 2017, 8, 115370–115383. [Google Scholar] [CrossRef] [PubMed]
- Khanna, P.; Lee, J.S.; Sereemaspun, A.; Lee, H.; Baeg, G.H. GRAMD1B regulates cell migration in breast cancer cells through JAK/STAT and Akt signaling. Sci. Rep. 2018, 8, 9511. [Google Scholar] [CrossRef] [PubMed]
- Győrffy, B. Survival analysis across the entire transcriptome identifies biomarkers with the highest prognostic power in breast cancer. Comput. Struct. Biotechnol. J. 2021, 19, 4101–4109. [Google Scholar] [CrossRef]
- Anastasiadou, E.; Jacob, L.S.; Slack, F.J. Non-coding RNA networks in cancer. Nat. Rev. Cancer 2018, 18, 5–18. [Google Scholar] [CrossRef]
- Zhao, C.L.; Zhang, G.P.; Xiao, Z.Z.; Ma, Z.K.; Lei, C.P.; Song, S.Y.; Feng, Y.Y.; Zhao, Y.C.; Feng, X.S. Recombinant Human Granulocyte Colony-Stimulating Factor Promotes Preinvasive and Invasive Estrogen Receptor-Positive Tumor Development in MMTV-erbB2 Mice. J. Breast Cancer 2015, 18, 126. [Google Scholar] [CrossRef] [PubMed][Green Version]
- Waight, J.D.; Hu, Q.; Miller, A.; Liu, S.; Abrams, S.I. Tumo-Derived G-CSF Facilitates Neoplastic Growth through a Granulocytic Myeloid-Derived Suppressor Cell-Dependent Mechanism. PLoS ONE 2011, 6, e27690. [Google Scholar] [CrossRef]
- Hollmén, M.; Karaman, S.; Schwager, S.; Lisibach, A.; Christiansen, A.J.; Maksimow, M.; Varga, Z.; Jalkanen, S.; Detmar, M. G-CSF regulates macrophage phenotype and associates with poor overall survival in human triple-negative breast cancer. OncoImmunology 2016, 5, e1115177. [Google Scholar] [CrossRef]
- Masjedi, A.; Hashemi, V.; Hojjat-Farsangi, M.; Ghalamfarsa, G.; Azizi, G.; Yousefi, M.; Jadidi-Niaragh, F. The significant role of interleukin-6 and its signaling pathway in the immunopathogenesis and treatment of breast cancer. Biomed. Pharmacother. 2018, 108, 1415–1424. [Google Scholar] [CrossRef]
- Korkaya, H.; Kim, G.; Davis, A.; Malik, F.; Henry, N.L.; Ithimakin, S.; Quraishi, A.A.; Tawakkol, N.; D’Angelo, R.; Paulson, A.K.; et al. Activation of an IL6 Inflammatory Loop Mediates Trastuzumab Resistance in HER2+ Breast Cancer by Expanding the Cancer Stem Cell Population. Mol. Cell 2012, 47, 570–584. [Google Scholar] [CrossRef]
- Johnson, D.E.; O’Keefe, R.A.; Grandis, J.R. Targeting the IL-6/JAK/STAT3 signalling axis in cancer. Nat. Rev. Clin. Oncol. 2018, 15, 234–248. [Google Scholar] [CrossRef] [PubMed]
- Erhard, F.; Haas, J.; Lieber, D.; Malterer, G.; Jaskiewicz, L.; Zavolan, M.; Dölken, L.; Zimmer, R. Widespread context dependency of microRNA-mediated regulation. Genome Res. 2014, 24, 906–919. [Google Scholar] [CrossRef] [PubMed]
- Hollestelle, A.; Nagel, J.H.A.; Smid, M.; Lam, S.; Elstrodt, F.; Wasielewski, M.; Ng, S.S.; French, P.J.; Peeters, J.K.; Rozendaal, M.J.; et al. Distinct gene mutation profiles among luminal-type and basal-type breast cancer cell lines. Breast Cancer Res. Treat. 2010, 121, 53–64. [Google Scholar] [CrossRef] [PubMed]
- Hodge, R.G.; Ridley, A.J. Regulating Rho GTPases and their regulators. Nat. Rev. Mol. Cell Biol. 2016, 17, 496–510. [Google Scholar] [CrossRef]
- Clayton, N.S.; Ridley, A.J. Targeting Rho GTPase Signaling Networks in Cancer. Front. Cell Dev. Biol. 2020, 8, 222. [Google Scholar] [CrossRef]
- Han, Jian-Jun; Du, Bo-Rong; Zhang, Cui-Huan Bioinformatic analysis of prognostic value of ARAP3 in breast cancer and the associated signaling pathways. Eur. Rev. Med. Pharmacol. Sci. 2017, 21, 2405–2412.
- Wang, Q.-X.; Chen, E.-D.; Cai, Y.-F.; Zhou, Y.-L.; Zheng, Z.-C.; Wang, Y.-H.; Jin, Y.-X.; Jin, W.-X.; Zhang, X.-H.; Wang, O.-C. Next-generation sequence detects ARAP3 as a novel oncogene in papillary thyroid carcinoma. OncoTargets Ther. 2016, 9, 7161–7167. [Google Scholar] [CrossRef]
- Cao, J.; Yang, T.; Tang, D.; Zhou, F.; Qian, Y.; Zou, X. Increased expression of GEF-H1 promotes colon cancer progression by RhoA signaling. Pathol.-Res. Pract. 2019, 215, 1012–1019. [Google Scholar] [CrossRef]
- Kent, O.A.; Sandí, M.-J.; Burston, H.E.; Brown, K.R.; Rottapel, R. An oncogenic KRAS transcription program activates the RHOGEF ARHGEF2 to mediate transformed phenotypes in pancreatic cancer. Oncotarget 2017, 8, 4484–4500. [Google Scholar] [CrossRef]
- Nakao, Y.; Nakagawa, S.; Yamashita, Y.; Umezaki, N.; Okamoto, Y.; Ogata, Y.; Yasuda-Yoshihara, N.; Itoyama, R.; Yusa, T.; Yamashita, K.; et al. High ARHGEF2 (GEF-H1) Expression is Associated with Poor Prognosis Via Cell Cycle Regulation in Patients with Pancreatic Cancer. Ann. Surg. Oncol. 2021, 28, 4733–4743. [Google Scholar] [CrossRef] [PubMed]
- Wang, Q.; Lv, L.; Tang, Y.; Zhang, L.; Wang, L. MMP-1 is overexpressed in triple-negative breast cancer tissues and the knockdown of MMP-1 expression inhibits tumor cell malignant behaviors in vitro. Oncol. Lett. 2018, 17, 1732–1740. Available online: http://www.spandidos-publications.com/10.3892/ol.2018.9779 (accessed on 25 August 2022). [CrossRef] [PubMed]
- Lim, J.P.; Nair, S.; Shyamasundar, S.; Chua, P.J.; Muniasamy, U.; Matsumoto, K.; Gunaratne, J.; Bay, B.H. Silencing Y-box binding protein-1 inhibits triple-negative breast cancer cell invasiveness via regulation of MMP1 and beta-catenin expression. Cancer Lett. 2019, 452, 119–131. [Google Scholar] [CrossRef] [PubMed]
- Presta, M.; Rusnati, M.; Dell’Era, P.; Tanghetti, E.; Urbinati, C.; Giuliani, R.; Leali, D. Examining New Models for the Study of Autocrine and Paracrine Mechanisms of Angiogenesis Through FGF2-Transfected Endothelial and Tumour Cells. In Angiogenesis; Maragoudakis, M.E., Ed.; Advances in Experimental Medicine and Biology; Springer: Boston, MA, USA, 2000; Volume 476, pp. 7–34. ISBN 978-1-4613-6895-3. Available online: http://link.springer.com/10.1007/978-1-4615-4221-6_2 (accessed on 26 August 2022).
- Zegeye, M.M.; Andersson, B.; Sirsjö, A.; Ljungberg, L.U. IL-6 trans-Signaling Impairs Sprouting Angiogenesis by Inhibiting Migration, Proliferation and Tube Formation of Human Endothelial Cells. Cells 2020, 9, 1414. [Google Scholar] [CrossRef] [PubMed]
- Geretti, E.; Shimizu, A.; Klagsbrun, M. Neuropilin structure governs VEGF and semaphorin binding and regulates angiogenesis. Angiogenesis 2008, 11, 31–39. [Google Scholar] [CrossRef] [PubMed]
- Naito, T.; Ercan, B.; Krshnan, L.; Triebl, A.; Koh, D.H.Z.; Wei, F.-Y.; Tomizawa, K.; Torta, F.T.; Wenk, M.R.; Saheki, Y. Movement of accessible plasma membrane cholesterol by the GRAMD1 lipid transfer protein complex. eLife 2019, 8, e51401. [Google Scholar] [CrossRef] [PubMed]
- Naito, T.; Saheki, Y. GRAMD1-mediated accessible cholesterol sensing and transport. Biochim. Biophys. Acta BBA-Mol. Cell Biol. Lipids 2021, 1866, 158957. [Google Scholar] [CrossRef]
- Sandhu, J.; Li, S.; Fairall, L.; Pfisterer, S.G.; Gurnett, J.E.; Xiao, X.; Weston, T.A.; Vashi, D.; Ferrari, A.; Orozco, J.L.; et al. Aster Proteins Facilitate Nonvesicular Plasma Membrane to ER Cholesterol Transport in Mammalian Cells. Cell 2018, 175, 514–529. [Google Scholar] [CrossRef]
- Ferrari, A.; He, C.; Kennelly, J.P.; Sandhu, J.; Xiao, X.; Chi, X.; Jiang, H.; Young, S.G.; Tontonoz, P. Aster Proteins Regulate the Accessible Cholesterol Pool in the Plasma Membrane. Mol. Cell. Biol. 2020, 40, e00255-20. [Google Scholar] [CrossRef]
- Wu, S.Y.; Yang, X.; Gharpure, K.M.; Hatakeyama, H.; Egli, M.; McGuire, M.H.; Nagaraja, A.S.; Miyake, T.M.; Rupaimoole, R.; Pecot, C.V.; et al. 2′-OMe-phosphorodithioate-modified siRNAs show increased loading into the RISC complex and enhanced anti-tumour activity. Nat. Commun. 2014, 5, 3459. [Google Scholar] [CrossRef]
- Huang, B.; Song, B.; Xu, C. Cholesterol metabolism in cancer: Mechanisms and therapeutic opportunities. Nat. Metab. 2020, 2, 132–141. [Google Scholar] [CrossRef]
- Voisin, M.; de Medina, P.; Mallinger, A.; Dalenc, F.; Huc-Claustre, E.; Leignadier, J.; Serhan, N.; Soules, R.; Ségala, G.; Mougel, A.; et al. Identification of a tumor-promoter cholesterol metabolite in human breast cancers acting through the glucocorticoid receptor. Proc. Natl. Acad. Sci. USA 2017, 114, E9346–E9355. Available online: https://pnas.org/doi/full/10.1073/pnas.1707965114 (accessed on 5 September 2022). [CrossRef]
- Luo, J.; Jiang, L.-Y.; Yang, H.; Song, B.-L. Intracellular Cholesterol Transport by Sterol Transfer Proteins at Membrane Contact Sites. Trends Biochem. Sci. 2019, 44, 273–292. [Google Scholar] [CrossRef]
- Connelly, M.A. SR-BI-mediated HDL cholesteryl ester delivery in the adrenal gland. Mol. Cell. Endocrinol. 2009, 300, 83–88. [Google Scholar] [CrossRef]
- Llaverias, G.; Danilo, C.; Mercier, I.; Daumer, K.; Capozza, F.; Williams, T.M.; Sotgia, F.; Lisanti, M.P.; Frank, P.G. Role of Cholesterol in the Development and Progression of Breast Cancer. Am. J. Pathol. 2011, 178, 402–412. [Google Scholar] [CrossRef]
- Danilo, C.; Gutierrez-Pajares, J.L.; Mainieri, M.A.; Mercier, I.; Lisanti, M.P.; Frank, P.G. Scavenger receptor class B type I regulates cellular cholesterol metabolism and cell signaling associated with breast cancer development. Breast Cancer Res. 2013, 15, R87. [Google Scholar] [CrossRef]
- Höglinger, D.; Burgoyne, T.; Sanchez-Heras, E.; Hartwig, P.; Colaco, A.; Newton, J.; Futter, C.E.; Spiegel, S.; Platt, F.M.; Eden, E.R. NPC1 regulates ER contacts with endocytic organelles to mediate cholesterol egress. Nat. Commun. 2019, 10, 4276. [Google Scholar] [CrossRef]
- Antalis, C.J.; Uchida, A.; Buhman, K.K.; Siddiqui, R.A. Migration of MDA-MB-231 breast cancer cells depends on the availability of exogenous lipids and cholesterol esterification. Clin. Exp. Metastasis 2011, 28, 733–741. [Google Scholar] [CrossRef]
- Rodrigues dos Santos, C.; Domingues, G.; Matias, I.; Matos, J.; Fonseca, I.; de Almeida, J.M.; Dias, S. LDL-cholesterol signaling induces breast cancer proliferation and invasion. Lipids Health Dis. 2014, 13, 16. [Google Scholar] [CrossRef]
- Gallagher, E.J.; Zelenko, Z.; Neel, B.A.; Antoniou, I.M.; Rajan, L.; Kase, N.; LeRoith, D. Elevated tumor LDLR expression accelerates LDL cholesterol-mediated breast cancer growth in mouse models of hyperlipidemia. Oncogene 2017, 36, 6462–6471. [Google Scholar] [CrossRef] [PubMed]
- Trop-Steinberg, S.; Azar, Y. AP-1 Expression and its Clinical Relevance in Immune Disorders and Cancer. Am. J. Med. Sci. 2017, 353, 474–483. [Google Scholar] [CrossRef]
- Wang, B.; Guo, H.; Yu, H.; Chen, Y.; Xu, H.; Zhao, G. The Role of the Transcription Factor EGR1 in Cancer. Front. Oncol. 2021, 11, 642547. [Google Scholar] [CrossRef]
- Macián, F.; López-Rodríguez, C.; Rao, A. Partners in transcription: NFAT and AP-1. Oncogene 2001, 20, 2476–2489. [Google Scholar] [CrossRef]
- Xiao, W.; Hodge, D.R.; Wang, L.; Yang, X.; Zhang, X.; Farrar, W.L. NF-kappaB activates IL-6 expression through cooperation with c-Jun and IL6-AP1 site, But is independent of its IL6-NFkappaB regulatory site in autocrine human multiple myeloma cells. Cancer Biol. Ther. 2004, 3, 1007–1017. [Google Scholar] [CrossRef]
- Wang, J.; Iwanowycz, S.; Yu, F.; Jia, X.; Leng, S.; Wang, Y.; Li, W.; Huang, S.; Ai, W.; Fan, D. microRNA-155 deficiency impairs dendritic cell function in breast cancer. OncoImmunology 2016, 5, e1232223. [Google Scholar] [CrossRef]
- Kwantwi, L.B.; Wang, S.; Sheng, Y.; Wu, Q. Multifaceted roles of CCL20 (C-C motif chemokine ligand 20): Mechanisms and communication networks in breast cancer progression. Bioengineered 2021, 12, 6923–6934. [Google Scholar] [CrossRef]
- Yang, C.; Yu, H.; Chen, R.; Tao, K.; Jian, L.; Peng, M.; Li, X.; Liu, M.; Liu, S. CXCL1 stimulates migration and invasion in ER-negative breast cancer cells via activation of the ERK/MMP2/9 signaling axis. Int. J. Oncol. 2019, 55, 684–696. Available online: http://www.spandidos-publications.com/10.3892/ijo.2019.4840 (accessed on 9 September 2022). [CrossRef]
- Ciummo, S.L.; D’Antonio, L.; Sorrentino, C.; Fieni, C.; Lanuti, P.; Stassi, G.; Todaro, M.; Di Carlo, E. The C-X-C Motif Chemokine Ligand 1 Sustains Breast Cancer Stem Cell Self-Renewal and Promotes Tumor Progression and Immune Escape Programs. Front. Cell Dev. Biol. 2021, 9, 689286. [Google Scholar] [CrossRef]
- Tulotta, C.; Lefley, D.V.; Freeman, K.; Gregory, W.M.; Hanby, A.M.; Heath, P.R.; Nutter, F.; Wilkinson, J.M.; Spicer-Hadlington, A.R.; Liu, X.; et al. Endogenous Production of IL1B by Breast Cancer Cells Drives Metastasis and Colonization of the Bone Microenvironment. Clin. Cancer Res. 2019, 25, 2769–2782. [Google Scholar] [CrossRef]
- Carpentier, G.; Berndt, S.; Ferratge, S.; Rasband, W.; Cuendet, M.; Uzan, G.; Albanese, P. Angiogenesis Analyzer for ImageJ—A comparative morphometric analysis of “Endothelial Tube Formation Assay” and “Fibrin Bead Assay”. Sci. Rep. 2020, 10, 11568. [Google Scholar] [CrossRef]


Disclaimer/Publisher’s Note: The statements, opinions and data contained in all publications are solely those of the individual author(s) and contributor(s) and not of MDPI and/or the editor(s). MDPI and/or the editor(s) disclaim responsibility for any injury to people or property resulting from any ideas, methods, instructions or products referred to in the content. |
© 2023 by the authors. Licensee MDPI, Basel, Switzerland. This article is an open access article distributed under the terms and conditions of the Creative Commons Attribution (CC BY) license (https://creativecommons.org/licenses/by/4.0/).
Share and Cite
Jonas, K.; Prinz, F.; Ferracin, M.; Krajina, K.; Deutsch, A.; Madl, T.; Rinner, B.; Slaby, O.; Klec, C.; Pichler, M. MiR-4646-5p Acts as a Tumor-Suppressive Factor in Triple Negative Breast Cancer and Targets the Cholesterol Transport Protein GRAMD1B. Non-Coding RNA 2024, 10, 2. https://doi.org/10.3390/ncrna10010002
Jonas K, Prinz F, Ferracin M, Krajina K, Deutsch A, Madl T, Rinner B, Slaby O, Klec C, Pichler M. MiR-4646-5p Acts as a Tumor-Suppressive Factor in Triple Negative Breast Cancer and Targets the Cholesterol Transport Protein GRAMD1B. Non-Coding RNA. 2024; 10(1):2. https://doi.org/10.3390/ncrna10010002
Chicago/Turabian StyleJonas, Katharina, Felix Prinz, Manuela Ferracin, Katarina Krajina, Alexander Deutsch, Tobias Madl, Beate Rinner, Ondrej Slaby, Christiane Klec, and Martin Pichler. 2024. "MiR-4646-5p Acts as a Tumor-Suppressive Factor in Triple Negative Breast Cancer and Targets the Cholesterol Transport Protein GRAMD1B" Non-Coding RNA 10, no. 1: 2. https://doi.org/10.3390/ncrna10010002
APA StyleJonas, K., Prinz, F., Ferracin, M., Krajina, K., Deutsch, A., Madl, T., Rinner, B., Slaby, O., Klec, C., & Pichler, M. (2024). MiR-4646-5p Acts as a Tumor-Suppressive Factor in Triple Negative Breast Cancer and Targets the Cholesterol Transport Protein GRAMD1B. Non-Coding RNA, 10(1), 2. https://doi.org/10.3390/ncrna10010002