Abstract
Hydrothermal carbonation carbon (HTCC) is emerging as a promising material for the adsorption and photodegradation of environmental contaminants. However, the chemical and structural properties of HTCC derived from different lignocellulose biomass have obvious impacts on adsorption and photodegradation. This work employed three different lignocellulose components, including cellulose, hemicellulose, and lignin to synthesize HTCC within a hydrothermal temperature range of 210~290 °C. In comparison to HTCC derived from cellulose and hemicellulose, HTCC derived from lignin (HTCC-L) demonstrated the optimal synergistic adsorption and photodegradation ability for TC degradation, achieving a 63.5% removal efficiency within 120 min. Characterization highlighted the crucial involvement of oxygenated functional groups, especially carboxyl groups, presented on the surface of HTCC-L in TC adsorption. Moreover, the photodegradation of HTCC-L was found to follow a non-radical mechanism, characterized by the charge transformation occurring between the excited unpaired electrons of HTCC-L and TC adsorbed on its surface. This work clarified the differences in HTCC derived from different lignocellulose components on the adsorption and photodegradation of organic pollutants, and provided a novel perspective on the application of HTCC in water treatment.
1. Introduction
In recent decades, the presence of tetracycline (TC) in aquatic environments has become a significant concern due to its excessive use in aquaculture and medical treatment [1,2]. Unfortunately, the long half-life and poor metabolism of TC make it difficult to be naturally degraded by self-purification ability in the ecosystem [3,4]. Therefore, the efficient and sustainable removal of TC from water environments has emerged as a paramount concern in contemporary research.
Adsorption technology offers an efficient means to adsorb pollutants and facilitate their transfer between phases, yet falls short of achieving complete mineralization of the pollutants [5]. Photocatalysis technology enables the sustainable conversion of inexhaustible optical energy into chemical energy [6]. Owing to its minimal energy input and carbon footprint, photocatalysis technology has emerged as a convenient and effective approach for pollutant degradation. Currently, most studies are focused on optimizing the band structure and carrier utilization efficiency of photocatalytic semiconductors, while neglecting the crucial role of adsorption in the photocatalytic process. Therefore, a new strategy is to develop materials with dual functions of adsorption and photocatalysis in order to efficiently remove recalcitrant TC pollutants from water.
Carbon materials are generally considered to be highly adsorbent materials due to their significantly large specific surface areas, well-developed porous structures, and abundant surface functional groups [7]. Hydrothermal carbonation carbon (HTCC), as a type of carbon material, is obtained through a hydrothermal carbonation (HTC) treatment at temperatures ranging from 180 to 300 °C, over several hours of reaction [8,9,10]. In general, HTC is conducted in the presence of sub-critical liquid water and enables the conversion of wet input materials into carbonaceous solids with relatively high yields, eliminating the need for energy-intensive drying before or during the process [8,11]. The transformation of lignocellulose biomass through the HTC process, instead of high temperature calcination, contributes to greenhouse gas mitigation [12,13]. At present, HTCC has been demonstrated to possess remarkable sorption capacities for both polar and non-polar organic contaminants [14]. In addition, HTCC possesses unique inner chemical structures that confer upon it semiconducting properties [15,16].
Since the discovery of HTCC’s semiconducting properties, research efforts have primarily centered on exploring its photocatalytic applications. As reported, the HTCC exhibits an efficient ability to capture solar radiation across a broad wavelength range of up to 1300 nm, enabling the utilization of the complete solar spectrum from ultraviolet to near-infrared [17]. In addition, HTCC has a relatively narrow bandgap of approximately 1.3 eV, which facilitates efficient separation and migration of photo-generated charge carriers upon optical excitation [18]. Hu et al. reported that biomass could be converted into HTCC with semiconductive properties at low hydrothermal temperature (<300 °C), which is attributed to the significant presence of sp2-hybridized units (polyfuran chain) within HTCC [17]. The single polymer chain existing in HTCC has the capability to generate photo-induced electrons and holes under illumination conditions [19]. The excited furan units facilitate the transfer of electrons to the adsorbed oxygen (O2), forming powerful oxidative radicals (e.g., •OH and O2•−) for pollutant degradation [16,20]. In addition, the surface of HTCC exhibits a high abundance of oxygenated functional groups (OFGs), including phenolic hydroxyl, carboxyl, and carbonyl groups. Similar to the dye-sensitization process, these OFGs on the surface of HTCC act as sensitizers that produce reactive species [21,22].
The potential of HTCC-based photocatalysts has yet to be fully developed. For instance, lignocellulose can be classified as cellulose, hemicellulose, and lignin, based on their different structural characteristics, and HTCC derived from different precursors exhibits substantial disparities in both physical and chemical properties [23]. Nevertheless, limited research has been conducted on the impact of the different properties and structures of HTCC on the photocatalytic activity. In this work, we synthesized HTCC through HTC treatment to achieve synergistic adsorption and photodegradation of TC. The primary objective of this study was to compare the synergistic TC removal efficiency of HTCC derived from cellulose, hemicellulose, and lignin. In addition, this study elucidated the potential adsorption and photodegradation mechanisms of lignin-derived HTCC. The HTCC, possessing both adsorption and photodegradation capabilities, will offer valuable insights for future advancements and applications in water remediation.
2. Materials and Methods
2.1. Chemicals and Materials
α-Cellulose (CAS: 9004-34-6), lignin (Dealkaline, CAS: 9005-53-2), xylan from corncob (CAS: 9014-63-5, 85%), tetracycline (C22H24N2O8, 96%), 5,5-dimethyl-1-pyrroline N-oxide (DMPO), 2,2,6,6-tetramethyl-4-piperidinol (TEMP), sulfuric acid (H2SO4), and hydroxide (NaOH) were purchased from Aladdin Biochemical Co., Ltd. (Shanghai, China). All chemicals and reagents were employed as received, without additional purification. Unless otherwise specified, all solutions were prepared using ultra-pure water obtained from the Millipore Milli-Q water system.
2.2. Preparation of HTCC
The commercially available cellulose, hemicellulose, and lignin were individually dispersed in 50 mL ultra-pure water as carbon sources and stirred magnetically for 6 h. The solutions/suspensions were subsequently transferred into a 100 mL Teflon-lined autoclave and heated at different temperatures (210, 230, 250, 270, 290 °C) for a duration of 6 h. After being naturally cooled, the obtained solid powders underwent alternating washes with ultra-pure water and ethanol, followed by centrifugation at a rotation speed of 4500 r/min for a duration of 15 min. Then, the separated powders were dried overnight in a vacuum oven at 90 °C. The yields of HTCC derived from cellulose and hemicellulose ranged between 20% to 25%, while the yield of HTCC derived from lignin was approximately 75%. The products were ultimately ground to a particle size of 100 mesh and then stored in desiccators. The obtained hydrochar was designated as HTCC-x-y (where x = C, HC, L, representing cellulose, hemicellulose, and lignin, respectively; y = 210, 230, 250, 270, and 290, denoting the hydrothermal temperatures of 210 °C, 230 °C, 250 °C, 270 °C, and 290 °C).
2.3. Synergistic Adsorption and Photodegradation Procedures
The 100 mg/L TC stock solution was prepared by dissolving 100 mg of TC powder to 1 L of ultra-pure water. Unless otherwise specified, all experiments were conducted in 250 mL conical flasks containing 200 mL of the TC solution (1 mg/L) and 20 mg as-prepared HTCC samples. The pH was stabilized at the pre-determined value (pH = 6.0) before adding the HTCC samples, either by using NaOH or diluted H2SO4. The light source was a 300 W xenon lamp equipped with an ultraviolet (UV) cut-off filter (λ < 420 nm). The reaction was initiated when the xenon lamp was turned on and proceeded at 25 °C for 120 min. According to different time intervals, 1 mL suspension was obtained from the container and filtered using a 0.22 µm filter membrane for residual TC detection. All experiments were replicated, and the results were presented as the average with standard deviation.
2.4. Analysis Methods
The concentration of TC was analyzed using ultra-high-performance liquid chromatography (UPLC, Agilent 1290, Agilent Technologies Inc., Palo Alto, CA, USA) combined with a UV detector. The organic compounds were separated by an Eclipse Plus C18 column (2.1 × 50 mm, 1.8 μm). The mobile phase consisted of a mixture of acetonitrile −0.1% formic acid solution in a ratio of 30/70 (v/v), and the flow rate was set at 0.1 mL/min. The degradation intermediates of TC were identified by an ultra-high-performance liquid chromatography quadrupole time-of-flight premier mass spectrometer (UPLC-Q-TOF MS/MS, Agilent 6545, Agilent Technologies Inc., Palo Alto, CA, USA), and more details are shown in Text S1. The morphological features of the as-prepared HTCC samples were analyzed using a Scanning Electron Microscope (SEM, Sigma 500, ZEISS, Cambridge, UK) equipped with an Oxford Instruments Energy Dispersive Spectrometer (EDS, X-Max, OXFORD, Oxford, UK). The nitrogen adsorption–desorption isotherms of HTCC samples were measured using an automated surface area and pore-size analyzer (QUADRASORB SI, Quantachrome, Boynton Beach, FL, USA). The surface functional groups of the hydrochar were investigated using a Fourier transform-infrared spectrum instrument (FT-IR, Nicolet is50, Thermo Fisher Scientific Inc., Waltham, MA, USA) and an X-ray photoelectron spectroscopy system (XPS, ESCALAB 250xi spectrometer, Thermo Fisher Scientific Inc., Waltham, MA, USA). An electron paramagnetic resonance spectrometer (EPR, EMX-8/2.7, BRUKER, Karlsruhe, Germany) was used to detect free radicals and singlet oxygen, respectively. The details of EPR measurements are available in Text S2.
2.5. Computational Methods
The Gaussian 16W program was used for theoretical calculations. The geometry optimization and frequency calculation of TC were performed using the B3LYP hybrid functional with a 6-311G (d,p) basis set. The solvation model based on density (SMD) was implemented as a self-consistent reaction field (SCRF), with H2O designated as the solvent. The frontier molecular orbital, electrostatic potential (ESP), and concentrated Fukui function (CFF) were calculated using Multiwfn 3.8 (dev) [24,25]. The structures and isosurfaces were visualized utilizing VMD 1.9.3.
3. Results and Discussion
3.1. Synergistic Adsorption and Photodegradation Performance of the HTCC
3.1.1. Material Optimization
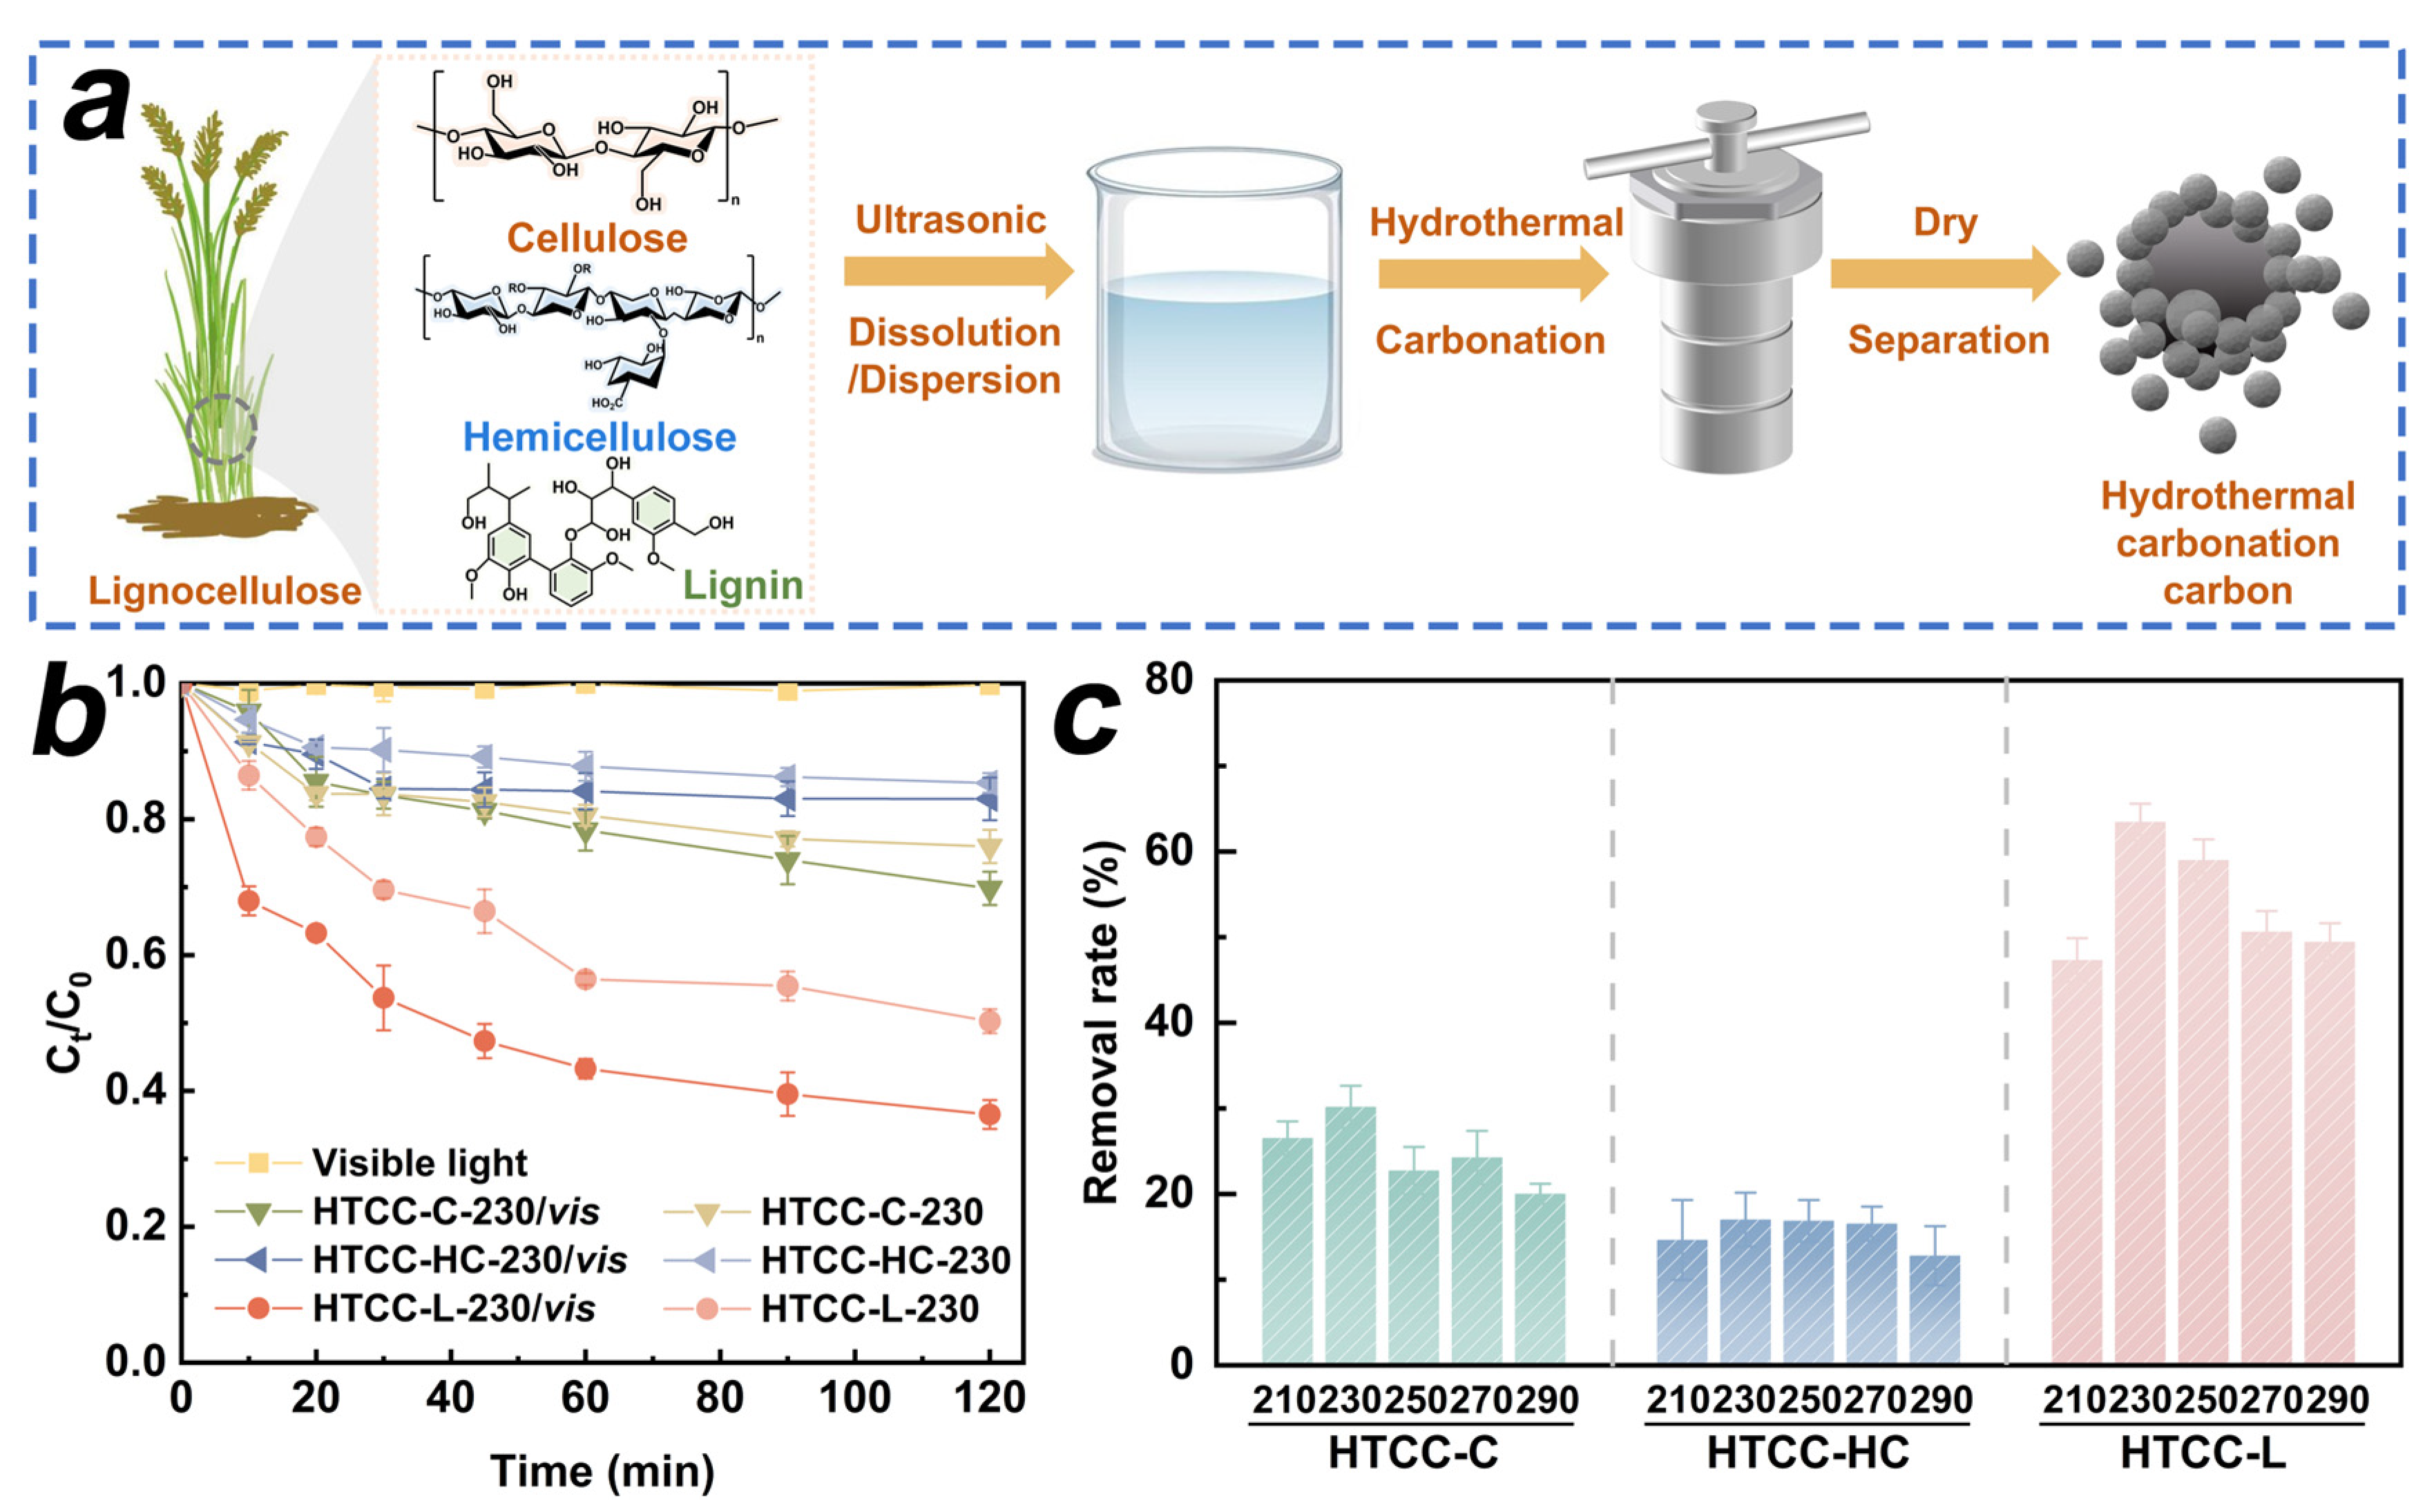
In this work, we employed the HTC treatment to convert cellulose, hemicellulose, and lignin into HTCC samples. The synthesis procedure of the HTCC samples is schematically illustrated in Figure 1a. First, we investigated the synergistic adsorption and photodegradation capabilities of HTCC derived from different carbon sources for TC (Figure 1b). The degradation of TC under visible light irradiation was found to be less than 2.2% within 120 min, indicating that the contribution of visible light alone to TC photodegradation may be considered negligible. Compared to HTCC-C and HTCC-HC samples, HTCC-L demonstrated the highest synergistic effect in terms of adsorption and photodegradation performance for TC, reaching up to 63.5% within 120 min. We further investigated the impact of hydrothermal temperature on the synergistic adsorption and photodegradation capabilities of as-prepared HTCC samples. As shown in Figure 1c, the removal rate of TC on HTCC-C and HTCC-HC derived from different hydrothermal temperatures exhibited slight variations. This result suggests that the structural characteristics of HTCC-C and HTCC-HC were basically unchanged within the hydrothermal temperature range of 210~290 °C. Notably, all the HTCC-L samples presented a remarkable removal rate of TC under visible light irradiation. Among them, the HTCC-L-230 demonstrated the highest adsorption and photodegradation synergistic efficiency for TC. With the further increase in hydrothermal temperature (>230 °C), the removal rate of TC in HTCC-L samples gradually decreased under visible light irradiation. Therefore, we extensively elucidated the adsorption and photodegradation mechanisms of HTCC-L in subsequent investigations.
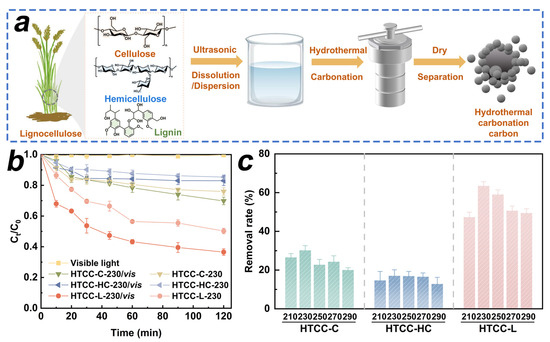
Figure 1.
(a) Schematic illustration of synthesizing hydrothermal carbonation carbon (HTCC) derived from cellulose, hemicellulose, and lignin. (b) Tetracycline (TC) removal by HTCC derived from cellulose (HTCC-C), hemicellulose (HTCC-HC), and lignin (HTCC-L) with and without visible light. (c) Synergistic adsorption and photodegradation of TC by as-prepared HTCC samples under different hydrothermal temperatures. Conditions: [TC]0 = 1.0 mg/L, [HTCC] 0 = 100 mg/L, pH = 6.0, T = 25 °C.
3.1.2. Influencing Factors
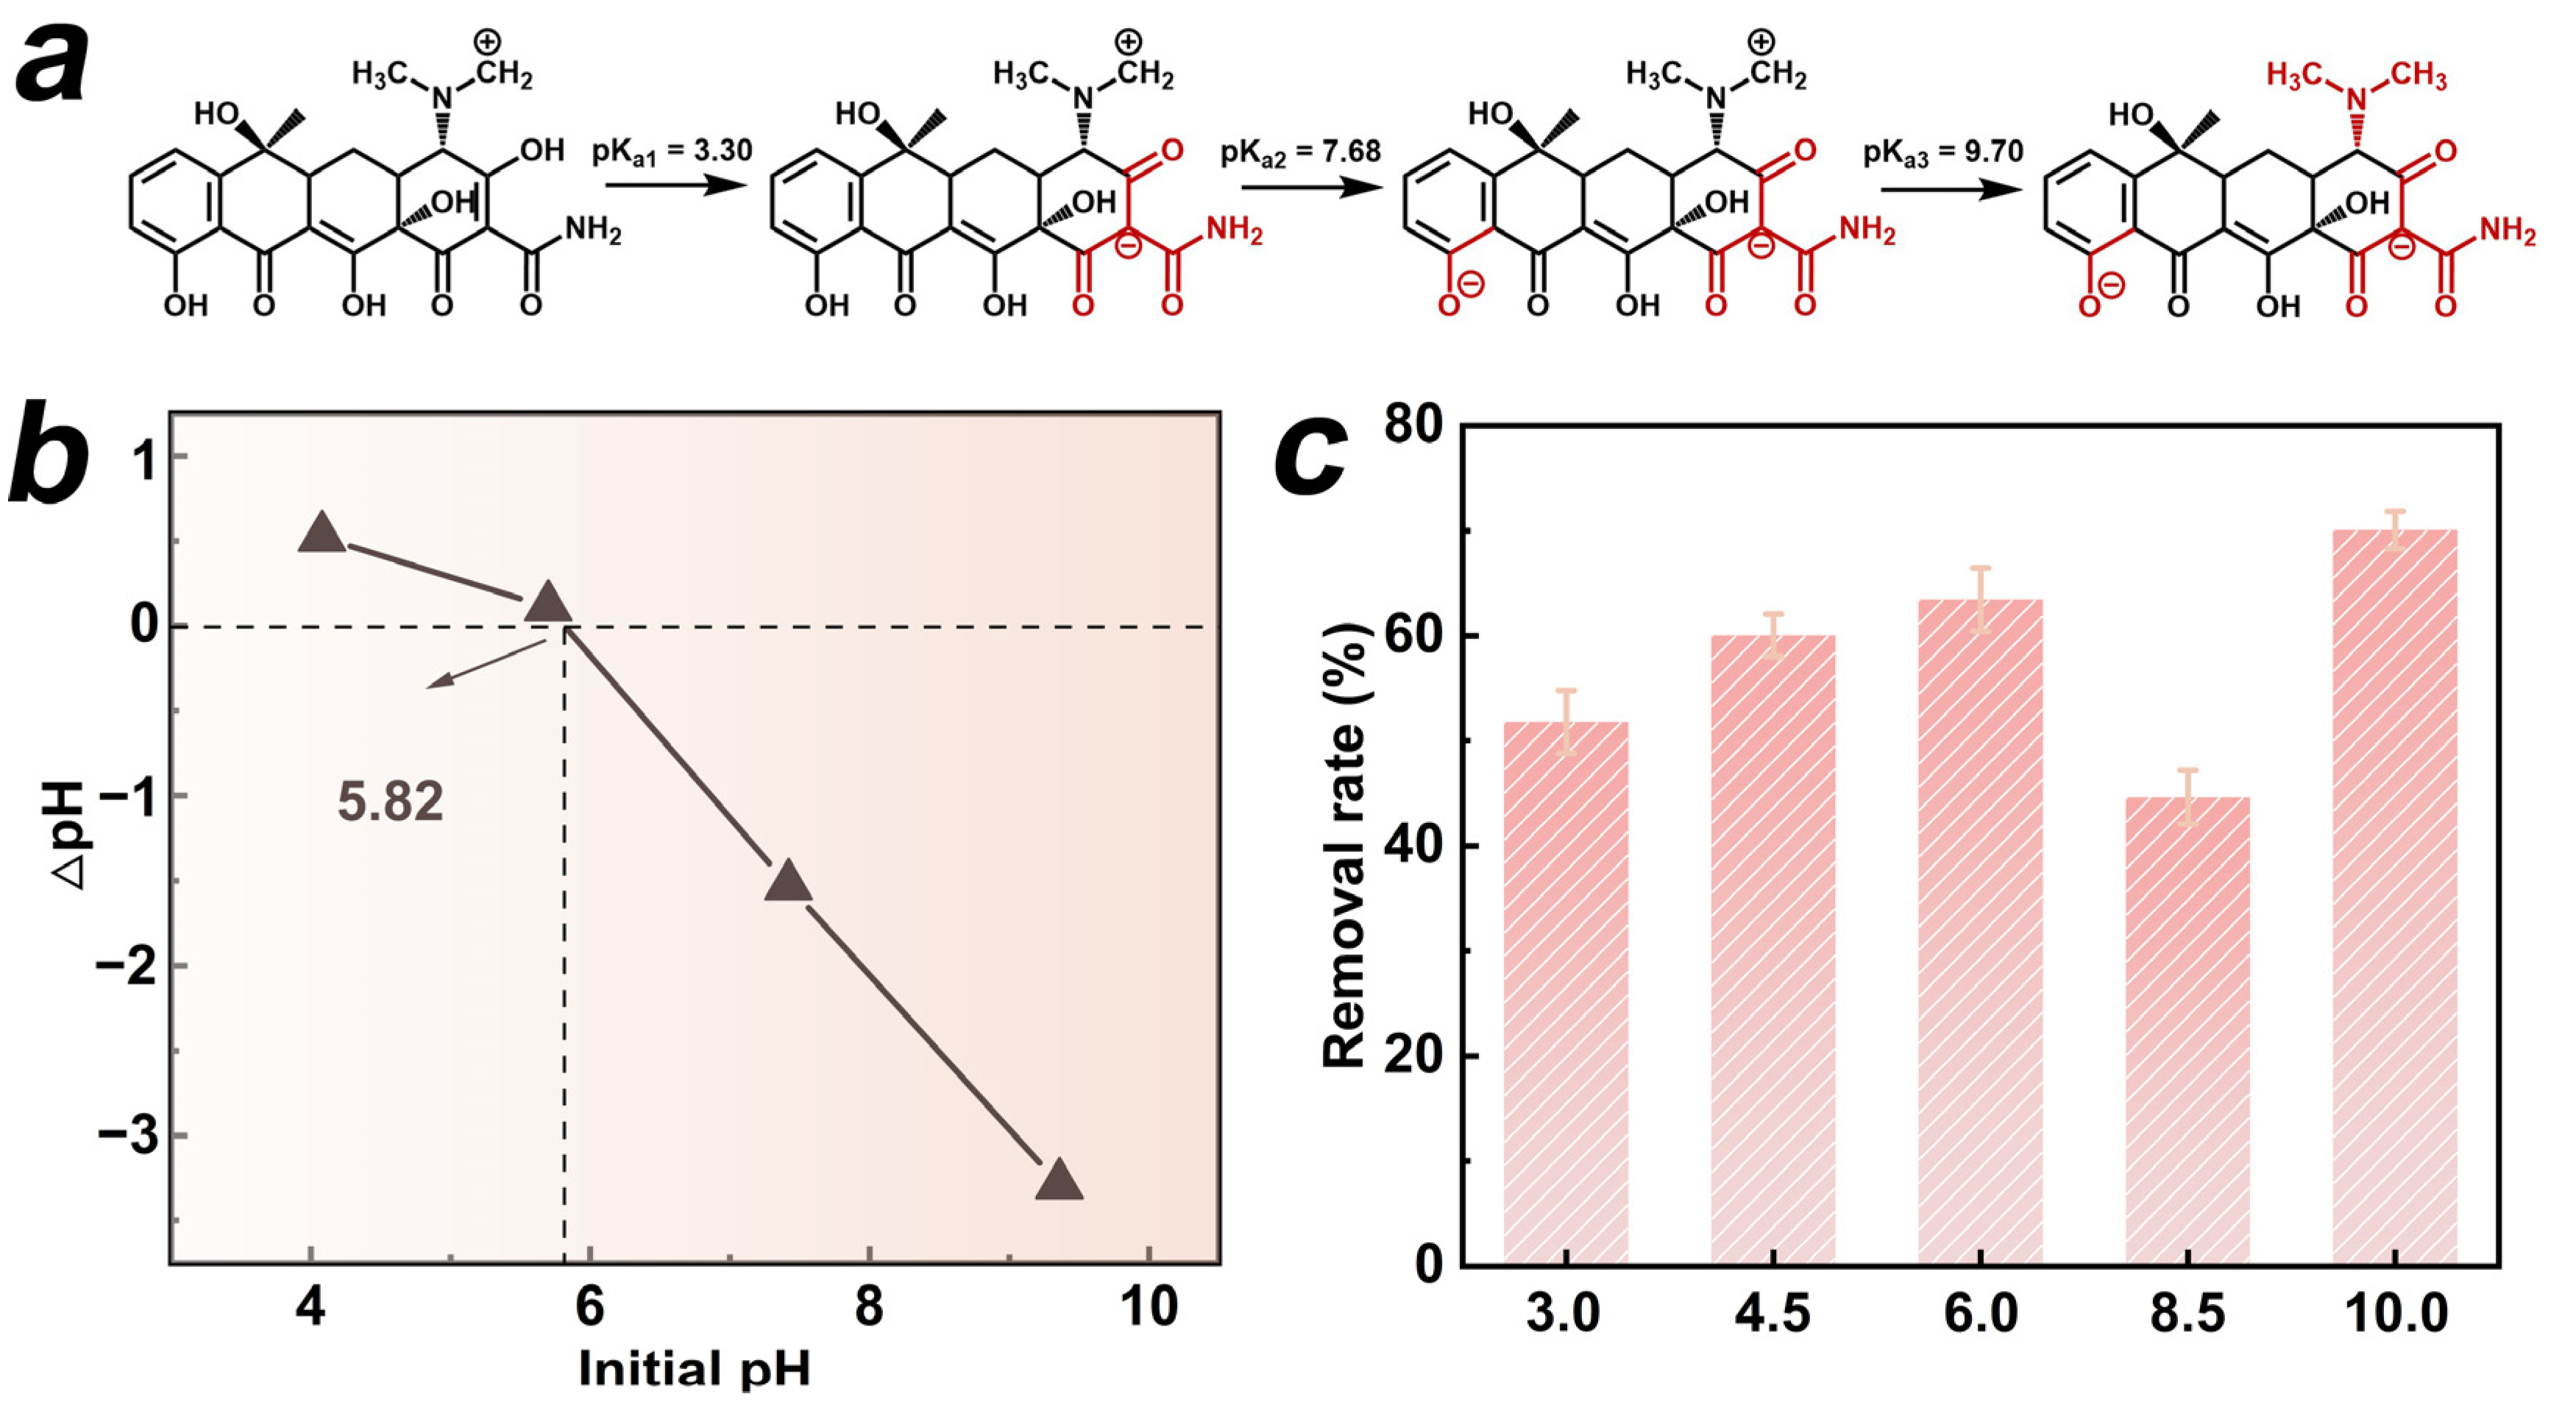
We selected the HTCC-L-230 sample, which exhibited superior adsorption and photodegradation synergies, to evaluate the effects of initial pH on TC removal. The antibiotic TC exhibited amphoteric properties, displaying different protonation states at varying pH levels [3]. The ionization equilibria of TC in Figure 2a demonstrated three pKa values: pKa1 at 3.30, pKa2 at 7.68, and pKa3 at 9.70 [26]. It is suggested that the cationic form (TCH3+) exists when pH < 3.30, or it gradually undergoes transformation into the neutral form (TCH2) within the pH range of 3.30 to 7.68. When the pH exceeds 7.68, the solution is predominantly occupied by the anionic form of TC (TCH− or TC2−). In addition, the pHpzc can be utilized to ascertain the surface charge state of material under varying pH conditions. As shown in Figure 2b, the pHpzc of HTCC-L-230 was found to be 5.82, indicating its cationic state at pH < 5.82, or anionic form at pH > 5.82. The pH range of 3.0 to 10.0 was employed to investigate the synergistic adsorption and photodegradation performance of HTCC-L-230 (Figure 2c). The removal rates of TC at pH 4.5 and pH 6 were approximately 60.0% and 63.1%, respectively. However, the TC removal rate exhibited a significant decline when the pH fell below 3.30 or exceeded 7.68, with only approximately 51.6% and 44.6% of TC being removed at pH levels of 3 and 8.5, respectively. This phenomenon can be attributed to the electrostatic repulsion between HTCC-L-230 and TC due to their similar charges, which hampers the synergistic effect of TC adsorption and photodegradation. The TC removal rate, however, exhibited an increase at pH 10.0, which can be attributed to the inherent instability of TC’s ionic structure, leading to its self-degradation in an alkaline environment.
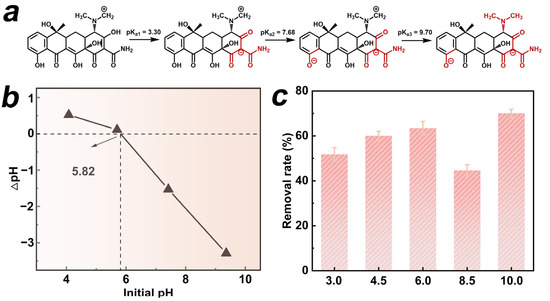
Figure 2.
(a) Ionization equilibrium of TC. (b) Zeta potential of HTCC-L synthesized at 230 °C (HTCC-L-230). (c) Synergistic adsorption and photodegradation of TC in the HTCC-L-230/visible light system under different pH values. Conditions: [TC]0 = 1.0 mg/L, [HTCC-L-230]0 = 100 mg/L, pH = 6.0, T = 25 °C.
The impact of catalyst dosage and TC concentration on the synergistic adsorption and photodegradation performances of HTCC-L-230 was further assessed. As shown in Figure S1a, the removal rate of TC exhibited a decline from 72.5% to 46.8% as the concentration of TC increased from 0.5 mg/L to 3.0 mg/L. In addition, the removal rate of TC was observed to increase from 63.5% to 77.2% as the amount of HTCC-L-230 increased from 100 mg/L to 200 mg/L under visible light irradiation (Figure S1b). However, when the dosage of HTCC-L-230 reached 250 mg/L, there was barely any increase in the removal rate of TC (79.2%) compared to that observed with the dosage of 200 mg/L. This suggests that an overdose of HTCC-L-230 hinders the photodegradation of TC under visible light exposure by light shielding.
3.2. Characterizations
3.2.1. Morphology Characteristics
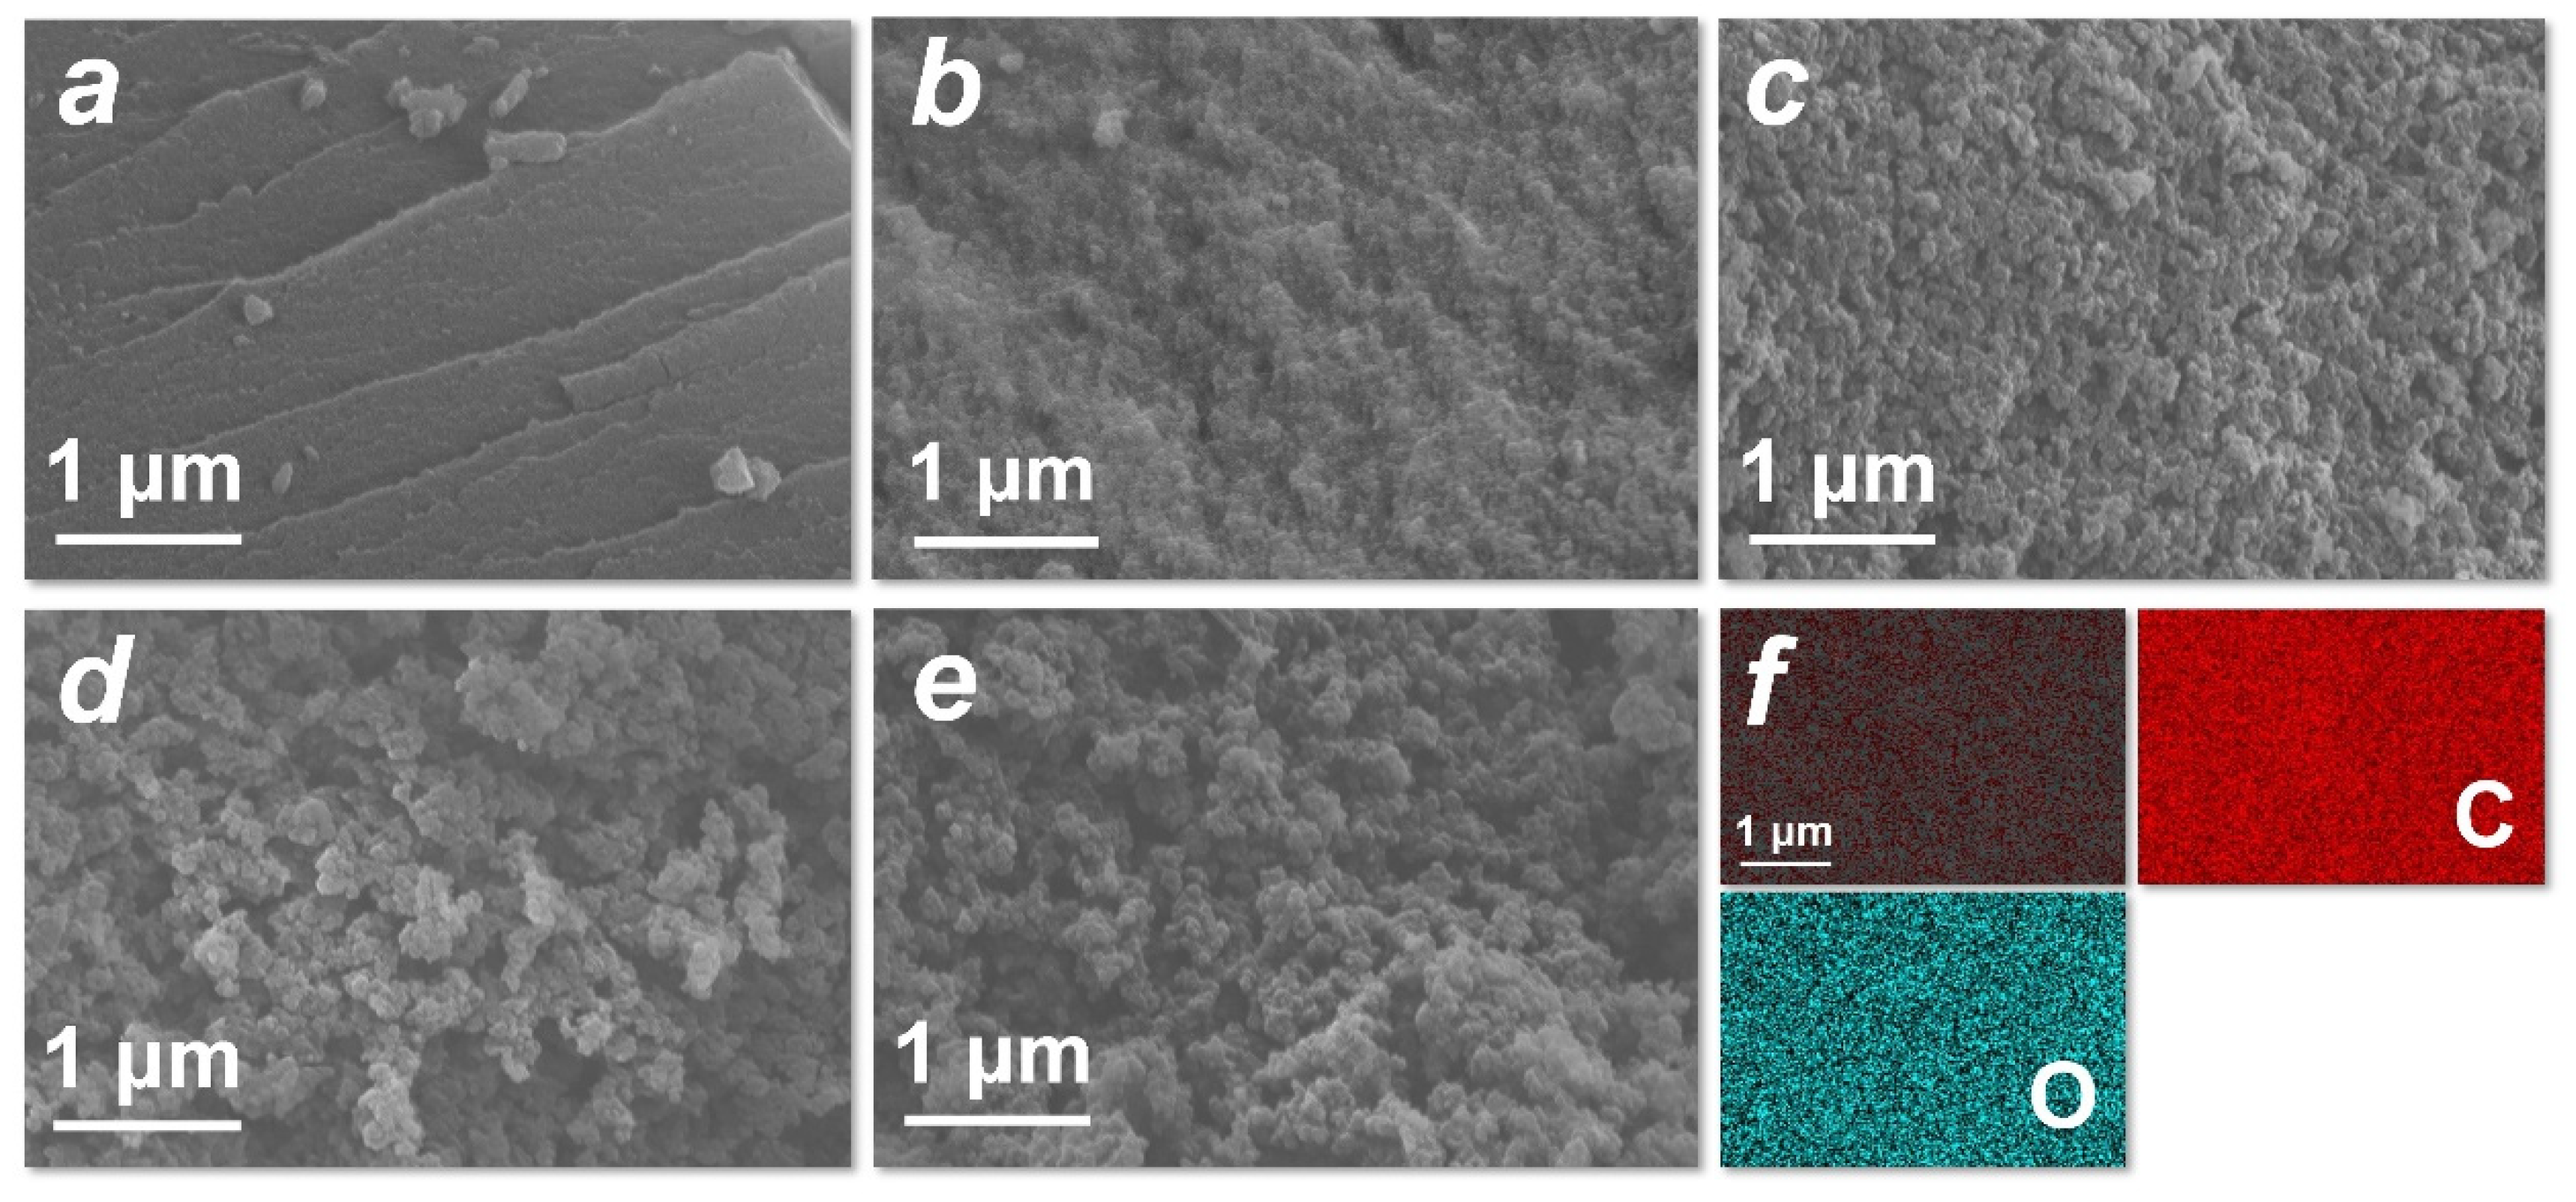
The morphologies of HTCC-L samples derived from 210~290 °C were characterized using SEM, as depicted in Figure 3a–e. All HTCC-L samples were planar structures, evidently distinct from the microspheres of HTCC-C and HTCC-HC (Figure S2a,b). The surface roughness of HTCC-L increased with the rise in hydrothermal temperature, which is consistent with previous studies [27,28]. The HTCC-L-210 exhibited a relatively smooth surface without any obvious pore structures, potentially due to the presence of undissolved lignin fragments acting as fillers and/or coverings for surface cracks and holes on the HTCC-L [27]. Conversely, the HTCC-L samples displayed rougher surfaces with the visible surface holes at hydrothermal temperatures exceeding 230 °C, which can be attributed to the release of gases during the HTC treatment of lignin [29]. The EDS elemental mapping images revealed that the composition of HTCC-L primarily consisted of C and O, with C atoms accounting for 81.3% and O atoms accounting for 18.7% (Figure 3f and Figure S3).

Figure 3.
Scanning electron microscope images of as-prepared (a) HTCC-L synthesized at 210 °C (HTCC-L-210), (b) HTCC-L-230, (c) HTCC-L synthesized at 250 °C (HTCC-L-250), (d) HTCC-L synthesized at 270 °C (HTCC-L-270), and (e) HTCC-L synthesized at 290 °C (HTCC-L-290). (f) Corresponding element mapping for C, O of HTCC-L-230.
3.2.2. Specific Surface Area and Pore-Size Distribution
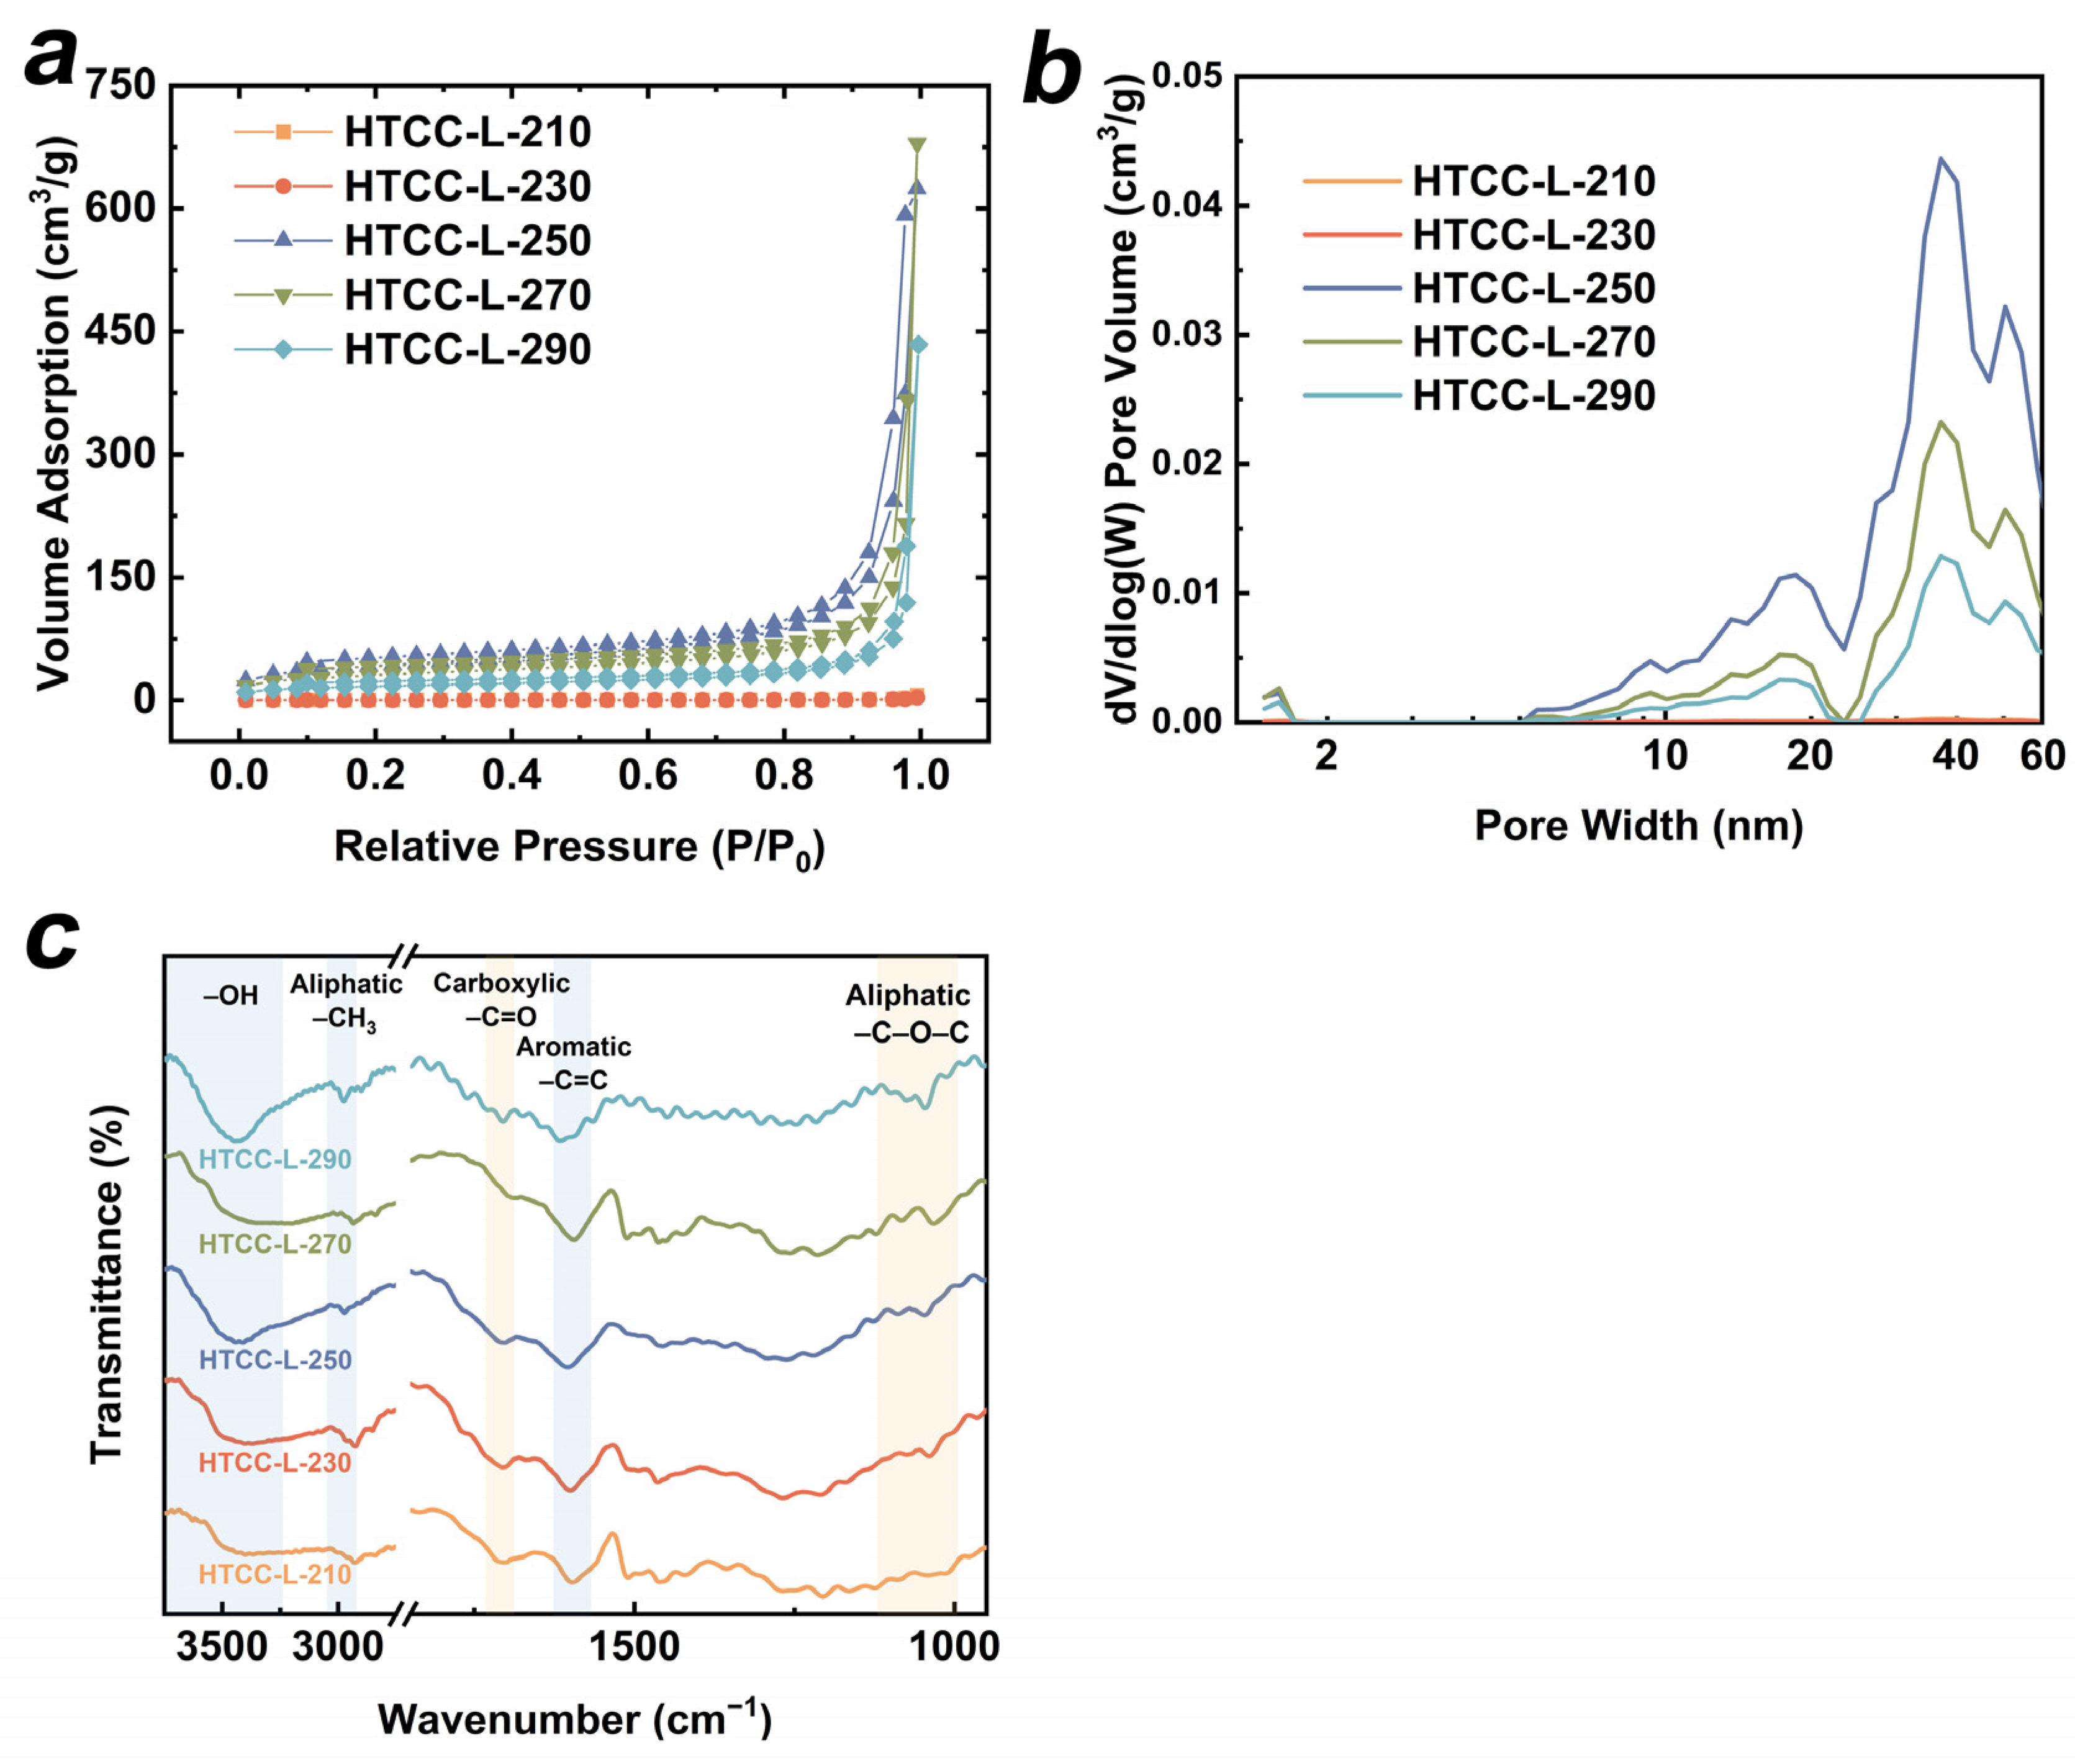
The specific surface area (SSA) and pore-size distribution of all HTCC-L samples were analyzed. As depicted in Figure 4a, the N2 adsorption–desorption isotherms of HTCC-L-210 and HTCC-L-230 exhibited Type III isotherms with minimal hysteresis loops, suggesting the absence of significant pore structures. However, when the hydrothermal temperature increased above 250 °C, the N2 adsorption–desorption isotherms of HTCC-L exhibited Type IV isotherms with H3 hysteresis loops, indicating the presence of mesopores characterized by slit-like pores. The SSA of all HTCC-L samples were calculated by the Brunauer–Emmett–Teller (BET) model (for more details, see Table S1). The HTCC-L-250 exhibited the highest SSA among all HTCC-L samples, with a measured value of 146.665 m2/g, which was much larger than that of HTCC-L-230 (9.314 m2/g). The N2 adsorption–desorption isotherms of HTCC-C-230 and HTCC-HC-230 are also presented in Figure S4, with detailed parameters listed in Table S1. The BET surface areas of HTCC-C-230 and HTCC-HC-230 were determined to be 53.085 and 29.859 m2/g, both surpassing that observed for HTCC-L-230. The pore-volume and pore-size distribution of all HTCC-L samples are illustrated in Figure 4b. Abundant microporous structures were observed in HTCC-L-250, HTCC-L-270, and HTCC-L-290 samples, while minimal pore structures were found in HTCC-L-210 and HTCC-L-230. In general, the SSA and total pore volume partially reflected the number of active sites present on the surface of HTCC, and the surface-active sites and porous structures are believed to facilitate the diffusion and pore-filling of TC on HTCC. However, the HTCC samples with higher SSA and pore volume (i.e., HTCC-L-250, HTCC-C-230, and HTCC-HC-230) did not exhibit superior adsorption capabilities in comparison to HTCC-L-230 (Figure 1b and Figure 5a). This result implies that the adsorption performance of HTCC-L was not solely determined by its pore structure, but that this also relied on the presence of surface functional groups. Furthermore, a comparative analysis was conducted between the specific surface area and adsorption capacity of the HTCC material synthesized in this study and those reported in the previous literature (Table S2).
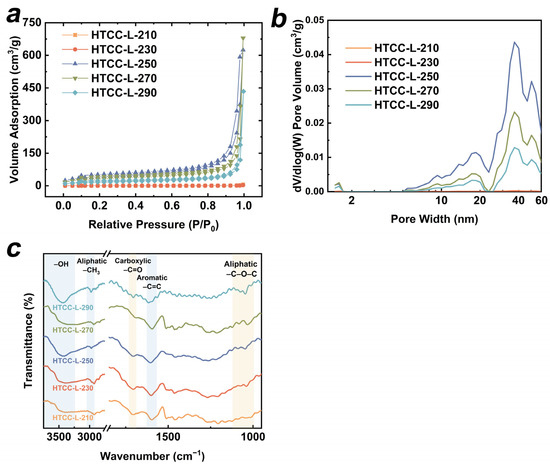
Figure 4.
(a) N2 adsorption–desorption isotherms, (b) porosity distributions, and (c) Fourier transform-infrared (FT-IR) spectra of as-prepared HTCC-L samples.
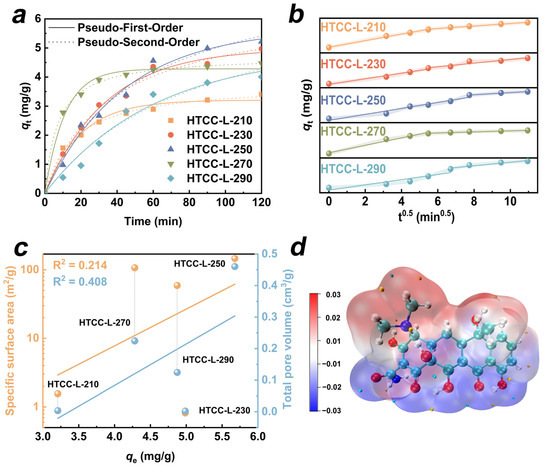
Figure 5.
(a) The adsorption kinetics and (b) intra-particle diffusion model of TC onto as-prepared HTCC-L samples. (c) Correlation between the specific surface areas, pore volumes, and adsorption capacities of as-prepared HTCC-L samples. (d) Electrostatic potential distributions of TC.
3.2.3. Surface Functional Groups
The FT-IR spectra of HTCC-L samples synthesized at different hydrothermal temperatures are presented in Figure 4c. The characteristic peaks at 3420 cm−1, 2935–2840 cm−1, and 1600 cm−1 were observed in all HTCC-L samples, corresponding to the stretching vibration of –OH groups, –CH3 groups, and C=C bonds, respectively [30,31]. In addition, the peaks observed at 1710 cm−1 and 1160–1030 cm−1 were mainly ascribed to the stretching vibrations of C=O in carboxyl groups and the C–O bonds in aliphatic compounds [32,33]. These results suggest that the OFGs, including hydroxyl groups, ether groups, and carboxyl groups, are on the HTCC-L samples. Notably, the increase in hydrothermal temperature led to a reduction in the peak intensity of carboxyl groups (i.e., HTCC-L-290), suggesting the influence of HTC temperature on the composition of surface functional groups. We further used XPS to characterize the surface functional groups of HTCC-L samples and summarized the relative proportions of surface oxygen and OFGs. As shown in Table S3, the high-resolution C1s spectra of all HTCC-L samples can be deconvoluted into three peaks: 284.3 eV for C–C/C–H, 285.7 eV for C–OH, and 287.5 eV for O–C=O [16]. In addition, the high-resolution O1s spectra of all HTCC-L samples exhibited two peaks at 531.5 eV for C=O and 532.9 eV for C–OH [34]. This result is consistent with the FTIR data. The O/C ratios associated with OFGs were calculated to be 28.19% for HTCC-L-210 and 25.60% for HTCC-L-230, which were higher than those of HTCC-L synthesized at higher hydrothermal temperatures (21.24% for HTCC-L-250, 17.01% for HTCC-L-270, and 19.69% for HTCC-L-290). This result confirms that HTCC-L synthesized at lower temperatures retains more OFGs.
3.3. Possible Adsorption Mechanism of HTCC-L
The adsorption of organic molecules onto the catalyst surface constitutes a pivotal step in the heterogeneous catalytic reaction. We evaluated the adsorption affinity of the HTCC-L towards TC through the adsorption kinetics and isotherms. The adsorption amounts (qt, mg/g) of the HTCC-L samples at different interval times (t, min) can be described with the following formula:
where C0 represents the initial concentration of TC, Ct (mg/L) denotes the TC concentrations at reaction time, V (L) indicates the volume of the TC solution, and m (g) refers to the dosage of hydrochar. The kinetic equations and isotherm fitting models are summarized in Table S4. Firstly, we employed pseudo-first-order (PFO) and pseudo-second-order (PSO) kinetic models to explore the potential adsorption kinetic mechanism of HTCC-L (Figure 5a). The kinetic parameters (k) and correlation coefficients (R2) calculated for the model fits are presented in Table S5. The HTCC-L samples synthesized at lower temperatures (≤270 °C) exhibited a higher degree of conformity with the PSO kinetic model, as evidenced by R2 values ranging from 0.98 to 1.0. This suggests that the rate-determining step of HTCC-L adsorption processes is primarily governed by the abundance of active sites for adsorption in relation to the concentration of TC molecules in solution. When the hydrothermal temperature reached 290 °C, the adsorption behavior of TC on HTCC-L-290 was more consistent with the pseudo-first-order kinetic model (R2 = 0.9723). This can be attributed to the abundant presence of surface cracks and pores on HTCC-L-290, which facilitated diffusion processes of TC.
The intra-particle diffusion model offers a valuable approach for deducing reaction type and predicting rate-controlling stages [35,36]. It is generally believed that the adsorption process involves three steps, including film diffusion, intra-particle diffusion, and adsorption onto active sites [37]. In Table S6, the non-zero intercepts of the intra-particle diffusion model suggest that both internal and external diffusion play a role in adsorption processes on all the HTCC-L samples. In addition, we observed bilinear models in all the HTCC-L samples in Figure 5b, which indicates that the adsorption processes are governed by a multi-step mechanism. The first, steep slope is attributed to the film diffusion of TC through the solution to the external surface of HTCC-L [38]. The subsequent portion describes that intra-particle diffusion limits the adsorption rate in the gradual adsorption stage.
To further elucidate the adsorption behavior between HTCC-L and TC, Figure 5c illustrates the linear correlations among the SSA, pore volume, and equilibrium adsorption capacity of HTCC-L samples (qe). Notably, there was a lack of significant correlations observed between them, as evidenced by the low R2 values of 0.214 for SSA and 0.408 for pore volume. Therefore, it can be postulated that the adsorption performance of HTCC-L for TC is predominantly governed by chemical adsorption rather than pore filling. In addition, HTCC-L-230 with a small SSA was chosen for fitting adsorption isotherms using the Langmuir and Freundlich models (Figure S5). The related parameters of the Langmuir and Freundlich models are presented in Table S7. Compared to the Langmuir model, the adsorption process of TC on HTCC-L-230 exhibited a better fit with the Freundlich model (R2 = 0.9947), indicating that it involves multiple adsorption modes rather than being limited to physical adsorption.
In general, upon ionization in solution, TC can function as both H-bond donors or acceptors, facilitating hydrogen-bonding interactions with numerous functional groups (i.e., –OH, C=O) present on the surface of HTCC-L samples. Furthermore, DFT calculations were conducted to elucidate the molecular-level adsorption mechanism of TC. The electrostatic potential (ESP) distributions of TC are depicted in Figure 5d, where the red area represents regions of low electron density and the blue area represents regions of high electron density. The dimethylamine, amino group, and carbonyl group of TC can engage in electrostatic interactions with surface functional groups of HTCC-L to control the rate of adsorption. In conclusion, the adsorption mechanism of HTCC-L can be attributed to chemisorption, mainly involving hydrogen-bonding interactions and electrostatic interactions.
3.4. Possible Photodegradation Mechanism of HTCC-L
The presence of OFGs on HTCC, particularly the surface carboxyl groups, has been reported to facilitate the photogeneration of ROS, thereby promoting the degradation of organic pollutants under daylight illumination [22]. To investigate the dependence of TC photodegradation under visible light irradiation on the presence of OFGs on HTCC-L, we manipulated the concentration of OFGs on the surface of HTCC-L through oxidation treatment (see Text S3 for details of HTCC-L oxidation treatment). The concentration of OFGs on the surface of HTCC-L after oxidation treatment (HTCC-Lox) was investigated using FT-IR and XPS spectra. As shown in Figure 6a, the intensity of the peak at 1710 cm−1, attributed to the C=O stretching of carboxyl groups, was significantly higher for HTCC-Lox compared to HTCC-L. In the XPS C1s spectra (Figure 6b), three distinct peaks corresponding to C–C, C–OH, and O–C=O can be observed in both HTCC-L and HTCC-Lox samples. Notably, HTCC-Lox has a higher O/C ratio and a greater content of O–C=O compared to HTCC-L (Table S3). However, the introduction of OFGs on the HTCC-Lox surface only resulted in an increase in TC adsorption, without a corresponding enhancement in the synergistic adsorption and photodegradation of TC (Figure 6c). These results suggest that OFGs on the surface of HTCC-L are not the primary active sites for TC degradation. In addition, we employed electron spin resonance (ESR) to detect the potential generation of ROS (·OH, ·O2−, and 1O2). As depicted in Figure S6, no signals of DMPO-OH, DMPO-O2−, or TEMPO were detected in the HTCC-L/visible light system, thus disproving the hypothesis that OFGs on the surface of HTCC-L induced the generation of ROS under visible light irradiation in our experimental setup.
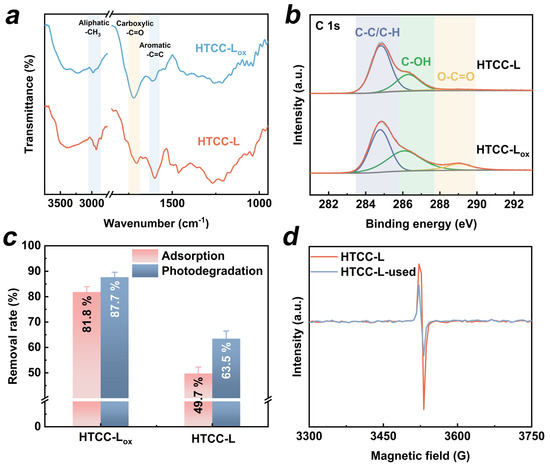
Figure 6.
(a) FT-IR spectra of HTCC-L and HTCC-L after oxidation treatment (HTCC-Lox). (b) High-resolution C 1s XPS spectra of HTCC-L and HTCC-Lox. (c) Adsorption and photodegradation of TC by HTCC-L and HTCC-Lox with and without visible light. (d) Electron paramagnetic resonance signals of HTCC-L and HTCC-L-used.
Several studies have reported that the cleavage of weak linkage bonds, such as C-C and C-X (X represents heteroatomic), in lignin fragments during HTC treatment leads to the generation of unpaired electrons [39,40]. These unpaired electrons exhibit excellent electron delocalization properties and facilitate rapid photogenerated electron transfer under visible light irradiation [41]. We employed electron paramagnetic resonance (EPR) spectra to verify the existence of unpaired electrons in HTCC-L samples. In Figure 6d, the HTCC-L exhibited strong EPR signals, indicating its ability to undergo carrier transition under visible light irradiation. Additionally, the HTCC-L was exposed to visible light for 120 min (referred to as HTCC-L-used), followed by the measurement of its solid EPR signal. As we can see, the concentration of unpaired electrons in HTCC-L decreased after visible light irradiation, as evidenced by the weaker EPR signal observed in HTCC-L-used. It can be inferred that, upon excitation by visible light, the unpaired electrons migrate and are subsequently captured by unsaturated functional groups (i.e., carboxyl group and carbonyl group), thereby reducing the concentration of unpaired electrons in HTCC-L. Based on the above analysis, the photodegradation mechanism in the HTCC-L/visible light system may be as follows: when adsorbing visible light, the unpaired electrons of HTCC-L are excited and subsequently inject into TC adsorbed on the surface of HTCC-L, facilitating further photodegradation of TC.
3.5. Degradation Pathway of TC in the HTCC-L-230/Visible Light System
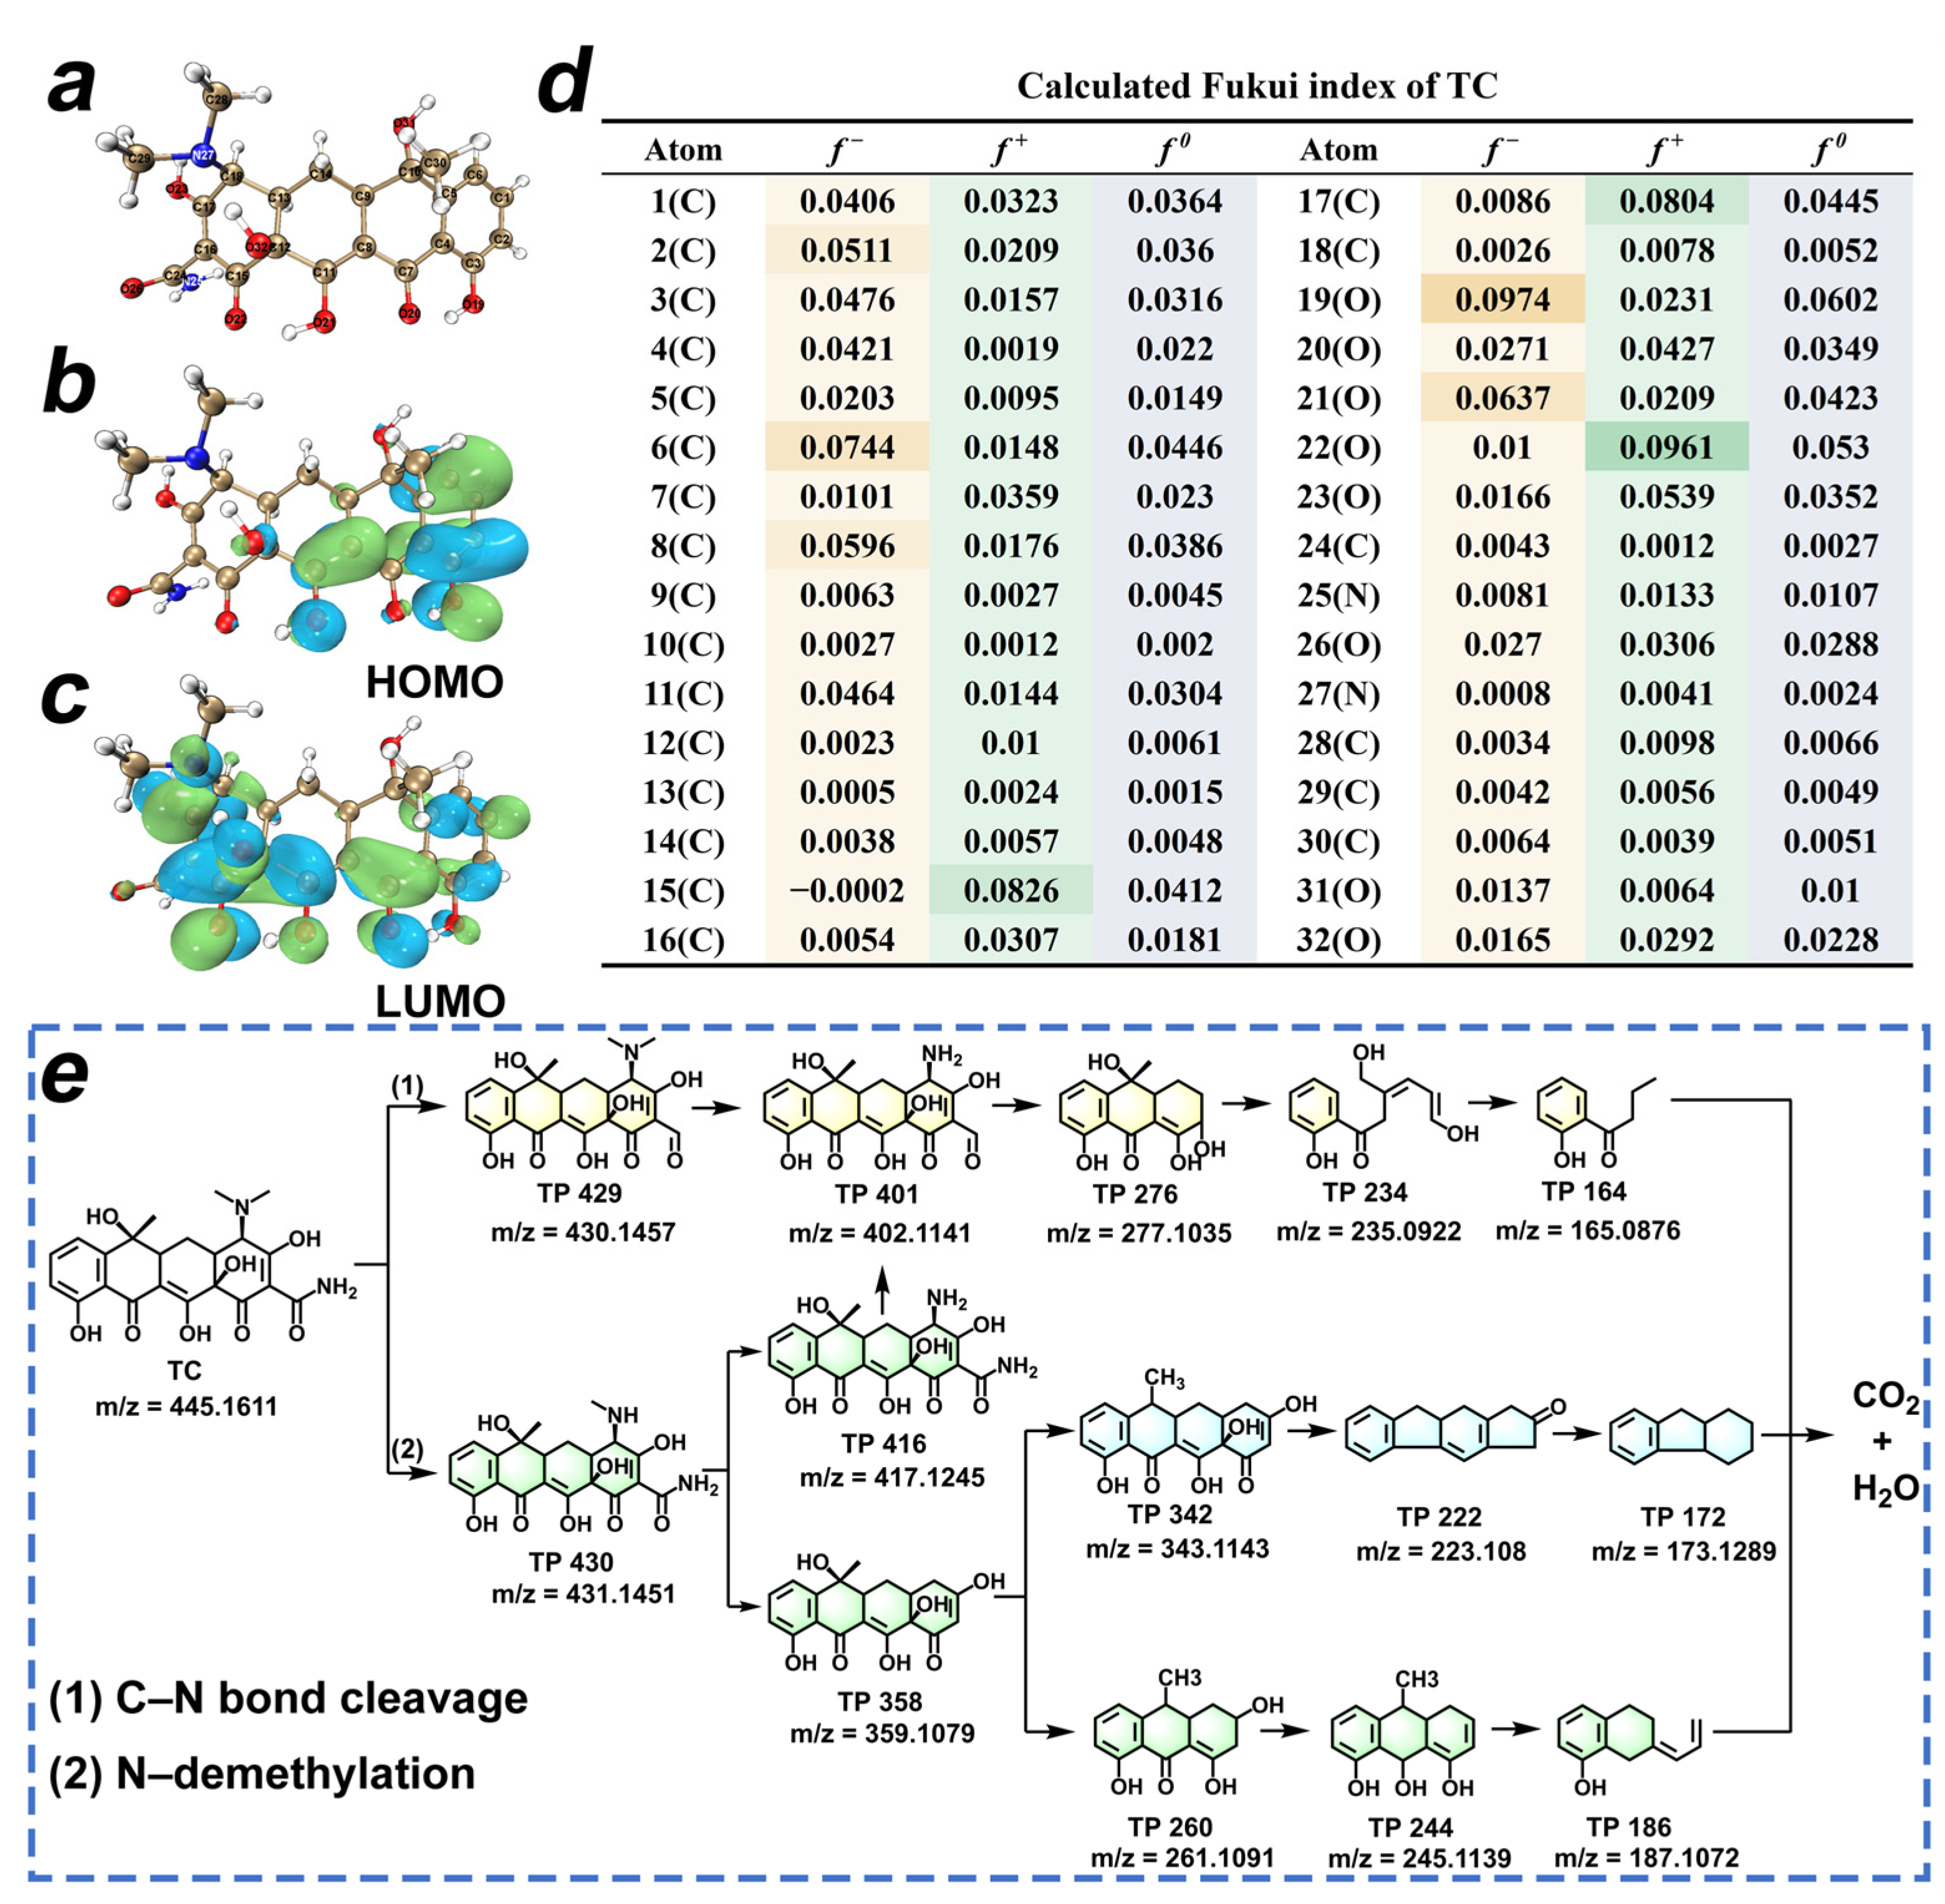
The molecular frontier orbital theory and the CFF, based on DFT calculations, were employed to predict the reactive sites of TC. The optimized chemical structure, the highest occupied molecular orbitals (HOMO), and the lowest unoccupied molecular orbitals (LUMO) of TC are depicted in Figure 7a–c, which can be employed to assess the electron-donating or -accepting ability [42]. In Figure 7d, the Fukui index values corresponding to the f− and f+ are utilized to elucidate the electrophilic attack and nucleophilic attack on TC molecules [43]. In conclusion, the dimethylamine and amide moieties are found to exhibit a higher reactivity, making them the preferred reactive sites of TC. We employed HPLC-QTOF-MS to identify the transformation products (TP) of TC degradation in the HTCC-L-230/visible light system. The positive ionization mode detected twelve compounds of TC, including TC, as shown in Figure S7 and Table S8. In Figure 7e, the possible degradation pathway of TC in HTCC-L-230/visible light system mainly included C–N bond cleavage and N-demethylation. In pathway 1, the TP 429 were generated through C–N bond cleavage of TC, followed by subsequent demethylation to yield TP 401. Then, the TP 401 underwent ring-opening reactions to yield TP 276 and TP 234, after which TP 234 was oxidized to TP 164. In pathway 2, TC was initially N-demethylated to TP 430, followed by further demethylation to TP 416. TP 416 can also undergo C–N bond cleavage and ring-opening to form TP 401, TP 276, TP 234, and TP 164. In addition, TP 430 can be converted to TP 358 by the detachment of aldehydes and N, N-methyl groups. The transformation of TP 358 to TP 260 was achieved through ring-opening, followed by subsequent elimination of methyl and hydroxyl groups resulting in the conversion to TP 244 and TP 186.

Figure 7.
(a) Molecule structure, (b) the highest occupied molecular orbitals, (c) the lowest unoccupied molecular orbitals, and (d) Fukui functions of TC. The isosurface value is 0.02 e/Å3. (e) Schematic illustration of the proposed pathways for TC degradation in the HTCC-L-230/visible light system.
4. Conclusions
In summary, the HTCC was successfully synthesized via HTC treatment to establish an efficient synergy between adsorption and photodegradation. The HTCC derived from cellulose, hemicellulose, and lignin exhibited distinct differences in TC removal. Among them, the HTCC-L samples demonstrated an optimal synergistic effect between TC adsorption and photodegradation abilities, resulting in a 63.5% removal within 120 min. The presence of OFGs on the surface of HTCC-L samples served as the primary adsorption sites for TC. The adsorption mechanism of HTCC-L involved chemisorption, primarily driven by the hydrogen-bonding interactions and electrostatic interactions between OFGs presented on the HTCC-L surface and TC molecules. Moreover, the photodegradation mechanism of HTCC-L relied on a non-radical pathway. The excited, unpaired electrons of HTCC-L transferred electrons to the TC adsorbed on HTCC-L surface, thereby facilitating the photodegradation process of TC.
Supplementary Materials
The following supporting information can be downloaded at: https://www.mdpi.com/article/10.3390/c10030075/s1, Text S1. Identification of TC degradation intermediates; Text S2. ESR analysis; Text S3. Oxidation treatment of HTCC-L-230; Table S1. The textural characteristics of HTCC samples; Table S2. Comparison of surface areas and adsorption capacities of different HTCC; Table S3. The XPS characteristic parameters of HTCC-L samples; Table S4. Detailed information of all the fitting equations, including adsorption kinetic equations and isotherms; Table S5. The parameters of pseudo-first-order and pseudo-second-order kinetic model; Table S6. The parameters of intra-particle diffusion model; Table S7. The parameters of adsorption isotherms model; Table S8. Product, molecular formula, ionization mode, and mass-to-charge ratio of the detected TC transformation products; Figure S1. Synergistic adsorption and photodegradation of TC in the HTCC-L-230/visible light system under different (a) TC concentration and (b) catalyst dosage. Conditions: [TC]0 = 1.0 mg/L, [HTCC-L-230] 0 = 100 mg/L, pH = 6.0, T = 25 °C; Figure S2. SEM images of (a) HTCC-C-230, and (b) HTCC-HC-230; Figure S3. Element mapping for HTCC-L-230; Figure S4. N2 adsorption-desorption isotherms of HTCC-C-230 and HTCC-HC-230; Figure S5. The adsorption isotherms of TC onto HTCC-L-230; Figure S6. ESR signals of (a) DMPO-OH, (b) DMPO-O2-, and (c) TEMPO; Figure S7. Extracted ion chromatogram (EIC) and corresponding MS spectra of (a) residual TC (m/z = 445.1604, [M + H]+), (b) TP 429 (m/z = 430.1456, [M + H]+), (c) TP 401 (m/z = 402.1141, [M + H]+), (d) TP 276 (m/z = 277.1035, [M + H]+), (e) TP 234 (m/z = 235.0922, [M + H]+), (f) TP 164 (m/z = 165.0876, [M + H]+), (g) TP 416 (m/z = 417.1251, [M + H]+), (h) TP 430 (m/z = 431.1451, [M + H]+), (i) TP 358 (m/z = 359.1079, [M + H]+), (j) TP 260 (m/z = 261.1091, [M + H]+), (k) TP 244 (m/z = 245.1139, [M + H]+), and (l) TP 186 (m/z = 187.1073, [M + H]+). Refs. [44,45,46,47,48] are cited in Supplementary Materials file.
Author Contributions
Conceptualization, Y.Z. and J.K.; funding acquisition, Z.C. and J.K.; investigation, X.M. and R.C.; methodology, Y.Z., X.M., Z.C., R.C., Y.G., L.C., J.K., J.S., S.Z. and C.L.; supervision, J.S., S.Z. and C.L.; writing—original draft, Y.Z.; writing—review and editing, Y.G. and L.C. All authors have read and agreed to the published version of the manuscript.
Funding
This work was supported by the National Key Research and Development Program of China (No. 2022YFC3203701), the Heilongjiang Touyan Innovation Team Program (No. HIT-SE-01), and the Open Project of State Key Laboratory of Urban Water Resource and Environment, Harbin Institute of Technology (No. HC202246).
Data Availability Statement
The original data presented in the study are openly available in [FigShare] at [DOI: https://doi.org/10.6084/m9.figshare.26095993.v1] (accessed on 25 June 2024). If you have any queries, please do not hesitate to contact the corresponding author.
Conflicts of Interest
The authors declare that they have no known competing financial interests or personal relationships that could have appeared to influence the work reported in this paper.
References
- Zeng, J.; Xie, W.; Guo, Y.; Zhao, T.; Zhou, H.; Wang, Q.; Li, H.; Guo, Z.; Xu, B.B.; Gu, H. Magnetic Field Facilitated Electrocatalytic Degradation of Tetracycline in Wastewater by Magnetic Porous Carbonized Phthalonitrile Resin. Appl. Catal. B Environ. 2024, 340, 123225. [Google Scholar] [CrossRef]
- Hsini, A.; Haounati, R.; Imgharn, A.; Naciri, Y.; Malekshah, R.E.; Shaim, A.; Szunerits, S.; Boukherroub, R.; Albourine, A. 1,2,4,5-Benzene Tetracarboxylic Acid-Doped Polyaniline/Protonated Carbon Nitride Nanostructures for Cr (VI) Adsorption in Water. ACS Appl. Nano Mater. 2024, 7, 13050–13061. [Google Scholar] [CrossRef]
- Tang, R.; Gong, D.; Deng, Y.; Xiong, S.; Zheng, J.; Li, L.; Zhou, Z.; Su, L.; Zhao, J. π-π Stacking Derived from Graphene-like Biochar/g-C3N4 with Tunable Band Structure for Photocatalytic Antibiotics Degradation via Peroxymonosulfate Activation. J. Hazard. Mater. 2022, 423, 126944. [Google Scholar] [CrossRef]
- Largo, F.; Haounati, R.; Ighnih, H.; Malekshah, R.E.; Rhaya, M.; Ouachtak, H.; El Hankari, S.; Jada, A.; Addi, A.A. Effective Removal of Toxic Dye from Wastewater via Advanced Modified Magnetic Sepiolite Using Combined Surfactants SDS/CTAB/Fe3O4@Sep: Empirical and Computational Analysis Studies. J. Mol. Liq. 2024, 407, 125114. [Google Scholar] [CrossRef]
- Wang, A.; Ni, J.; Wang, W.; Liu, D.; Zhu, Q.; Xue, B.; Chang, C.-C.; Ma, J.; Zhao, Y. MOF Derived Co−Fe Nitrogen Doped Graphite Carbon@crosslinked Magnetic Chitosan Micro−nanoreactor for Environmental Applications: Synergy Enhancement Effect of adsorption−PMS Activation. Appl. Catal. B Environ. 2022, 319, 121926. [Google Scholar] [CrossRef]
- Xu, Q.; Zhang, L.; Cheng, B.; Fan, J.; Yu, J. S-Scheme Heterojunction Photocatalyst. Chem 2020, 6, 1543–1559. [Google Scholar] [CrossRef]
- He, X.; Zheng, N.; Hu, R.; Hu, Z.; Yu, J.C. Hydrothermal and Pyrolytic Conversion of Biomasses into Catalysts for Advanced Oxidation Treatments. Adv. Funct. Mater. 2021, 31, 2006505. [Google Scholar] [CrossRef]
- Libra, J.A.; Ro, K.S.; Kammann, C.; Funke, A.; Berge, N.D.; Neubauer, Y.; Titirici, M.-M.; Fühner, C.; Bens, O.; Kern, J.; et al. Hydrothermal Carbonization of Biomass Residuals: A Comparative Review of the Chemistry, Processes and Applications of Wet and Dry Pyrolysis. Biofuels 2011, 2, 71–106. [Google Scholar] [CrossRef]
- Mi, Y.; Hu, W.; Dan, Y.; Liu, Y. Synthesis of Carbon Micro-Spheres by a Glucose Hydrothermal Method. Mater. Lett. 2008, 62, 1194–1196. [Google Scholar] [CrossRef]
- Liiv, J.; Mäeorg, U.; Vaino, N.; Rikmann, E. Low-Temperature and Low-Pressure HydroThermal Liquefaction (L-HTL) of Biomass Using Ultrasonic Cavitation to Achieve a Local Supercritical State in Water. Sci. Technol. Energy Transit. 2024, 79, 3. [Google Scholar] [CrossRef]
- Rikmann, E.; Mäeorg, U.; Liiv, J. Recycling of Low-Quality Carbon Black Produced by Tire Pyrolysis. Appl. Sci. 2024, 14, 2192. [Google Scholar] [CrossRef]
- Gong, Y.; Wang, H.; Wei, Z.; Xie, L.; Wang, Y. An Efficient Way to Introduce Hierarchical Structure into Biomass-Based Hydrothermal Carbonaceous Materials. ACS Sustain. Chem. Eng. 2014, 2, 2435–2441. [Google Scholar] [CrossRef]
- Wang, T.; Zhai, Y.; Zhu, Y.; Li, C.; Zeng, G. A Review of the Hydrothermal Carbonization of Biomass Waste for Hydrochar Formation: Process Conditions, Fundamentals, and Physicochemical Properties. Renew. Sustain. Energy Rev. 2018, 90, 223–247. [Google Scholar] [CrossRef]
- Sun, K.; Ro, K.; Guo, M.; Novak, J.; Mashayekhi, H.; Xing, B. Sorption of Bisphenol A, 17α-Ethinyl Estradiol and Phenanthrene on Thermally and Hydrothermally Produced Biochars. Bioresour. Technol. 2011, 102, 5757–5763. [Google Scholar] [CrossRef]
- Tian, W.; Zhang, H.; Sun, H.; Tadé, M.O.; Wang, S. One-Step Synthesis of Flour-Derived Functional Nanocarbons with Hierarchical Pores for Versatile Environmental Applications. Chem. Eng. J. 2018, 347, 432–439. [Google Scholar] [CrossRef]
- Xu, L.; Liu, Y.; Hu, Z.; Yu, J.C. Converting Cellulose Waste into a High-Efficiency Photocatalyst for Cr(VI) Reduction via Molecular Oxygen Activation. Appl. Catal. B Environ. 2021, 295, 120253. [Google Scholar] [CrossRef]
- Hu, Z.; Yu, J.C.; Ming, T.; Wang, J. A Wide-Spectrum-Responsive TiO2 Photoanode for Photoelectrochemical Cells. Appl. Catal. B Environ. 2015, 168–169, 483–489. [Google Scholar] [CrossRef]
- Hu, Z.; Liu, G.; Chen, X.; Shen, Z.; Yu, J.C. Enhancing Charge Separation in Metallic Photocatalysts: A Case Study of the Conducting Molybdenum Dioxide. Adv. Funct. Mater. 2016, 26, 4445–4455. [Google Scholar] [CrossRef]
- Glenis, S.; Benz, M.; LeGoff, E.; Schindler, J.L.; Kannewurf, C.R.; Kanatzidis, M.G. Polyfuran: A New Synthetic Approach and Electronic Properties. J. Am. Chem. Soc. 1993, 115, 12519–12525. [Google Scholar] [CrossRef]
- Wang, G.; Bi, W.; Zhang, Q.; Dong, X.; Zhang, X. Hydrothermal Carbonation Carbon-Based Photocatalysis under Visible Light: Modification for Enhanced Removal of Organic Pollutant and Novel Insight into the Photocatalytic Mechanism. J. Hazard. Mater. 2022, 426, 127821. [Google Scholar] [CrossRef] [PubMed]
- Fang, G.; Liu, C.; Wang, Y.; Dionysiou, D.D.; Zhou, D. Photogeneration of Reactive Oxygen Species from Biochar Suspension for Diethyl Phthalate Degradation. Appl. Catal. B Environ. 2017, 214, 34–45. [Google Scholar] [CrossRef]
- Chen, N.; Huang, Y.; Hou, X.; Ai, Z.; Zhang, L. Photochemistry of Hydrochar: Reactive Oxygen Species Generation and Sulfadimidine Degradation. Environ. Sci. Technol. 2017, 51, 11278–11287. [Google Scholar] [CrossRef] [PubMed]
- Basak, B.; Kumar, R.; Bharadwaj, A.V.S.L.S.; Kim, T.H.; Kim, J.R.; Jang, M.; Oh, S.-E.; Roh, H.-S.; Jeon, B.-H. Advances in Physicochemical Pretreatment Strategies for Lignocellulose Biomass and Their Effectiveness in Bioconversion for Biofuel Production. Bioresour. Technol. 2023, 369, 128413. [Google Scholar] [CrossRef] [PubMed]
- Lu, T.; Chen, Q. Realization of Conceptual Density Functional Theory and Information-Theoretic Approach in Multiwfn Program. In Conceptual Density Functional Theory, 2nd ed.; Liu, S., Ed.; WILEY-VCH GmbH: Weinheim, Germany, 2022; Volume 2, pp. 631–647. [Google Scholar]
- Lu, T.; Chen, F. Multiwfn: A Multifunctional Wavefunction Analyzer. J. Comput. Chem. 2012, 33, 580–592. [Google Scholar] [CrossRef]
- Li, Z.; Schulz, L.; Ackley, C.; Fenske, N. Adsorption of Tetracycline on Kaolinite with pH-Dependent Surface Charges. J. Colloid Interface Sci. 2010, 351, 254–260. [Google Scholar] [CrossRef]
- Kang, S.; Li, X.; Fan, J.; Chang, J. Characterization of Hydrochars Produced by Hydrothermal Carbonization of Lignin, Cellulose, d -Xylose, and Wood Meal. Ind. Eng. Chem. Res. 2012, 51, 9023–9031. [Google Scholar] [CrossRef]
- Falco, C.; Baccile, N.; Titirici, M.-M. Morphological and Structural Differences between Glucose, Cellulose and Lignocellulosic Biomass Derived Hydrothermal Carbons. Green Chem. 2011, 13, 3273. [Google Scholar] [CrossRef]
- Lou, R.; Wu, S. Products Properties from Fast Pyrolysis of Enzymatic/Mild Acidolysis Lignin. Appl. Energy 2011, 88, 316–322. [Google Scholar] [CrossRef]
- Liu, X.; Lu, J.; Fu, M.; Zheng, H.; Chen, Q. Activated Carbon Induced Hydrothermal Carbonization for the Treatment of Cotton Pulp Black Liquor. J. Water Process Eng. 2022, 47, 102733. [Google Scholar] [CrossRef]
- Kim, P.; Johnson, A.; Edmunds, C.W.; Radosevich, M.; Vogt, F.; Rials, T.G.; Labbé, N. Surface Functionality and Carbon Structures in Lignocellulosic-Derived Biochars Produced by Fast Pyrolysis. Energy Fuels 2011, 25, 4693–4703. [Google Scholar] [CrossRef]
- Keiluweit, M.; Nico, P.S.; Johnson, M.G.; Kleber, M. Dynamic Molecular Structure of Plant Biomass-Derived Black Carbon (Biochar). Environ. Sci. Technol. 2010, 44, 1247–1253. [Google Scholar] [CrossRef]
- Chia, C.H.; Gong, B.; Joseph, S.D.; Marjo, C.E.; Munroe, P.; Rich, A.M. Imaging of Mineral-Enriched Biochar by FTIR, Raman and SEM–EDX. Vib. Spectrosc. 2012, 62, 248–257. [Google Scholar] [CrossRef]
- Singh, B.; Fang, Y.; Cowie, B.C.C.; Thomsen, L. NEXAFS and XPS Characterisation of Carbon Functional Groups of Fresh and Aged Biochars. Org. Geochem. 2014, 77, 1–10. [Google Scholar] [CrossRef]
- Cheng, Y.; Wang, B.; Shen, J.; Yan, P.; Kang, J.; Wang, W.; Bi, L.; Zhu, X.; Li, Y.; Wang, S.; et al. Preparation of Novel N-Doped Biochar and Its High Adsorption Capacity for Atrazine Based on π–π Electron Donor-Acceptor Interaction. J. Hazard. Mater. 2022, 432, 128757. [Google Scholar] [CrossRef]
- Wang, A.; Ni, J.; Wang, W.; Wang, X.; Liu, D.; Zhu, Q. MOF-Derived N-Doped ZnO Carbon Skeleton@hierarchical Bi2MoO6 S-Scheme Heterojunction for Photodegradation of SMX: Mechanism, Pathways and DFT Calculation. J. Hazard. Mater. 2022, 426, 128106. [Google Scholar] [CrossRef] [PubMed]
- Yu, F.; Li, Y.; Huang, G.; Yang, C.; Chen, C.; Zhou, T.; Zhao, Y.; Ma, J. Adsorption Behavior of the Antibiotic Levofloxacin on Microplastics in the Presence of Different Heavy Metals in an Aqueous Solution. Chemosphere 2020, 260, 127650. [Google Scholar] [CrossRef]
- Cheung, W.H.; Szeto, Y.S.; McKay, G. Intraparticle Diffusion Processes during Acid Dye Adsorption onto Chitosan. Bioresour. Technol. 2007, 98, 2897–2904. [Google Scholar] [CrossRef]
- Liao, S.; Pan, B.; Li, H.; Zhang, D.; Xing, B. Detecting Free Radicals in Biochars and Determining Their Ability to Inhibit the Germination and Growth of Corn, Wheat and Rice Seedlings. Environ. Sci. Technol. 2014, 48, 8581–8587. [Google Scholar] [CrossRef]
- Qin, Y.; Li, G.; Gao, Y.; Zhang, L.; Ok, Y.S.; An, T. Persistent Free Radicals in Carbon-Based Materials on Transformation of Refractory Organic Contaminants (ROCs) in Water: A Critical Review. Water Res. 2018, 137, 130–143. [Google Scholar] [CrossRef] [PubMed]
- Xie, Z.-K.; Jia, Y.-J.; Huang, Y.-Y.; Xu, D.-B.; Wu, X.-J.; Chen, M.; Shi, W.-D. Near-Infrared Light-Driven Photocatalytic Reforming Lignocellulose into H2 and Chemicals over Heterogeneous Carbon Nitride. ACS Catal. 2023, 13, 13768–13776. [Google Scholar] [CrossRef]
- Gong, Y.; Shen, J.; Wu, Y.; Shen, L.; Zhao, S.; Zhou, Y.; Li, Y.; Cui, L.; Kang, J.; Chen, Z. Ligands-Triggered Evolution of Catalytic Intermediates during Periodate Activation via Soluble Mn (II) for Organic Contaminants’ Abatement. Appl. Catal. B Environ. 2023, 322, 122093. [Google Scholar] [CrossRef]
- Gao, T.; Zhang, H.; Zhao, X.; Xiao, S.; Zhang, Z.; Yu, S. Efficient Removal of Tetracycline from MOF-on-MOF Heterojunctions Driven by Visible Light: Evaluation of Photocatalytic Mechanisms and Degradation Pathway. Appl. Surf. Sci. 2024, 651, 159227. [Google Scholar] [CrossRef]
- Li, Y.; Meas, A.; Shan, S.; Yang, R.; Gai, X. Production and Optimization of Bamboo Hydrochars for Adsorption of Congo Red and 2-Naphthol. Bioresour. Technol. 2016, 207, 379–386. [Google Scholar] [CrossRef] [PubMed]
- Zhang, X.; Zhang, Y.; Ngo, H.H.; Guo, W.; Wen, H.; Zhang, D.; Li, C.; Qi, L. Characterization and Sulfonamide Antibiotics Adsorption Capacity of Spent Coffee Grounds Based Biochar and Hydrochar. Sci. Total Environ. 2020, 716, 137015. [Google Scholar] [CrossRef] [PubMed]
- Guan, J.; Liu, Y.; Jing, F.; Ye, R.; Chen, J. Contrasting Impacts of Chemical and Physical Ageing on Hydrochar Properties and Sorption of Norfloxacin with Coexisting Cu2+. Sci. Total Environ. 2021, 772, 145502. [Google Scholar] [CrossRef] [PubMed]
- Tran, T.H.; Le, A.H.; Pham, T.H.; Nguyen, D.T.; Chang, S.W.; Chung, W.J.; Nguyen, D.D. Adsorption Isotherms and Kinetic Modeling of Methylene Blue Dye onto a Carbonaceous Hydrochar Adsorbent Derived from Coffee Husk Waste. Sci. Total Environ. 2020, 725, 138325. [Google Scholar] [CrossRef] [PubMed]
- Ye, H.; Luo, Y.; Yang, T.; Xue, M.; Yin, Z.; Gao, B. Effects of Ball Milling on Hydrochar for Integrated Adsorption and Photocatalysis Performance. Sep. Purif. Technol. 2025, 354, 128687. [Google Scholar] [CrossRef]


Disclaimer/Publisher’s Note: The statements, opinions and data contained in all publications are solely those of the individual author(s) and contributor(s) and not of MDPI and/or the editor(s). MDPI and/or the editor(s) disclaim responsibility for any injury to people or property resulting from any ideas, methods, instructions or products referred to in the content. |
© 2024 by the authors. Licensee MDPI, Basel, Switzerland. This article is an open access article distributed under the terms and conditions of the Creative Commons Attribution (CC BY) license (https://creativecommons.org/licenses/by/4.0/).