Article

Transcriptomic Analysis of Cell Stress Response in Wickerhamomyces anomalus H4 Under Octanoic Acid Stress

College of Food and Pharmaceutical Engineering, Guizhou Institute of Technology, Guiyang 550003, China
*
Author to whom correspondence should be addressed.
Fermentation 2024, 10(11), 563; https://doi.org/10.3390/fermentation10110563
Submission received: 20 September 2024 / Revised: 24 October 2024 / Accepted: 25 October 2024 / Published: 4 November 2024

Abstract

:
The purified yeast strain H4, identified as W. anomalus through morphological, genetic, and phylogenetic analyses, was characterized and compared to a commercial Saccharomyces cerevisiae strain X16. W. anomalus H4 exhibited distinct morphological features. It demonstrated notable tolerance to 11% ethanol, 220 g/L glucose, and 200 mg/L octanoic acid, similar to X16, except for having a lower tolerance to SO2. Survival analysis under various stress conditions revealed that ethanol and octanoic acid had the most detrimental effects, with 56% cell mortality at 13% ethanol and 400 mg/L octanoic acid. Transcriptomic analysis under octanoic acid stress showed that at 200 mg/L, 3369 differentially expressed genes (DEGs) were induced, with 1609 being upregulated and 1760 downregulated, indicating broad transcriptional reprogramming. At 400 mg/L, only 130 DEGs were detected, suggesting a more limited response. KEGG pathway analysis indicated that most DEGs at 200 mg/L were associated with the “ribosome” and “proteasome” pathways, reflecting disruptions in protein synthesis and turnover. At 400 mg/L, the DEGs were primarily related to “DNA replication” and “pyruvate metabolism”. These findings highlight the adaptive mechanisms of W. anomalus H4 to environmental stresses, particularly octanoic acid, and its potential for use in brewing and fermentation processes.

1. Introduction

The yeast species W. anomalus, previously known as Pichia anomala or Hansenula anomala [1,2], is a member of the phylum Ascomycota and is broadly distributed across diverse environments, such as soil, water, and fruits [2]. This non-Saccharomyces yeast species has gained significant interest in the food industry due to its multifaceted roles and applications.
Specific strains of W. anomalus have been extensively investigated for their bio-preservative properties in postharvest systems and as additives in animal feeds and foods, which enhance protein content and phytase activity [3]. Notably, W. anomalus can control postharvest diseases in kiwifruit by modulating the fungal community and promoting beneficial interactions within the microbiota, thereby reducing pathogen populations [4]. Additionally, this yeast species contributes positively to the flavor profile of alcoholic beverages, and it can also lead to spoilage when present in excessive amounts [5].
W. anomalus has been studied for its potential to improve the fermentation efficiency and quality of alcoholic beverages, given its ability to thrive and ferment under high sugar and alcohol concentrations, making it suitable for the production of fortified wines and spirits [6]. For instance, the addition of W. anomalus to the fermentation process of Baijiu, a traditional Chinese liquor, boosts the ester content, particularly that of ethyl acetate, and alters the microbial community, thereby enhancing the overall flavor [7].
The unique physiological characteristics and metabolic capabilities of W. anomalus make it a valuable organism for industrial applications, particularly in the food sector, attracting increasing research interest. In recent years, an expanding number of W. anomalus strains have been isolated and characterized from various food systems, with applications ranging from fermentation and food processing [8] to agriculture [9] and medicine [10].
For example, W. anomalus strain Y3, isolated from Sichuan paocai juice, enhanced the aroma, tolerated high salinity and specific pH levels, and produced ester contents up to 1.22 g/L, contributing to distinctive flavors [11]. Strain HN006, isolated from zaopei samples, improved the aroma of fermented lily rice wine [12]. Strain WaF17.12 was found to produce a killer toxin that affects the early sporogonic stages of Plasmodium berghei, leading to membrane damage and parasite death [13].
This investigation builds upon our previous findings, wherein we observed that among various strains fermenting Rosa roxburghii (CiLi) wine, the content of octanoic acid was notably high (345–803 μg/L), with an Odor Activity Value (OAV) ≥ 2 [14]. This observation prompted an inquiry into the mechanisms enabling yeast strains to withstand high levels of octanoic acid during fermentation. Literature reviews indicate that octanoic acid serves as a crucial precursor for biofuel synthesis [15], suggesting that identifying strains with robust tolerance to octanoic acid could hold substantial implications for the development of novel energy resources.
In light of these considerations, our laboratory has directed its efforts towards this area. The existing literature predominantly focuses on the tolerance of Saccharomyces cerevisiae to octanoic acid, with studies typically examining concentrations ranging from 14.4 mg/L [16] to 125.3 mg/L [17]. However, research on non-Saccharomyces yeasts remains limited.
Here, we report the isolation and characterization of a strain of W. anomalus from dragon fruit (Hylocereus polyrhizus). This strain, designated as “H4”, exhibits notable fermentation performance and high-concentration octanoic acid resistance. Our objectives include investigating the physiological and molecular characteristics of strain H4, with a particular emphasis on its response to environmental stresses pertinent to the fermentation industry. Understanding the stress tolerance mechanisms of W. anomalus H4 will provide valuable insights into its potential applications in the fermentation and food industries.

2. Materials and Methods

2.1. Isolation and Identification

2.1.1. Isolation

A 100 g sample of a mixture consisting of both the peel and pulp of dragon fruit sourced from Guan Ling County, Guizhou Province, China, was subjected to spontaneous fermentation within 100 mL of YPD broth (comprising 1% yeast extract, 2% peptone, and 2% glucose) over a period of five days at 30 °C and under agitation at 180 rpm. Following this fermentation phase, dilutions of the resultant culture were prepared by serially diluting the sample 10−5 and 10−6 times with a 0.9% NaCl solution. Aliquots of 0.1 mL from these dilutions were then spread-plated onto TTC lower agar medium, which consisted of 1% glucose, 0.2% peptone, 0.1% KH2PO4, 0.15% yeast extract, 0.04% MgSO4·7H2O, and 1.5% agar. Plates were incubated inverted at 30 °C for 2–3 days. Plates exhibiting a colony-forming unit (CFU) count between 100 and 300 were chosen for further processing. These plates were overlaid with 12 mL of TTC upper agar, containing 0.05% TTC (triphenyl tetrazolium chloride) filtered through a 0.22 μm membrane, 0.5% glucose, and 1.5% agar. The overlaid plates were then incubated in the dark at 30 °C for an additional 2–3 h. Colonies that turned red were selected and purified on WLN agar. This agar medium comprised 0.4% yeast extract, 0.5% peptone, 5% glucose, 2% agar, 40 mL/L of storage solution A (1.375% KH2PO4, 1.0625% KCl, 0.3125% CaCl2, 0.3125% MgSO4·7H2O), 1 mL/L of storage solution B (0.25% FeCl3, 0.25% MnSO4), and 1 mL/L of storage solution C (0.44 g bromocresol green dissolved in 10 mL of sterile distilled water and 10 mL of 95% ethanol). Pure cultures of the isolated yeasts were preserved by cryopreservation at −80 °C using 15% sterile glycerol as a cryoprotectant. Unless otherwise noted, the concentration of all reagents used is reported in a mass–volume ratio (g/100 mL).

2.1.2. Identification

Photographs of colony morphology were taken from YPD, TTC, and WLN plates after three days of incubation. Microscopic characteristics, including morphology and budding patterns, were observed using an optical microscope (model CX40, SOPTOP, Ningbo, China).
For molecular identification, two genomic regions were targeted: ITS1-5.8S rDNA-ITS2 and the D1/D2 domain of the 26S rDNA [18]. The PCR amplification of the ITS1-5.8S rDNA-ITS2 region was performed using primers ITS1 (5′-GTCGTAACAAGGTTTCCGTAGGTG-3′) and ITS4 (5′-TCCTCCGCTTATTGATATGC-3′), targeting a product size of approximately 800 bp (Bai, 2002) [19]. The amplification of the D1/D2 domain of the 26S rDNA was conducted using primers NL1 (5′-GCATATCAATAAGCGGAGGAAAAG-3′) and NL4 (5′-GGTCCGTGTTTCAAGACGG-3′), aiming for a product size of around 600 bp [18].
PCRs were set up in a final volume of 50 μL, containing 1× Taq PCR Master Mix (Sangon Biotech, Shanghai, China), 0.4 μM of each primer, and 2 μL of yeast culture. The PCR was conducted on a JS-G9612 thermal cycler (Peiqing Science & Technology, Shanghai, China) under the following conditions: an initial denaturation step at 97 °C for 5 min, followed by 30 cycles of denaturation at 96 °C for 30 s, annealing at 54 °C for 1 min, and extension at 72 °C for 1.5 min. The PCR protocol concluded with a final extension step of 10 min at 72 °C.
The amplified PCR products were analyzed by electrophoresis on a 1% (w/v) agarose gel (BIOWESTE, Agarose G-10, Shanghai, China) in 1× TAE buffer, run at 100 V for 30 min. Gels were stained with Goodview (Sangon Biotech, China) and visualized under UV light. A 100–1500 bp molecular weight marker (Sangon Biotech, China) was used as a reference. The PCR products of the targeted regions were sequenced (Sangon Biotech, China), and the sequences were compared with those available in the NCBI GenBank nucleotide sequence database. The sequences obtained were deposited in the database with assigned accession numbers.
Following the assembly of the two targeted regions, phylogenetic analysis was conducted using MEGA 11.0 [20], employing the Neighbor-Joining method.

2.2. Growth Curve Analysis

To assess the growth curves of the candidate yeast strains under different temperature conditions (18 °C, 24 °C, and 30 °C), cultures were initiated in 15 mL glass tubes containing 10 mL of YPD liquid broth, under agitation at 180 rpm (round per minute). The initial yeast inoculum was standardized to 1 × 10⁶ colony-forming units per milliliter (CFU/mL). Growth curves were constructed based on spectral absorbance measurements at 600 nm, recorded every 20 h over a period of five consecutive days using an enzyme-linked immunosorbent assay (ELISA) reader (model HBS-1096A, DeTie, Nanjing, China).

2.3. Brewing Potential and Survival Analysis

To evaluate the tolerance of the candidate yeast strains to various stressors, they were inoculated into YPD broth at a concentration of 1 × 10⁶ CFU/mL and exposed to different levels of the following: (1) sulfur dioxide (SO2) at concentrations of 50, 100, 150, 200, 250, 300, 350, and 400 mg/L; (2) pH values of 2.8, 3.0, 3.2, 3.4, 3.6, 4.0, 4.2, and 4.4, adjusted using tartaric acid; (3) glucose contents of 80, 100, 120, 140, 160, 180, 200, and 220 g/L; (4) ethanol concentrations of 3%, 5%, 7%, 9%, 11%, 13%, 15%, and 17% (v/v); and (5) octanoic acid mass fractions of 50, 100, 150, 200, 250, 300, 350, and 400 mg/L. All treatments were conducted in triplicate, and the cultures were incubated at 30 °C and 180 rpm for 72 h. Optical density (OD) at 600 nm (A600) was measured at the end of the incubation period.
For survival analysis, the yeast cells were exposed to the aforementioned stress factors and their respective concentrations. To assist in assessing the performance on solid media, at 0 and 6 h post-exposure, the yeast cells were harvested, washed twice with distilled water, and resuspended in distilled water to achieve a uniform cell concentration (A600 = 1.0). The cell suspension was then diluted to 100, 10−2, and 10−4, and 2 μL of each dilution was spotted onto YPD agar plates. The plates were incubated at 30 °C for 36 h, and the resulting colonies were observed and photographed using a digital camera (Canon, Tokyo, Japan).
To monitor cell viability over 6 h, methylene blue staining was applied to the aforementioned resuspended cell suspension adjusted to an OD600 of 1.0. Temporary slides were prepared from these suspensions for observation under a microscope (SOPTOP CX40, China). Cells stained blue were identified as dead, while those not stained blue were considered alive. The death rate was calculated by counting the number of dead and live cells in ten randomly selected areas on the slide [21].

2.4. Transcriptomics Analysis

To investigate the transcriptional response of candidate yeast strains to octanoic acid, cells were exposed to 0, 200, and 400 mg/L of octanoic acid for 6 h. During this period, the cells were cultivated under aerobic conditions at 180 rpm and 30 °C. Following treatment, the cells were collected by centrifugation at 10,000 rpm for 5 min, rapidly frozen in liquid nitrogen, and stored at −80 °C for transcriptomic analysis.
Total RNA was extracted using Trizol reagent (Invitrogen, Carlsbad, CA, USA). Three micrograms of total RNA was used as input material for library preparation. The sequencing libraries were generated through the following steps: (1) mRNA was purified from the total RNA using poly-T oligo-attached magnetic beads; (2) the mRNA was fragmented using divalent cations in an elevated temperature buffer provided by Illumina (San Diego, CA, USA); (3) first-strand cDNA synthesis was performed using random hexamers and SuperScript II Reverse Transcriptase; (4) second-strand cDNA synthesis was carried out using DNA Polymerase I and RNase H; (5) overhanging ends were converted into blunt ends using exonuclease and polymerase activities, followed by the removal of the enzymes; (6) the adenylation of the 3′ ends of the DNA fragments was performed; (7) Illumina PE adapter oligonucleotides were ligated to the DNA fragments; (8) fragments with adapter molecules on both ends were purified using the AMPure XP system (Beckman Coulter, Beverly, CA, USA) to select for cDNA fragments of approximately 400–500 bp in length; (9) the purified DNA fragments were selectively enriched using Illumina PCR Primer Cocktail in a PCR; (10) the final library products were purified using the AMPure XP kit (Beckman, CA, USA)and quantified using the Agilent High Sensitivity DNA Kit on the Bioanalyzer 2100 system (Agilent, Santa Clara, CA, USA); and (11) the prepared libraries were sequenced on the NovaSeq 6000 platform (Illumina) by Shanghai Personal Biotechnology Co. Ltd. (Shanghai, China).
The raw sequencing reads were aligned to the reference genome using HISAT v2.0.5. To identify differentially expressed genes (DEGs), the expression levels were normalized using the fragments per kilobase of transcript per million mapped reads (FPKM) method. The differential expression of genes was analyzed using DESeq 1.30.0, with screening criteria as follows: |log2FoldChange|> 1, and significant p < 0.05.
In addition, all genes were mapped to terms in the Gene Ontology (GO) database, and the number of differentially enriched genes in each term was calculated. TopGO was employed to perform GO enrichment analysis on the differentially expressed genes to identify GO terms that were significantly enriched, thereby determining the primary biological functions performed by these genes. ClusterProfiler 3.4.4 was used to conduct the enrichment analysis of the Kyoto Encyclopedia of Genes and Genomes (KEGG) pathways, focusing on pathways with significant enrichment (p-value < 0.05).

2.5. Statistics

All experiments were conducted in triplicate, and the results were expressed as the mean ± standard deviation. Statistical analyses were performed using SPSS software (IBM Corp., version 23.0, Armonk, NY, USA). Significant differences among the samples were determined using a one-way analysis of variance (ANOVA) at the 5% significance level (p < 0.05). Graphical representations of the data were created using GraphPad Prism 8.0.1 (San Diego, CA, USA).

3. Results and Discussion

3.1. Screening and Identification of Yeast Strains

The purified strain H4 was streaked onto YPD, TTC, and WLN agar plates, and a commercial Saccharomyces cerevisiae strain, X16, was used as a control. As depicted in Figure 1, after 72 h of incubation at 30 °C on YPD agar, both strain H4 and strain X16 exhibited white colonies with a convex and opaque topography. These morphological characteristics are consistent with observations reported for W. anomalus BKK11-4, which was isolated and characterized for the co-production of glycerol and arabitol [22]. On TTC agar, the red coloration of H4 was more intense compared to that of X16. On WLN agar, H4 formed flat colonies with a blue central area and a white margin, whereas X16 produced colonies with a raised center, a white central area, and a green margin. Microscopic examination revealed that the cell size of H4 was smaller than that of X16.
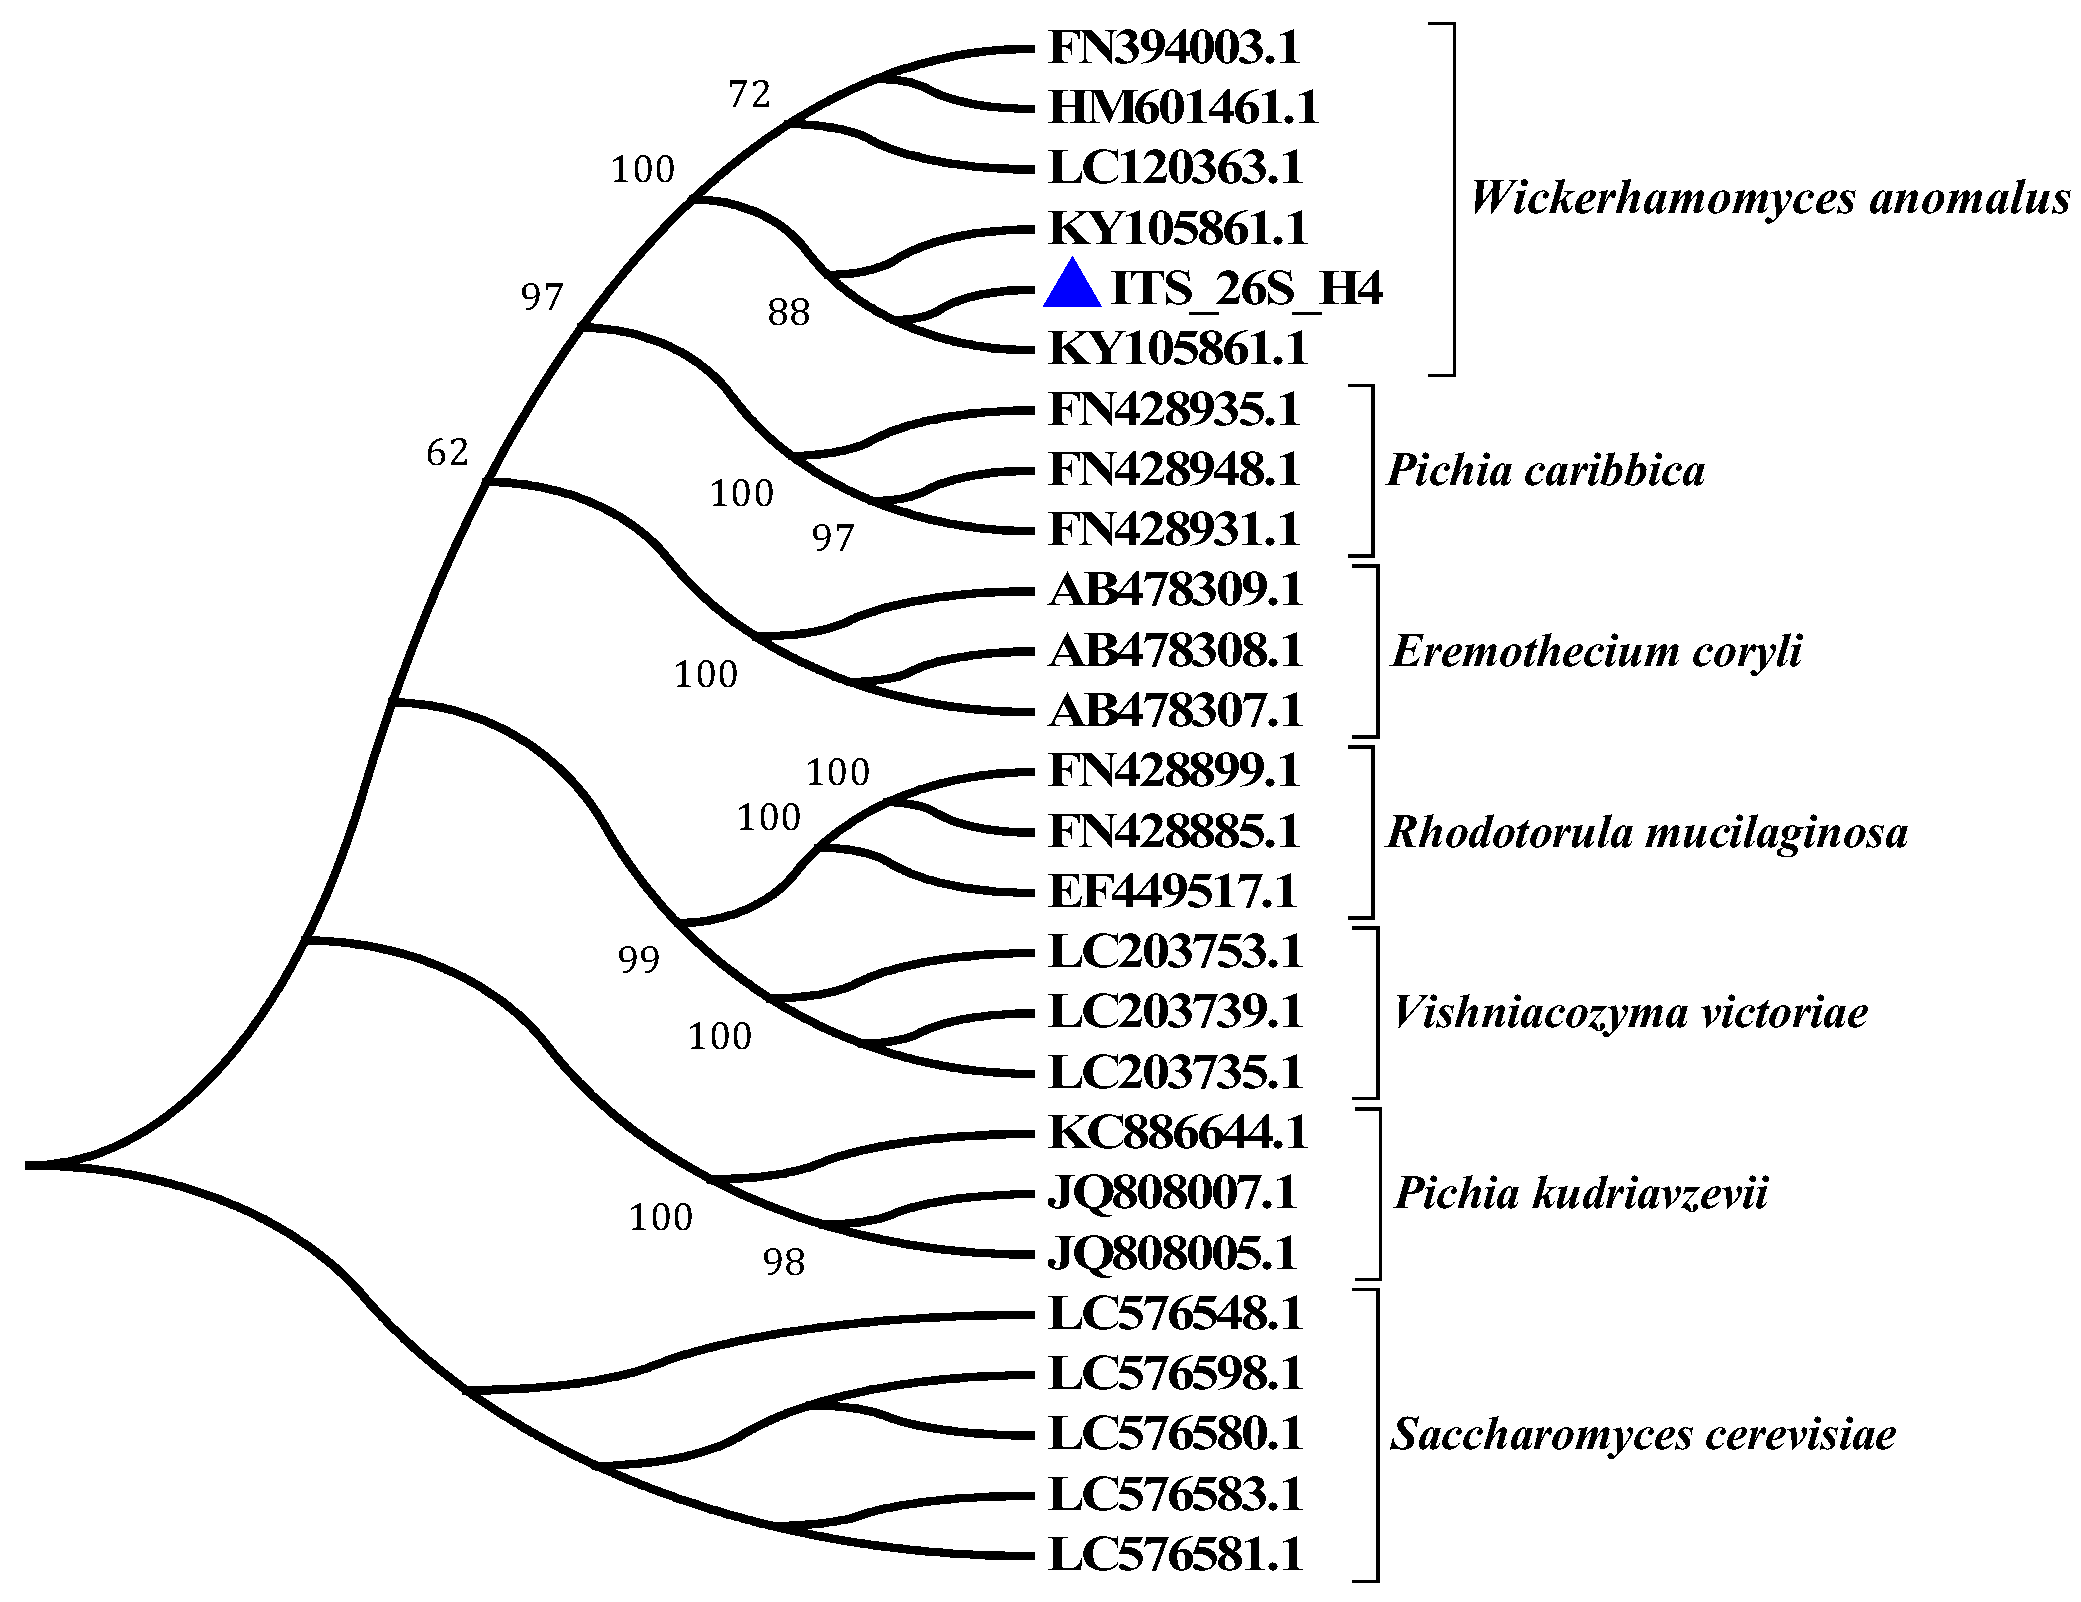
The morphological characteristics of strain H4 differ significantly from those of strain X16. To clarify the taxonomic classification of strain H4, we conducted a search of the GenBank non-redundant (nr) nucleotide database using the ITS and the 26S rDNA. The search results showed that the sequence identity between strain H4 and W. anomalus strain S1R3-8, as well as W. anomalus CBS 250 [23], is as high as 99%. Neither of the strains providing the aforementioned sequences has undergone functional validation. Phylogenetic analysis placed strain H4 within the same clade as W. anomalus (Figure 2). Based on these findings, strain H4 is identified as W. anomalus H4.

3.2. Growth Curve Analysis

As shown in Figure 3, the growth rate of W. anomalus H4 was notably faster at 24 °C and 30 °C compared to at 18 °C, with both temperatures enabling the strain to reach the stationary phase within 12 h. However, W. anomalus H4 exhibited exponential growth for up to 24 h and a pronounced lag phase during the initial 12 h. During the exponential growth phase at 24 °C and 30 °C, the total biomass and growth rate of W. anomalus H4 were significantly higher than those of strain X16. This trend was also evident during the lag phase and the exponential growth phase at 18 °C. Given that the growth curves were constructed using the total yeast count, no death phase was observed in these curves. While there are limited reports on the growth characteristics and fermentation performance of W. anomalus strains at different temperatures, insights into the growth characteristics of W. anomalus under various conditions have been provided, although specific growth rates at different temperatures were not reported [22].

3.3. Traits of H4 for Winemaking

3.3.1. Tolerance Analysis of Strain H4

As illustrated in Figure 4, the relative biomass concentration (A600) of W. anomalus H4 and strain X16 decreased as the concentrations of ethanol, glucose, SO2, and octanoic acid increased. Conversely, the relative biomass concentration increased as the pH value rose (Figure 4c).
W. anomalus H4 demonstrated tolerance to 11% ethanol (Figure 4a), 220 g/L glucose (Figure 4b), and 200 mg/L octanoic acid (Figure 4e). Notably, there was no significant difference between W. anomalus H4 and strain X16 in terms of tolerance to ethanol and glucose (Figure 4a). This finding is consistent with the results reported in a study that investigated the stress tolerance and fermentation performance of W. anomalus under high ethanol and glucose concentrations [24].
W. anomalus H4 could survive at a pH of around 3.6 (Figure 4c), which is a common pH level encountered in brewing processes. Additionally, W. anomalus H4 could survive in environments containing at least 200 mg/L total SO2 (Figure 4d) and 200 mg/L octanoic acid (Figure 4e). The ability of W. anomalus H4 to tolerate high levels of SO2 is noteworthy, as it aligns with the findings that identified an osmotolerant W. anomalus strain capable of producing glycerol and arabitol under various stresses [22].
There was generally no significant difference between W. anomalus H4 and strain X16 across the treatments, except for X16 showing significantly higher tolerance to SO2 than W. anomalus H4 (Figure 4d). This result contrasts with previous findings and suggests that W. anomalus H4 may require further optimization for SO2 tolerance in brewing applications [22].
These characteristics indicate that W. anomalus H4 has the potential to function effectively in the typical brewing environment.

3.3.2. Survival Analysis of Strain H4

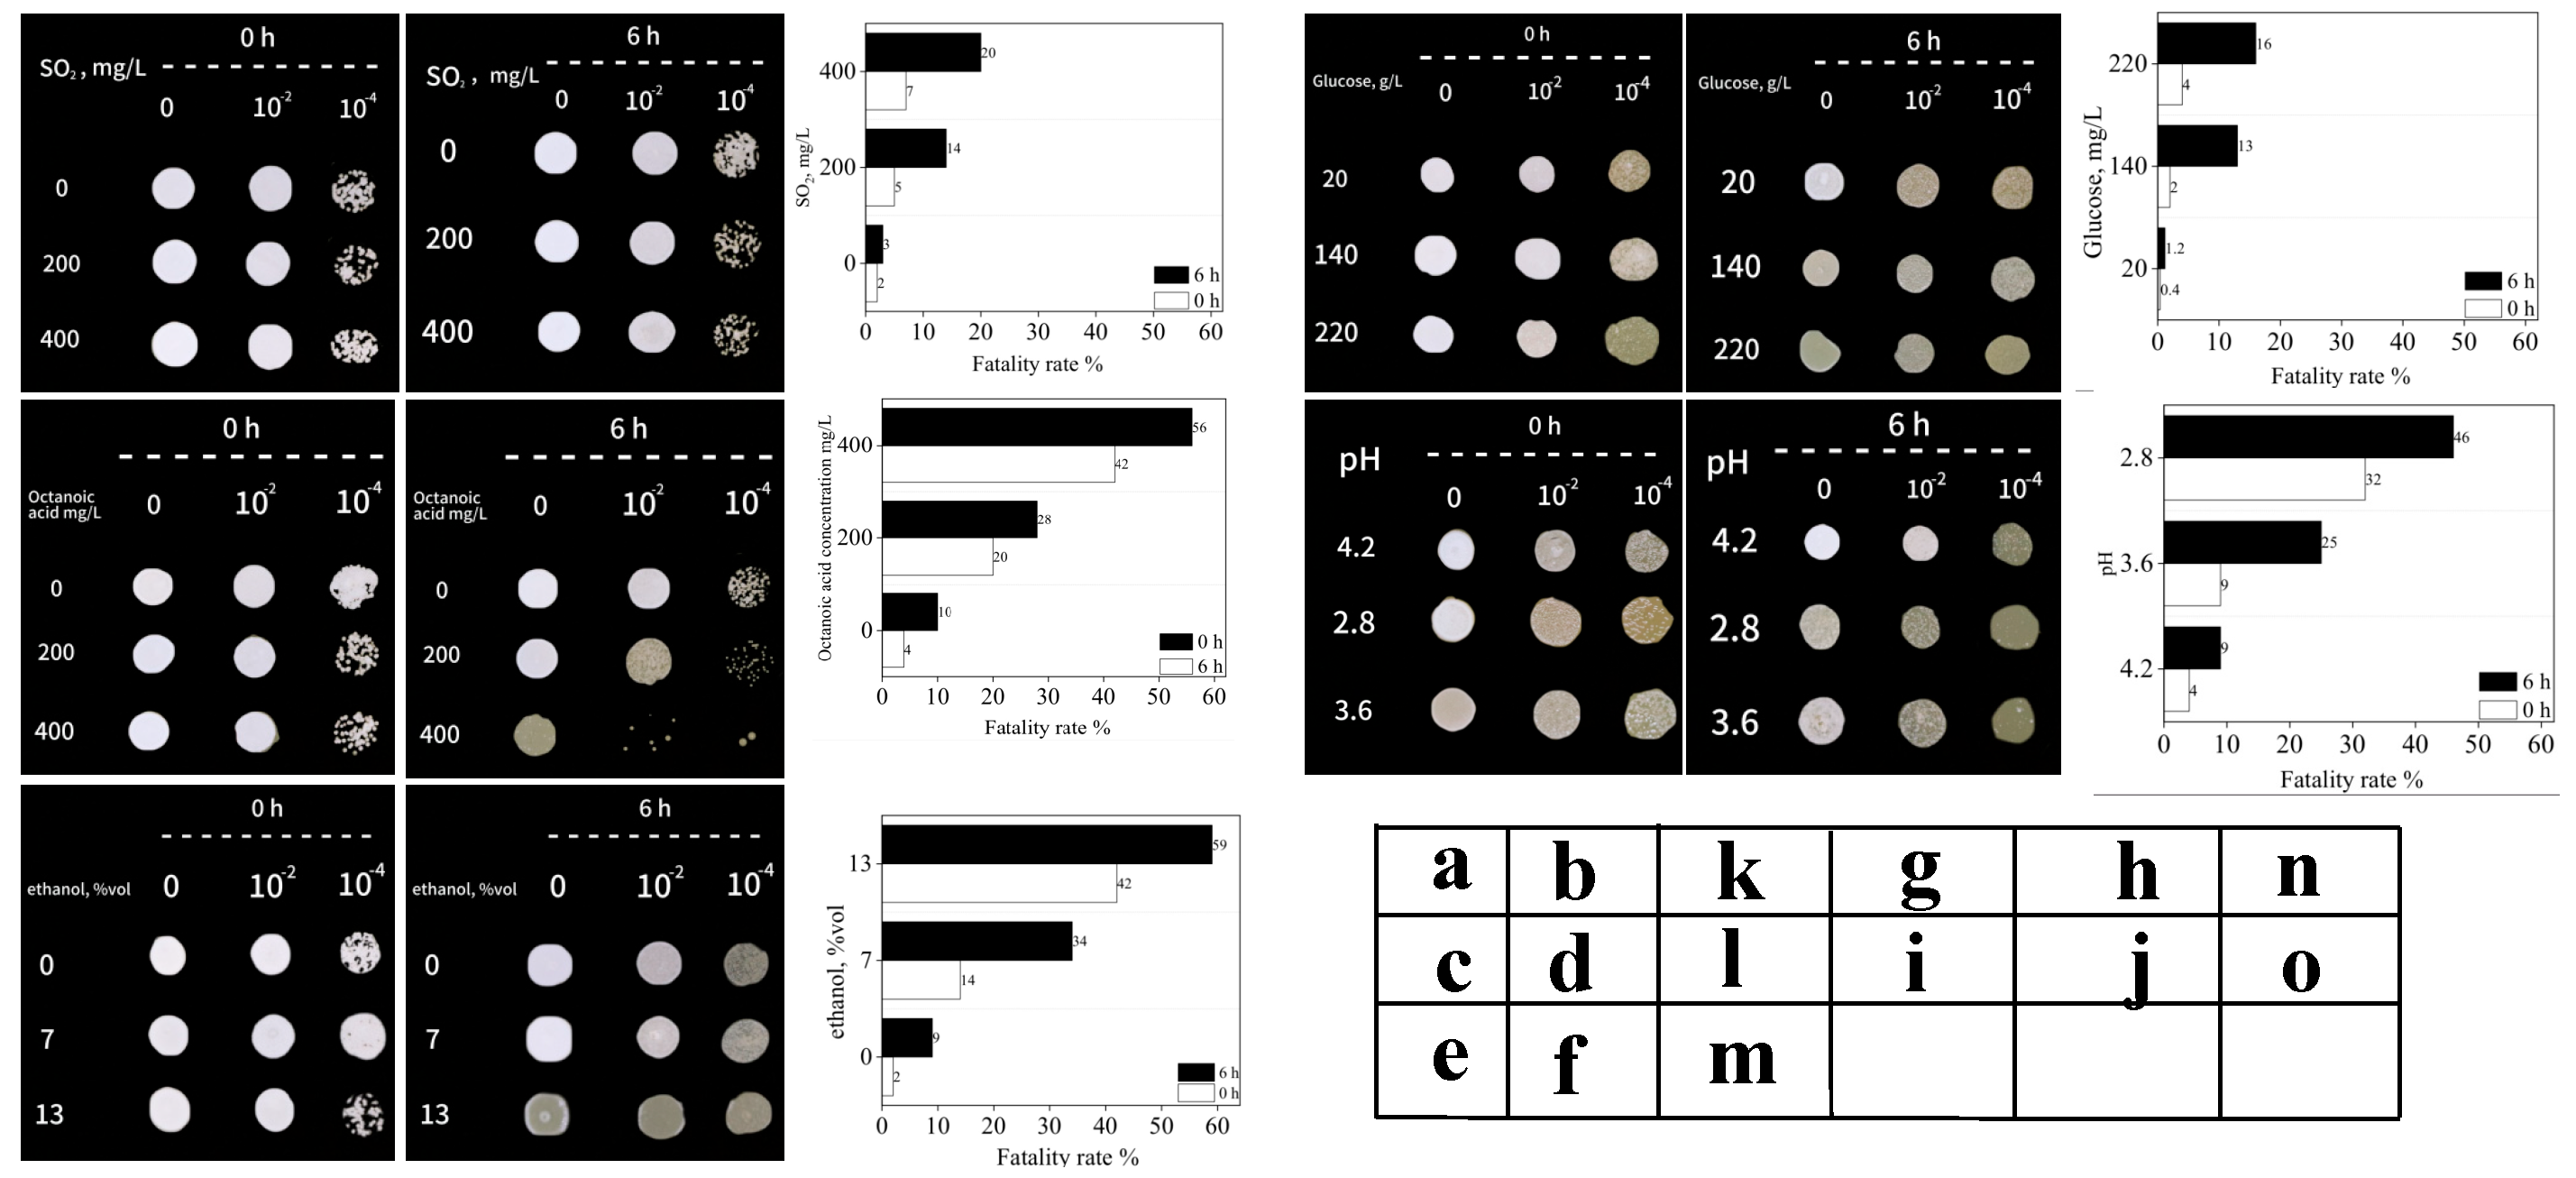
As shown in Figure 5, after 6 h of exposure to different concentrations of total SO2, approximately 14% and 20% of W. anomalus H4 cells were killed at concentrations of 200 and 400 mg/L, respectively (Figure 5k). For octanoic acid treatment, 28% and 56% of the cells were killed at concentrations of 200 and 400 mg/L, respectively (Figure 5l). Approximately 34% and 56% of the cells were killed under ethanol treatments at 7% and 13% (v/v), respectively (Figure 5m), which is consistent with our previous findings [6]. About 13% and 16% of the cells were killed under glucose treatments at 140 and 220 g/L, respectively (Figure 5n). Approximately 25% and 46% of the cells were killed under tartaric acid treatments at pH 3.6 and 2.8, respectively (Figure 5o).
From these observations, it is evident that ethanol and octanoic acid exert the greatest detrimental effects on W. anomalus H4 cells among the tested stressors. This is in line with the findings that W. anomalus strains can tolerate high concentrations of ethanol and glucose but suffer significant cell death at higher concentrations of ethanol [24]. Similarly, the susceptibility of W. anomalus to octanoic acid is consistent with the observations made that characterized W. anomalus strains for improved stress tolerance and fermentation performance in brewing [25].
Given the extensive literature on the effects of ethanol on S. cerevisiae, we chose to focus on the response mechanism of W. anomalus H4 cells to octanoic acid stress and performed transcriptomic analysis.

3.4. Transcriptomics Analysis

3.4.1. Identification of Differentially Expressed Genes (DEGs) by Transcriptomics

A total of 3.98 × 10⁷, 4.04 × 10⁷, and 4.27 × 10⁷ raw reads were obtained from the different octanoic acid concentration groups of 0 mg/L, 200 mg/L, and 400 mg/L, respectively. After quality filtering, 3.75 × 10⁷, 3.81 × 10⁷, and 4.02 × 10⁷ clean reads were obtained from these three groups, respectively. The percentages of the Q20 and Q30 bases were greater than 94% (Table 1). The gene coverage and saturation were adequate, with over 80% of the comparison areas in all samples falling within the coding sequence (CDS) region. These data indicate that the quality of the sequencing samples was satisfactory and that the transcriptome sequencing data were accurate.

3.4.2. Defining Differentially Expressed Genes

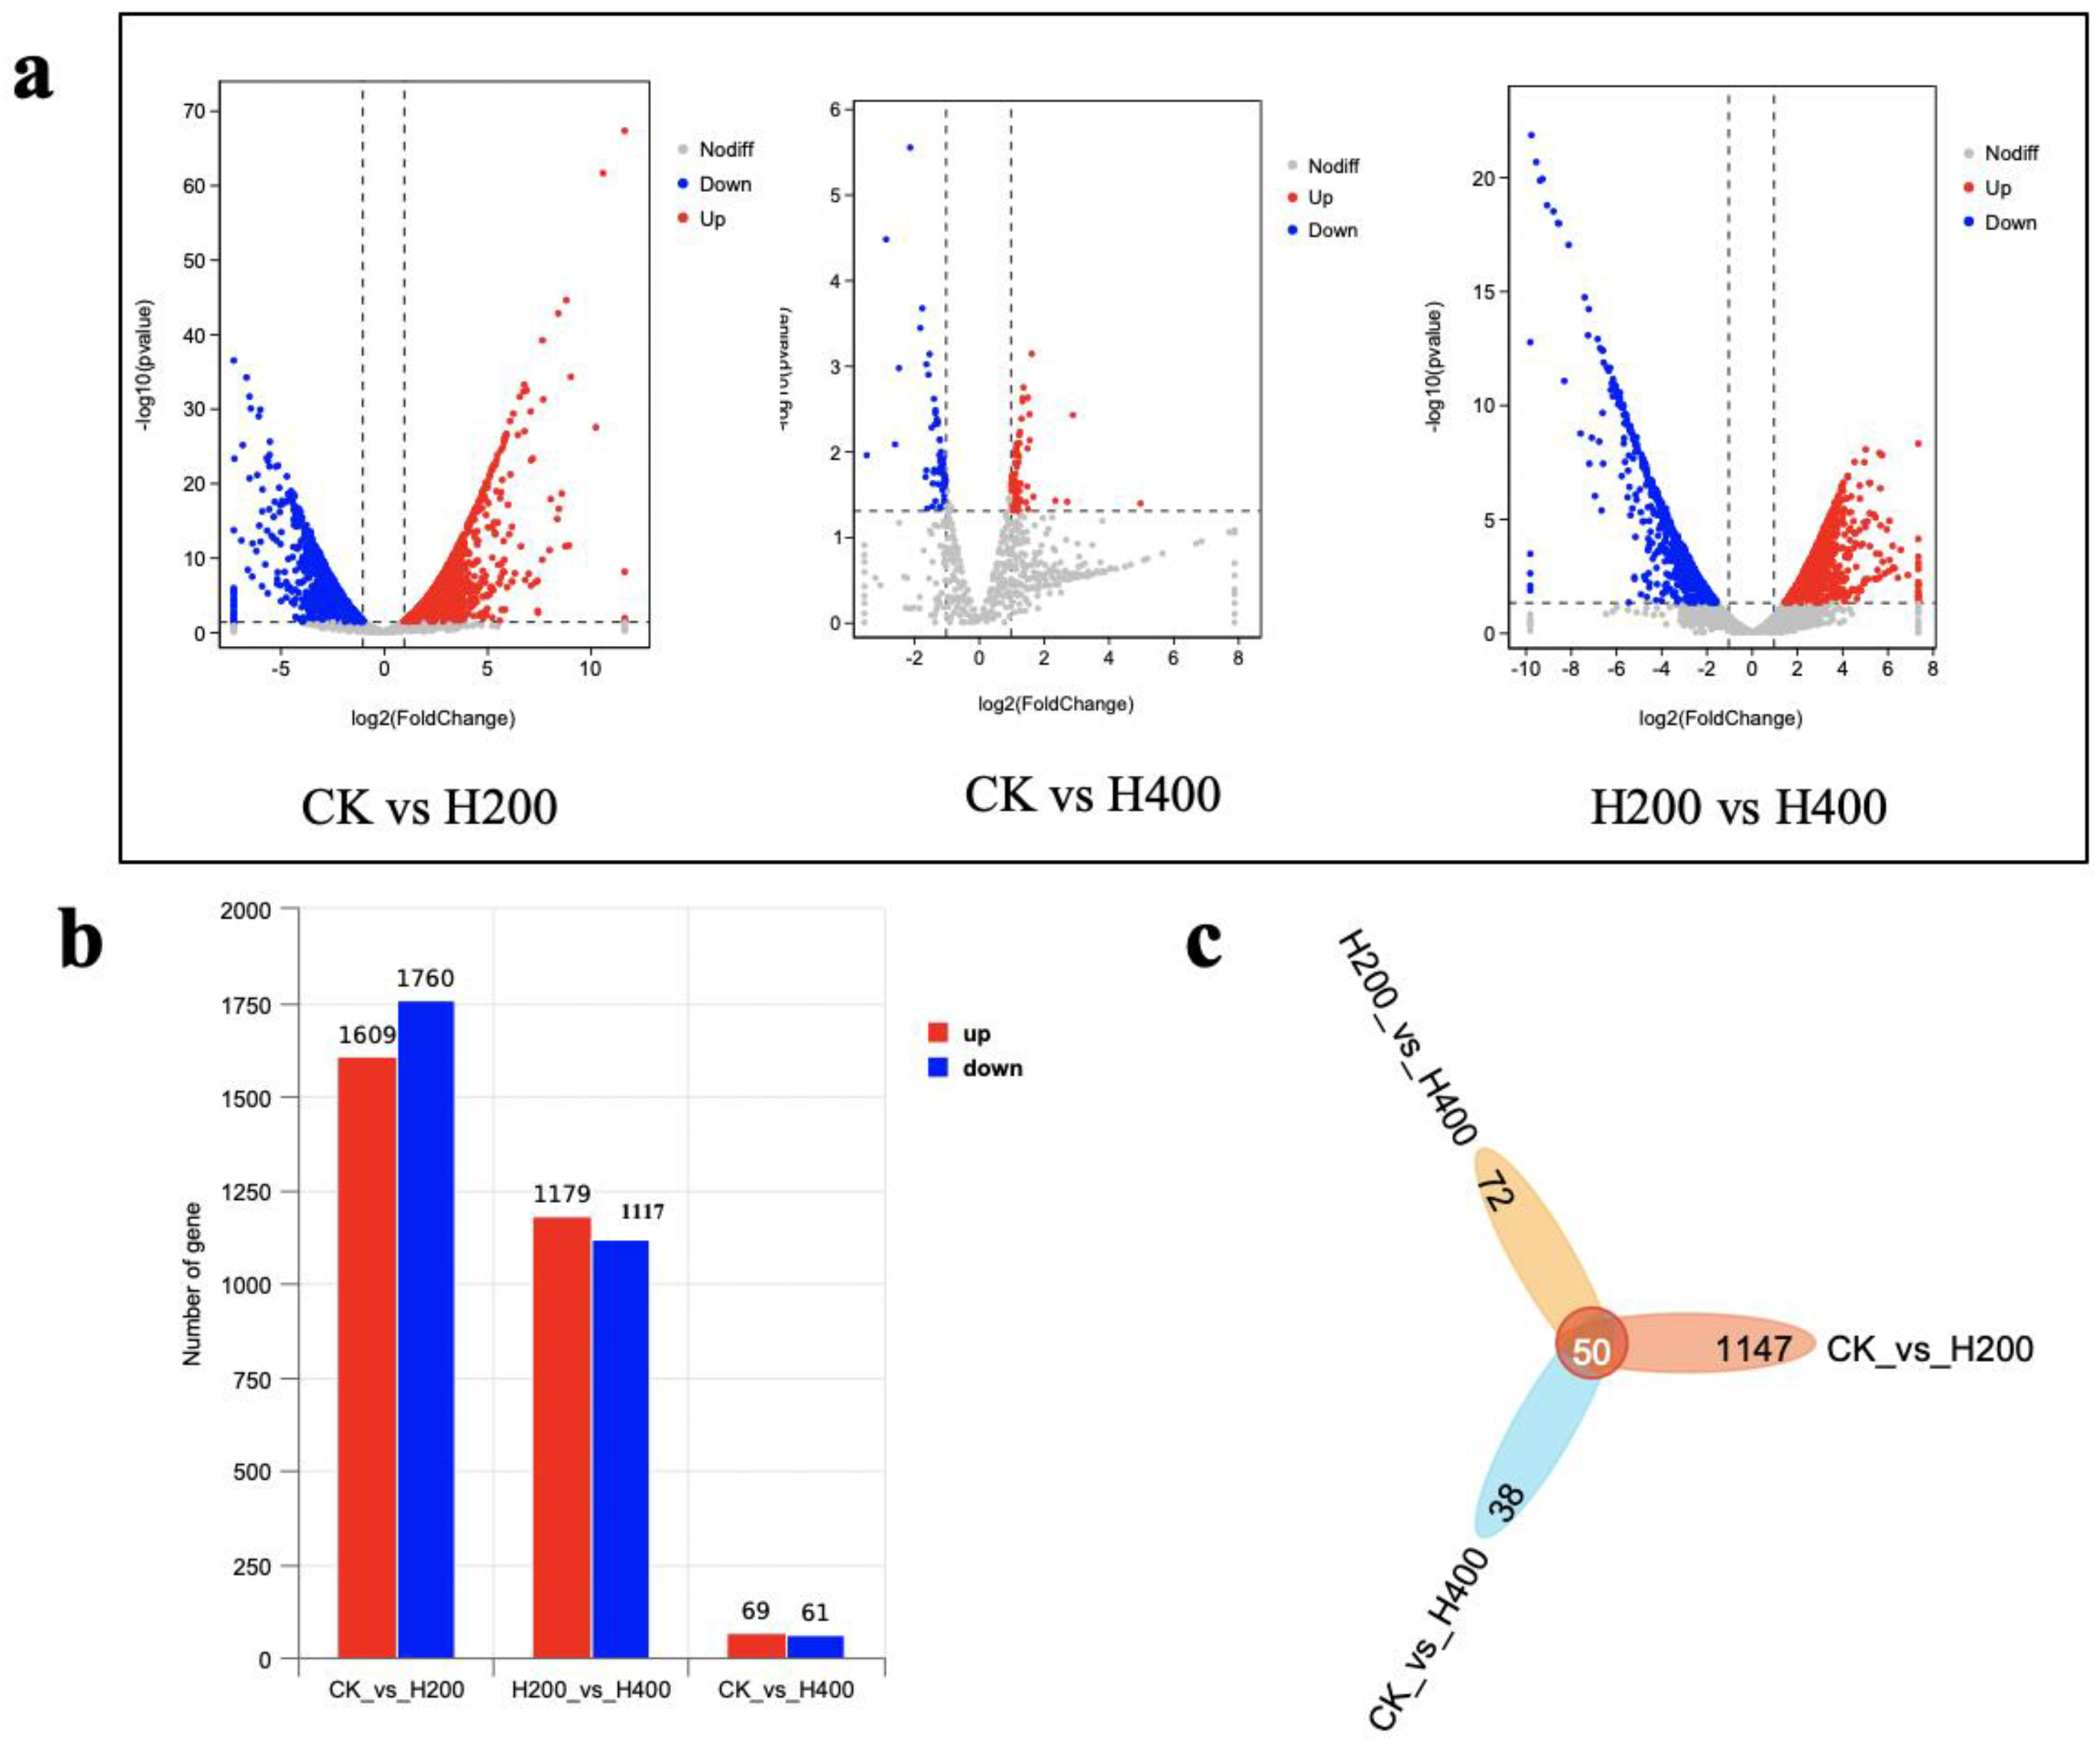
To further investigate the differentially expressed genes (DEGs) induced by octanoic acid, the screening criteria were set to p < 0.05 and |log2FoldChange| > 1. It was found that 200 mg/L octanoic acid induced 3369 DEGs, of which 1609 were upregulated, and 1760 were downregulated. In contrast, only 130 DEGs were detected in the 400 mg/L octanoic acid treatment group, consisting of 69 upregulated and 61 downregulated DEGs. Notably, between the 200 mg/L (H200) and 400 mg/L (H400) treatment groups, there were 2296 DEGs, with 1179 being upregulated and 1117 downregulated (Figure 6a,b). The number of specific DEGs shared among the three comparison groups was only 50 (Figure 6c).
These results highlight the complexity of the transcriptional response of W. anomalus to octanoic acid. The substantial number of DEGs induced by 200 mg/L octanoic acid suggests a broad transcriptional reprogramming, which is likely reflective of the yeast’s adaptive mechanisms to cope with the presence of this fatty acid. The lower number of DEGs at 400 mg/L octanoic acid suggests a more limited response, possibly due to cell death or a shift towards a survival strategy. When yeast is treated with 400 mg/L of octanoic acid, nearly half of the cells are killed immediately (Figure 5l). Therefore, the cells may not have had sufficient time to mount a stress response or adjust their gene expression to cope with the sudden environmental change, resulting in a number of DEGs similar to that of the control.
This observation aligns with previous studies that have shown the existence of threshold concentrations for various stressors, beyond which the adaptive capacity of microorganisms is exceeded [6].
Our findings are also supported by previous research that has investigated the transcriptomic responses of W. anomalus to different environmental conditions. For instance, it has been reported that thiamine supplementation could protect W. anomalus against ethanol stress by modulating the expression of genes involved in stress response and energy metabolism [6]. This suggests that the regulation of gene expression is a critical component of the yeast’s adaptive response to environmental stressors.
Moreover, the differential expression pattern observed in our study aligns with findings demonstrating that W. anomalus could relieve weaning diarrhea in piglets by improving gut microbiota and redox homeostasis. Observations indicated that W. anomalus altered the expression of genes involved in gut microbiota regulation and antioxidant defense, indicating the importance of gene regulation in the probiotic effects of this yeast [26].
This differential expression pattern is consistent with the findings that characterized an osmotolerant W. anomalus strain capable of producing glycerol and arabitol under various stresses [22]. Although that study focused on osmotic stress, the transcriptomic analysis revealed a significant number of differentially expressed genes, which highlights the importance of gene regulation in stress adaptation.

3.4.3. Functional Enrichment Analysis of DEGs

Under 200 mg/L octanoic acid stress, the results of KEGG pathway analysis indicated that most of the differentially expressed genes (DEGs) were annotated to the “ribosome” pathway, followed by the “proteasome” pathway. This suggests that octanoic acid stress disrupted intracellular protein synthesis and the turnover of certain proteins. The results of gene ontology (GO) classification analysis revealed that the DEGs were primarily distributed in the term “structural constituent of ribosome” within the molecular function category, “ribosomal subunit” within the cellular component category, and “mitochondrial gene expression” within the biological process category (Figure 7b). These findings align with the results of the KEGG analysis and are consistent with previous studies that have shown the impact of environmental stresses on ribosomal function and protein synthesis in yeast [27].
As shown in Figure 7, at 400 mg/L octanoic acid stress, the KEGG pathway analysis indicated that most of the DEGs were annotated to “DNA replication”, followed by “mismatch repair”, “nucleotide excision repair”, and “pyruvate metabolism”. This suggests that at this higher concentration of octanoic acid, the stress affected nucleotide replication and repair, as well as sugar metabolism. The GO classification analysis indicated that the DEGs were primarily distributed in the term “nucleolus” within the cellular component category and “α-amino acid catabolic process” within the biological process category (Figure 7b).
Comparatively, a lower concentration of octanoic acid (200 mg/L) predominantly impacted the construction of the protein synthesis machinery in yeast, while a higher concentration (400 mg/L) primarily influenced nucleic acid synthesis and repair, as well as carbon and nitrogen metabolism. This differential response is likely due to the severity of the stress imposed by the higher concentration of octanoic acid, which leads to more fundamental disruptions in cellular processes [18,28]. From the perspective of morphology and biomass, this may correlate with the overall trend in yeast mortality at 400 mg/L, while some yeast cells grew normally at 200 mg/L (Figure 4e and Figure 5c,d,l). This finding is consistent with previous studies that have shown that lower concentrations of stressors can induce adaptive responses, whereas higher concentrations can lead to cell death [6,29].

4. Conclusions

In conclusion, the purified strain W. anomalus H4 was characterized through morphological, genetic, and phylogenetic analyses. W. anomalus H4 exhibited notable tolerance to 11% ethanol, 220 g/L glucose, and 200 mg/L octanoic acid and survived at a pH of around 3.6, with a tolerance to 200 mg/L total SO2, making it suitable for brewing applications.
Transcriptomic analysis under octanoic acid stress revealed complex transcriptional responses, with 3369 differentially expressed genes (DEGs) at 200 mg/L, indicating broad transcriptional reprogramming. Most DEGs were associated with the “ribosome” and “proteasome” pathways, reflecting disruptions in protein synthesis and turnover. At 400 mg/L, only 130 DEGs were detected, suggesting a more limited response, with DEGs primarily related to “DNA replication” and “pyruvate metabolism”. These findings highlight the response mechanisms of W. anomalus H4 to environmental stresses, particularly octanoic acid, and its potential for use in brewing and fermentation processes.
The comprehensive characterization of W. anomalus H4 contributes to our understanding of the yeast’s stress tolerance and growth characteristics, which are essential for optimizing its performance in industrial applications.

Author Contributions

Conceptualization, Z.-H.Y.; methodology—isolation of H4, Y.Z.; methodology—preparation of yeast sample for transcriptomic sequencing, M.-Z.H.; methodology—tolerance analysis and trait analysis for winemaking, L.L., W.-J.D., Q.-Y.C. and B.-X.H.; data curation, M.-Z.S. and X.-Z.L.; writing—original draft preparation, Z.-H.Y.; writing—review and editing, Z.-H.Y. and M.-Z.H.; visualization, Z.-H.Y. All authors have read and agreed to the published version of the manuscript.

Funding

This research was funded by Guizhou Fruit Wine Brewing Engineering Research Center (Qianjiaoji (2022)050), Guizhou Provincial Key Technology R&D Program (No. [2023] 069), and Guizhou Provincial Science and Technology Department (KXJZ[2024]021).

Institutional Review Board Statement

Not applicable.

Informed Consent Statement

Not applicable.

Data Availability Statement

The original contributions presented in the study are included in the article, further inquiries can be directed to the corresponding author.

Conflicts of Interest

The authors declare no conflicts of interest.

References

  1. Kurtzman, C.P. Phylogeny of the ascomycetous yeasts and the renaming of Pichia anomala to Wickerhamomyces anomalus. Anton Van Leeuwenhoek 2011, 99, 13–23. [Google Scholar] [CrossRef] [PubMed]
  2. Ioannou, P.; Baliou, S.; Kofteridis, D.P. Fungemia by Wickerhamomyces anomalus—A Narrative Review. Pathogens 2024, 13, 269. [Google Scholar] [CrossRef] [PubMed]
  3. Peng, N.; Yao, Z.; Wang, Z.; Huang, J.; Khan, M.T.; Chen, B.; Zhang, M. Fungal deterioration of the bagasse storage from the harvested sugarcane. Biotechnol. Biofuels 2021, 14, 152. [Google Scholar] [CrossRef] [PubMed]
  4. Zhao, Q.; Shi, Y.; Legrand Ngolong Ngea, G.; Zhang, X.; Yang, Q.; Zhang, Q.; Xu, X.; Zhang, H. Changes of the microbial community in kiwifruit during storage after postharvest application of Wickerhamomyces anomalus. Food Chem. 2023, 404 Pt A, 134593. [Google Scholar] [CrossRef]
  5. Cai, W.; Wan, Y.; Chen, Y.; Fan, H.; Li, M.; Wu, S.; Lin, P.; Zeng, T.; Luo, H.; Huang, D.; et al. Transcriptomics to evaluate the influence mechanisms of ethanol on the ester production of Wickerhamomyces anomalus with the induction of lactic acid. Food Microbiol. 2024, 122, 104556. [Google Scholar] [CrossRef]
  6. Li, Y.; Long, H.; Jiang, G.; Yu, Z.; Huang, M.; Zou, S.; Guan, T.; Zhao, Y.; Liu, X. Protective effects of thiamine on Wickerhamomyces anomalus against ethanol stress. Front. Microbiol. 2022, 13, 1057284. [Google Scholar] [CrossRef]
  7. Wang, W.; Fan, G.; Li, X.; Fu, Z.; Liang, X.; Sun, B. Application of Wickerhamomyces anomalus in simulated solid-state fermentation for Baijiu production: Changes of microbial community structure and flavor metabolism. Front. Microbiol. 2020, 11, 598758. [Google Scholar] [CrossRef]
  8. Gao, Y.; Wang, X.; Ai, J.; Huang, W.; Zhan, J.; You, Y. Formation of vinylphenolic pyranoanthocyanins by selected indigenous yeasts displaying high hydroxycinnamate decarboxylase activity during mulberry wine fermentation and aging. Food Microbiol. 2023, 113, 104272. [Google Scholar] [CrossRef]
  9. Hong, Y.; Chen, G.; Li, Y. Wickerhamyces anomalus as a potential biocontrol agent against Botrytis cinerea. J. Agric. Food Chem. 2017, 65, 7123–7131. [Google Scholar]
  10. Sadeghi, F.; Torkashvand, H.; Khanabadi, F.; Didehdar, M.; Latifi, R.; Fakhar, M.; Elmi, T. A review on Wickerhamomyces anomalus yeast: A promising eco-friendly approach to biological control of malaria. Ann. Parasitol. 2022, 68, 657–665. [Google Scholar]
  11. Zhang, J.; He, Y.; Yin, L.; Hu, R.; Yang, J.; Zhou, J.; Cheng, T.; Liu, H.; Zhao, X. Isolation of aroma-producing Wickerhamomyces anomalus yeast and analysis of its typical flavoring metabolites. Foods 2023, 12, 2934. [Google Scholar] [CrossRef] [PubMed]
  12. Yan, S.; Chen, X.; Xiang, X. Improvement of the aroma of lily rice wine by using aroma-producing yeast strain Wickerhamomyces anomalus HN006. AMB Express 2019, 9, 89. [Google Scholar] [CrossRef] [PubMed]
  13. Cappelli, A.; Valzano, M.; Cecarini, V.; Bozic, J.; Rossi, P.; Mensah, P.; Amantini, C.; Favia, G.; Ricci, I. Killer yeasts exert anti-plasmodial activities against the malaria parasite Plasmodium berghei in the vector mosquito Anopheles stephensi and in mice. Parasit. Vectors 2019, 12, 329. [Google Scholar] [CrossRef] [PubMed]
  14. Yu, Z.-H.; Huang, G.-D.; Huang, X.-Y.; Pu, J.-H.; Wu, J.-S.; Yue, L.-R.; Hardie, W.J.; Liu, X.-Z.; Huang, M.-Z. A comparative study of yeasts for Rosa roxburghii wine fermentation. Fermentation 2022, 8, 311. [Google Scholar] [CrossRef]
  15. Du, X.; Peng, Y.; Albero, J.; Li, D.; Hu, C.; García, H. Synthetic fuels from biomass: Photo-catalytic hydrodecarboxylation of octanoic acid by Ni nanoparticles deposited on TiO2. ChemSusChem 2022, 15, e202102107. [Google Scholar] [CrossRef]
  16. Cabral, M.G.; Viegas, C.A.; Sá-Correia, I. Mechanisms underlying the acquisition of resistance to octanoic-acid-induced-death following exposure of Saccharomyces cerevisiae to mild stress imposed by octanoic acid or ethanol. Arch. Microbiol. 2001, 175, 301–307. [Google Scholar] [CrossRef]
  17. Borrull, A.; López-Martínez, G.; Poblet, M.; Cordero-Otero, R.; Rozès, N. New insights into the toxicity mechanism of octanoic and decanoic acids on Saccharomyces cerevisiae. Yeast 2015, 32, 451–460. [Google Scholar] [CrossRef]
  18. Van der Aa Kühle, A.; Jespersen, L. The taxonomic position of Saccharomyces boulardii as evaluated by sequence analysis of the D1/D2 domain of 26S rDNA, the ITS1-5.8S rDNA-ITS2 region and the mitochondrial cytochrome-c oxidase II gene. Syst. Appl. Microbiol. 2003, 26, 564–571. [Google Scholar] [CrossRef]
  19. Bai, F.Y. Reclassification of the Sporobolomyces roseus and Sporidiobolus pararoseus complexes, with the description of Sporobolomyces phaffii sp. nov. Int. J. Syst. Evol. Microbiol. 2002, 52, 2309–2314. [Google Scholar]
  20. Kumar, S.; Stecher, G.; Li, M.; Knyaz, C.; Tamura, K. MEGA X: Molecular evolutionary genetics analysis across computing platforms. Mol. Biol. Evol. 2018, 35, 1547–1549. [Google Scholar] [CrossRef]
  21. Li, Y.; Long, H.; Jiang, G.; Gong, X.; Yu, Z.; Huang, M.; Guan, T.; Guan, Y.; Liu, X. Analysis of the ethanol stress response mechanism in Wickerhamomyces anomalus based on transcriptomics and metabolomics approaches. BMC Microbiol. 2022, 22, 275. [Google Scholar] [CrossRef] [PubMed]
  22. Thammaket, J.; Srimongkol, P.; Ekkaphan, P.; Thitiprasert, S.; Niyomsin, S.; Chaisuwan, T.; Chirachanchai, S.; Thongchul, N. Isolation, screening, and characterization of the newly isolated osmotolerant yeast Wickerhamomyces anomalus BKK11-4 for the coproduction of glycerol and arabitol. Braz. J. Microbiol. 2024, 55, 521–530. [Google Scholar] [CrossRef] [PubMed]
  23. Vu, D.; Groenewald, M.; Szöke, S.; Cardinali, G.; Eberhardt, U.; Stielow, B.; de Vries, M.; Verkleij, G.J.; Crous, P.W.; Boekhout, T.; et al. DNA barcoding analysis of more than 9000 yeast isolates contributes to quantitative thresholds for yeast species and genera delimitation. Stud. Mycol. 2016, 85, 91–105. [Google Scholar] [CrossRef]
  24. Turner, W.; Greetham, D.; Du, C. The characterisation of Wickerhamomyces anomalus M15, a highly tolerant yeast for bioethanol production using seaweed derived medium. Front. Bioeng. Biotechnol. 2022, 10, 1028185. [Google Scholar] [CrossRef] [PubMed]
  25. Sehnem, N.T.; Machado, Â.S.; Matte, C.R.; Morais, M.A., Jr.; Ayub, M.A.Z. Second-generation ethanol production by Wickerhamomyces anomalus strain adapted to furfural, 5-hydroxymethylfurfural (HMF), and high osmotic pressure. An. Acad. Bras. Cienc. 2020, 92 (Suppl. 2), e20181030. [Google Scholar] [CrossRef] [PubMed]
  26. Zhang, Y.; Liu, H.; Yue, Z.; Tan, P.; Sun, M.; Ji, L.; Bai, Y.; Ma, X. Wickerhamomyces anomalus relieves weaning diarrhea via improving gut microbiota and redox homeostasis using a piglet model. Food Funct. 2022, 13, 11223–11235. [Google Scholar] [CrossRef]
  27. Geng, P.; Zhang, L.; Shi, G.Y. Omics analysis of acetic acid tolerance in Saccharomyces cerevisiae. World J. Microbiol. Biotechnol. 2017, 33, 94. [Google Scholar] [CrossRef]
  28. Cai, M.; Zhou, J.; Hao, T.; Du, K. Tolerance of phyllospheric Wickerhamomyces anomalus to BDE-3 and heavy metals. Environ. Sci. Pollut. Res. 2022, 29, 56555–56561. [Google Scholar] [CrossRef]
  29. Coda, R.; Cassone, A.; Rizzello, C.G.; Nionelli, L.; Cardinali, G.; Gobbetti, M. Yeast community dynamics and volatile organic compound production during spontaneous apple juice fermentation. Appl. Environ. Microbiol. 2011, 77, 3484–3492. [Google Scholar] [CrossRef]
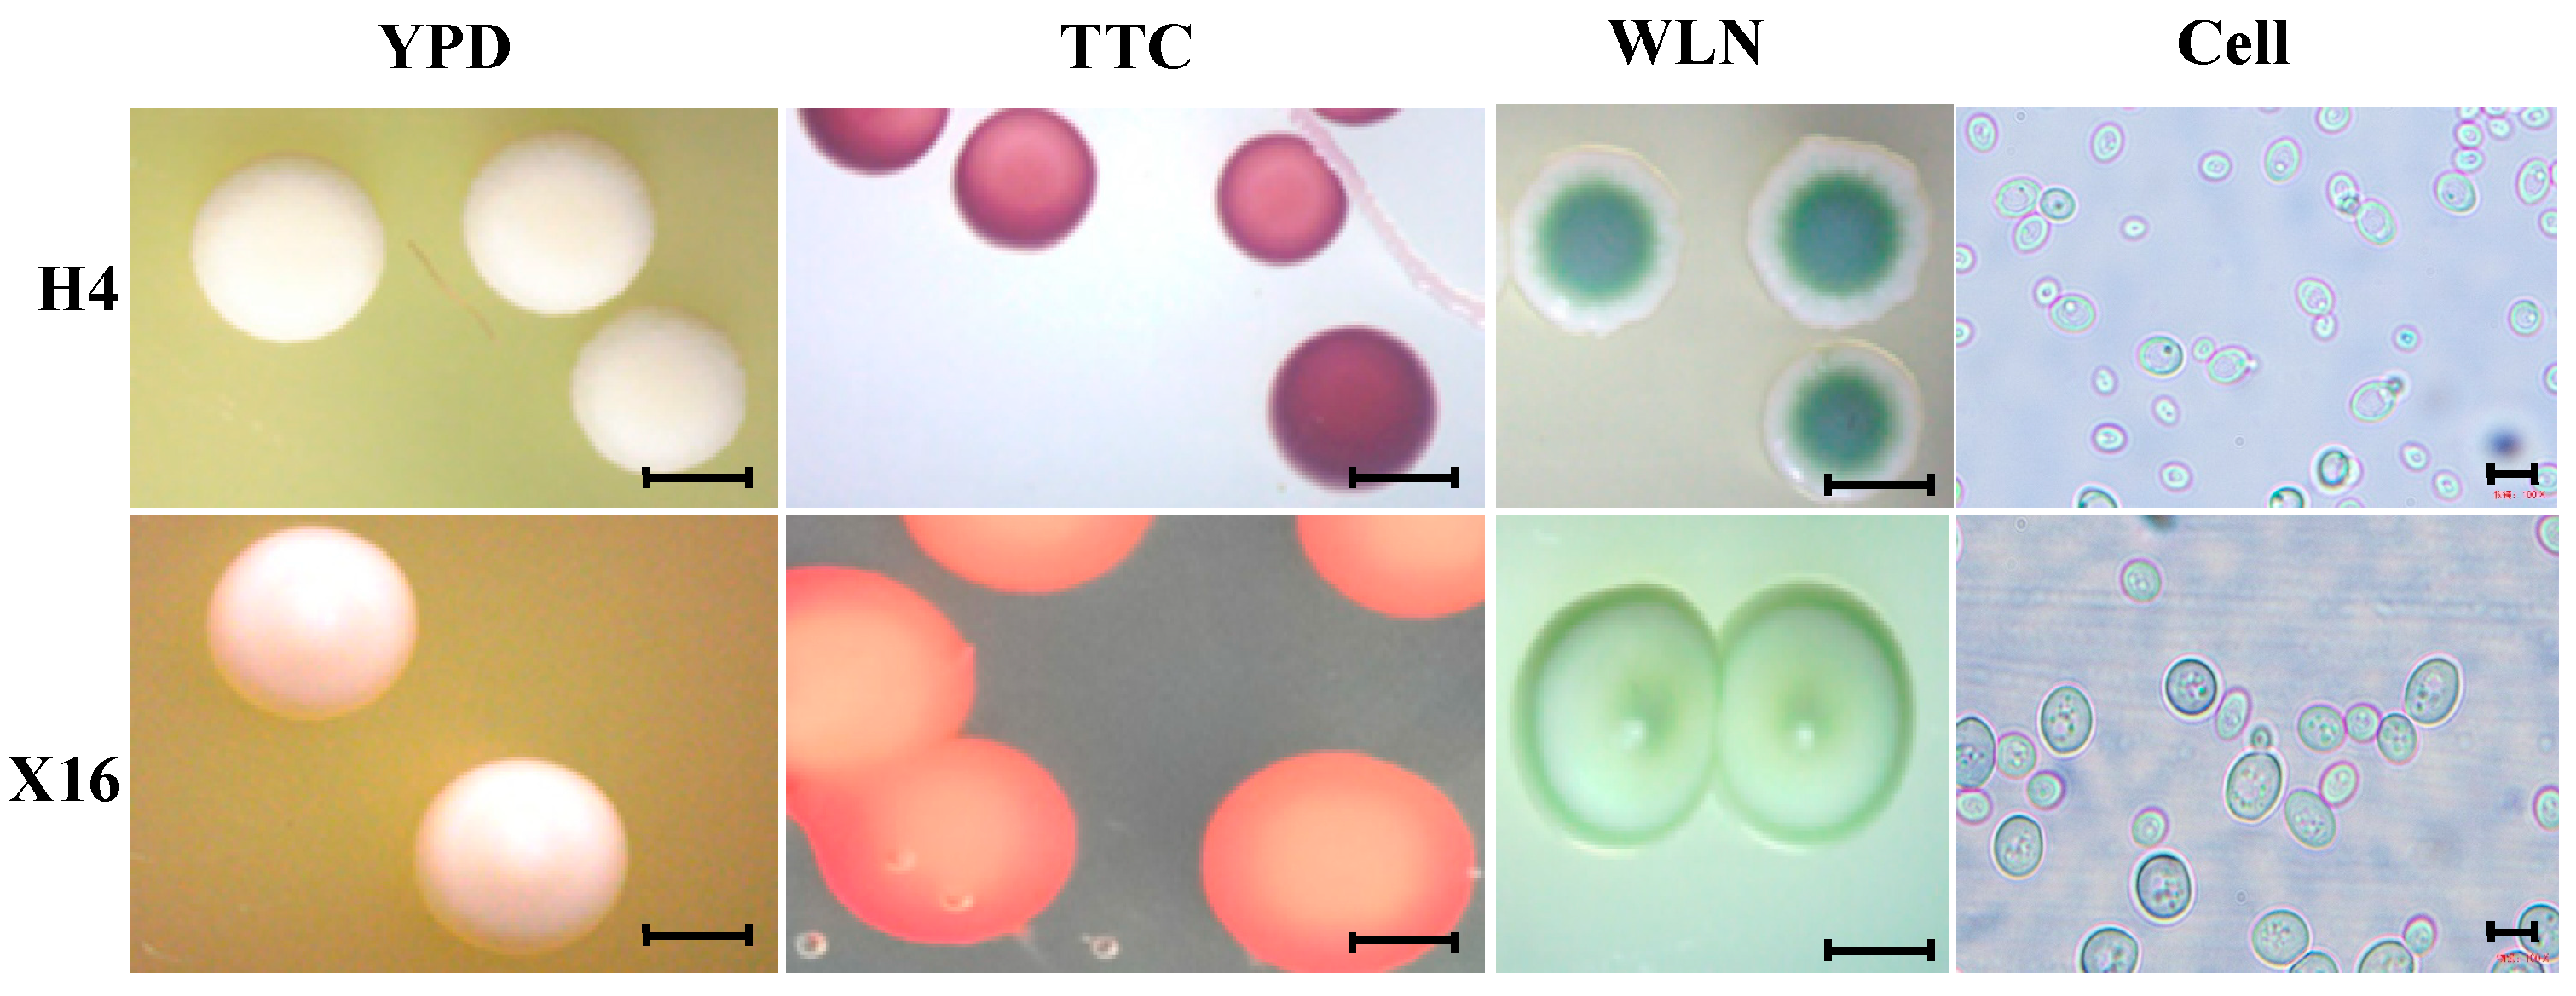
Figure 1. Morphological characteristics of colonies on different media (YPD, TTC, and WLN) and cells under microscope of H4 and X16 after methylene blue staining. The scale bar within the cell is 10 μm, while all other scale bars are 1 mm.
Fermentation 10 00563 g001
Figure 2. A phylogenetic analysis of strain H4 based on concatenated ITS and 26S rDNA sequences (the part indicated by the blue triangle). Phylogenetic relationships were inferred using a Neighbor-Joining method with a concatenated dataset of the internal transcribed spacer (ITS) and 26S rDNA regions. The query sequence comprised the ITS region (GenBank accession No. MN4534473) and the 26S rDNA region (GenBank accession No. MN4534472) of strain H4. Reference sequences were selected from the non-redundant (nr) nucleotide database of GenBank using the BLAST tool (https://blast.ncbi.nlm.nih.gov/Blast.cgi, accessed on 24 October 2024). The accession numbers of the reference sequences are listed in this figure. Bootstrap support values from 1000 replicates are indicated on the branches.
Fermentation 10 00563 g002
Figure 3. Growth curve analysis of W. anomalus H4 at different temperatures ((a) 18 °C, (b) 24 °C, (c) 30 °C).
Fermentation 10 00563 g003
Figure 4. Tolerance analysis of W. anomalus H4. Different lowercase letters above standard deviation bar indicate significant difference (p ≤ 0.05). (a) Ethanol (b) Glucose (c) pH (d) SO2 (e) Octanoic Acid.
Fermentation 10 00563 g004
Figure 5. A survival analysis of W. anomalus H4 cells under stress conditions. The viability of yeast cells was assessed on YPD (Yeast Peptone Dextrose) agar media using a spot dilution assay (aj). The death rate of yeast cells subjected to different treatments was quantified (ko).
Fermentation 10 00563 g005
Figure 6. The DEG analysis of W. anomalus H4 induced by octanoic acid. (a) Volcano plot of DEGs between the treatment groups and the control group (b) Bar chart of DEGs (c) Venn diagram of DEGs.
Fermentation 10 00563 g006
Figure 7. Functional enrichment analysis of DEGs. KEGG pathway analysis (a) and gene ontology (GO) classification analysis (b).
Fermentation 10 00563 g007
Table 1. Transcriptomic quality analysis of W. anomalus H4 under octanoic acid stress.
Group Raw ReadsRaw BasesClean ReadsUseful Reads %
0 mg/L3.98 × 107 ± 3.81 × 1066.01 × 109 ± 5.75 × 1083.75 × 107 ± 3.61 × 10694.15 ± 0.07
200 mg/L4.04 × 107 ± 2.78 × 1066.11 × 109 ± 4.20 × 1083.81 × 107 ± 2.57 × 10694.08 ± 0.23
400 mg/L4.27 × 107 ± 3.34 × 1066.45 × 109 ± 5.05 × 1084.02 × 107 ± 3.13 × 10694.05 ± 0.14
Group Useful bases %Clean basesQ20 %Q30 %
0 mg/L94.15 ± 0.075.66 × 109 ± 5.44 × 10898.21 ± 0.0694.24 ± 0.16
200 mg/L94.08 ± 0.235.75 × 109 ± 3.88 × 10898.33 ± 0.3094.52 ± 0.82
400 mg/L94.053 ± 0.146.07 × 109 ± 4.73 × 10898.13 ± 0.2294.05 ± 0.60
Disclaimer/Publisher’s Note: The statements, opinions and data contained in all publications are solely those of the individual author(s) and contributor(s) and not of MDPI and/or the editor(s). MDPI and/or the editor(s) disclaim responsibility for any injury to people or property resulting from any ideas, methods, instructions or products referred to in the content.