Article

A Potential Diabetic-Friendly Food Material: Optimization, Nutritional Quality, Structural Characteristics, and Functional Properties of Oat and Purple Potato Fermented by Ganoderma lucidum Mycelium

Key Laboratory of Biotechnology and Bioresources Utilization, College of Life Sciences, Dalian Minzu University, Ministry of Education, Dalian 116600, China
*
Author to whom correspondence should be addressed.
Fermentation 2024, 10(12), 618; https://doi.org/10.3390/fermentation10120618
Submission received: 31 October 2024 / Revised: 23 November 2024 / Accepted: 23 November 2024 / Published: 3 December 2024
(This article belongs to the Topic Fermented Food: Health and Benefit)

Abstract

:
Dietary intervention is the basis for the treatment of diabetes mellitus. This study employed Ganoderma lucidum (GL) mycelium to ferment a compound medium of oat and purple potato (OPP), optimized fermentation conditions to increase the triterpene content in the resulting product (F-OPPF), and systematically investigated the impact of fermentation on the nutritional quality, structural characteristics, and functional properties of OPP. The results indicated that the triterpene content in F-OPPF significantly increased from 8.53 mg/g to 17.23 mg/g under optimal conditions (temperature: 28 °C, inoculum size: 10%, material quantity: 36 g/250 mL, and fermentation time: day 13). Fermentation resulted in enhanced nutritional quality, with increased contents of protein, soluble protein, crude fiber, ash, mineral elements, essential amino acids, polysaccharides, flavonoids, and total phenols. Mycelium not only enveloped the OPP surface but also penetrated its interior, forming a porous honeycomb-like structure. The types of reactive groups and crystals (C + V-type) were not changed after fermentation, while the crystallinity increased. F-OPPF exhibited positive changes in thermogravimetric properties, antioxidant and hypoglycemic activities, and adsorption capacity of insoluble dietary fiber. Additionally, incorporating F-OPPF into the diet markedly reduced fasting blood glucose levels and promoted weight gain in T2DM rats induced by a high-fat diet and streptozotocin. The fermented groups exhibited improvements in glyco- and lipo-metabolism, oxidative stress, and the function and pathological morphology of the pancreas, liver, and kidneys compared to the unfermented group. Collectively, these findings suggested that GL mycelium fermentation enhanced the nutritional and functional values of OPP, and F-OPPF holds potential as a raw material for developing diabetic-friendly foods.

1. Introduction

Diabetes mellitus is a metabolic disease characterized by hyperglycemia induced by insulin resistance, of which T2DM accounts for 90–95% [1]. Type 2 diabetes mellitus (T2DM) is mainly manifested as hyperglycemia, abnormal lipid metabolism, oxidative stress, and tissue damage [2], leading to micro- and macro-vascular complications, vision loss, cardiac failure, and other complications [3]. The prevalence of T2DM is rising due to sedentary lifestyles and poor dietary habits [4]. Current treatments for diabetes include diet, medication, exercise, and blood glucose monitoring, with dietary intervention being fundamental.
Dietary guidelines are commonly similar throughout the world and recommend over 50% of energy from carbohydrates derived from unrefined grains, tubers, fruits, and vegetables [5]. Among them, grain-based food intake is associated with weight loss and a reduced risk of cardiovascular disease, diabetes, abdominal obesity, and certain cancers [6,7]. Despite this, modern diets have increasingly shifted from unrefined to refined grains, resulting in significant losses in nutritional content and reduced efficacy due to processing methods such as dehulling, milling, refining, polishing, crushing, and sieving [8].
Oat (Avena sativa), cultivated in 42 countries, predominantly in the temperate regions of the Northern Hemisphere, is valued for its high protein, lipid, dietary fiber (especially β-glucan), mineral, and vitamin content. It is associated with reduced lipid levels, blood pressure, and cardiovascular disease risk, as well as better postprandial blood glucose regulation, particularly beneficial for T2DM patients [9,10]. Purple potato, developed in Japan in the 1990s, surpasses ordinary potatoes in nutritional value, being rich in anthocyanins, polysaccharides, polyphenols, and chlorogenic acid. These constituents are effective in reducing α-glucosidase activity, thereby lowering postprandial blood glucose levels. Purple potato is categorized as a middle-glycemic-index food [11], with its glycemic index linked to polyphenol content [12]. It is often combined with other low-glycemic-index ingredients to enhance its nutritional and health benefits [13].
Ganoderma lucidum (GL), a fungus belonging to Basidiomycota, Agaricomycetes, and Polyporaceae families, is renowned for its antioxidant, immunostimulatory, cardioprotective, hypoglycemic, and hypolipidemic properties [14]. The hypoglycemic effect of GL is primarily attributed to its triterpenes that inhibit α-amylase and α-glucosidase activities [15]. GL triterpenes have demonstrated protective effects against diabetes, inflammation, hyperlipidemia, oxidative stress, and microbiota imbalance in diabetic rats [16]. GL mycelium, a growth stage of GL, offers advantages in fermentation, such as a short growth cycle, diverse raw material usage, increased efficiency, and new substance generation. Solid-state fermentation using GL mycelium can decompose macromolecular substances in the substrate via the extracellular enzymes, releasing beneficial nutrients and small molecular compounds. Moreover, mycelium can not only extend to the surface but also penetrate the interior of the substrate. Previous reports have shown that GL mycelium fermentation can convert grain compositions, improving their structure and health-related properties [17]. The use of GL fermentation products depends on the substrate type, yielding raw materials with fermented grains suitable for various food applications, such as flour products, enriched rice, coarse cereals, beverages, and seasonings.
Given that biotransformation via fermentation is an effective way to enhance the nutritional and functional value of grains, and considering that GL is recognized as a traditional substance that is both food and traditional Chinese medicine by the National Health Commission of China, there is significant potential for the widespread application of grain fermented with GL in functional food production. This study aims to optimize the fermentation conditions to increase the triterpene content in the fermented product (F-OPPF); elucidate the impact of GL mycelium fermentation on the nutritional quality, structural characteristics, and functional properties of oat and purple potato (OPP); and evaluate its protective effect in T2DM rats induced by a high-fat diet (HFD) and streptozotocin (STZ), furnishing novel research insights and a theoretical foundation for the development of functional grain-based raw materials fermented with GL mycelium.

2. Materials and Methods

2.1. Materials and Chemicals

Raw oats, supplied by Manyilian Trading Co., Ltd. (Lianyungang, China), were soaked in distilled water overnight before use. Raw purple potatoes, obtained from Qinbo E-commerce Co., Ltd. (Zaozhuang, China), were cleaned, peeled, and cut into 5 mm × 5 mm blocks. The Ganoderma lucidum strain was sourced from the College of Life Sciences, Dalian Minzu University, Dalian, China. Oleanolic acid, rutin, sodium cholate, cholesterol, bovine serum protein standards, vanillin, coomassie brilliant blue, 3,5-dinitrosalicylic acid, α-amylase, α-glucosidase, p-nitrophenyl-α-D-glucopyranoside (PNPG), and furfural were obtained from Aladdin Biotechnology Co., Ltd. (Shanghai, China). 1,10-Phenanthroline monohydrate, 1,1-diphenyl-2-picryl-hydrazyl radical (DPPH), streptozotocin, and other chemical reagents were obtained from McLean Biochemical Technology Co., Ltd. (Shanghai, China). Petroleum ether, CuSO4, Na2CO3, glacial acetic acid, hydrochloric acid, phenol, ethanol, HCl, NaOH, FeSO4, and so on are analytically pure reagents. Blood glucose meters and test strips were obtained from Omron Precision Electronics Co., Ltd. (Suzhou, China). Fully automatic biochemical analyzer and reagent kits for low-density lipoprotein cholesterol (LDL-C), high-density lipoprotein cholesterol (HDL-C), blood urea nitrogen (BUN), serum creatinine (Scr), alanine transaminase (ALT), and aspartate transaminase (AST) were obtained from Rayto Life Science Co., Ltd. (Shenzhen, China). A glycated serum protein reagent kit was obtained from Huili Biotechnology Co., Ltd. (Changchun, China). Other various biochemical assay kits, including those for insulin ELISA, total cholesterol (TC), total triglyceride (TG), malondialdehyde (MDA), total superoxide dismutase (T-SOD), glutathione peroxidase (GSH-Px), and liver glycogen were procured from Nanjing Jiancheng Biological Research Institute (Nanjing, China).

2.2. Culture and Fermentation Procedure

GL strain was cultivated on potato dextrose agar (PDA) medium, consisting of potato 200.0 g/L, dextrose 20.0 g/L, agar 20.0 g/L, MgSO4 1.5 g/L, and KH2PO4 3.0 g/L. For the seed medium, potato dextrose broth (PDB) with the same composition was used, excluding agar. The OPP medium was prepared by adding a mixture of oats and purple potatoes (oat to purple potato ratio of 6:4) to a 250 mL conical flask and adjusting to 60% moisture content with distilled water. All mediums were sterilized at 121 °C for 20 min and cooled to room temperature for use.
Five pieces of GL mycelium blocks (5 mm × 5 mm) were inoculated into 250 mL flasks containing 100 mL seed medium and incubated on a reciprocal shaker at 28 °C and 120 rpm/min in darkness for 7 days. Subsequently, 10% of the seed culture was added to the OPP medium, thoroughly mixed, and conducted at 28 °C in darkness for 10 days until full mycelium growth was observed (Figure 1). The unfermented medium underwent similar storage conditions for 10 days as a control.

2.3. Sample Preparation

Both unfermented and fermented products underwent drying at 80 °C for 10 h, followed by crushing through a 60-mesh sieve and mixing evenly to obtain OPP and F-OPP flours (OPPF and F-OPPF). These flours were degreased with petroleum ether at a 1:4 (w/v) ratio for 4 h, followed by centrifugation at 1500 r/min for 5 min to collect the precipitate. The defatted flour was dissolved and mixed well with 0.2% NaOH solution at a 1:6 (w/v) ratio, with subsequent pH adjustment to 10.0. After stirring for 2 h at 30 °C, centrifugation was conducted at 4000 r/min for 15 min. The resulting supernatant and brown precipitate layer were removed, while the white precipitate at the bottom was collected. Further washing, centrifugation, and settling ensued until clarification of the centrifugal solution. The precipitate was neutralized with HCl solution, dried at 40 °C for 9 h, and then crushed and sieved through an 80-mesh sieve to obtain OPPF and F-OPPF starch (OPPS and F-OPPS).
The extraction of insoluble dietary fiber (IDF) from OPPF and F-OPPF adhered to the methodology stipulated in Chinese National Standards [18]. Initially, a sugar removal treatment was administered to the sample, wherein 50 g of the material underwent a thorough rinsing with 85% ethanol, repeated three times, followed by drying at 40 °C for 12 h. Subsequently, enzymatic treatment ensued with heat-stable α-amylase (10,000 U/mL), starch glucosidase (300 U/mL), and protease (3000 U/mL) to remove starch and protein components. Post-enzymatic treatment, the mixture underwent centrifugation at 4800 r/min for 10 min, after which the supernatant was discarded. The precipitate was then washed with 70 °C distilled water, followed by successive washes with 78% ethanol, 95% ethanol, and acetone. Ultimately, the residue was dried at 105 °C for 12 h to yield IDF.

2.4. Single-Factor Experiments for Optimization

The impacts of three factors (temperature, material quantity, and inoculum size) on the triterpene content in F-OPPF were separately investigated. Five levels for single-factor were as follows: temperature (24 °C, 26 °C, 28 °C, 30 °C, and 32 °C), material quantity (25 g, 30 g, 35 g, 40 g, and 45 g), and inoculum size (6%, 8%, 10%, 12%, and 14%), with a foundational level of a 35 g material quantity, a 12% inoculum size, and a 28 °C temperature.

2.5. Response Surface Methodology for Optimization

Based on preliminary single-factor experiments, a Box–Behnken design was employed, with temperature, material quantity, and inoculum size as independent variables and the triterpene content as the response value. This three-factor, three-level response surface methodology was used to establish an optimization model (Table 1).

2.6. Fermentation Time for Optimization

Under optimized conditions of response surface methodology (RSM), the triterpene content in F-OPPF was determined from day 0 through day 21 of fermentation. The optimal fermentation time was determined based on the time when triterpene content was highest.

2.7. Determination of Nutritional and Bioactive Compositions

The determination of total starch, protein, fat, total sugar, crude fiber, ash, mineral element, and amino acid was conducted according to Chinese National Standards [19] (acid hydrolysis), Ref. [20] (Kjeldahl’s method), Ref. [21] (Soxhlet extractor method), Refs. [22,23,24] (first method), Refs. [25,26] (16 types of amino acids), respectively. Soluble protein content was determined using the Coomassie brilliant blue method [27]. Total phenol content was measured by the Folin–Cioncalteu colorimetric method [28] following extraction with 60% ethanol. Polysaccharide content was determined as described by Cen et al. [17] after extraction with distilled water.
Triterpene content was determined following the Chinese agricultural standard [29]. Precisely 0.5 g of the sample was placed in 50 mL of anhydrous ethanol and subjected to ultrasound-assisted extraction for 1 h. The mixture was centrifuged at 8000 rpm for 10 min, and the supernatant was collected. After evaporating 0.2 mL of the extract in a 95 °C water bath, 0.1 mL of a 5% vanillin-acetic acid solution and 0.8 mL of concentrated perchloric acid were added and incubated in a 60 °C water bath for 20 min. The reaction was stopped by transferring to an ice water bath for 5 min. Finally, 5 mL of glacial acetic acid was added, and the absorbance was measured at 550 nm. Oleanolic acid was used to prepare the standard curve.
The determination of total flavonoid content involved constructing a standard curve of rutin, with mass concentration plotted on the abscissa and absorbance on the ordinate. A 5 g sample was added to 30 mL of 60% ethanol and subjected to ultrasound extraction at 60 °C for 1 h. Following centrifugation at 8000 r/min for 10 min, the supernatant was diluted to 50 mL with 60% ethanol. A 1 mL aliquot of the extract was mixed with 5 mL of 60% ethanol and 0.3 mL of 5% sodium nitrite, followed by an 8-min incubation. Subsequently, 0.3 mL of 10% aluminum chloride was added and allowed to stand for 10 min. A total of 4 mL of 4% NaOH was added, and the mixture was diluted to 10 mL with 60% ethanol. The absorbance was measured at 510 nm after 10 min. Concurrently, a reaction solution without NaOH served as a blank. The concentration of total flavonoids was obtained from the rutin standard curve, and total flavonoid content was calculated by the concentration difference between the reaction solution and blank.

2.8. SEM, XRD, and FTIR Assays

An appropriate quantity of OPPF and F-OPPF samples were deposited onto copper sheets and sputter-coated with gold. Micrographs at 5000× and 7000× magnifications, corresponding to scale bars of 10 μm and 5 μm, were digitally captured using a Nano SEM-450 scanning electron microscope (FEI, Hillsboro, OR, USA) at a 5 kV accelerating voltage.
X-ray diffraction (XRD) analysis was conducted using an X-ray diffractometer (XRD-6000, Shimadzu, Kyoto, Japan) operating at 40 kV and 30 mA, with a scan range of 5–90° (2θ) and a scanning speed of 2°/min. The relative crystallinity was determined as the ratio of the sum of the area of each significant peak to the total area under the curve [30].
For Fourier transform infrared spectroscopy (FTIR), OPPF, F-OPPF, OPPS, and F-OPPS were mixed with dry potassium bromide powder and tableted. The FTIR spectra of the samples were recorded using an IRPrestige-21 FTIR spectrometer (Shimadzu, Kyoto, Japan) across the range of 4000 to 400 cm−1.

2.9. Thermogravimetric Determination

A sample weighing 5.0 mg was placed in an alumina crucible, with an empty aluminum plate serving as a blank. The thermogravimetric behavior of OPPF and F-OPPF was examined using an AS-3T thermogravimetric analyzer (HITACHI, Tokyo, Japan), measuring the mass change at a heating rate of 20 °C/min within the temperature range of 25–800 °C under a helium atmosphere.

2.10. DPPH, Hydroxyl, Superoxide Anion Radical Scavenging Ability Assays

Extracts were obtained by adding 5 g of sample to 100 mL of anhydrous ethanol, followed by ultrasonic extraction at 60 °C for 1 h and centrifugation at 8000 r/min for 15 min. The supernatant was transferred to a 100 mL volumetric flask and then diluted to various concentrations. The hydroxyl radical scavenging capacity was expressed as the equivalent Trolox standard contained in 1 g of dry weight sample (μmol Trolox/g DW). A total of 1 mL of extracts at various concentrations (1–5 mg/mL) was sequentially mixed with 1 mL of 1.5 mM 1,10-phenanthroline, 2 mL of PBS buffer (pH = 7.4), 1 mL of 1.5 mM FeSO4, and 1 mL of 0.03% H2O2, and incubated at 37 °C for 60 min. Absorbance was measured at 510 nm (A2). The absorbances of the reaction mixture using ethanol instead of H2O2 (A1) and extract (A0) were recorded. The hydroxyl radical scavenging rate was calculated as follows:
Hydroxyl   radical   scavenging   rate   ( % ) = A 2 A 0 A 1 A 0   ×   100
A total of 2 mL of extracts at various concentrations (1–5 mg/mL) was mixed with 2 mL of 0.1 mM DPPH ethanol solution and incubated in the dark for 30 min. Absorbance was measured at 517 nm (Ai). The absorbances of the reaction mixture using ethanol instead of DPPH (Aj) and extract (A0) were recorded. The radical scavenging capacity was expressed as the equivalent Trolox standard contained in a 1 g dry weight sample (μmol Trolox/g DW), and the scavenging rate was calculated as follows:
DPPH   radical   scavenging   rate   ( % ) = 1 A i A j A 0   ×   100
A total of 1 mL of diluted extracts at different concentrations (1–5 mg/mL) was mixed with 5 mL of 50 mM Tris-HCl (pH 8.2) and incubated at 25 °C for 20 min. Subsequently, 0.5 mL of preheated pyrogallol (2.5 mM) was added, and the mixture was swiftly transferred into a cuvette. Absorbance was measured every 0.5 min at 320 nm. The determination of absorbance was carried out by zeroing the mixture obtained by replacing pyrogallol with 0.5 mL of 10 mM HCl. Regression analysis was conducted with time as the independent variable and absorbance as the dependent variable, with the slope of the regression equation representing the self-oxidation rate (V1; ∆OD/min). The self-oxidation rate for the control group using ethanol instead of extract was noted as V0. Radical scavenging capacity was expressed as the equivalent Trolox standard contained in a 1 g dry weight sample (μmol Trolox/g DW), and the clearance rate was calculated as follows:
Superoxide   anion   radical   scavenging   rate   ( % ) = V 0 V 1 V 0   ×   100

2.11. α-Amylase and α-Glucosidase Inhibition Assays

The extraction method was the same as described above, with 60% ethanol as the solvent. A total of 500 μL of extracts at different concentrations (1–5 mg/mL) was mixed with 500 μL of α-amylase solution (5 U/mL) and incubated at 37 °C for 10 min. Subsequently, 500 μL of 1% starch solution was added, and the mixture was further incubated at 37 °C for 10 min. The reaction mixture was added to 2 mL of DNS and heated in a boiling water bath for 5 min. After cooling to room temperature, the mixture was diluted to 25 mL, and absorbance (A1) was measured at 540 nm. The absorbance of the reaction mixtures, obtained by replacing the extract with ethanol and replacing the enzyme solution with PBS buffer (pH 6.9), was denoted as A0 and A2. The absorbance of the mixture obtained by replacing the extract with ethanol and enzyme solution with buffer was denoted as A3. The α-amylase inhibition rate was calculated as follows, and the inhibition capacity was expressed as the equivalent Acarbose standard contained in a 100 g dry weight sample (mmol Acarbose/100 g DW).
Inhibition   rate   ( % ) = ( 1 A 1 A 2 A 0 A 3 )   ×   100
Furthermore, 100 μL of α-glucosidase solution (0.5 U/mL) was mixed with 50 μL of diluted extracts (1.5–7.5 mg/mL), reacting for 10 min. The mixture was then combined with 100 μL of p-nitrophenyl-α-D-glucopyranoside (PNPG, 5 mmol/L) and incubated for 20 min. A total of 1 mL of Na2CO3 solution (1 mol/L) was added to terminate the reaction, and absorbance was measured at 405 nm. The calculation of the α-glucosidase inhibition rate was the same as for α-amylase, and inhibition capacity was expressed as the equivalent Acarbose standard contained in a 100 g dry weight sample (mmol Acarbose/100 g DW).

2.12. Adsorption Capacity of Insoluble Dietary Fiber Assay

The quantification of cholesterol adsorption capacity (CAC), glucose adsorption capacity (GDC), and glucose dialysis retardation index (GDRI) was executed following methodologies delineated by Jia et al. [31], Peerajit et al. [32], and Zheng et al. [33], respectively. Cholesterol and glucose contents were assessed via the o-phthalaldehyde (OPA) and DNS methods, respectively, with absorbance measurements conducted at 550 nm and 540 nm. Calibration curves derived from cholesterol and glucose standards facilitated quantification, with resultant adsorption capacity values expressed as mg/g dry weight (DM).
For sodium cholate adsorption capacity, 0.1 g of IDF was mixed with 20 mL of sodium cholate solution (0.2 mg/mL), with the pH adjusted to 7 to mimic intestinal conditions. Incubation was carried out at 37 °C with agitation at 170 r/min for 15, 30, 45, 60, 75, and 90 min. Sodium cholate content was assessed using the furfural colorimetric method post-centrifugation at 4000 r/min for 20 min. Pre- and post-adsorption supernatants were analyzed for sodium gallate content to compute sodium cholate adsorption capacity.

2.13. Animal Model for Type 2 Diabetes Mellitus

Forty-nine male Sprague Dawley (SD) rats (150 ± 10 g; six weeks old) were purchased from Liaoning Changsheng Biotechnology Co., Ltd. (Benxi, China) (License No. SCXK (Liao) 2020-0001) and housed in metabolic cages at a temperature of (25 ± 0.5) °C, humidity of 60 ± 5%, and 12 h light/dark cycle. The experimental procedures were approved by the Experimental Animal Ethics Committee and adhered to the Chinese National Standard [34].
After one week of adaptive feeding, rats were divided into two groups based on body weight. The normal control group (7 rats) received a normal diet, while the model group (42 rats) was fed a high-fat diet (66.5% basal feed, 20% sucrose, 10% lard, 2.5% cholesterol, and 1% sodium cholate). After 5 weeks, the model group received an intraperitoneal injection of STZ (30 mg/kg body weight) following a 12 h fast, while the control group received a citrate buffer vehicle (pH 4.5). Rats with fasting blood glucose (FBG) levels above 16.7 mmol/L on days 3 and 6 post-injection were considered T2DM rats and selected for further experiments.

2.14. Animal Group and Diet

During the 7-week intervention, rats were randomly divided into seven groups of five: normal control group (NC), diabetic control group (DC), positive control group (PC), OPPF group (O), and low/medium/high-dose F-OPPF group (FL/FM/FH). Groups NC and DC were fed a basic diet, while groups PC, O, and FL/FM/FH were fed diets containing 0.05% acarbose, 60% OPPF, and 17%/35%/60% F-OPPF (w/w), respectively. Daily food intake was recorded.

2.15. Biochemical and Morphological Analysis

Throughout the 7-week intervention, weekly measurements of fasting body weight and fasting blood glucose were taken. Blood glucose was measured using a glucose meter after collecting blood from the tail vein. At the end of the intervention, after a 12 h fast, blood samples were collected from the posterior venous plexus under brief ether anesthesia and centrifuged to obtain serum, which was stored at −80 °C. All rats were sacrificed by cervical dislocation under ether anesthesia. Pancreas, liver, and kidney tissues were excised, washed, and preserved in 4% paraformaldehyde for histological analysis. A portion of the liver lobules were taken and stored at −80 °C for measurement of liver glycogen content. Biochemical parameters related to glucose and lipid metabolism, oxidative stress, insulin, liver, and kidney function were measured using reagent kits. Tissue morphology was observed under the microscope (400×) following dehydration, paraffin embedding, slicing, patching, dewaxing, and hematoxylin-eosin staining [35]. The insulin sensitivity index (ISI) and homeostasis model assessment of insulin resistance (HOMA-IR) were calculated as follows:
I S I = l n ( 1 FINS   ×   FBG ) H O M A - I R = FINS   ×   FBG 22.5
H O M A - I R = FINS   ×   FBG 22.5

2.16. Oral Glucose Tolerance Test (OGTT) and Insulin Tolerance Test (ITT)

After six weeks of intervention, rats received an oral glucose dose (2.5 g/kg) after an 8 h fast. Blood glucose levels were measured at 0, 30, 60, 90, and 120 min post-gavage. The integrated area under the blood glucose curve (AUC) was calculated. Three days later, insulin (0.15 U/kg) was administered intraperitoneally after an 8 h fast, and blood glucose was measured as in the OGTT procedure.

2.17. Statistical Analysis

Experimental design and data analysis for RSM were performed using Design Expert 13.0 software. All results were presented as mean ± standard deviation from each repeated experiment. To ascertain the significance of observed differences, the dataset was subjected to analysis of variance (ANOVA) utilizing IBM SPSS 27.0 software (IBM Corp., Armonk, NY, USA).

3. Results

3.1. Optimization of Fermentation Conditions

3.1.1. Single-Factor Experiments Results

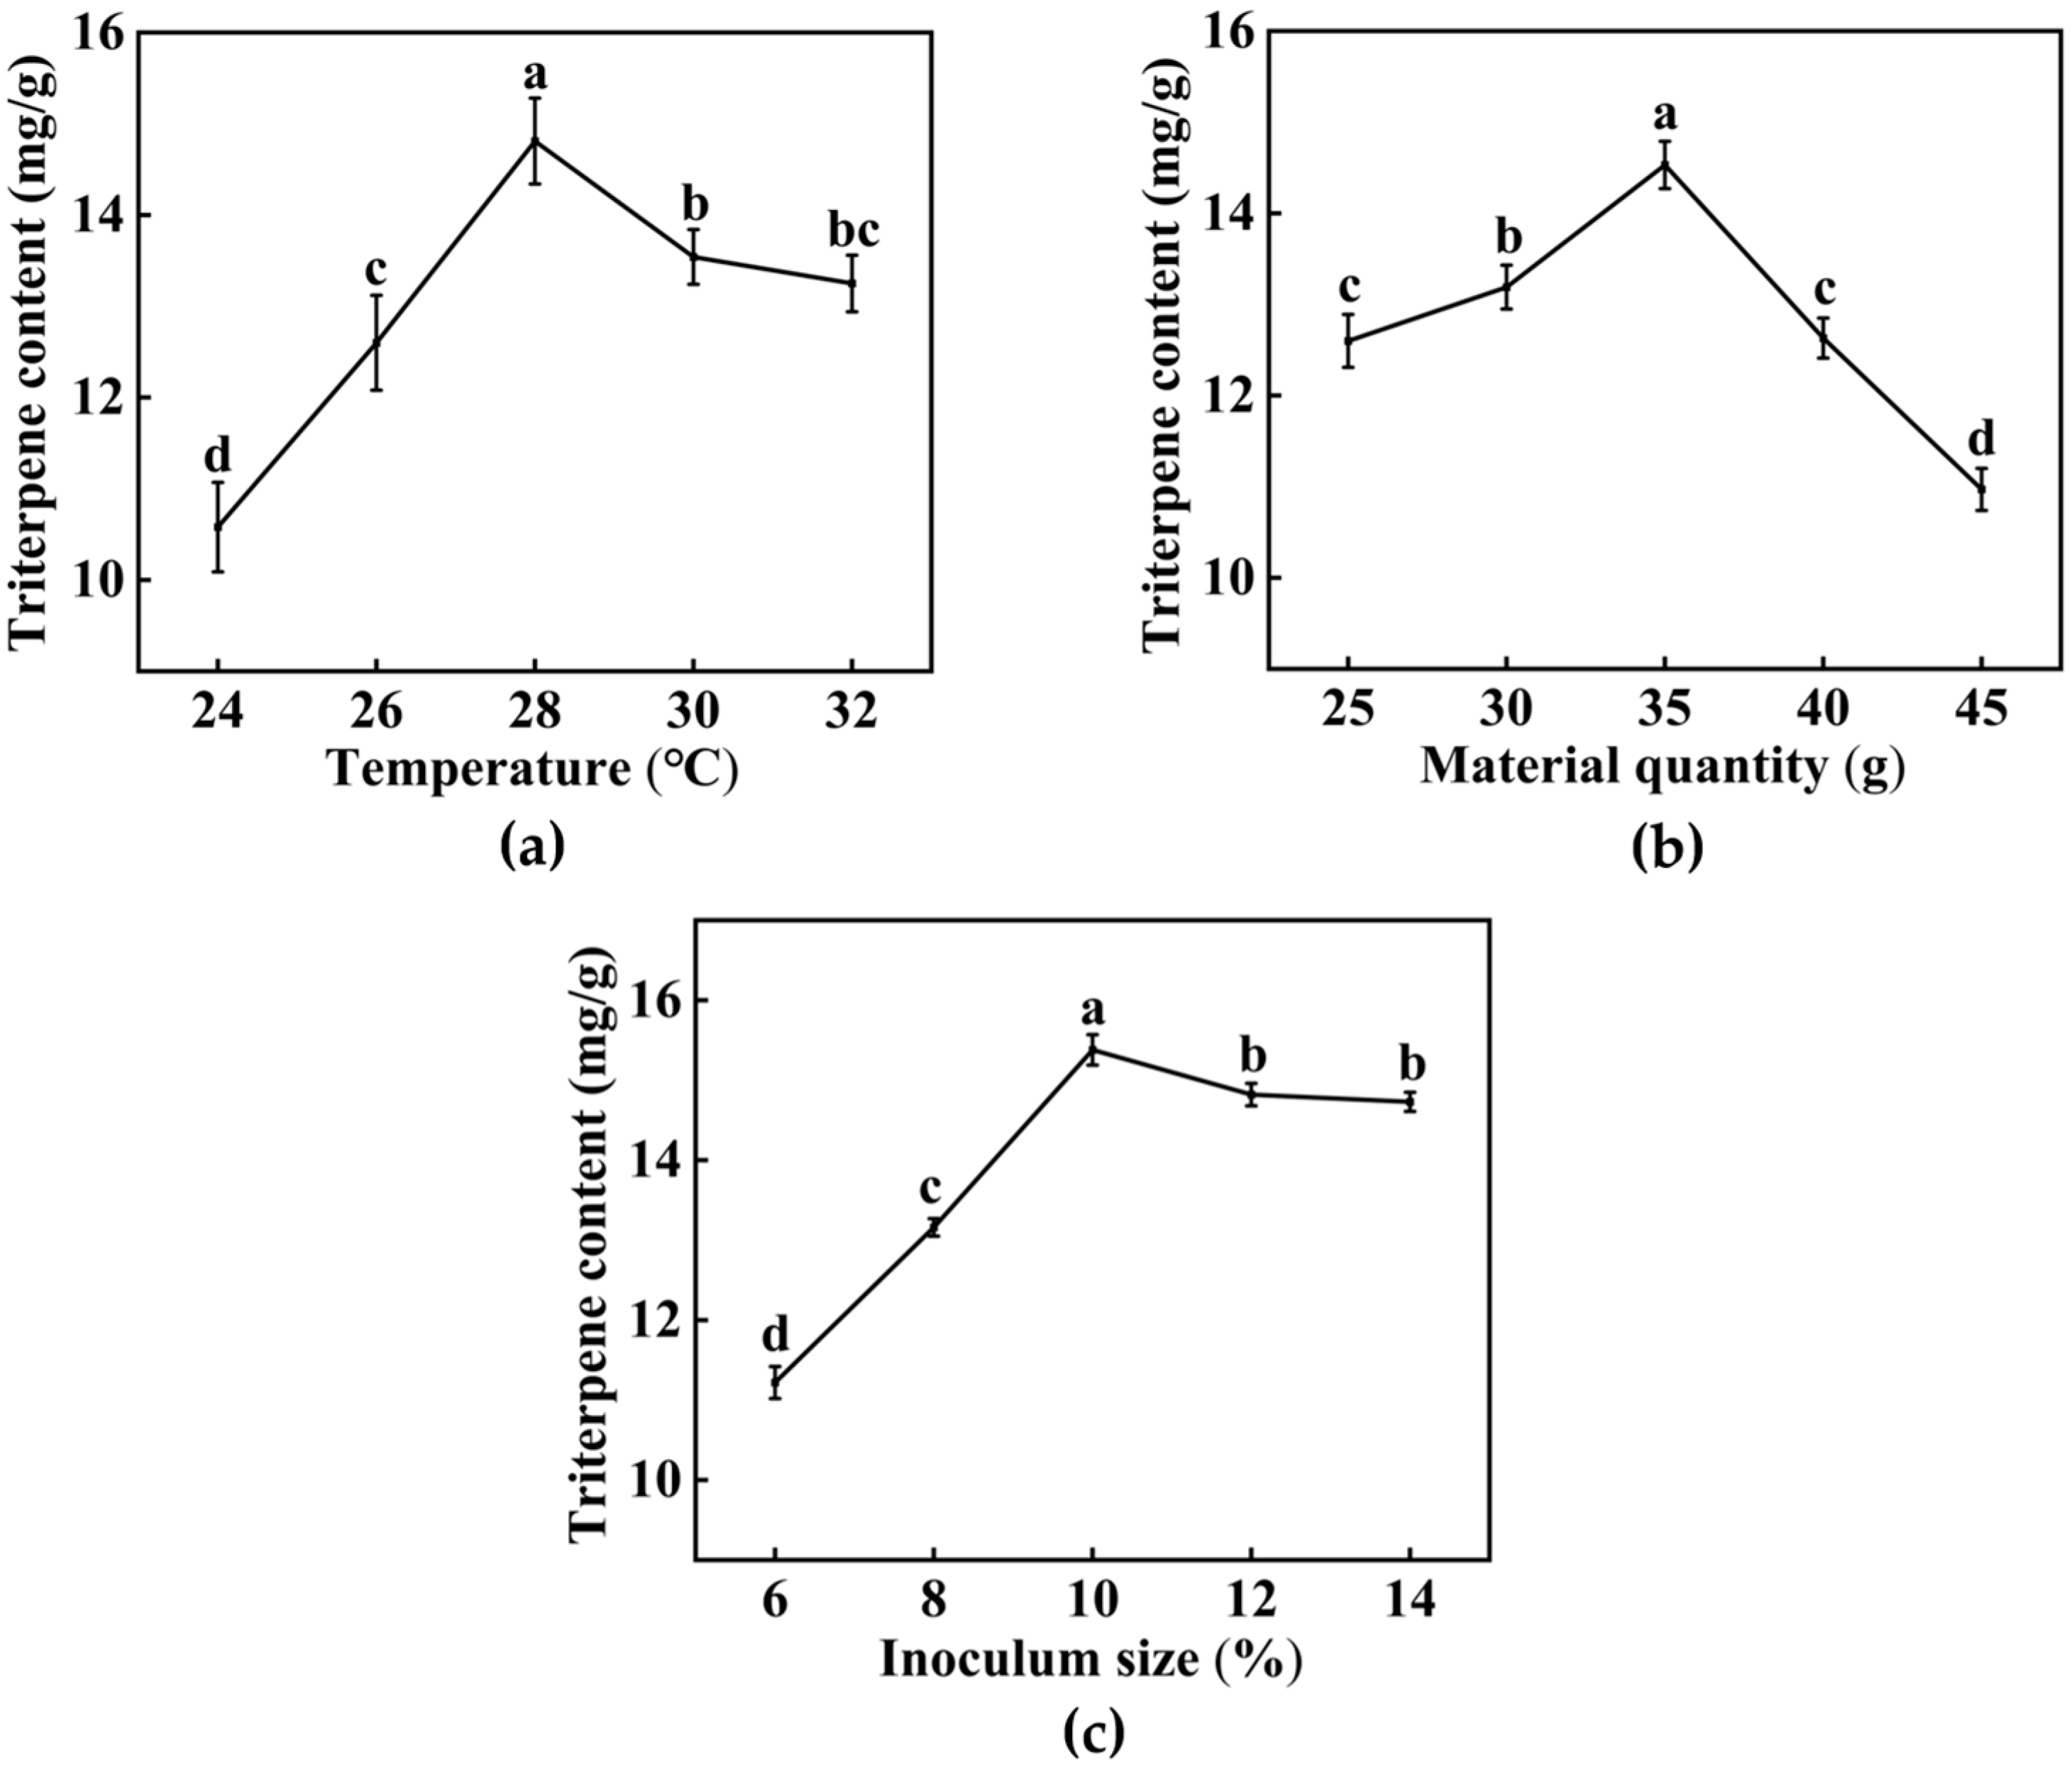
Figure 2 illustrates the initial increase and subsequent decrease in triterpene content with increasing temperature, material quantity, and inoculum size. A low inoculum size results in insufficient utilization of nutrients in substrate by mycelium, thereby prolonging the fermentation cycle. However, excessive inoculation leads to rapid consumption of nutrients, resulting in premature aging of mycelium. Furthermore, rapidly generated metabolites have a feedback inhibitory effect on the growth of mycelium [36]. The variation of triterpene content with material quantity stems from the insufficient oxygen supply to mycelium by influencing the ventilation flow inside the flask. The variation of triterpene content with temperature can be attributed to the suitable temperature required for the growth of GL mycelium itself. Furthermore, the biological heat generated by the metabolism may affect the utilization of substrate by mycelium through material compaction.

3.1.2. Response Surface Methodology for Optimizing Fermentation Conditions

In the optimization process, the triterpene content in F-OPPF served as the primary assessment indices, and RSM was employed to refine the fermentation conditions. The parameters and corresponding levels outlined in the Box–Behnken design (Table 2) were established based on the findings from single-factor experiments. The quadratic model fitted for the triterpene content in coded variables can be elucidated through the following quadratic regression equation:
Y =   15.82     0.22 A +   0.26 B +   0.5 C   0.41 AB   +   0.39 AC   +   0.15 BC     1.37   A 2     1.14   B 2     1.28   C 2
where Y—the triterpene content (mg/g); A—temperature (°C); B—material quantity (g); and C—inoculum size (%).
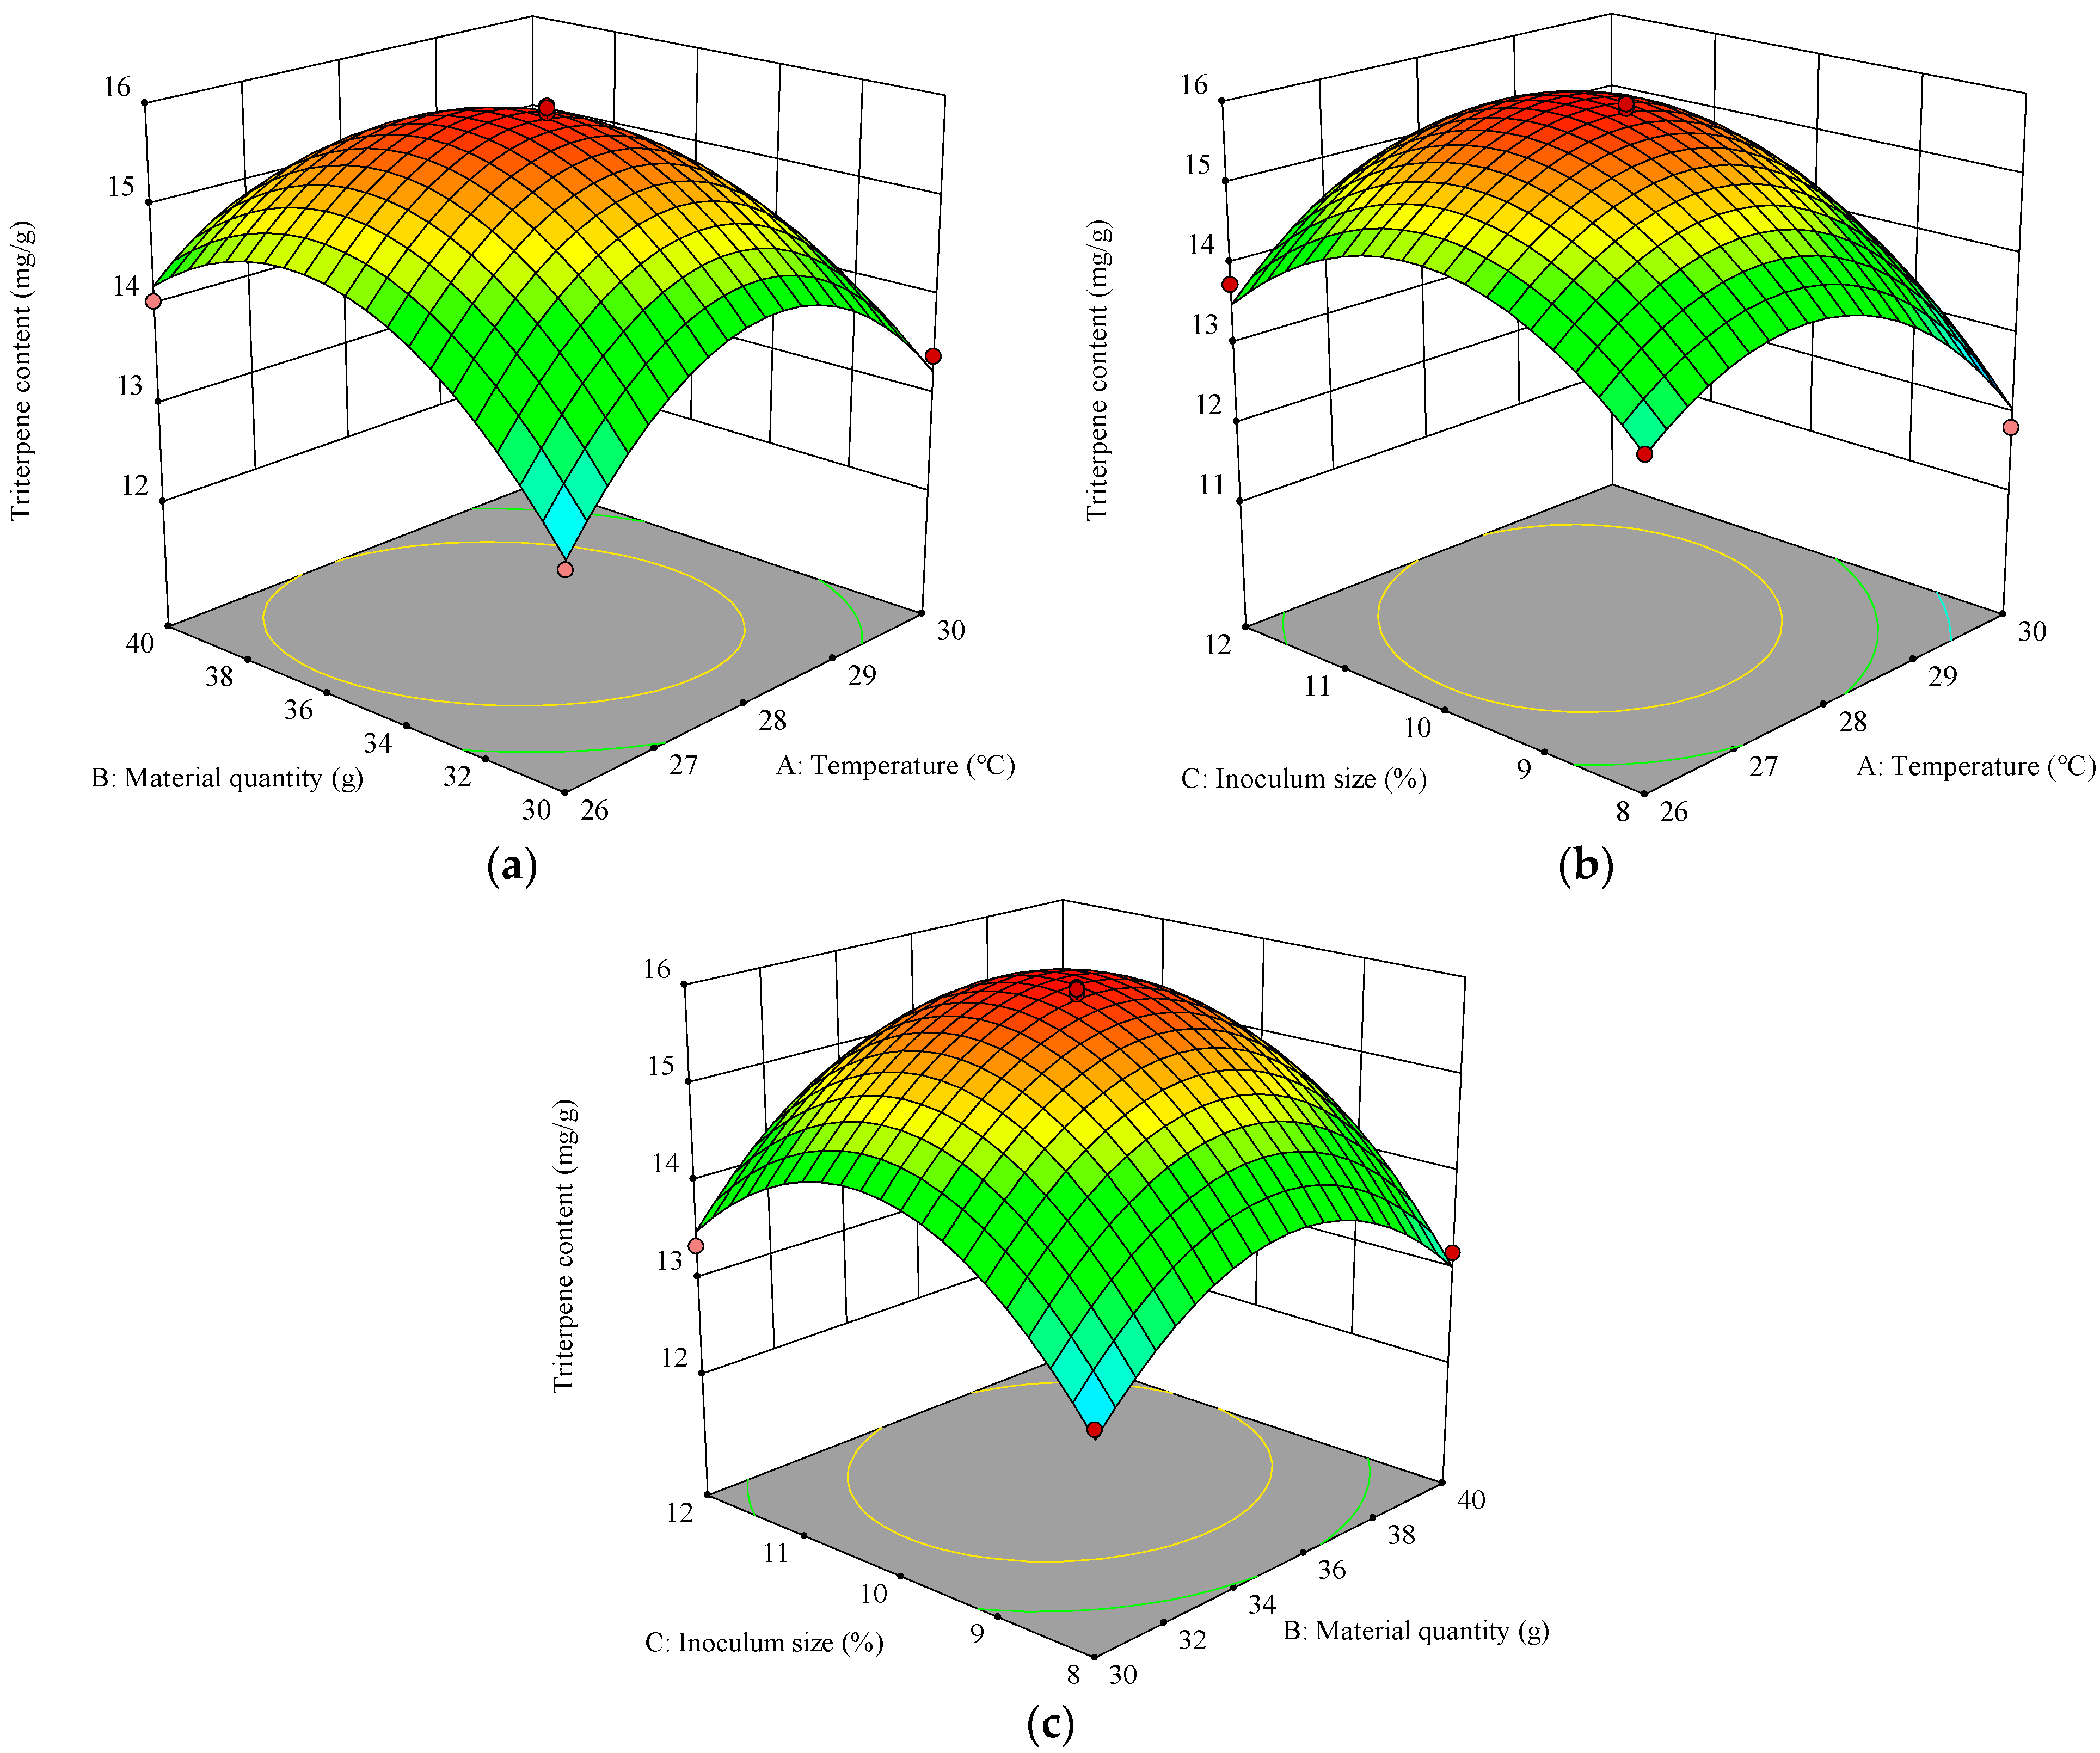
ANOVA was conducted to evaluate the significance of the model and variables, both in linear and quadratic forms (Table 3). The p-value for the regression model was below 0.0001, indicating a significant quadratic model. The lack-of-fit was non-significant (p > 0.05), demonstrating a good fit with minimal error. The determination coefficient (R2) of 0.9863 indicates that the model effectively captures response variations. Significant factors included temperature (A), material quantity (B), inoculum size (C), and their interactions (AB and AC), along with quadratic terms (A2, B2, and C2). The response surface plots indicate an initial increase followed by a decrease in triterpene content with varying interaction factor levels (Figure 3). The elliptical contour lines for interaction between temperature and material quantity, as well as temperature and inoculum size, underscore its critical importance, corroborated by variance analysis. The influence of factors on triterpene content ranks as follows: C (inoculum size) > B (material quantity) > A (temperature). Optimal conditions identified were a temperature of 27.848 °C, material quantity of 35.704 g/250 mL, and inoculum size of 10.386%, predicting a triterpene content of 15.891 mg/g. Experimental validation under these conditions, adjusted to practical values (28 °C, 36 g/250 mL, 10%), yielded a triterpene content of 15.94 mg/g, closely matching the predicted value and validating the reliability of the model.

3.1.3. Determination of Fermentation Time

Triterpene content exhibited a dynamic pattern, starting with lower content than the initial value on day 3 of fermentation due to the consumption of substrate by mycelium in the early stage of fermentation (Figure 4). From days 3 to 13, the triterpene content gradually increased to the maximum value of 17.23 mg/g, with a 1.02-fold increase compared to the initial value. This phenomenon can be attributed to the release of triterpene saponins facilitated by fermentation and the secretion of ganoderic acids (GAs) by mycelium [37]. As mycelium aged in the later stage of fermentation, the triterpene content gradually decreased from days 13 to 21, with a dramatic decrease from day 15 onwards. Therefore, the optimal time was determined to be day 13 of fermentation.

3.2. Nutritional Quality Analysis

3.2.1. Main Nutritional Composition Analysis

Following fermentation, a significant reduction in total starch content by 28.19% and total sugar content by 14.83% was observed (p < 0.05) (Table 4), indicating the utilization of starch-based carbon sources by the mycelium for its growth. Concurrently, F-OPPF exhibited a notable increase in protein content by 12.02% and soluble protein content by 57.88% (p < 0.05). While early-stage fermentation consumed nitrogen sources from the substrate, subsequent stages of fermentation contributed to the synthesis of new proteins. Similar findings by Lou et al. [38] regarding the GL fermentation of cereals and by Zhai et al. [27] on solid-state fermentation of oats by Agaricus blazei Murrill underscore the potential for protein enhancement during fungal fermentation processes. The increase in soluble protein content is attributed to the protease secreted by mycelium degrading high-molecular-weight proteins into low-molecular-weight proteins and peptides. Furthermore, the consumption of starch weakens the binding between starch and protein, increasing protein dissolution [39].
The significant increase in crude fiber content by 79.19% (p < 0.05) post-fermentation may result from the formation of new structural entities through interactions between enzymatic hydrolysis products and cellulose [40]. The ash content also rose by 35.09% (p < 0.05), which can be attributed to the mycelium’s capacity to adsorb mineral elements. However, no significant change in fat content was observed post-fermentation in this study (p > 0.05). The observed nutrient transformations may also be explained by the “concentration effect”, where the degradation of cellulose and hemicellulose into CO2 and H2O reduces dry weight, thereby increasing the relative mass fractions of various nutrients.
The mineral element contents of OPPF and F-OPPF are presented in Table 5, including nutrient elements of 11 types and pollutant elements of 6 types. After fermentation, the contents of Na, Mg, Ca, Mn, Cu, Zn, Se, and Sr increased by 44.69%, 47.66%, 55.52%, 56.60%, 39.14%, 35.75%, 100.01%, and 53.54%, respectively. This supports the increase in ash content and indicates the enhanced mineral profile of F-OPPF. Furthermore, the heavy metal contents (Cr, Ni, As, Cd, Hg, and Pb) remained within the safe limits established by the Chinese National Standard [41].

3.2.2. Amino Acid Analysis

The analysis of amino acids in OPPF and F-OPPF revealed the presence of 16 distinct amino acids (Table 6). Post-fermentation, essential amino acids (Thr, Val, Ile, Leu, Lys, Met, Phe, and Tyr) increased by 1.36%, while total amino acids (TAAs) decreased by 2.47%. Methionine, the first limiting amino acid in OPPF, exhibited a remarkable 2.75-fold increase post-fermentation. This suggested that the enzymatic processes during mycelium growth, including transaminases, contributed to amino acid conversion and enhancement [16]. It is worth noting that fungal fermentation introduces flavor modifications, evident in shifts in flavor amino acid profiles. The contents of sweet amino acids (Thr, Ser, Gly, Ala, Lys, and Pro) and bitter amino acids (Val, Met, Ile, Leu, Phe, His, and Arg) increased by 3.09% and 1.18%, respectively, while the umami amino acid (Asp and Glu) content decreased by 12.75%. The observed decrease in the ratio of UAAs + SAAs to BAAs, representing grain flavor, suggests that fermentation destroyed the original flavor profile of OPP.

3.2.3. Changes in the Contents of Polysaccharides, Flavonoids, and Total Phenols

The contents of active compositions, including polysaccharides, flavonoids, and total phenols, were tracked through the fermentation process (Figure 5). In the early stage of fermentation, the contents of polysaccharides and flavonoids in F-OPPF decreased from day 0 to 3, attributed to higher consumption rates compared to own synthesis due to the low activity of mycelium. Significant differences in polysaccharide and flavonoid contents were noticed around this time (p < 0.05). The total phenol content increased and then decreased from day 0 to 5 (p < 0.05), presumably due to the degradation of bran and cell walls by mycelium, promoting the release and consumption of polyphenols [40].
As fermentation continued and mycelium activity increased, the contents of these active components showed an upward trend, peaking on different days: polysaccharides on day 15 (26.46 mg/g), flavonoids on day 13 (1.11 mg/g), and total phenols on day 15 (3.20 mg/g), with an increase by 1.97, 2.36, and 1.54 times, respectively, compared to the initial values. The sudden decrease in polysaccharide content from day 7 to 9 may not be due to starch consumption but rather to the consumption of polysaccharides, such as β-glucan, present in the cell walls of the endosperm and aleurone layer. During the anaphase of fermentation (days 15 to 21), a notable decline in these contents was observed after reaching their peaks, indicating the cessation of effective synthesis and secretion by aging mycelium. Notably, these active composition contents decreased sharply on day 17, indicating a fast aging rate of mycelium.

3.3. Structural Analysis

3.3.1. Scanning Electron Microscopy (SEM)

The microstructural attributes of OPPF and F-OPPF were examined using scanning electron microscopy (SEM). Figure 6a,b illustrate the microstructural features of intact particles post-crushing. The OPPF particles exhibited an irregular prismatic morphology with a flat surface, while F-OPPF particles were enveloped by mycelium. Figure 6c,d present microstructural details of smaller particles at higher magnifications, offering insights into the internal cross-sectional morphology. The OPPF particles displayed flat internal cross-sections with surface irregularities due to crushing. In contrast, the interior of F-OPPF particles was penetrated by mycelium, forming a porous, honeycomb-like structure surrounding the mycelium. This structural alteration can be attributed to the enzymatic degradation of the substrate by mycelium.

3.3.2. X-Ray Diffraction (XRD)

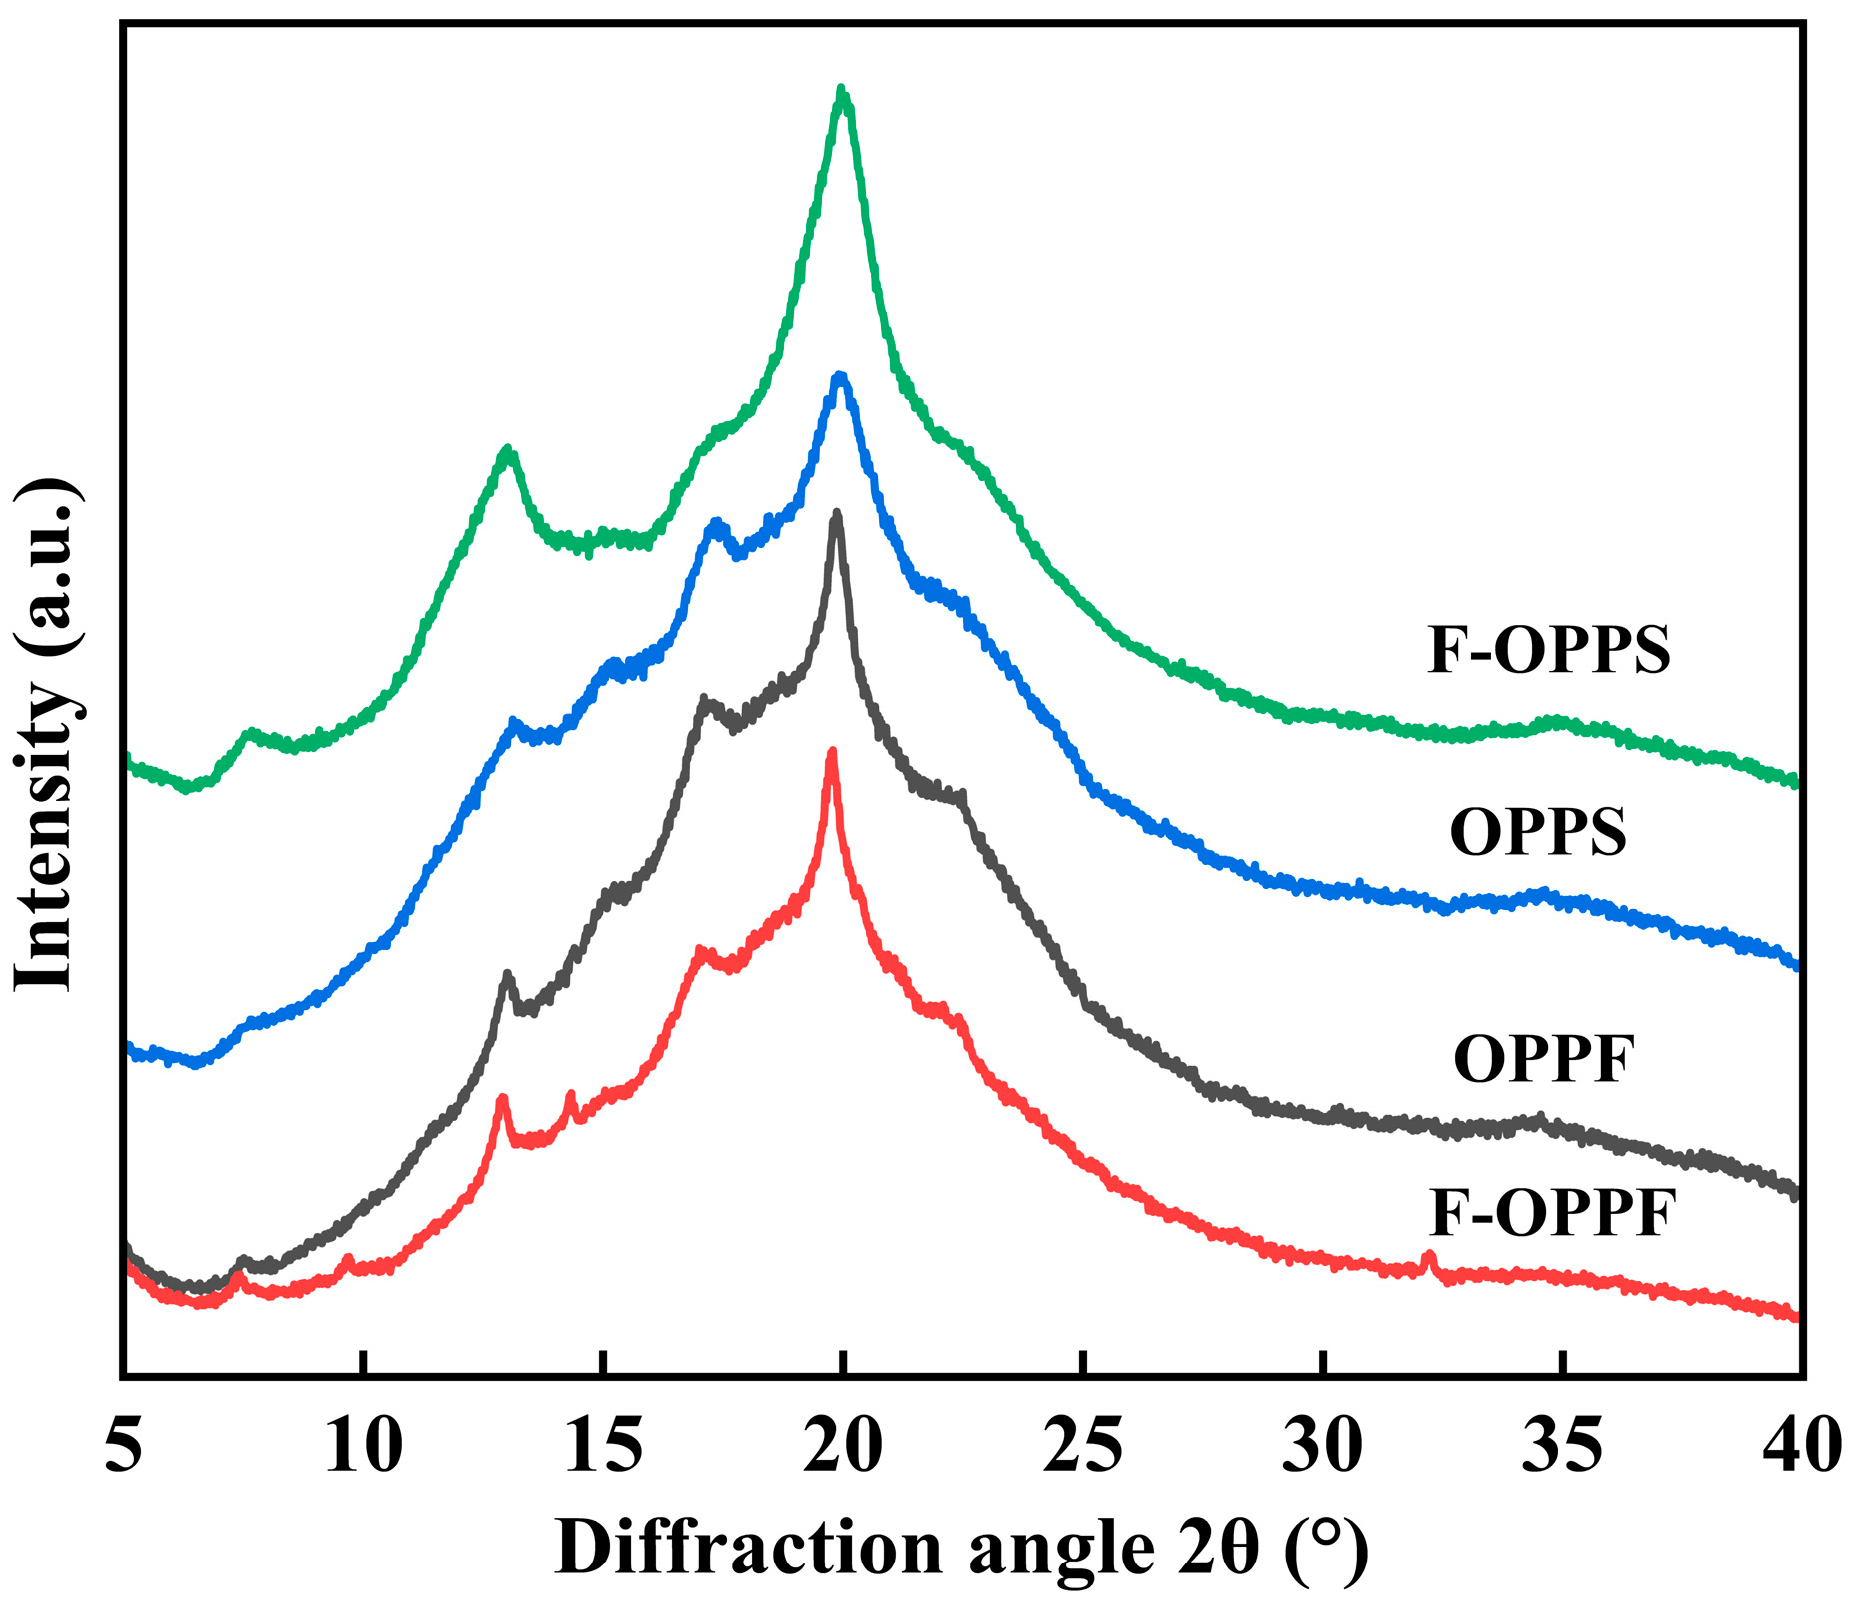
Crystal characteristics of OPPF, F-OPPF, OPPS, and F-OPPS were evaluated using X-ray diffraction (Figure 7). Starch crystalline polymorphs are typically categorized into A, B, C, and V types. The diffraction angles (2θ) of all samples reveal characteristic peaks at 7.5°, 13°, 15°, 17°, 20°, and 22.3°, indicative of a C + V-type crystal structure. Oat starch predominantly exhibits A-type crystal characteristics [30], while purple potato starch is characterized by C-type crystals [42]. Notably, despite being identified as C-type crystals, both A- and B-type crystals are discernible within the overall structure. The 20° diffraction peak corresponds to the V-type crystal structure associated with the presence of amylose-lipid complexes [43]. The appearance of V-type crystal structures is attributed to the high-temperature sterilization of the medium, wherein the amylose–lipid complexes undergo a process of heating and cooling, resulting in a more ordered semi-crystalline structure, as observed in cooked dough [44].
F-OPPS exhibits the highest crystallinity, while OPPF displays the lowest, with a descending order of F-OPPS (28.95%) > OPPS (20.00%) > F-OPPF (16.74%) > OPPF (14.63%). The starch extraction process does not lead to a reduction in crystalline regions, possibly due to the extraction process causing more pronounced damage to amorphous regions. Although the crystal type remains unaltered following fermentation, there is an increase in crystallinity. This phenomenon aligns with the findings of Gupta & Gaur [45], which observed increased crystallinity in pearl and finger millet starch through natural fermentation without altering the crystal structure. Similarly, Zhao et al. [46] reported analogous results during the natural fermentation of wheat starch. The increase in relative crystallinity following fermentation can be attributed to the action of acids and enzymes on amorphous regions, which possess loose structures and rich active sites [47]. Moreover, starches with higher crystallinity typically exhibit elevated resistant starch content due to the hindered accessibility of enzymes to ordered crystal structures [48].

3.3.3. Fourier Transform Infrared Spectroscopy (FTIR)

The FTIR spectra of all samples exhibit analogous absorption peaks within the spectral range of 400–4000 cm−1, indicative of no alteration in the types of hydrophilic and other reactive groups (hydroxyl groups, carboxyl groups, aldehyde groups, etc.) post-fermentation (Figure 8). The disappearance of protein absorption peaks at 1535 cm−1 (C-N and N-H stretching vibration) in both OPPS and F-OPPS signified protein removal during starch extraction. Conversely, the heightened absorption peak intensity at 1535 cm−1 in F-OPPF relative to OPPF indicated an increase in protein content following fermentation. The absorption peak at 1649 cm−1, corresponding to the amide I band, showed intensified random coiling in protein secondary structures, contributing to increased soluble proteins [17].
The augmentation in absorption intensity related to hydrogen bonding (3000–3600 cm−1) post-fermentation was indicative of an increase in inter- and intra-starch molecule hydrogen bonding. This phenomenon is attributed to the production of starch molecules with shorter chain lengths during fermentation, facilitating stronger intermolecular interactions favoring the formation of ordered crystallites [46]. Additionally, the intensified absorption peaks at 2927 cm−1 and 1020 cm−1 post-fermentation reflected the generation of new polysaccharides while consuming starch. The diminished absorption peak near 1740 cm−1, corresponding to the stretching vibration of C=O in the ester bond, suggested lipid ester bond oxidation induced by fermentation [17]. The consistent peak intensities observed in OPPS and F-OPPS indicated that the decreased intensity at 1740 cm−1 was not produced by changes in polysaccharides such as starch. The reduction in the 927 cm−1 peak intensity, associated with skeleton vibration of C-O-C in the α-1,4 glycosidic bond primarily present in cellulose [30], indicated cellulose degradation post-fermentation.

3.3.4. Thermogravimetric Analysis

The TG and DTG curves of OPPF and F-OPPF are depicted in Figure 9, illustrating distinct stages of the pyrolysis process: drying, pre-carbonization, carbonization, and combustion. During the drying stage (below 125 °C), both samples underwent the evaporation of free and bound water, with no significant difference in mass loss observed between OPPF and F-OPPF. In the pre-carbonization stage (125–250 °C), both samples underwent gradual depolymerization of macromolecules into smaller molecules, with F-OPPF showing a higher mass loss. As the temperature escalates to 250–350 °C, the carbonization stage commences, entailing thermal decomposition and hydrogen bond breakdown within the molecules. Both samples exhibited the largest mass change at this stage, with the fastest mass loss at 310 °C. Beyond 330 °C, the mass loss of F-OPPF began to be lower than that of OPPF due to its lower loss rate during the carbonization stage. In the combustion stage (above 350 °C), wherein the residue post-complete carbonization undergoes combustion, both samples exhibited the same and stable mass loss rate, with F-OPPF showing a consistently lower mass loss until the end.

3.4. In Vitro Functional Properties Analysis

3.4.1. Antioxidant Activity Analysis

Figure 10a–c illustrate the increased DPPH, hydroxyl, and superoxide anion radical scavenging rates of ethanol extracts with increasing concentrations, revealing a concentration-dependent relationship (p < 0.05). The ethanol extracts of F-OPPF exhibited greater sensitivity to concentration changes compared to OPPFs with more notable changes in inhibition rates. Fermentation enhanced the antioxidant activity of OPP’s ethanol-soluble components, as indicated by the decreased IC50 values for DPPH (OPPF: 4.55 mg/mL; F-OPPF: 2.58 mg/mL), hydroxyl (OPPF: 4.99 mg/mL; F-OPPF: 1.37 mg/mL), and superoxide anion (OPPF: 6.22 mg/mL; F-OPPF: 2.85 mg/mL) radical scavenging rates. Additionally, the radical scavenging capacities of ethanol extract gradually increased with fermentation time (Figure 10d–f), peaking on different time points: DPPH on day 13 (15.80 μmol Trolox/g DW), hydroxyl on day 11 (16.81 μmol Trolox/g DW), and superoxide anion on day 11 (15.27 μmol Trolox/g DW). The differences are an initial decrease in DPPH and superoxide anion radical scavenging capacities on day 3 and a dramatic decrease in superoxide anion radical scavenging capacity on day 13.

3.4.2. Hypoglycemic Activity Analysis

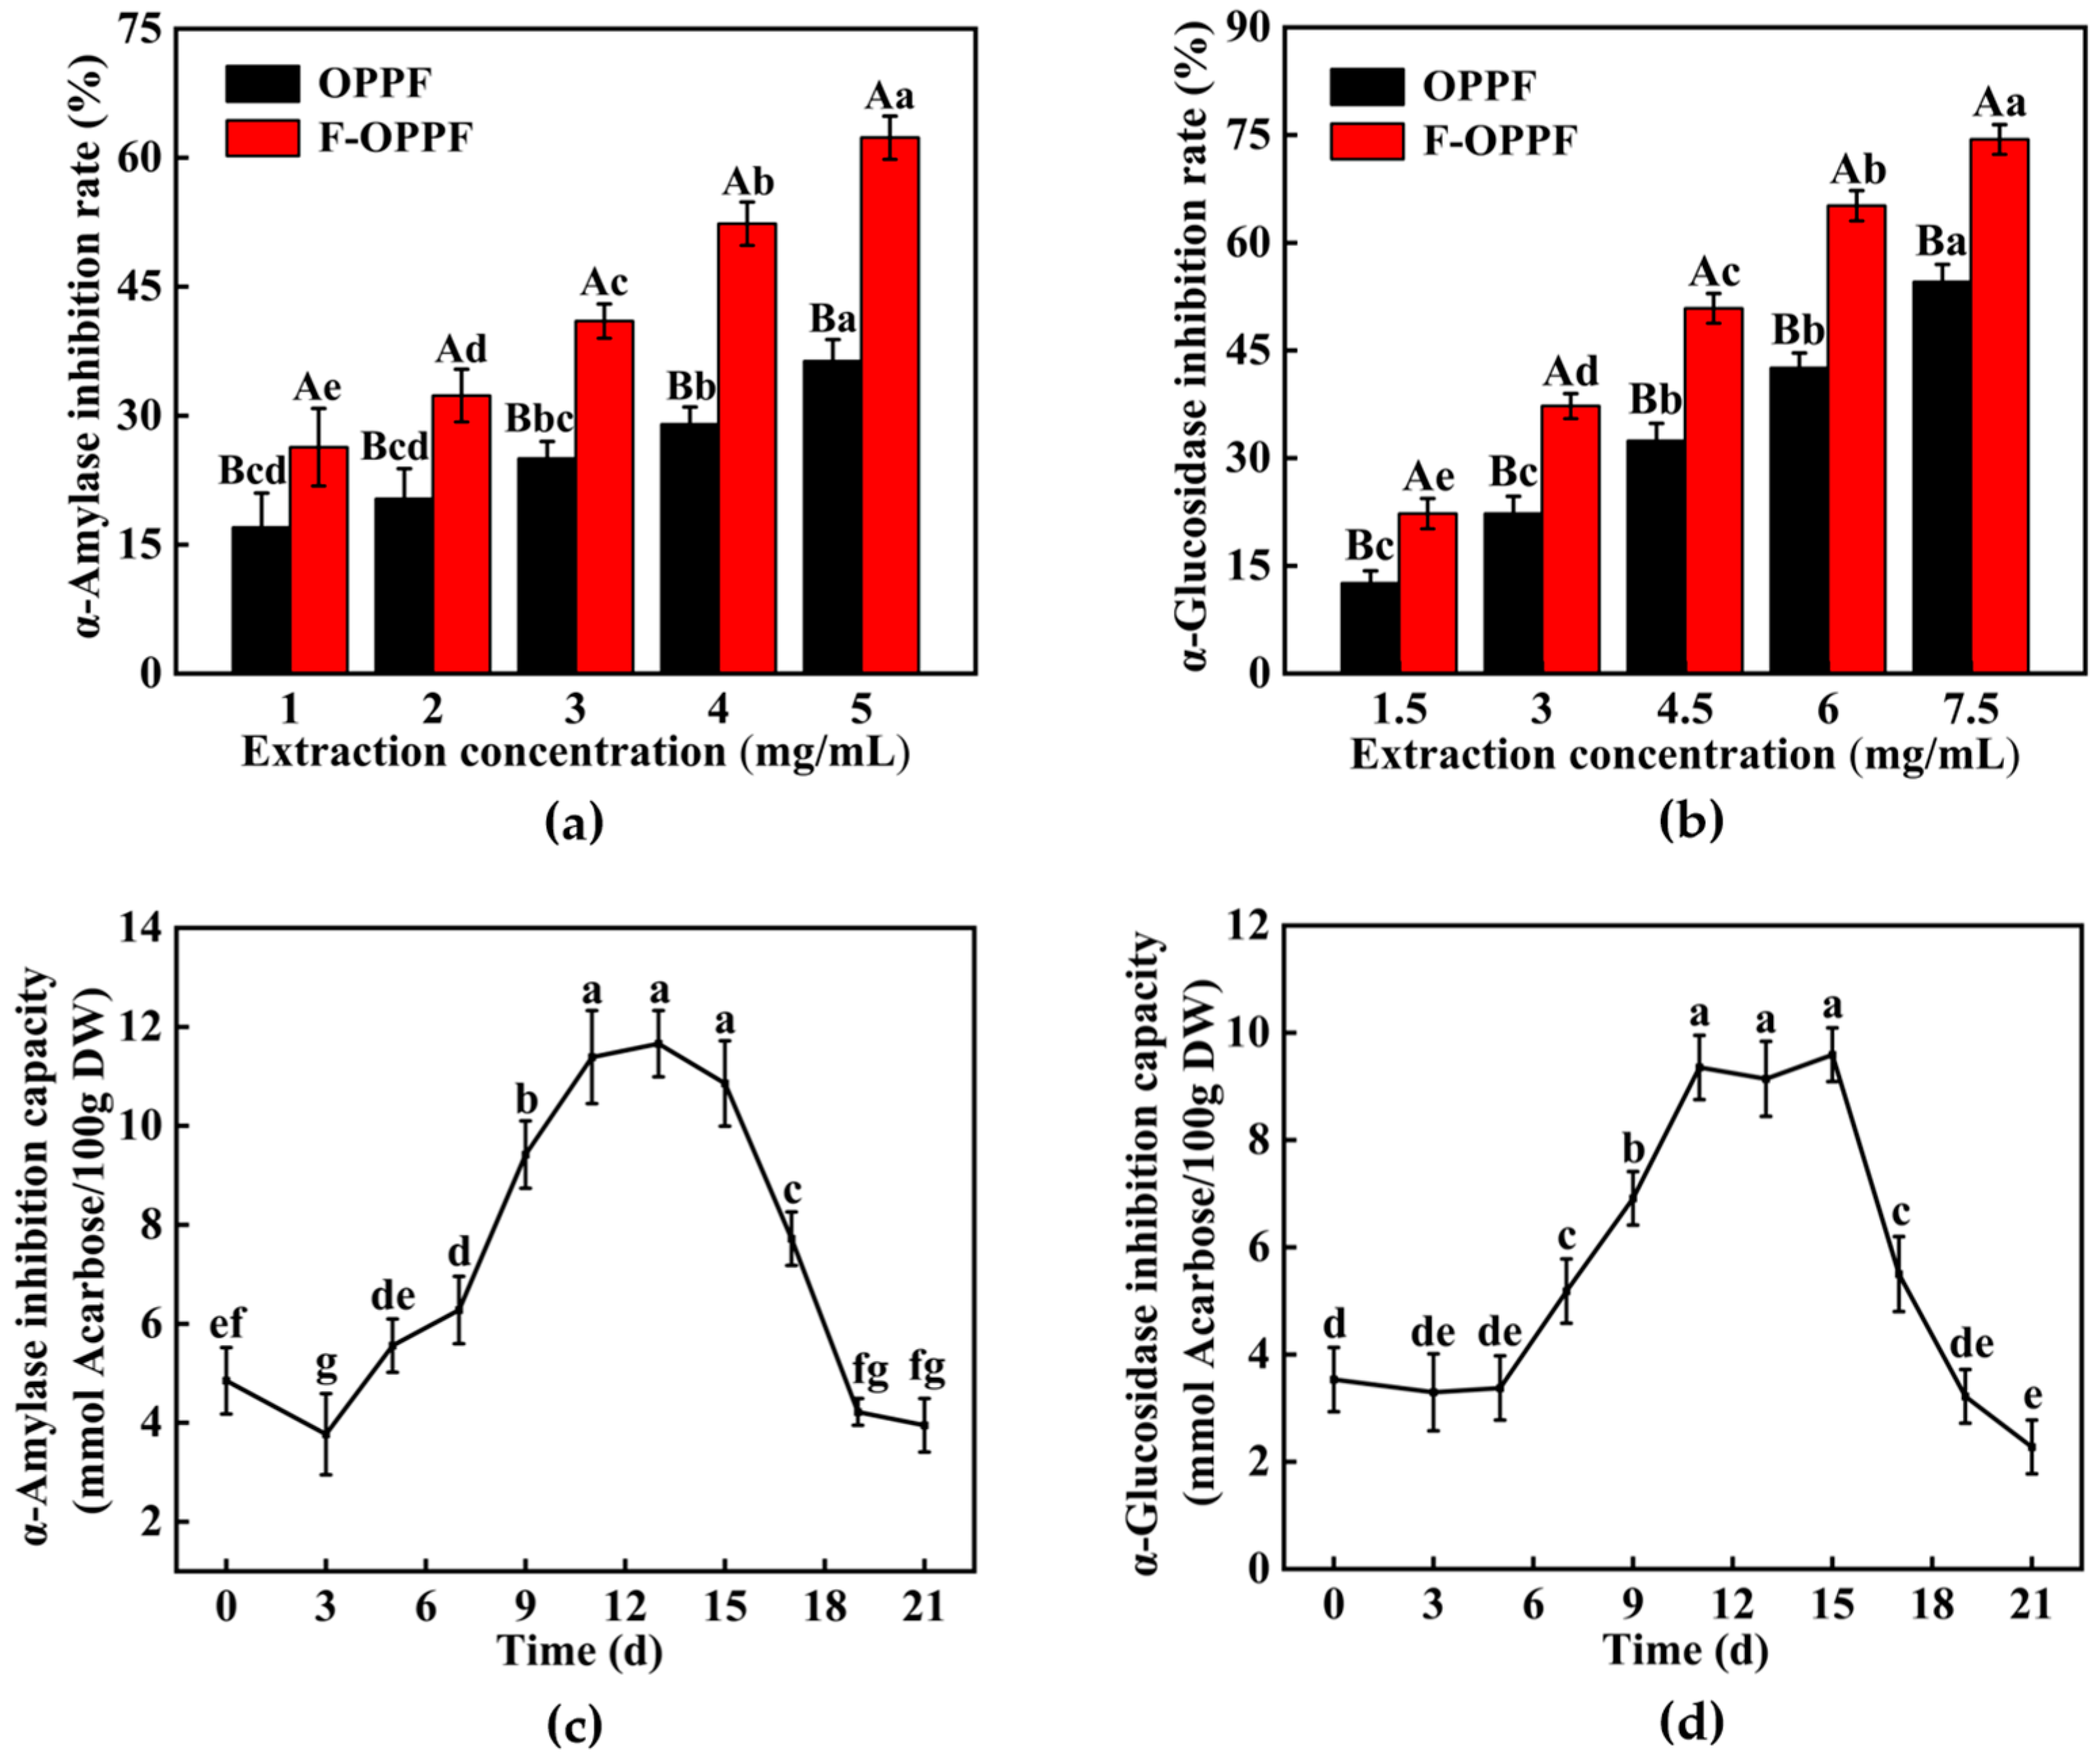
The inhibition rates of α-amylase and α-glucosidase by ethanol extract were examined, revealing a concentration-dependent relationship (p < 0.05) (Figure 11a,b). Fermentation significantly enhanced the hypoglycemic activity of ethanol-soluble compositions in OPP, with decreased IC50 values of α-amylase (OPPF: 8.17 mg/mL; F-OPPF: 3.78 mg/mL) and α-glucosidase (OPPF: 6.96 mg/mL; F-OPPF: 4.50 mg/mL) inhibition rates. In the early stage of fermentation, α-amylase inhibition capacity decreased from day 0 through day 3, consistent with changes in polysaccharide, triterpene, and flavonoid contents, while α-glucosidase inhibition exhibited no significant changes (Figure 11c,d). As fermentation progressed, the α-amylase and α-glucosidase inhibition capacities exhibited a trend of initially increasing and subsequently decreasing, peaking at 11.66 mmol Acarbose/100 g DW on day 13 and 9.59 mmol Acarbose/100 g DW on day 15, respectively. These findings suggested that fermentation enhances the hypoglycemic potential of OPP through increased inhibition of starch hydrolase.

3.4.3. IDF Adsorption Capacity Analysis

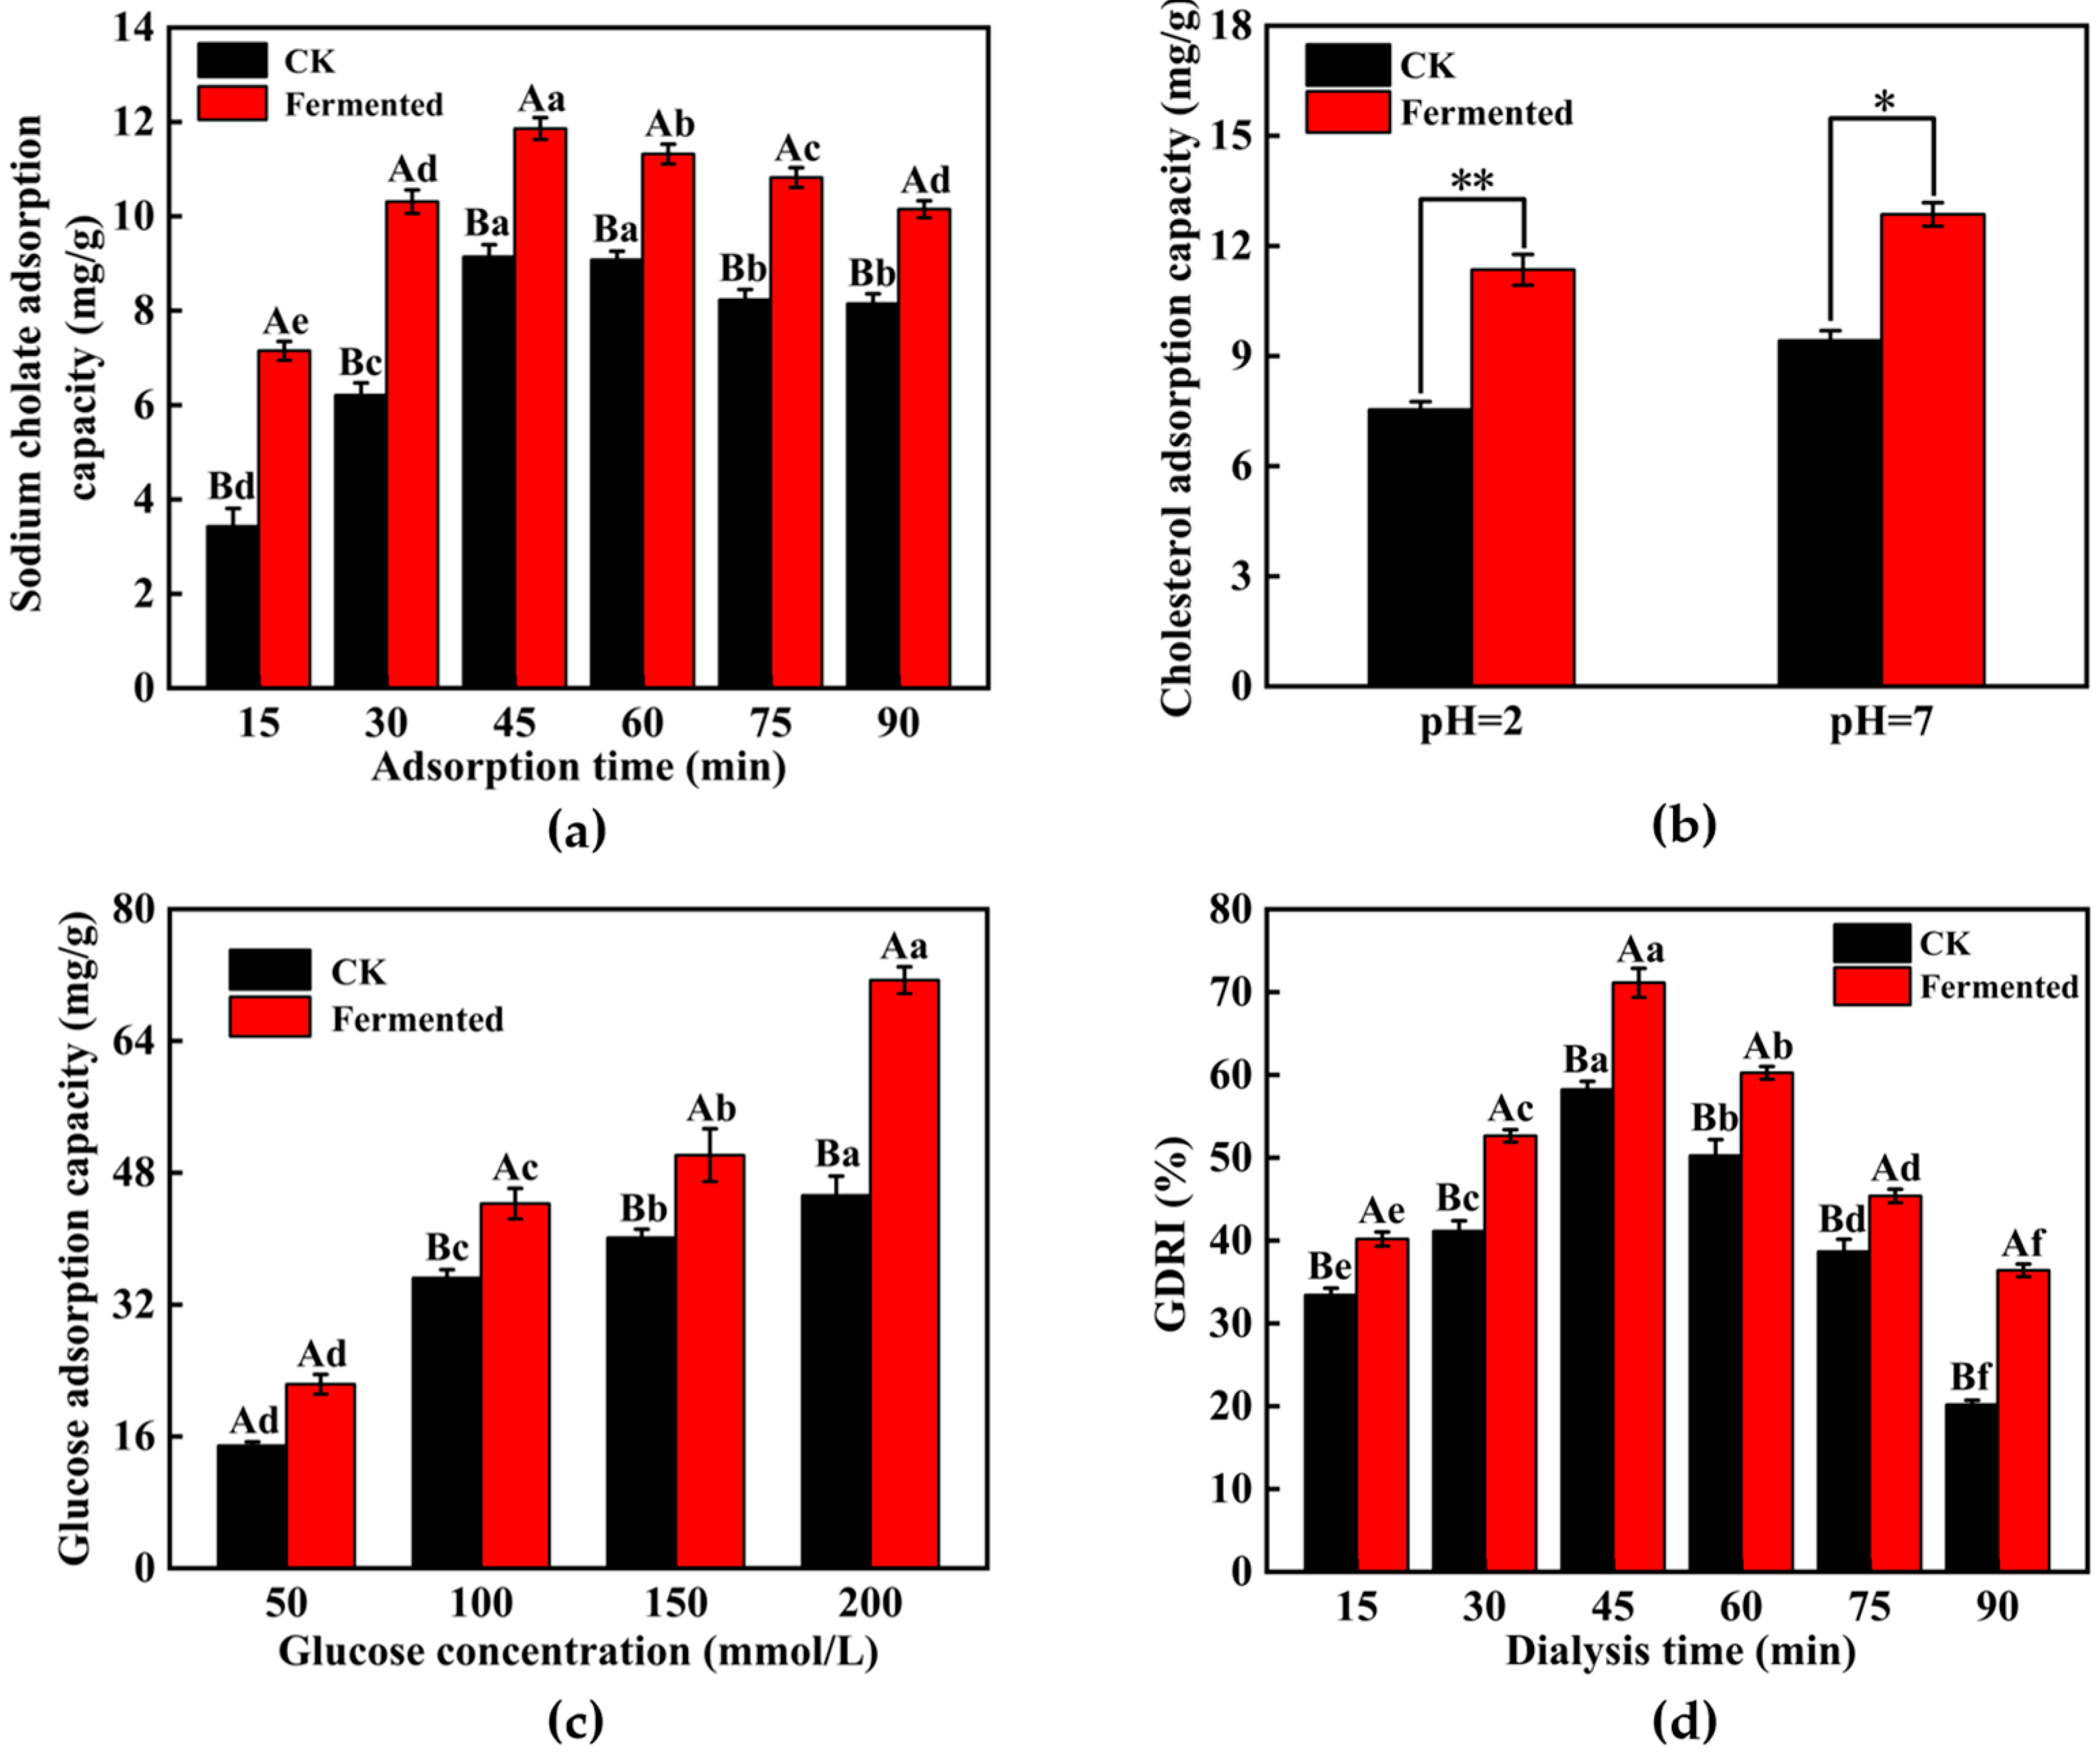
Figure 12a illustrates the temporal variation in the adsorption capacity of IDF from the product for sodium cholate. Specifically, FOPPF-IDF exhibited an initial increase followed by a subsequent decrease in adsorption capacity with prolonged adsorption time, peaking at 11.86 mg/g at 45 min. Compared to OPPF-IDF, FOPPF-IDF exhibited significant improvements in adsorption capacity over varying durations, with an increase of 29.76% at the peak. This enhanced adsorption capacity is likely attributed to structural modifications within IDF, such as the formation of a porous honeycomb structure [49], augmenting its binding capabilities. Mycelium-secreted cellulase contributes to IDF degradation, facilitating structural alterations conducive to cholate molecule envelopment.
Fermentation also significantly improved the cholesterol adsorption capacity of IDF at both acidic (pH = 2) and neutral (pH = 7) conditions, with an improvement of 50.53% and 36.52%, respectively (Figure 12b). Notably, IDF exhibited greater adsorption capacity under neutral conditions, where pH-induced carboxyl group dissociation into anions facilitates cholesterol binding [50], indicative of the more favorable cholesterol adsorption of FOPPF-IDF in the intestinal environment.
Figure 12c demonstrates FOPPF-IDF’s superior glucose adsorption capacity, which increases significantly with rising glucose concentrations. Furthermore, FOPPF-IDF exhibited a significant increase in adsorption capacity of 50.34%, 25.60%, 24.98%, and 57.78% at different glucose concentrations (50–200 mmol/L) compared to OPPF-IDF, indicative of the more effective glucose adsorption of IDF after fermentation. This improvement in glucose adsorption can be attributed to reduced particle size, which exposes internal functional groups and increases the contact area with glucose [51]. Additionally, the glucose dialysis retardation index (GDRI) of FOPPF-IDF displayed a continuous increase up to 45 min, followed by a rapid decrease after reaching a peak of 71.12% (Figure 12d), indicative of the time limit of glucose adsorption and blocking efficacy due to water absorption saturation and reduced viscosity [40].

3.5. In Vivo Effect of F-OPPF on T2DM Rats

3.5.1. Effect of F-OPPF on Body Weight and Blood Glucose in T2DM Rats

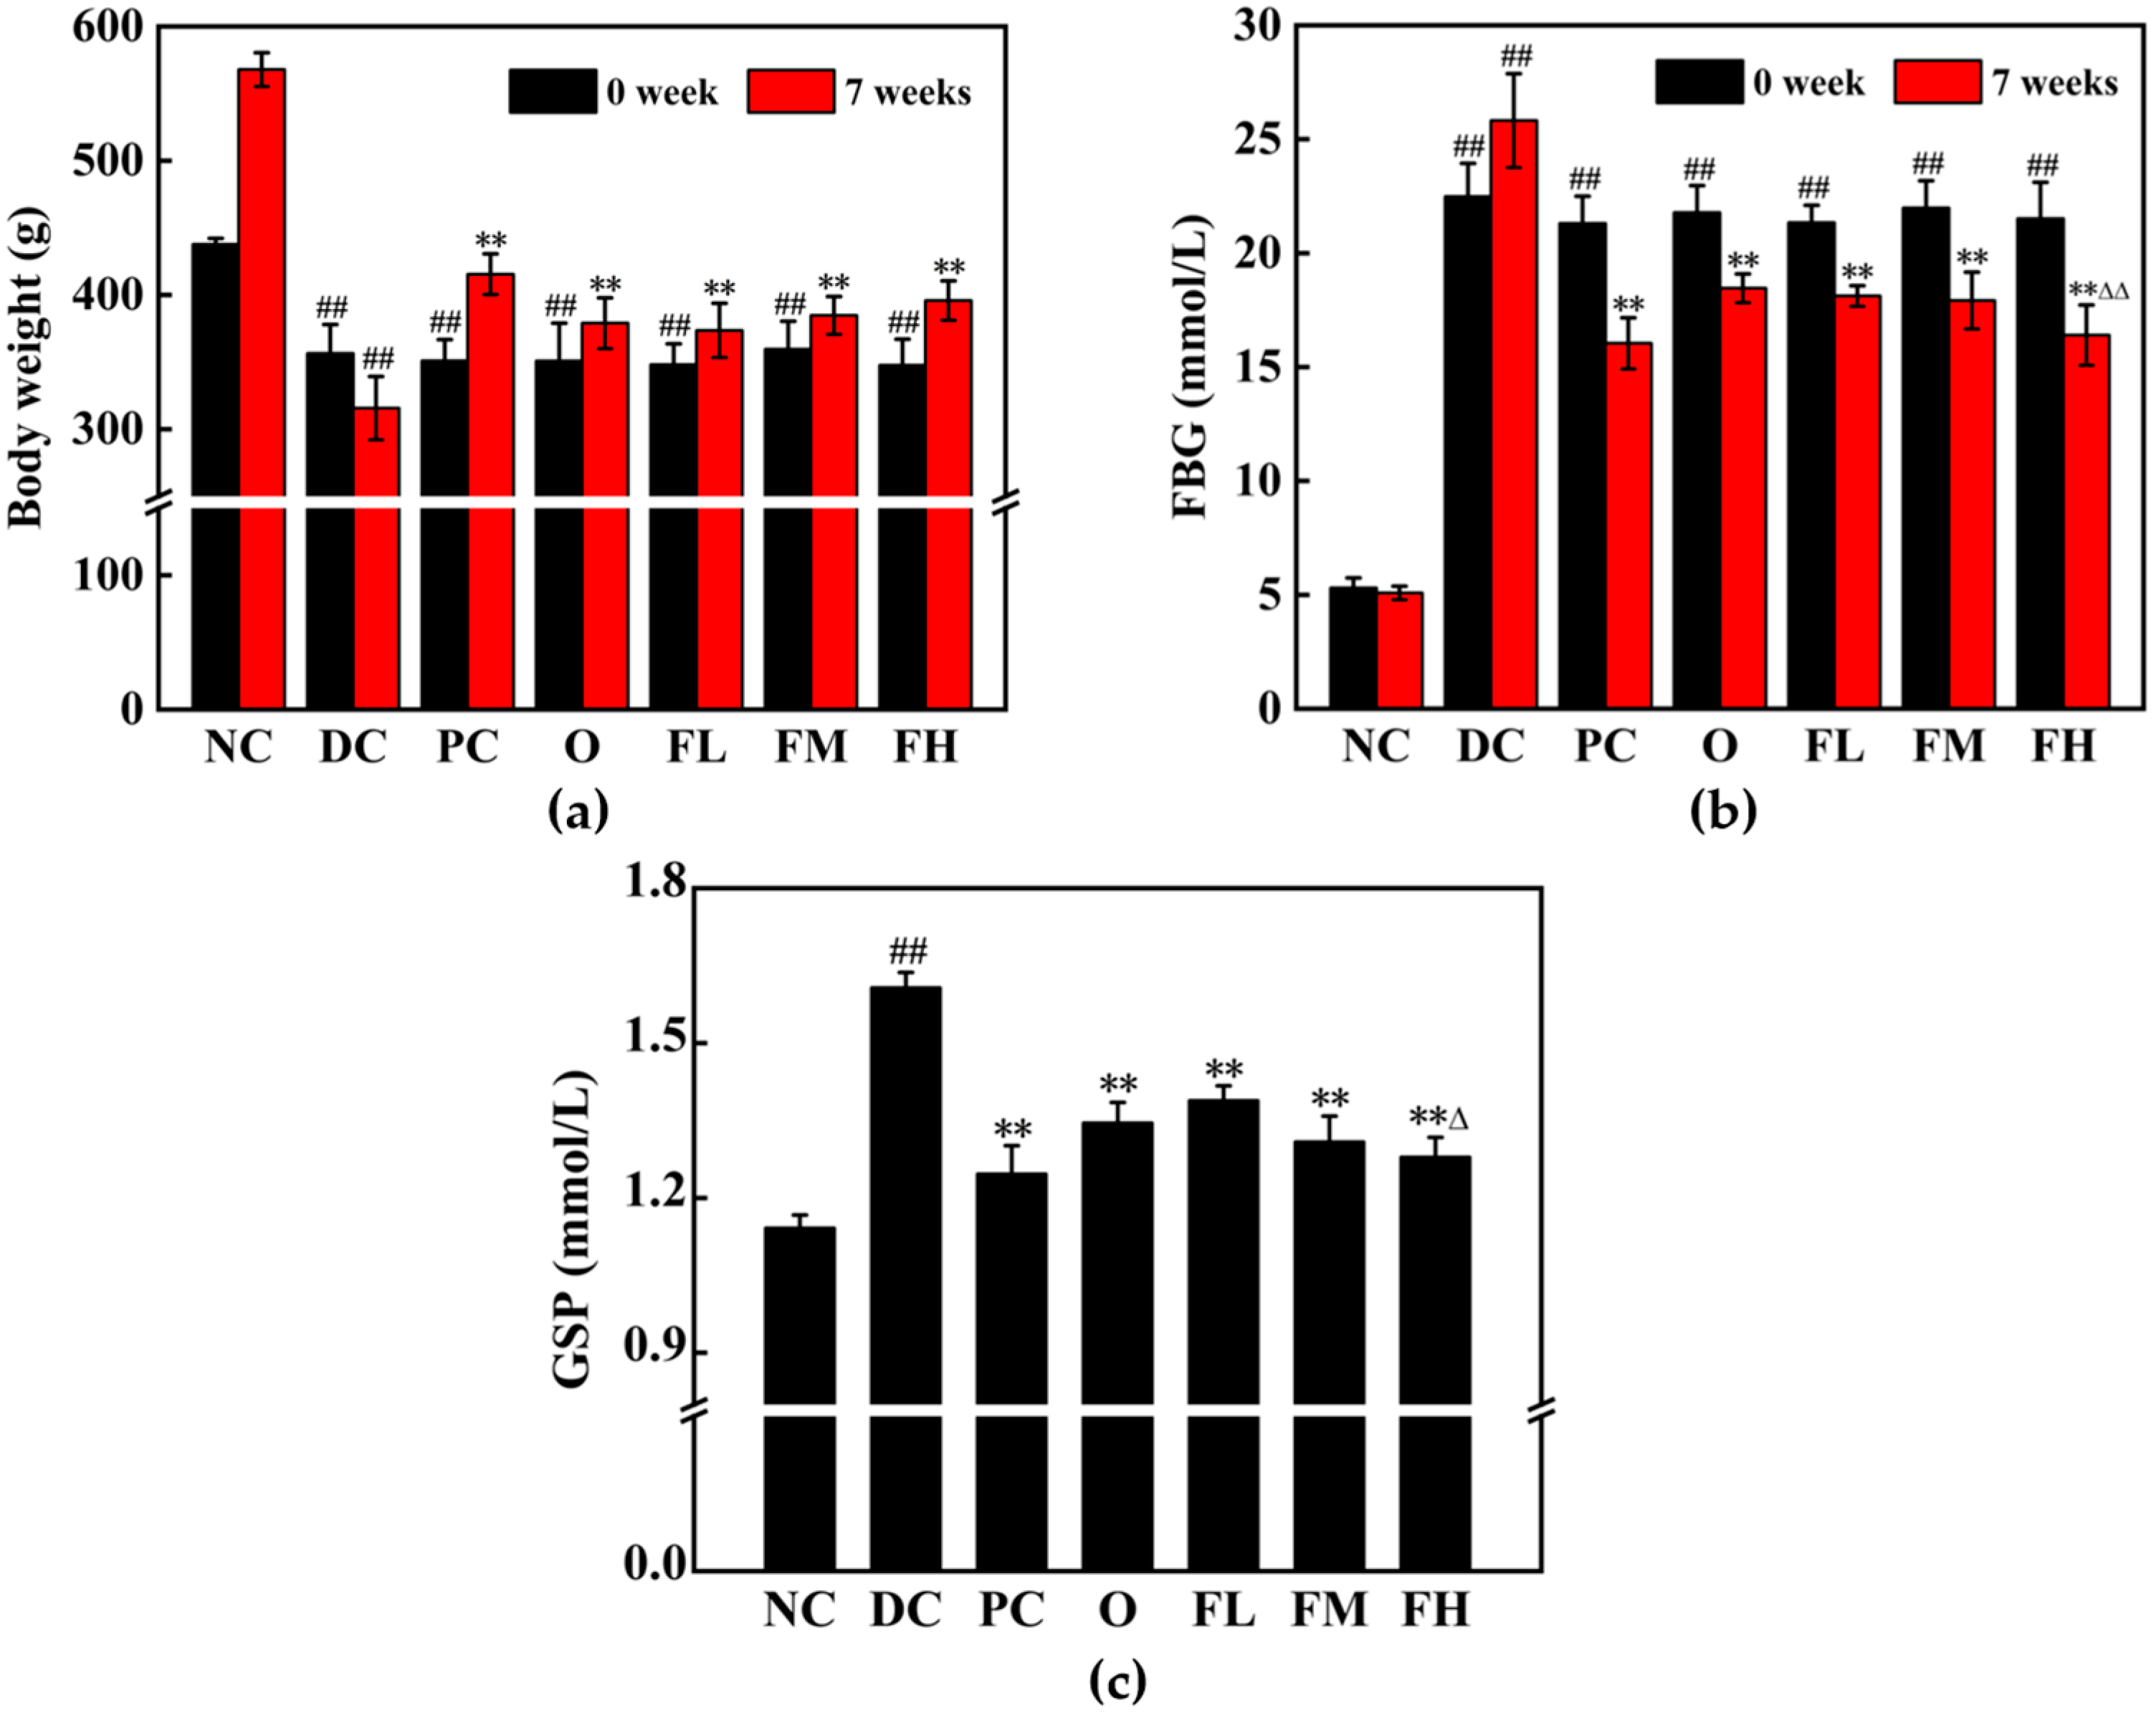
No anorexia was observed, indicating that food taste did not influence food intake by rats in this study. As shown in Figure 13a,b, the model group exhibited significant weight loss and elevated FBG levels compared to the normal group at week 0 (p < 0.01). After 7 weeks, the DC group’s body weight decreased by 11.40%, and FBG increased by 14.86% (p < 0.01), whereas the intervention groups (PC, O, FL, FM, and FH) showed significantly higher body weight and lower FBG than the DC group (p < 0.01). Improvement rates for body weight ranged from 18.33% to 31.60%, and FBG reduction rates ranged from 28.51% to 37.88%. Among them, high-dose F-OPPF intervention were similar to the positive control drug in terms of reducing blood glucose. Moreover, Significant differences were noted between the FH and O groups (p < 0.01).
Glycosylated serum protein (GSP) levels were measured to further assess blood glucose regulation. As shown in Figure 13c, the DC group showed a significant increase in GSP level (NC: 1.14 mmol/L; DC: 1.61 mmol/L, p < 0.01). Intervention groups had significantly lower GSP levels (1.25–1.39 mmol/L, p < 0.01) compared to the DC group, with reduction rates of 13.66% to 22.36%. Furthermore, significant differences were noticed between the FH and O groups (p < 0.05). The results indicated that F-OPPF can regulate blood glucose in T2DM rats in the long term, reducing the production of glucosamine.

3.5.2. Effect of F-OPPF on OGTT and ITT in T2DM Rats

During the oral glucose tolerance test, blood glucose levels in the NC group peaked at 30 min post-administration and then decreased, while the DC group maintained high glucose levels for over 60 min (Figure 14a). The delay in the peak of blood glucose level indicated an imbalance in blood glucose regulation of the DC group. The fermented groups exhibited significant hypoglycemic effects after 30 min, with AUC reductions of 23.62% to 32.75% compared to the DC group (p < 0.01) (Figure 14b). Significant differences in AUC were observed between the O group and FM/FH groups (p < 0.01).
In the insulin tolerance test, the NC group’s blood glucose dropped to its lowest at 30 min post-insulin injection, while the DC group reached its lowest at 60 min, indicating insulin resistance (Figure 14c). After 7 weeks of intervention, the fermented groups’ blood glucose levels decreased significantly within 30 min, with reduction rates of 13.06% to 20.60%, and began to recover after 30 min. The AUC for fermented groups decreased by 31.27% to 39.10% compared to the DC group (p < 0.01) (Figure 14d), with significant differences between the O group and FM/FH groups (p < 0.01). These findings indicated that F-OPPF enhanced glucose tolerance and insulin sensitivity in T2DM rats.

3.5.3. Effect of F-OPPF on Lipid Metabolism in T2DM Rats

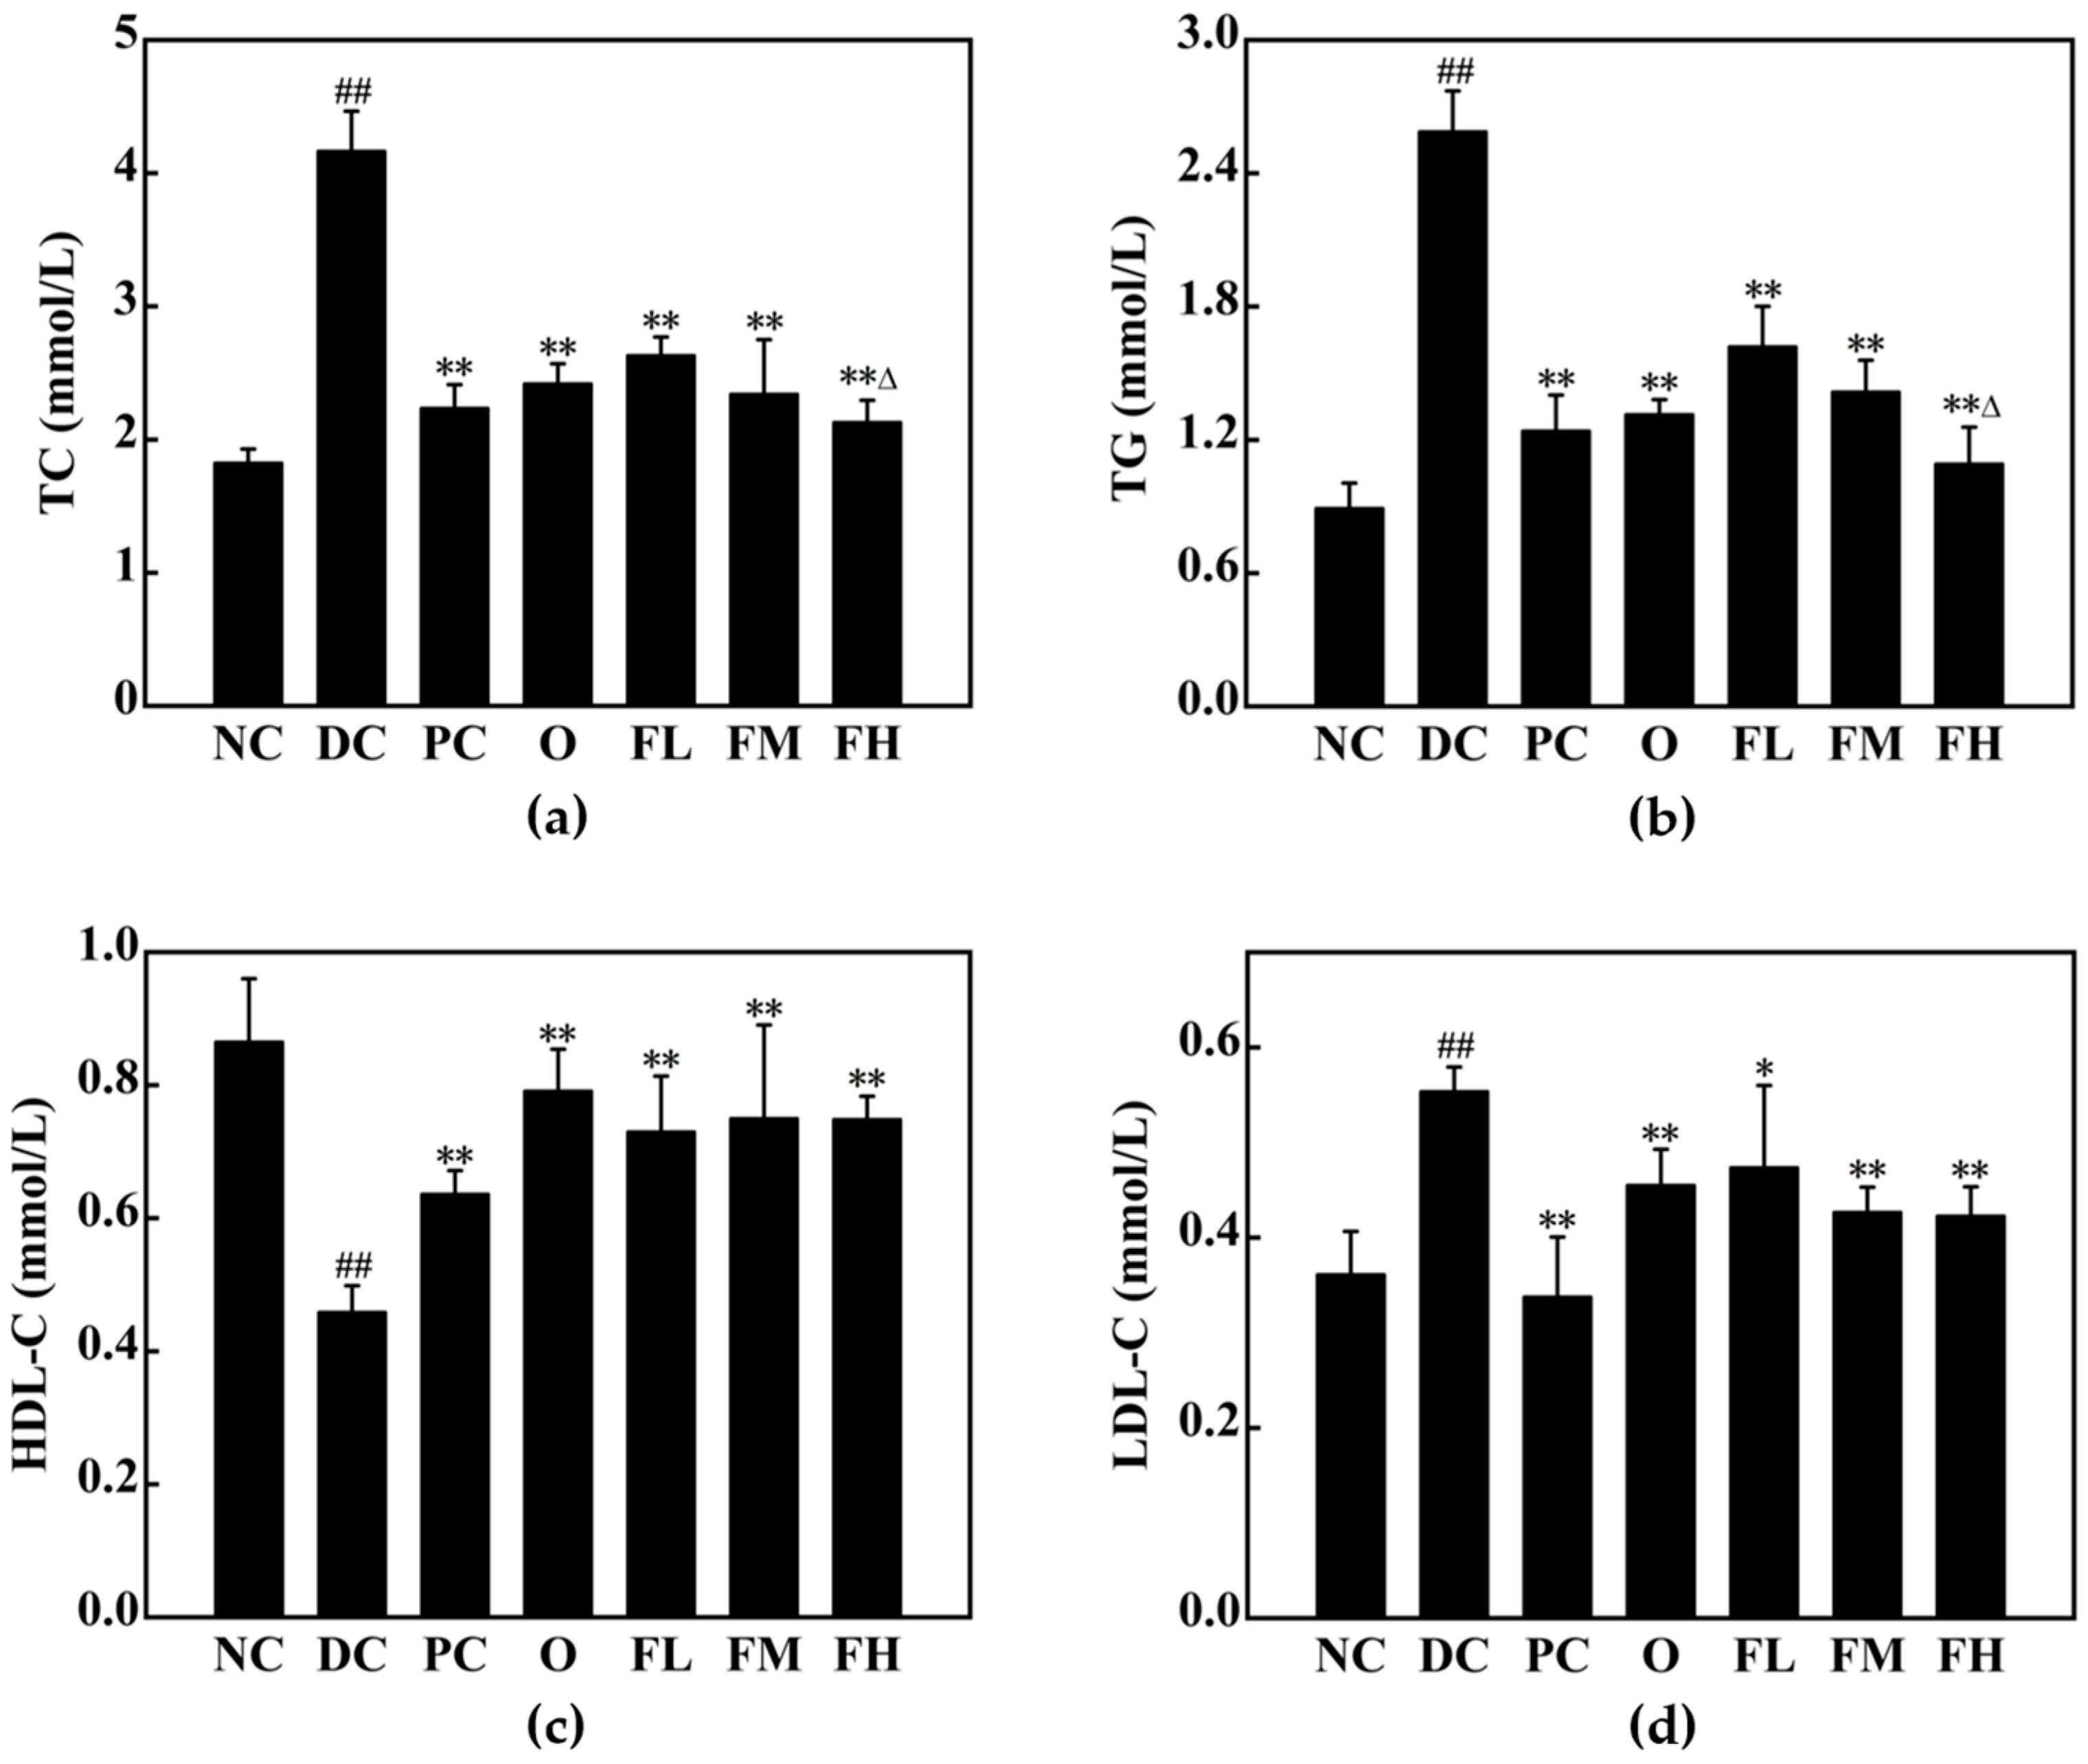
As shown in Figure 15, the DC group exhibited significantly elevated total cholesterol (TC: NC: 1.82 mmol/L; DC: 4.17 mmol/L) and triglycerides (TG: NC: 0.89 mmol/L; DC: 2.59 mmol/L) levels and decreased HDL-C levels (NC: 0.87 mmol/L; DC: 0.46 mmol/L) compared to the NC group (p < 0.01), indicating that the high-density lipoprotein in rats was reduced due to T2DM, and cholesterol in extrahepatic tissues could not be transported to the liver for decomposition, resulting in serious disorder of lipid metabolism. LDL-C levels also increased significantly (NC: 0.36 mmol/L; DC: 0.55 mmol/L). The increase in low-density lipoprotein was prone to glycosylate with glucose, and its glycosylation products were prone to react with oxygen free radicals, leading to the formation of atherosclerosis [52].
After 7 weeks of intervention, intervention groups showed significantly lower TC (2.13–2.63 mmol/L) and TG (1.09–1.62 mmol/L) levels compared to the DC group, with TC reduction rates of 36.93% to 48.92% and TG reduction rates of 37.45% to 57.92%. Furthermore, the FH group exhibited significant reductions compared to the O group (11.98% TC, 16.79% TG, p < 0.05). LDL-C levels decreased (0.34–0.47 mmol/L) and HDL-C levels increased (0.64–0.79 mmol/L) in intervention groups compared to the DC group (p < 0.01), with LDL-C reduction rates of 14.55% to 38.18% and HDL-C improvement rates of 39.13% to 71.74%. However, differences between the O group and fermented groups were not significant (p > 0.05).

3.5.4. Effect of F-OPPF on Oxidative Stress in T2DM Rats

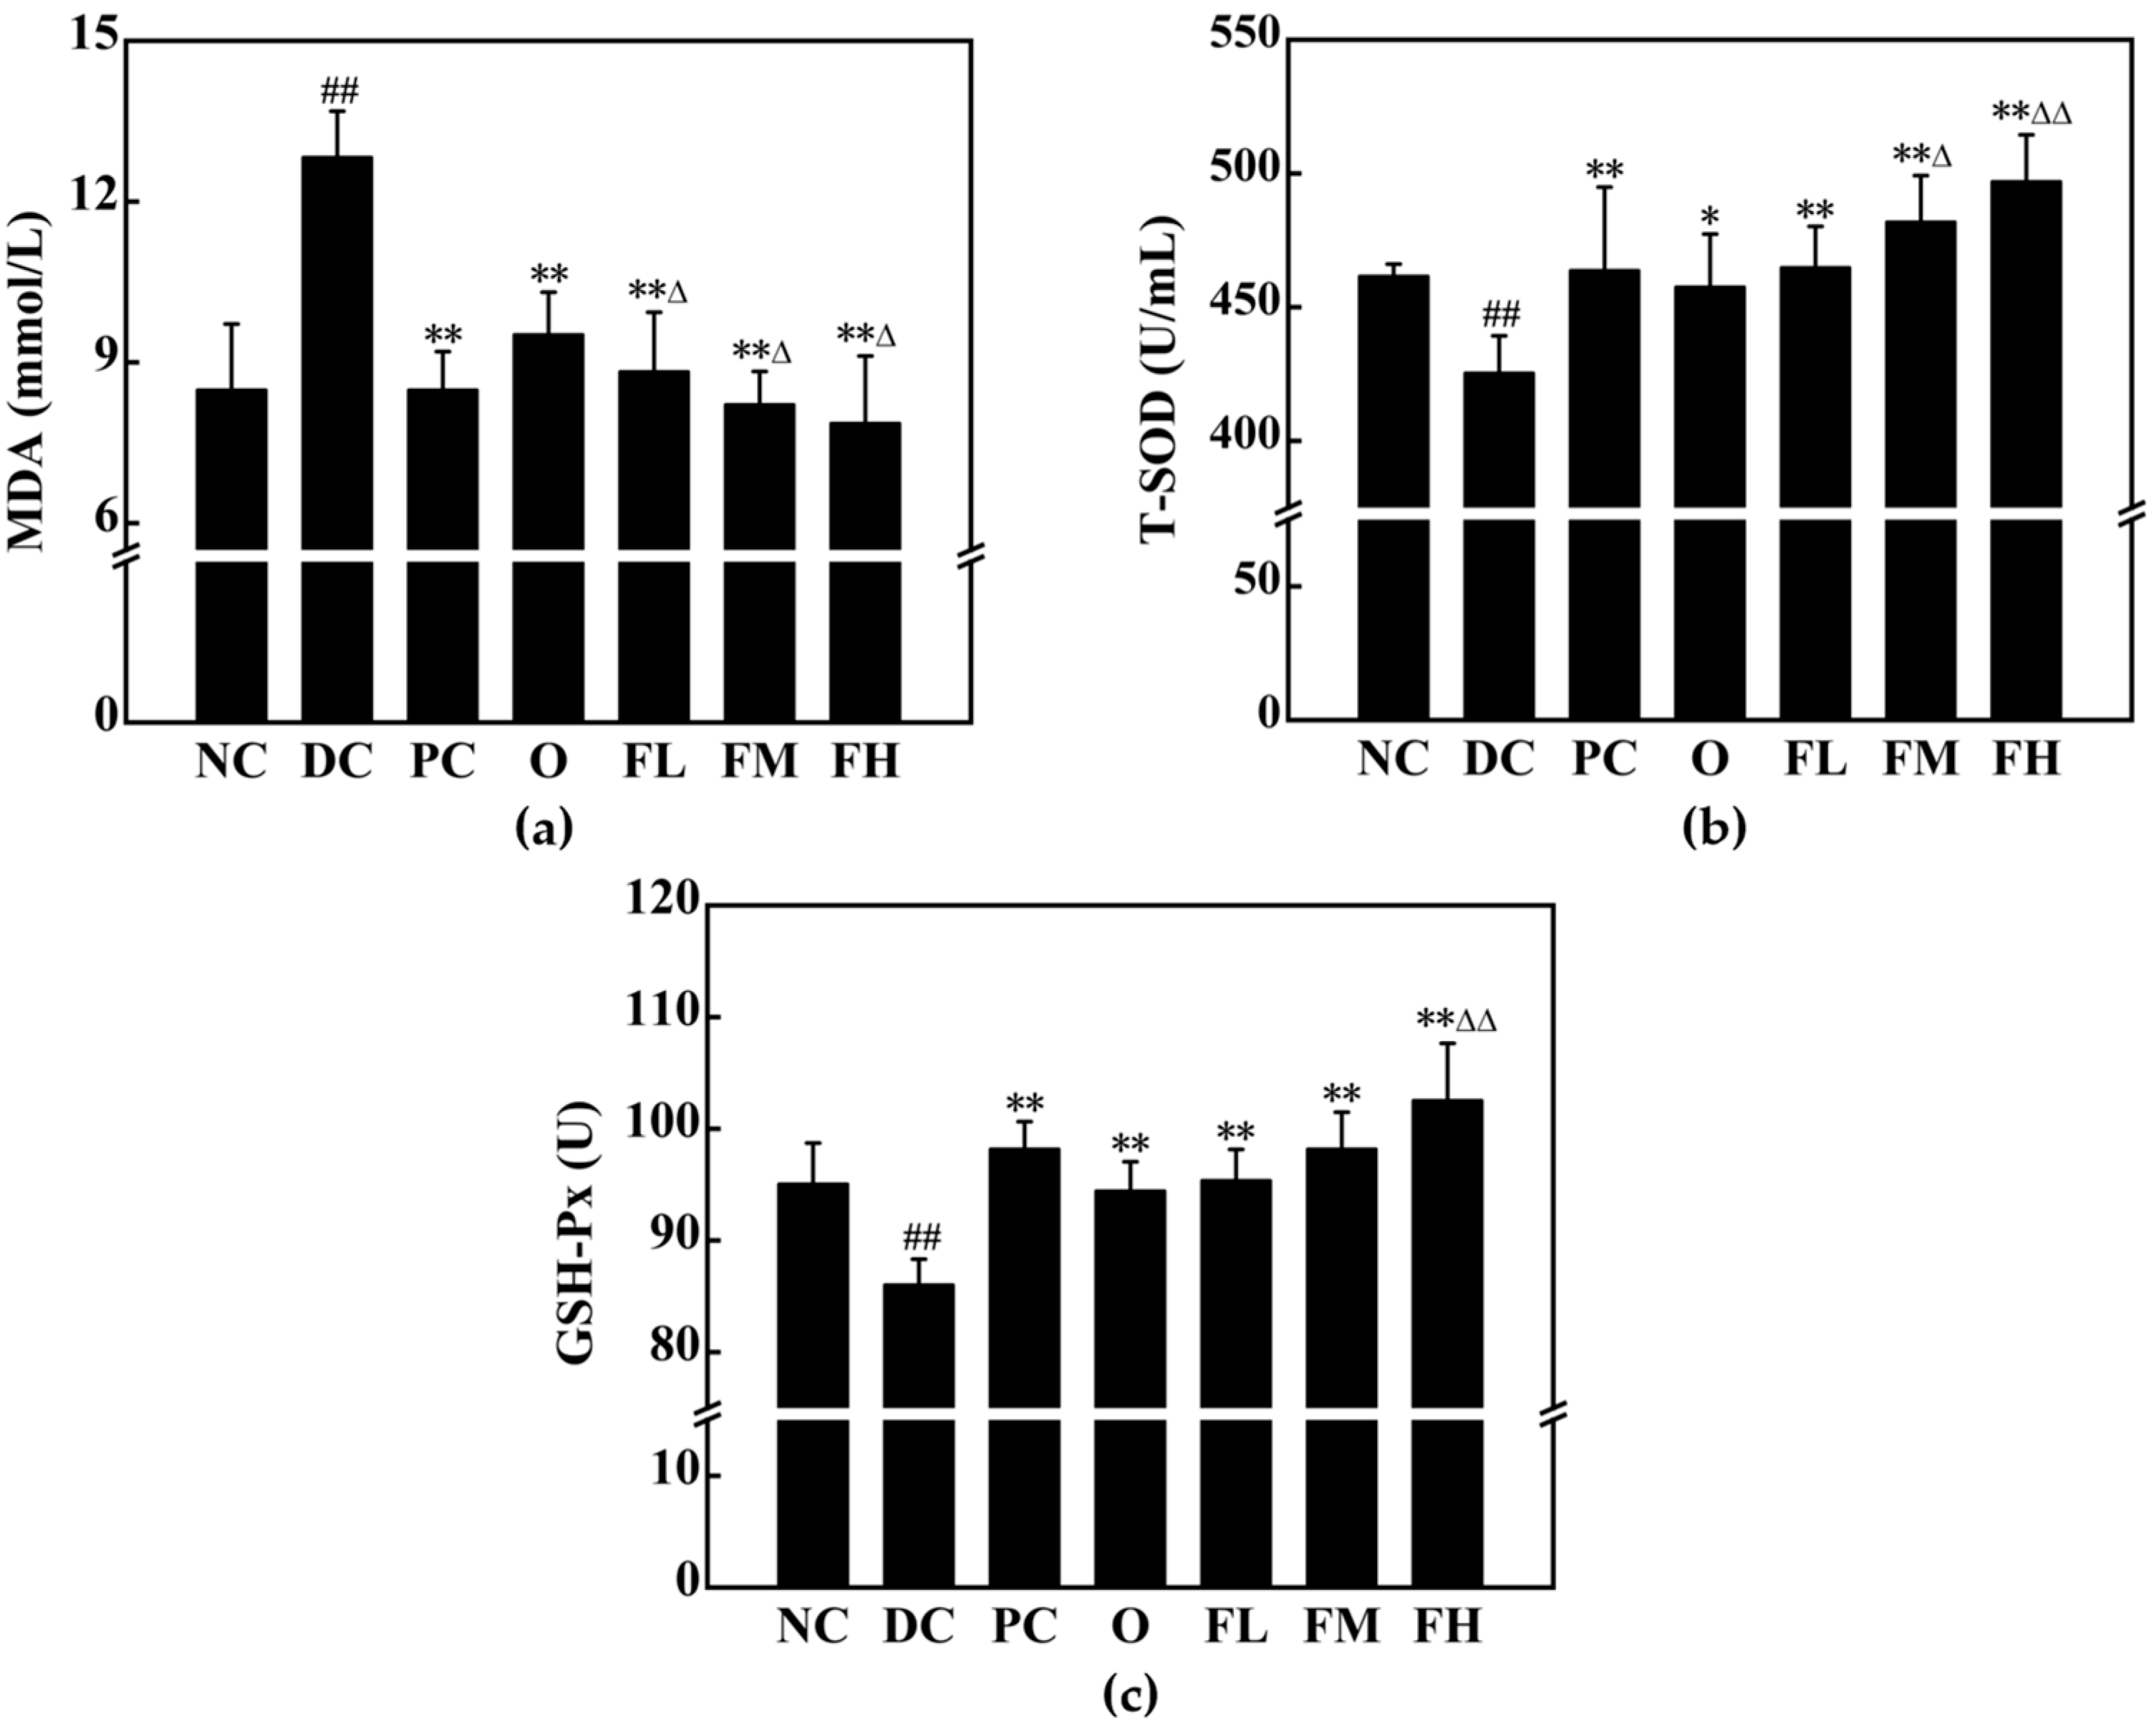
Diabetes exacerbates metabolic disorders through glucose auto-oxidation, polyol pathway activation, and protein glycosylation. Figure 16 shows significant increases in MDA levels (NC: 8.48 mmol/L; DC: 12.83 mmol/L) and decreases in T-SOD (NC: 461.58 U/mL; DC: 425.34 U/mL) and GSH-Px (NC: 95.07 U; DC: 86.02 U) activities in the DC group compared to the NC group (p < 0.01). The glycosylation of antioxidant enzymes induced by T2DM increases the content of reactive oxygen species (ROS) [53], leading to membrane lipid peroxidation and excessive production of malondialdehyde.
Compared to the DC group, intervention groups exhibited significant decreases in MDA levels (7.86–9.52 mmol/L, p < 0.05), with reduction rates of 25.80% to 38.74%. T-SOD (457.52–497.00 U/mL) and GSH-Px (94.44–102.55 U) activities significantly increased (p < 0.01), with improvement rates of 7.57% to 16.85% for T-SOD and 9.79% to 19.22% for GSH-Px. Notably, T-SOD and GSH-Px activities in the FH group exceeded NC group levels (p < 0.01). Compared to the O group, the FH group exhibited a significant reduction in MDA and a significant increase in T-SOD and GSH-Px (p < 0.05). The results revealed that F-OPPF effectively alleviated oxidative stress in T2DM rats, enhancing the antioxidant capacity of OPP through GL mycelium fermentation.

3.5.5. Effect of F-OPPF on Pancreatic Health in T2DM Rats

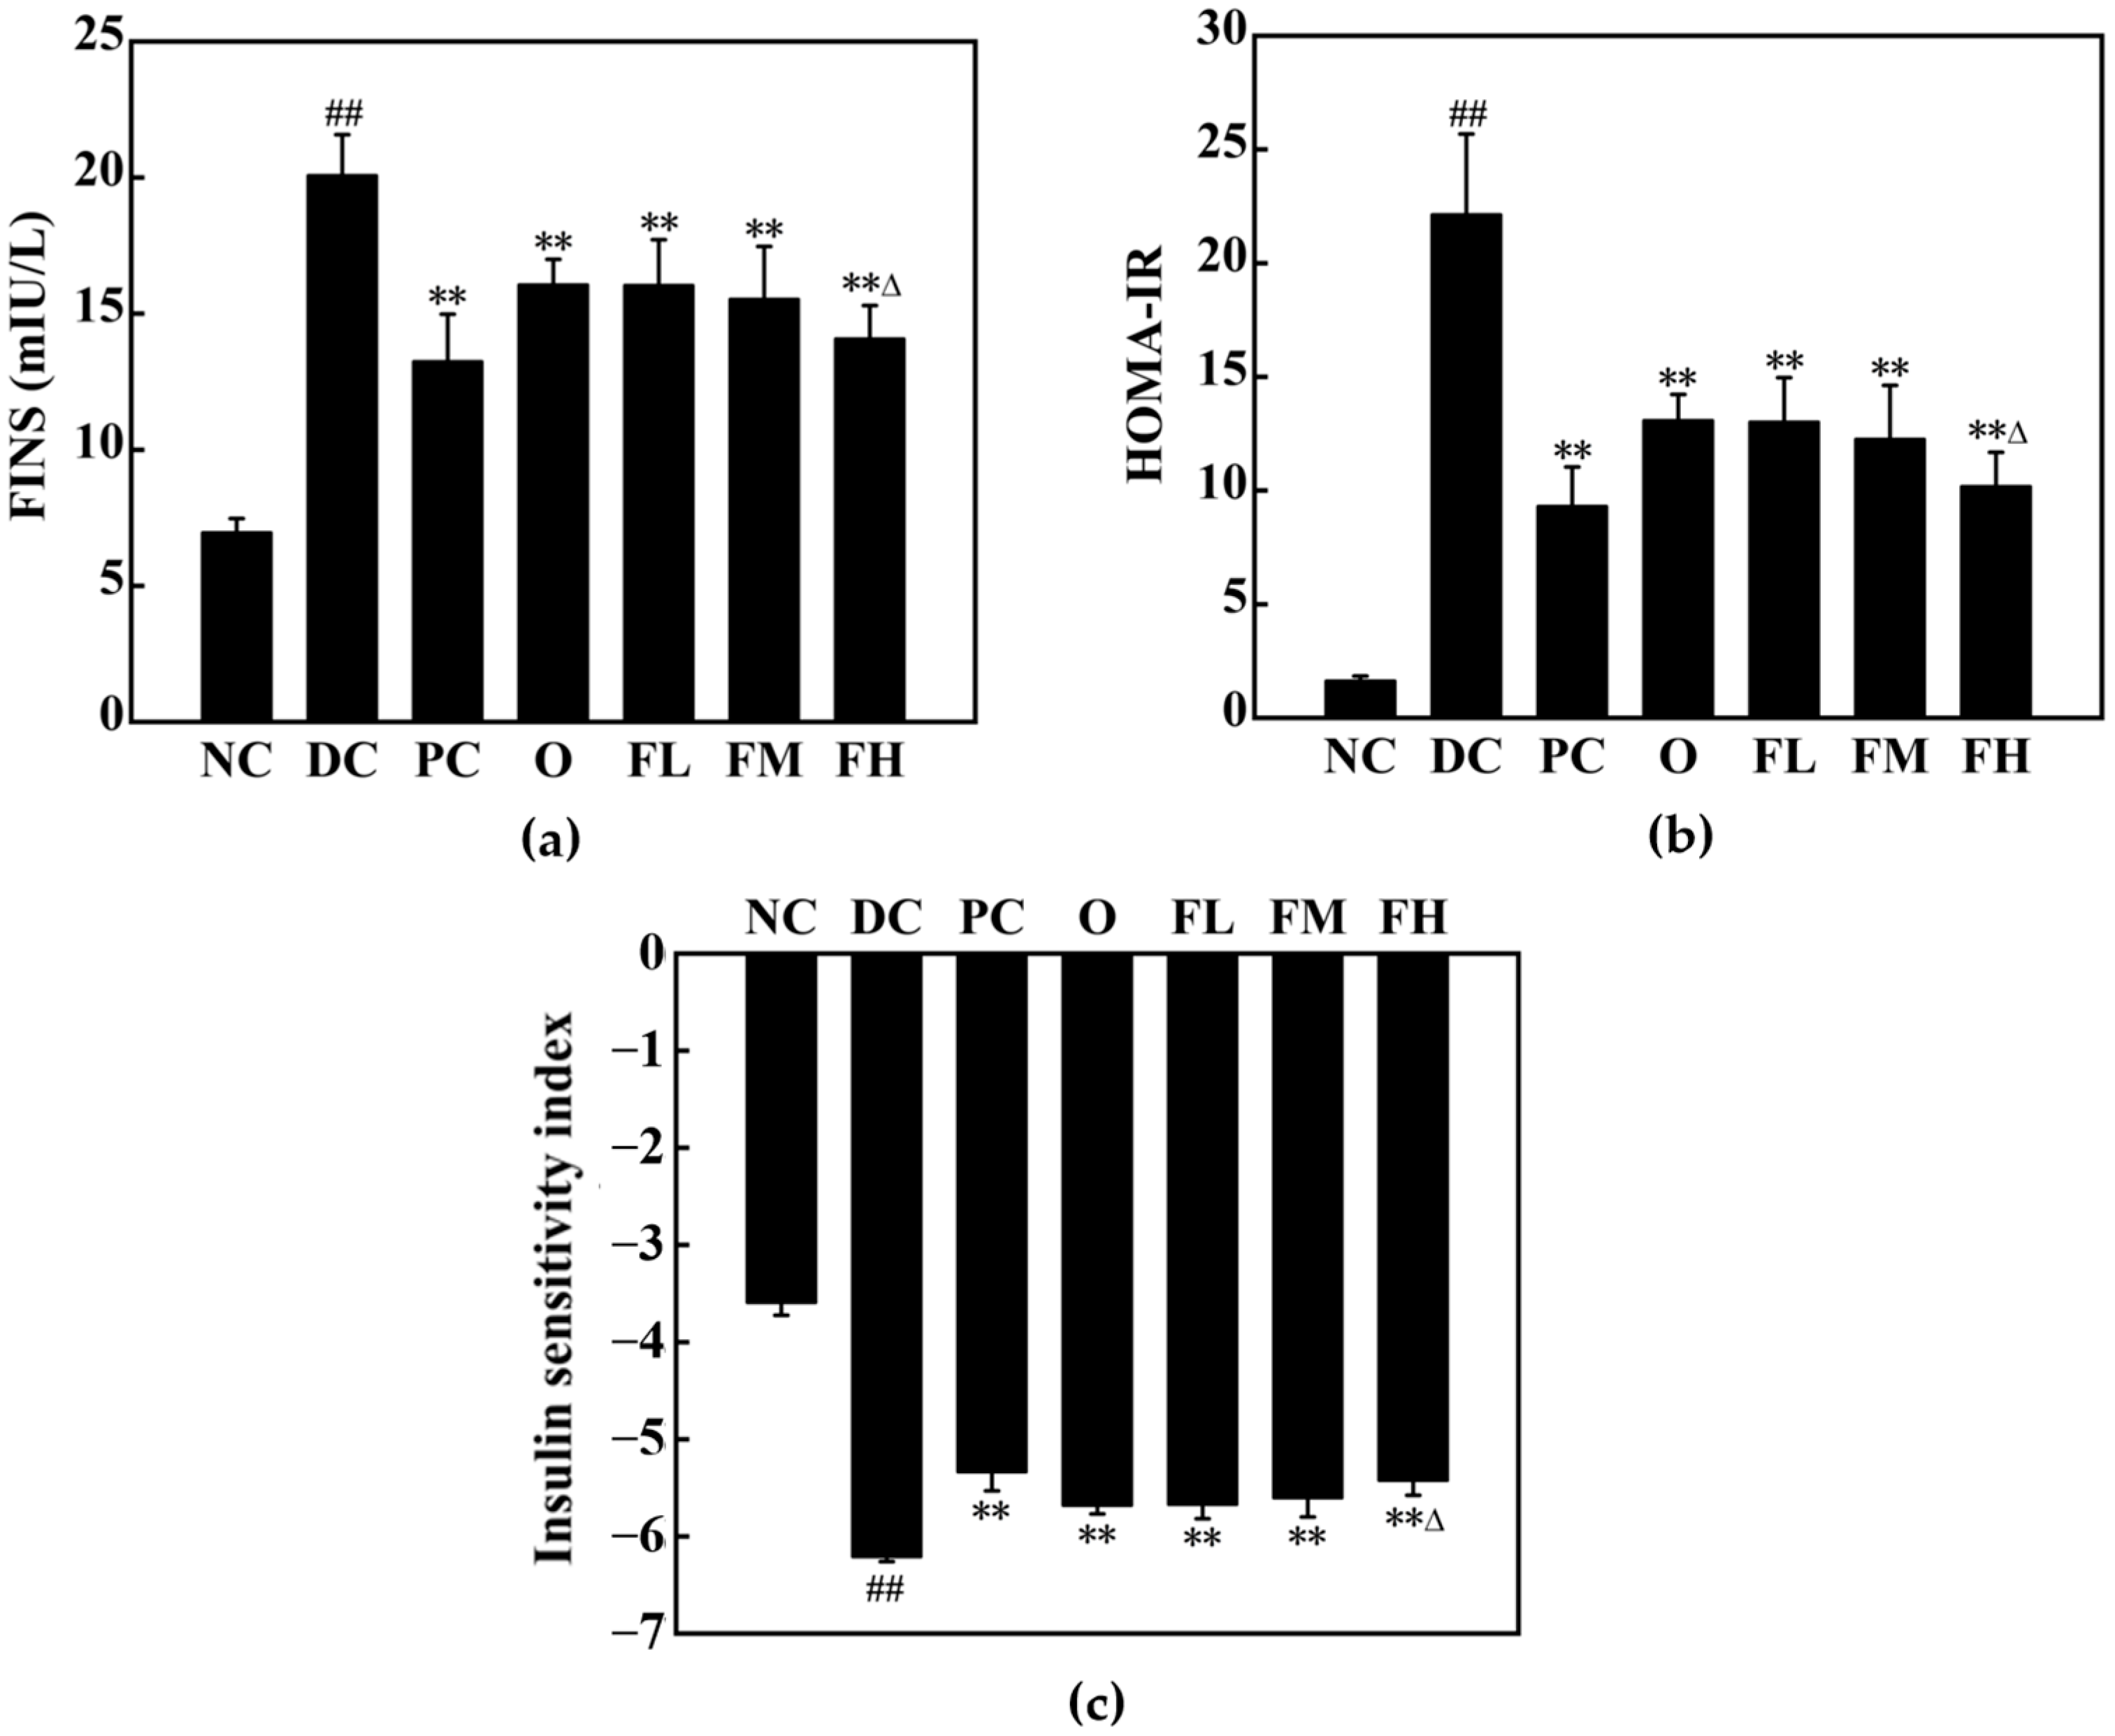
Figure 17 illustrates significant increases in fasting insulin (FINS) levels (NC: 6.96 mIU/L; DC: 20.09 mIU/L) and homeostasis model assessment of insulin resistance (HOMA-IR) values (NC: 1.63; DC: 22.14) and decreases in the insulin sensitivity index (ISI: NC: −3.59; DC: −6.21) in the DC group compared to the NC group (p < 0.01), indicating that more insulin secretion led to insulin accumulation due to insulin resistance and reduced insulin sensitivity in T2DM rats. After 7 weeks, the intervention groups showed significantly decreased FINS levels (13.24–16.06 mIU/L) and HOMA-IR values (9.38–13.09) and increased ISI values (−5.68–−5.34) (p < 0.01). FINS levels in fermentation groups decreased by 20.16% to 29.92% compared to the DC group (p < 0.01). Significant differences in FINS, ISI, and HOMA-IR were observed between the O and FH groups (p < 0.05). Histological analysis revealed that the NC group exhibited clear and tightly arranged pancreatic structure and circular or elliptical pancreatic islet cells with regular shapes and clear contours (Figure 18). However, the pancreatic islet cells of the DC group were scattered and deformed, with unclear contours and some swelling. Intervention ameliorated pancreatic pathology, with clearer cell boundaries, regular distribution, and intact cells in fermented groups.

3.5.6. Effect of F-OPPF on Liver Health in T2DM Rats

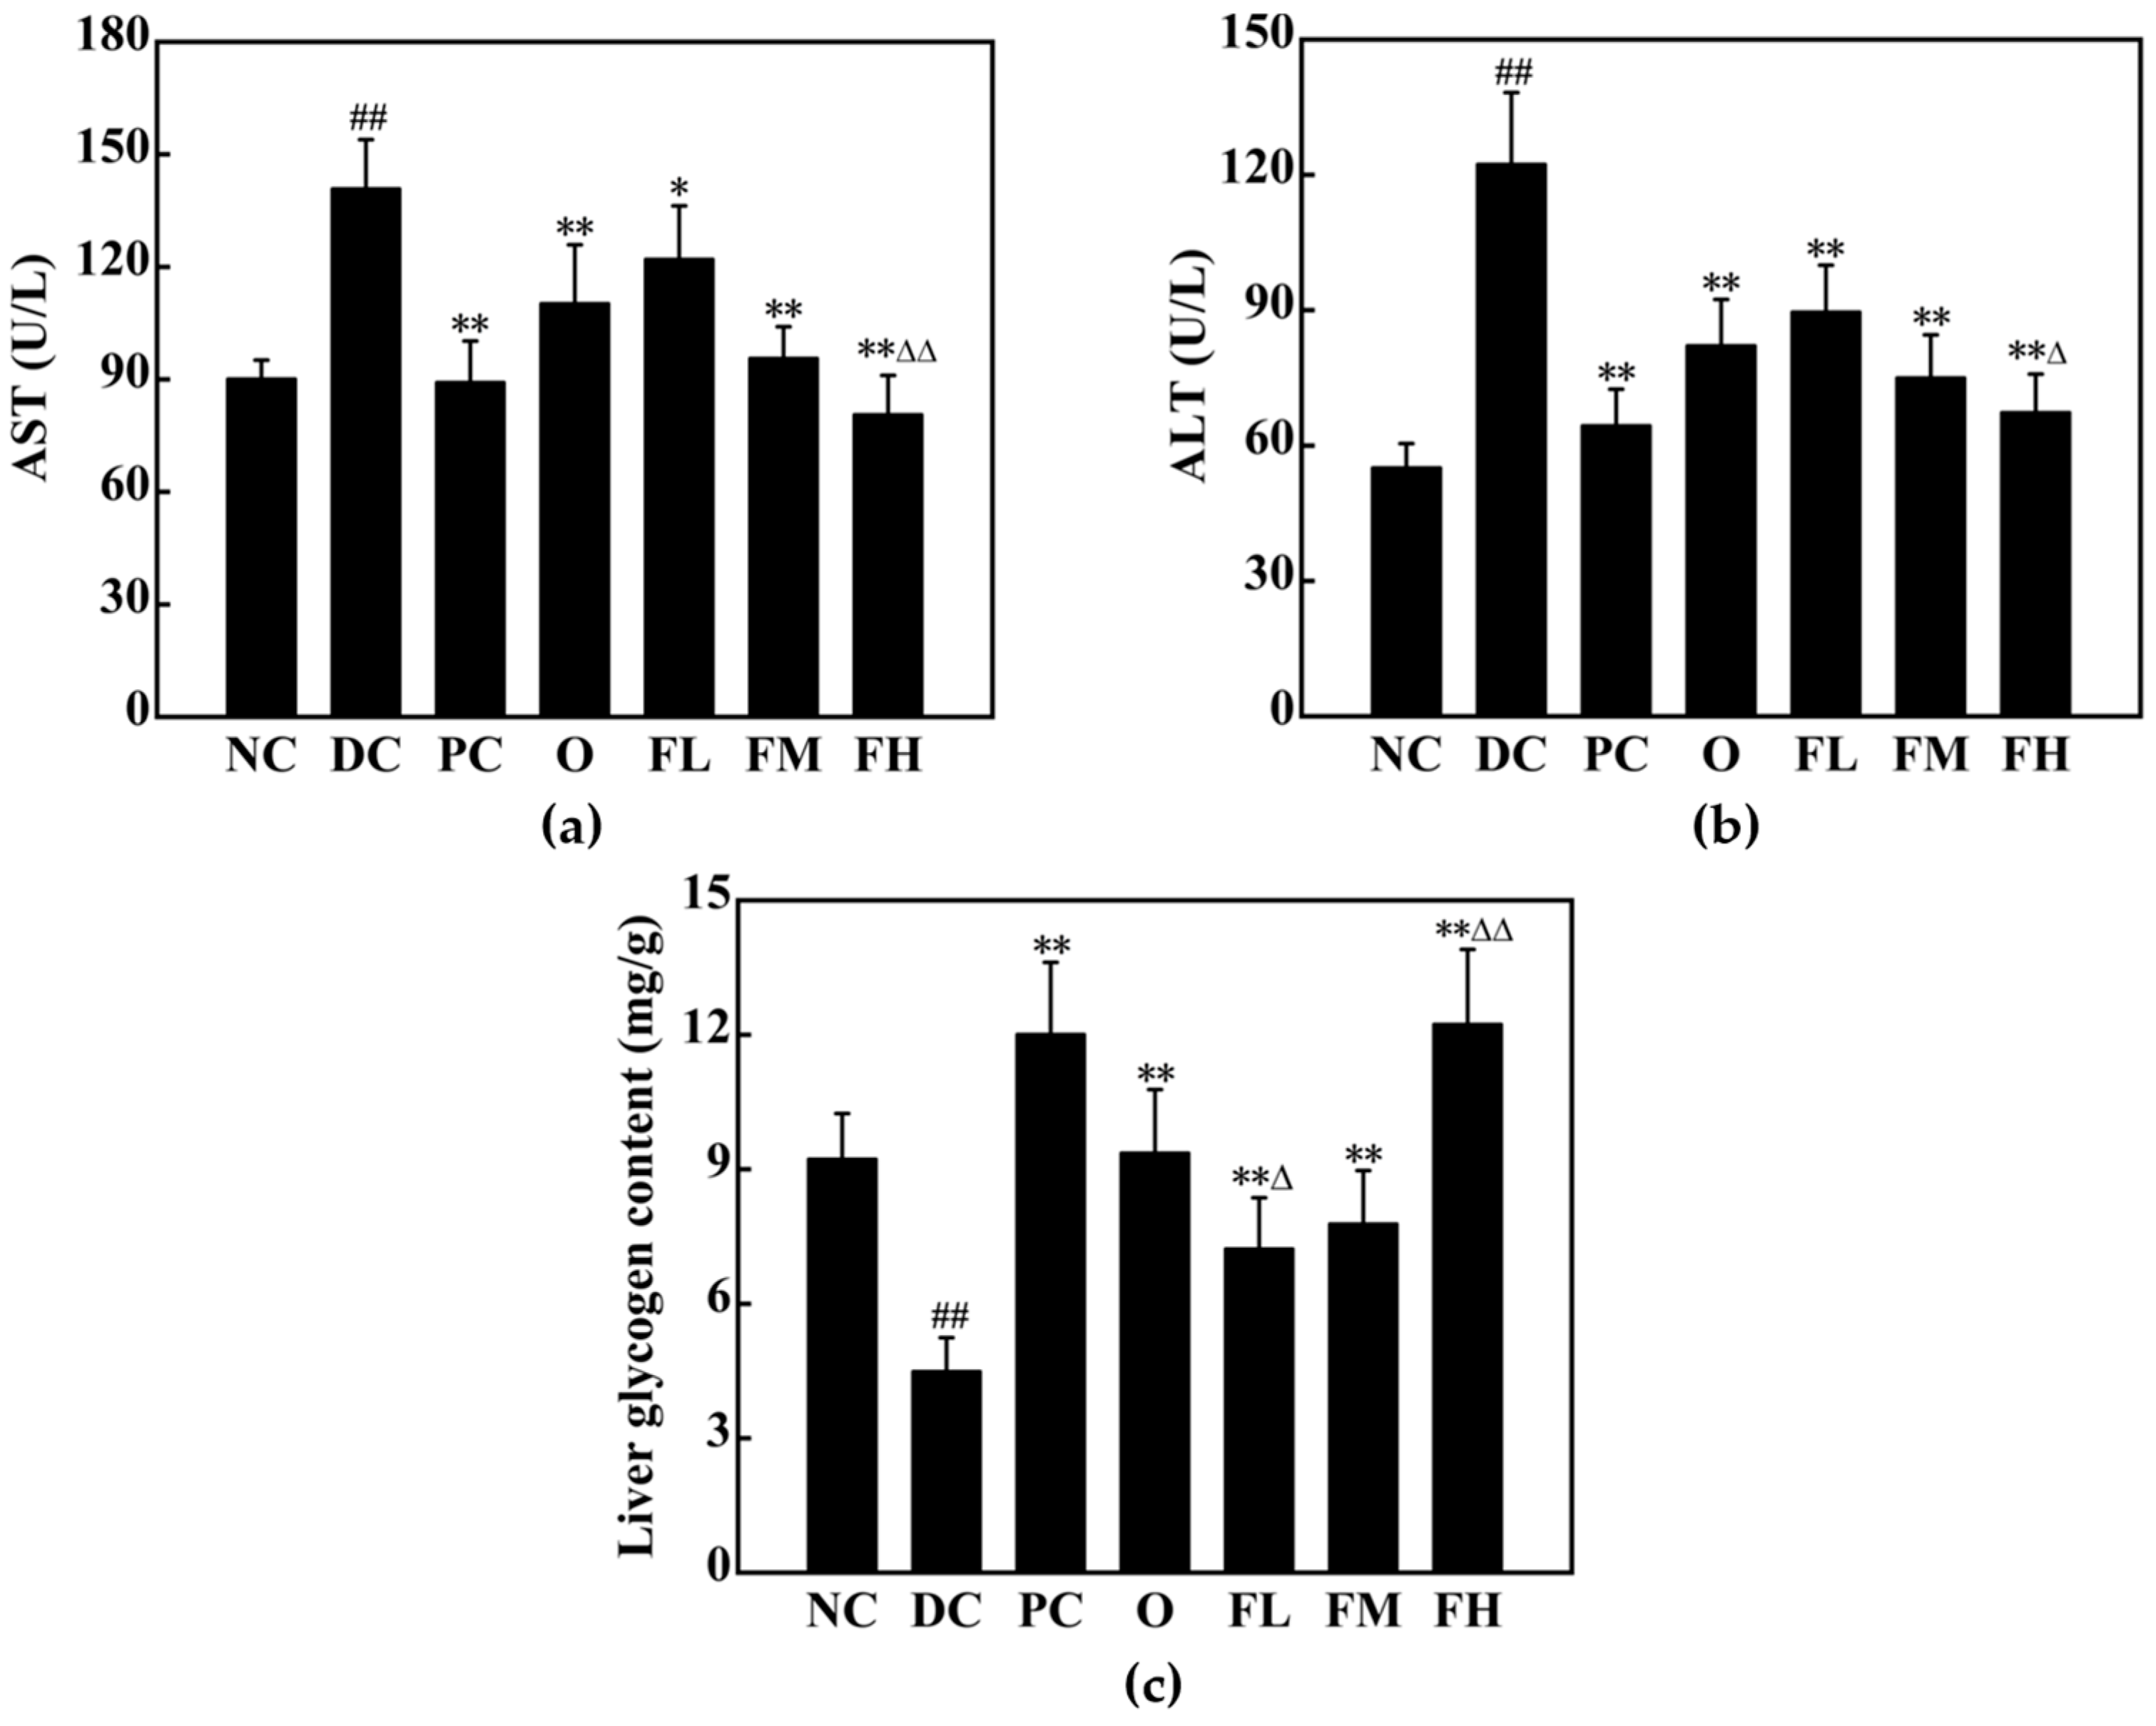
Figure 19a,b show significant increases in AST (NC: 90.15 U/L; DC: 140.87 U/L) and ALT (NC: 55.06 U/L; DC: 122.40 U/L) activities in the DC group compared to the NC group (p < 0.01), indicating liver damage in T2DM rats. Intervention groups showed significant decreases in AST (80.63–122.08 U/L) and ALT (64.45–89.63 U/L) activities compared to the NC group (p < 0.01), with reduction rates of 13.34% to 42.76% for AST and 26.77% to 44.97% for ALT in the fermented groups, indicating that F-OPPF effectively alleviated the liver function injury in T2DM rats.
Liver glycogen content was lower in the DC group compared to the NC group (Figure 19c). Intervention groups showed significant increases in liver glycogen content (7.23–12.24 mg/g, p < 0.01), with FH group levels 2.73 times higher than the DC group. The glycogen content was higher in the O group compared to the FL/FM groups but lower than that in the FH group. Significant differences were observed between the O and FM/FH groups (p < 0.05). The results revealed that F-OPPF improved the liver glucose metabolism ability of T2DM rats, promoting the synthesis of liver glycogen.
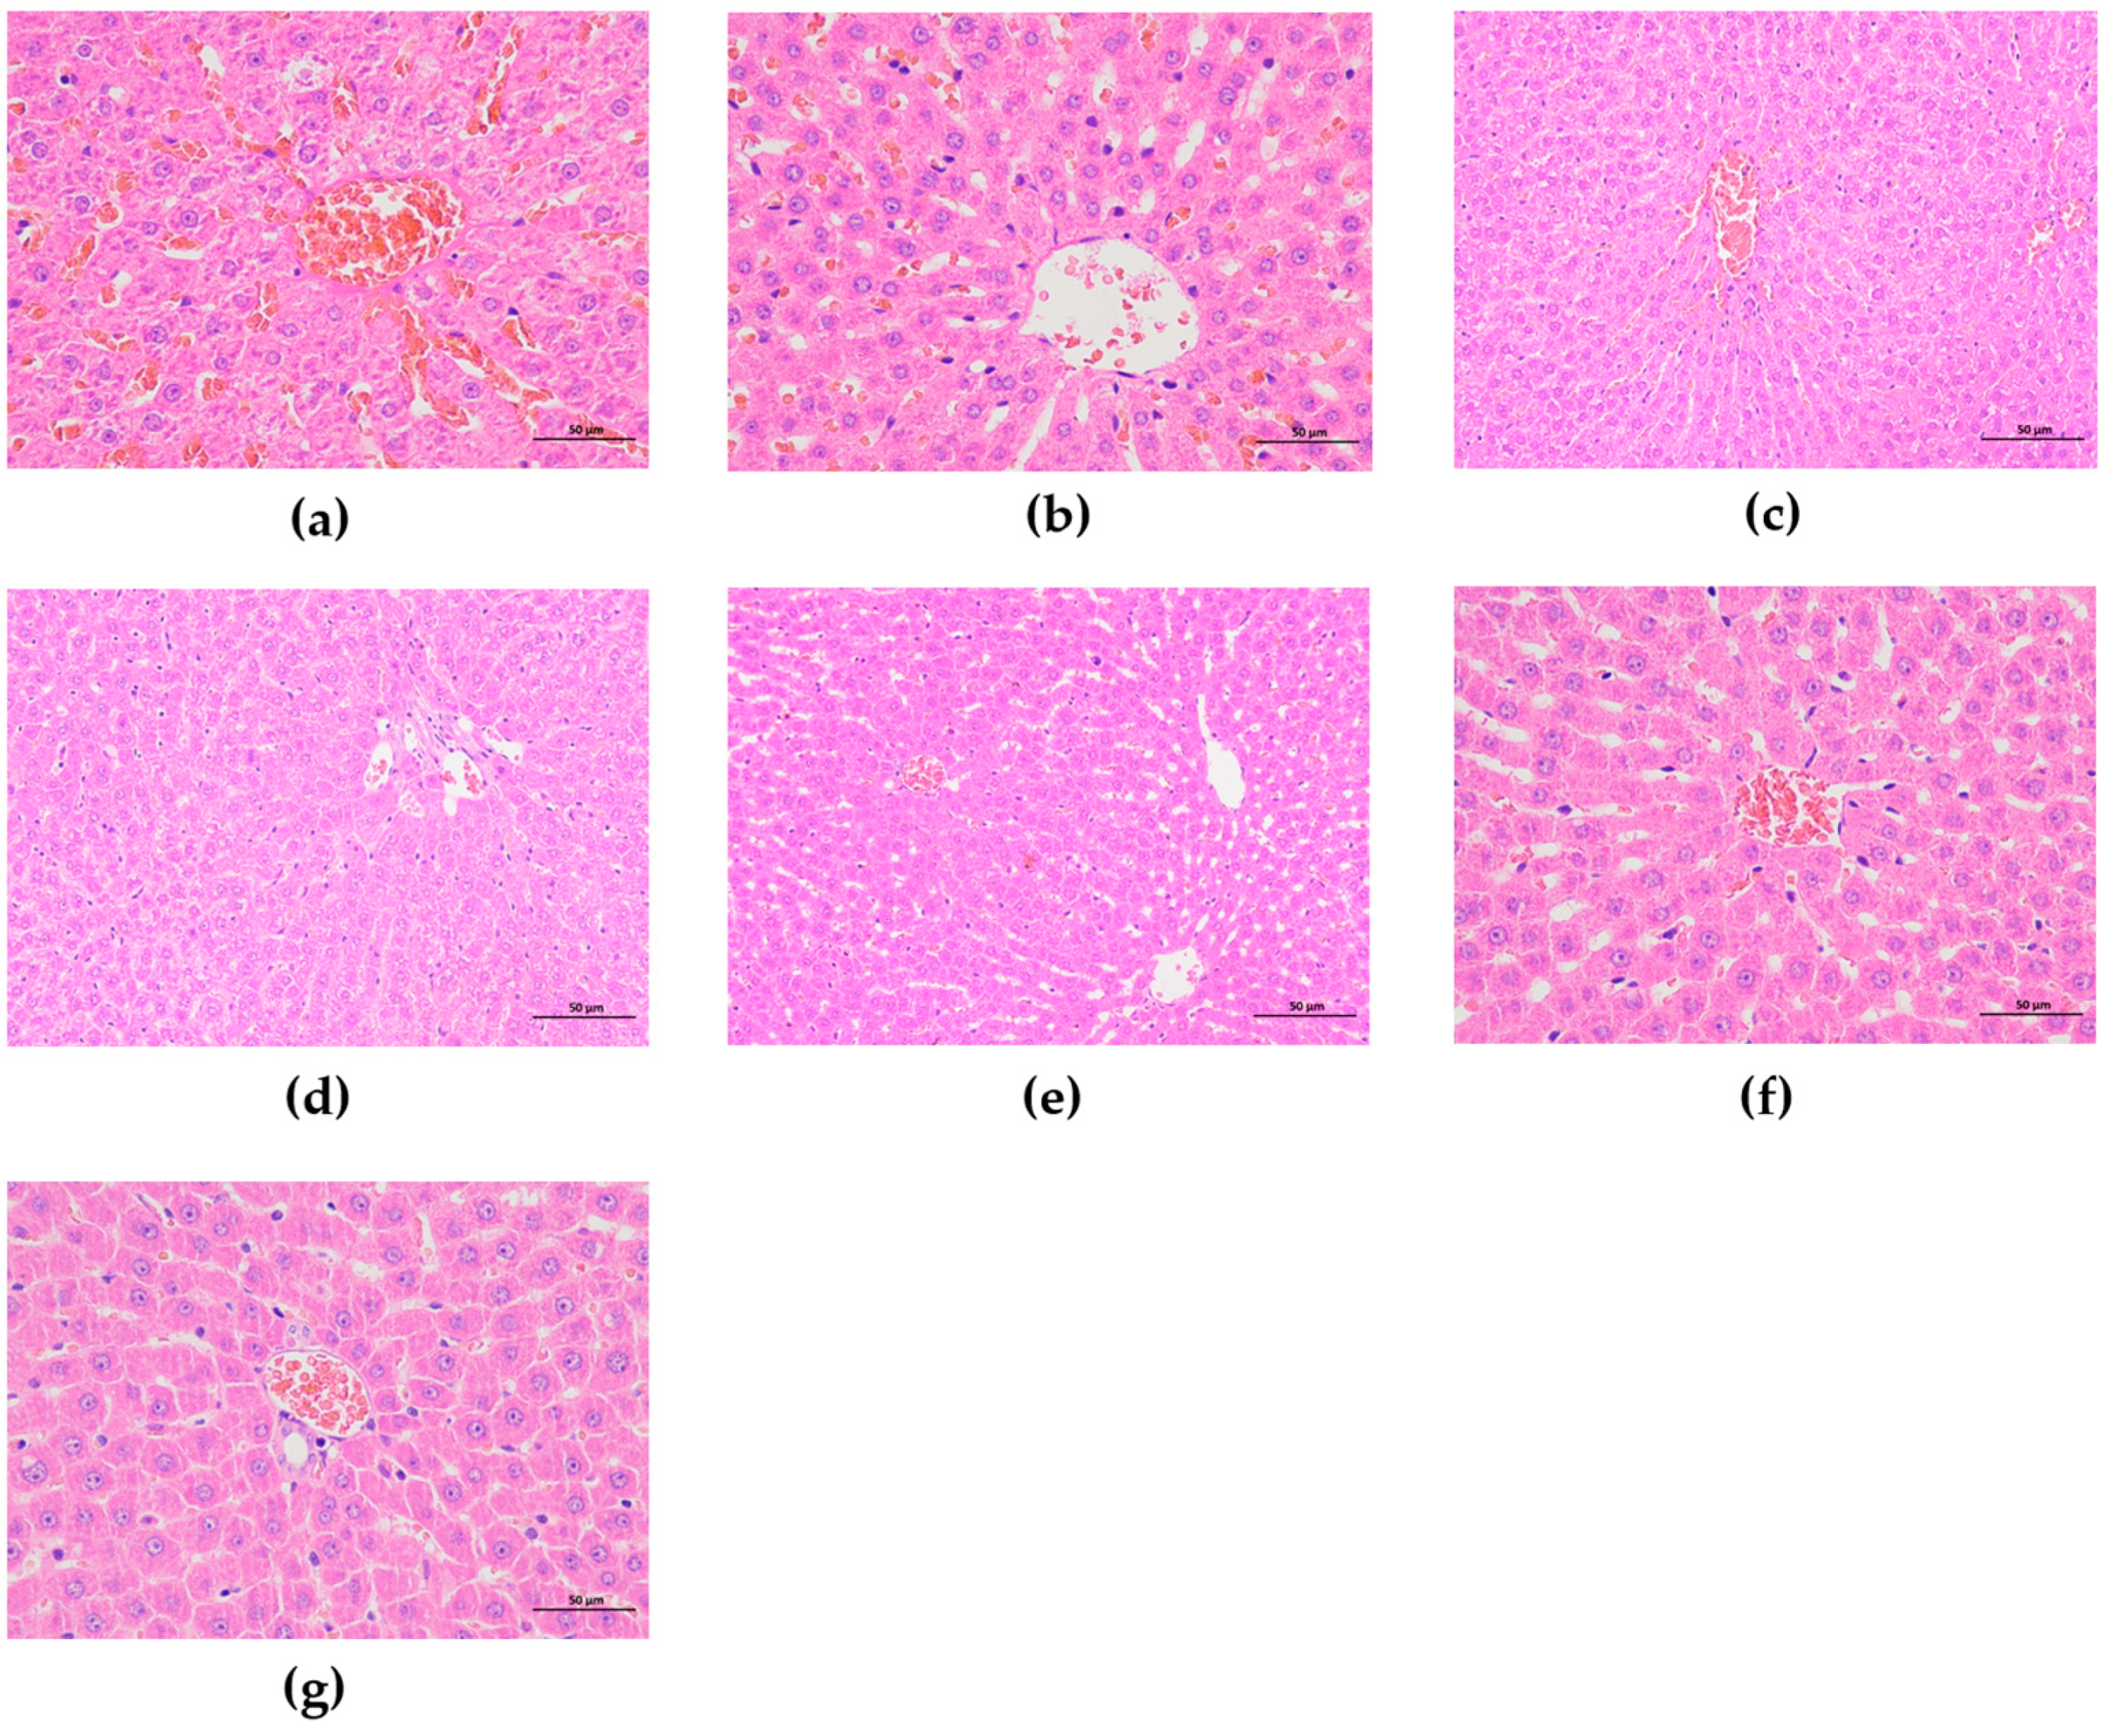
Histological analysis revealed obvious hepatocyte fat vacuoles, hepatic cord disarray, cellular incompleteness, and inflammatory cell infiltration in the DC group (Figure 20). Intervention ameliorated the above states to some extent, with the most significant improvement observed in the PC and FH groups. Compared to the DC group, the liver cell structure of the FH group was observed to be more tightly arranged, with radial scattering of hepatic cords, well-arranged hepatocytes, and intact cellular edges, suggesting that F-OPPF effectively ameliorated hepatic pathology in T2DM rats.

3.5.7. Effect of F-OPPF on Kidney Health in T2DM Rats

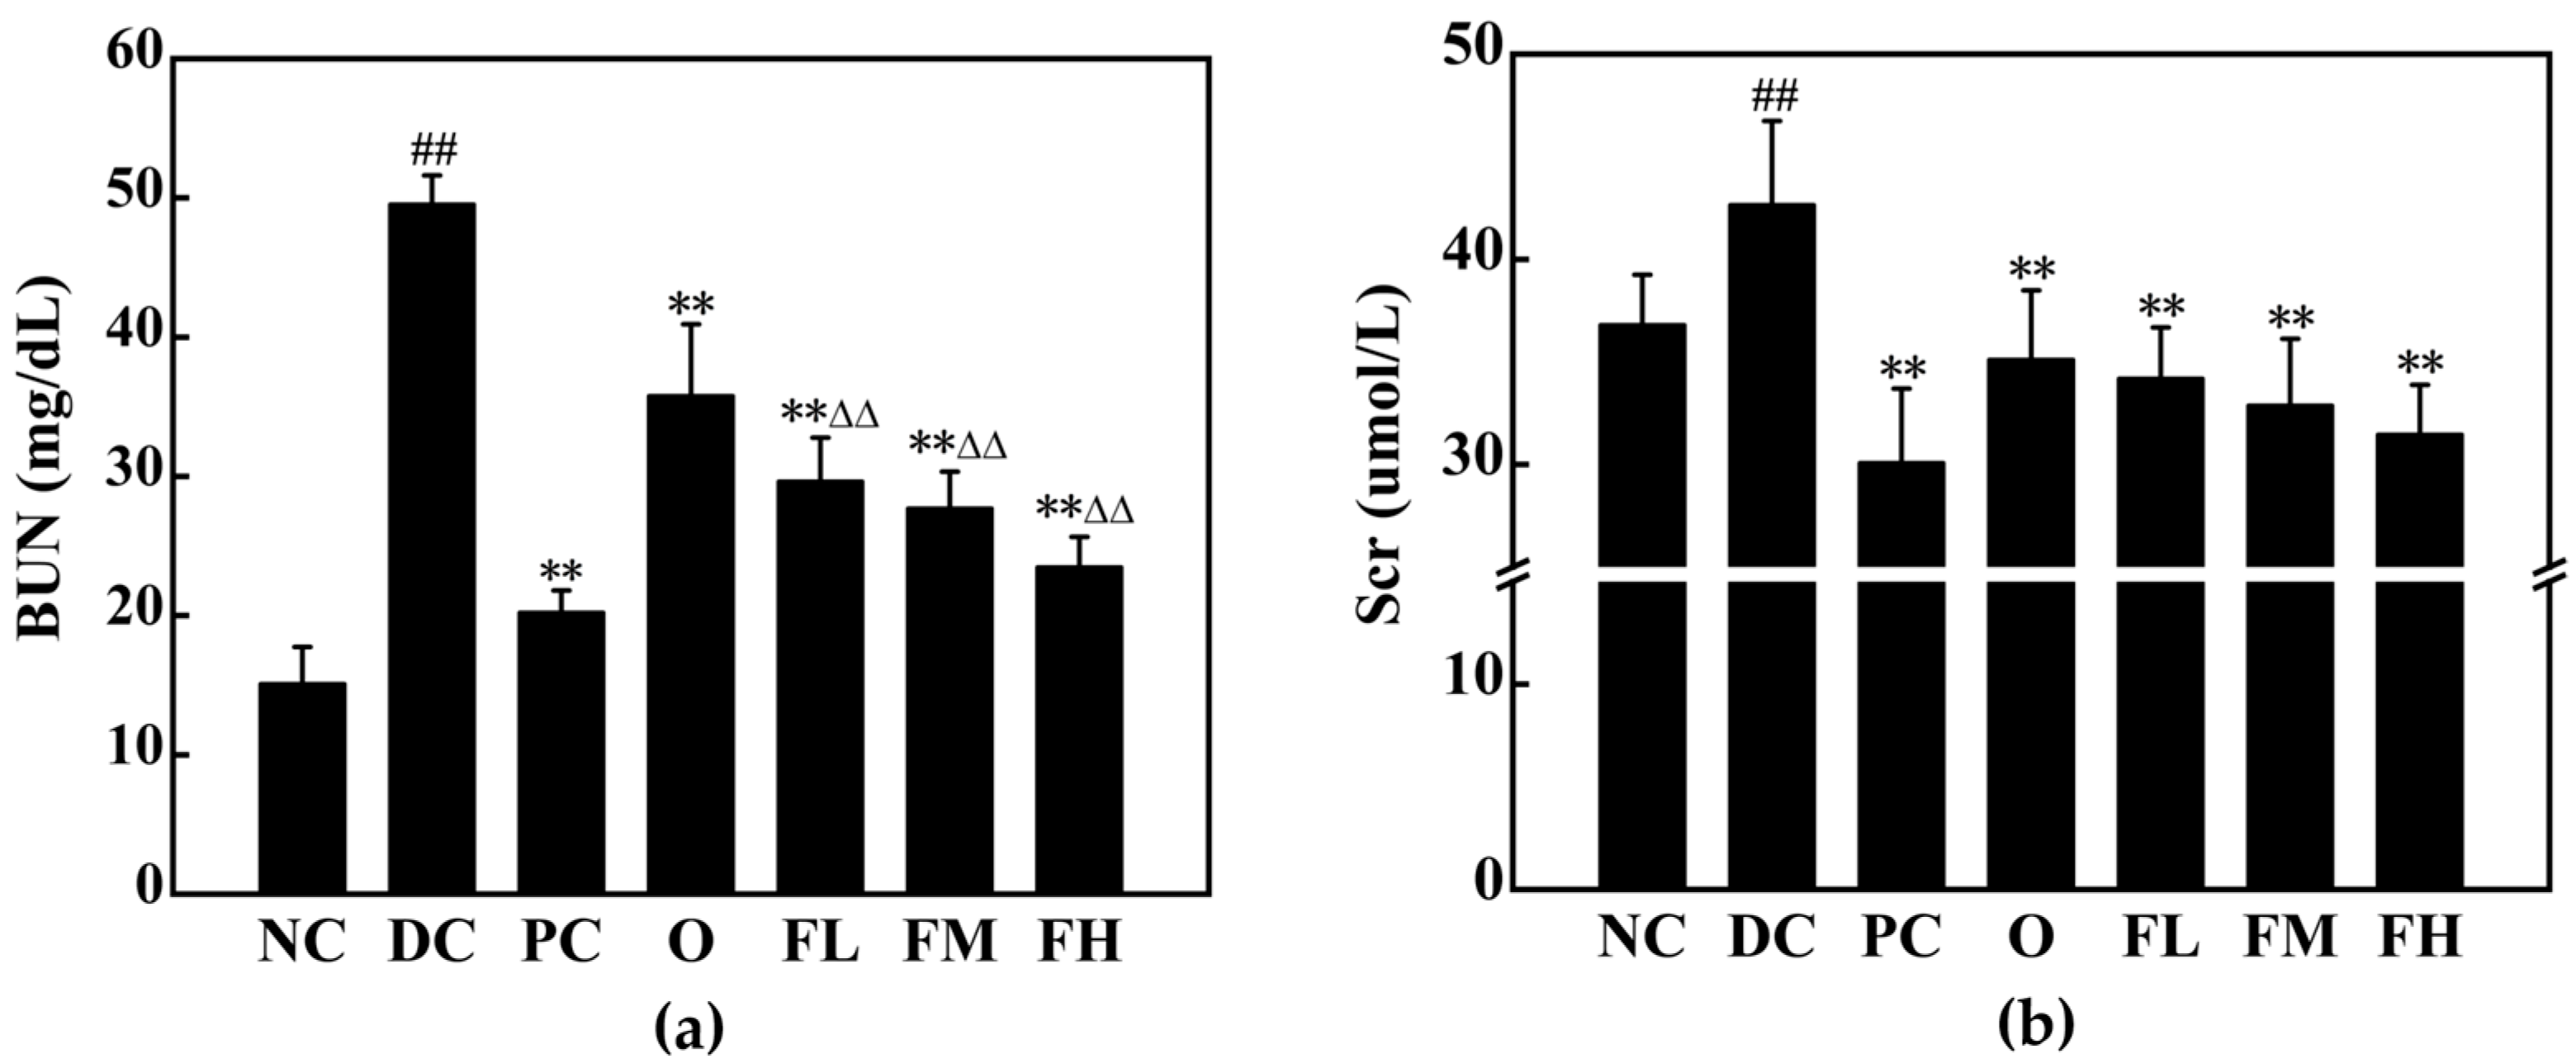
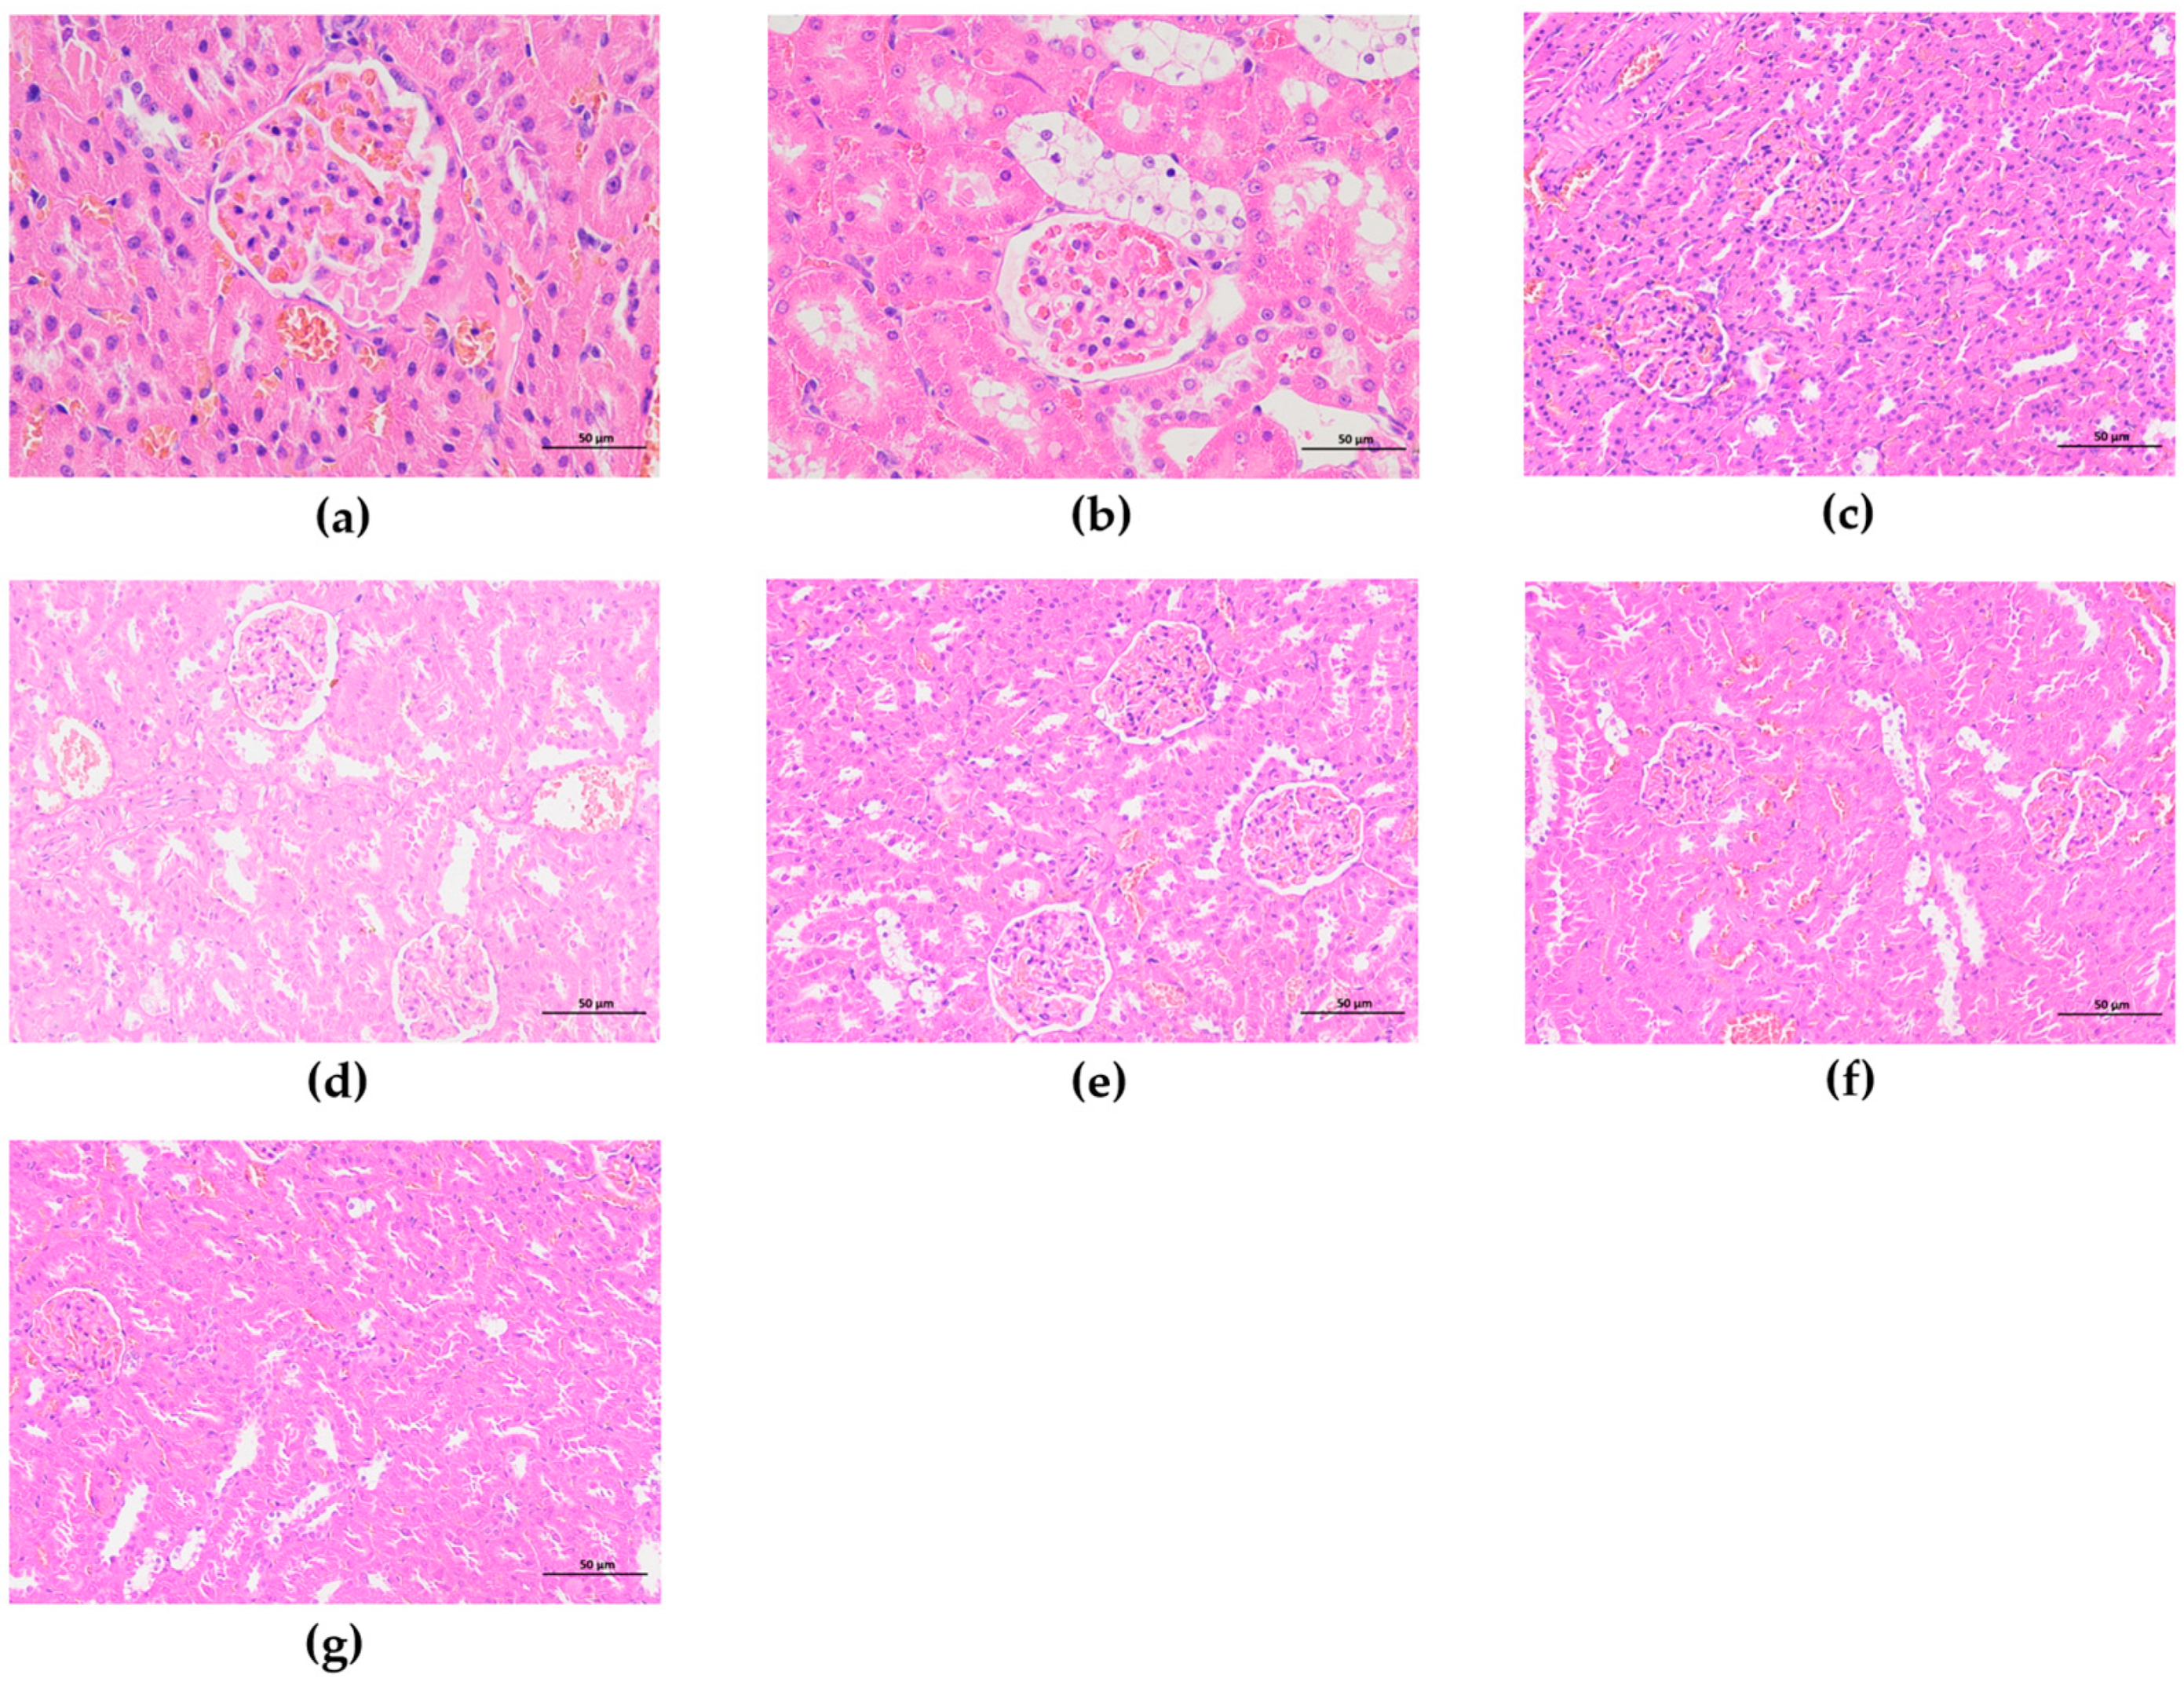
Figure 21 shows significant increases in BUN (NC: 15.10 mg/dL; DC: 49.55 umol/L) and Scr (NC: 35.33 mg/dL; DC: 42.65 umol/L) levels in the DC group compared to the NC group (p < 0.01), indicative of impaired renal filtration function. The BUN (20.23–35.79 mg/dL) and Scr (30.08–35.12 umol/L) levels in the intervention groups decreased, with reduction rates of 27.77% to 59.17% for BUN and 17.66% to 29.47% for Scr. Significant differences in BUN levels were noticed between O and fermented groups (p < 0.01), while no significant differences in Scr levels (p > 0.05). Histological analysis revealed thickening of the glomerular basement membrane and necrosis of the renal tubular lumen accompanied by severe vacuolar degeneration of epithelial cells in the DC group (Figure 22). The intervention improved renal structure with more regular and tightly arranged cells, reducing vacuolar, lumen necrosis, and membrane thickening. Collectively, F-OPPF enhanced renal protection in T2DM rats, ameliorating glomerular filtrati›on and renal pathology.

4. Discussion

Previous studies have highlighted oat’s potential as an antidiabetic dietary supplement [54]. Purple potato, classified as a middle-glycemic-index food [11], can be combined with oats to create suitable foods for diabetics. Additionally, various studies have shown that GL triterpenes play a significant role in diabetes treatment [16]. The triterpene content of solid-state fermentation products by GL can reflect not only the utilization of substrate by mycelium but also the functional values of the products. This study employed triterpene content as an optimization index and validated the in vivo hypoglycemic effect of fermented grain products by GL mycelium for the first time.
This study demonstrated the potential of fermentation by basidiomycetes mycelium to improve the content of active substances in grains. These results are similar to results reported by Cen et al. [17] and reflect the induced synthesis of secondary metabolites in grains by GL mycelium. However, the content of active substances in fermented products is related to the strain, fermentation conditions, and medium, which affect the utilization of substrate by mycelium and the state of components in the medium. Zhai et al. [27] reported that the total phenol content of seven kinds of grains fermented by Agaricus blazei, including wheat, rice, oat, corn, millet, broomcorn millet, and sorghum, showed different trends with fermentation time, with sorghum showing a continuous decrease. Research on the triterpene content in fermented grains is more focused on GL, whose fermentation could increase the contents of polysaccharides, triterpenes, flavonoids, and total phenols in soybean and sweet potato residues while reducing the corresponding contents in Zanthoxylum pericarpium residue. A single medium of grain residue was generally used for fermentation in these studies to achieve the recycling of waste resources. The content of active substances in fermented products is limited due to the lack of corresponding components in the medium, making it difficult to effectively compare other studies with this study. Additional studies are also needed on a single medium of oat or purple potato to compare the regularity and accessibility of fermentation in the compound medium.
In this study, consistent with the findings of Liu et al. [1], T2DM rats induced by HFD/STZ developed insulin resistance, likely related to the overexpression of inflammatory factor TNF-α [55], which required more insulin secretion, leading to insulin accumulation. After 7 weeks of F-OPPF intervention, the changes in pancreatic indices (FINS, ISI, and HOMA-IR) compared to the DC group indicated that F-OPPF improved insulin resistance and increased insulin sensitivity in T2DM rats without significantly promoting insulin secretion by islet cells.
Deteriorated glycemic balance markers (fasting blood glucose, glucose tolerance, glycated serum protein, and glycogen content) in the non-intervention group indicated worsening insulin action, increased glucose release from hepatocytes, and inhibited peripheral glucose utilization, leading to decreased glycogenesis. The fermented groups’ reduced GSP levels likely resulted from decreased circulating glucose residues [56]. The significant increase in liver glycogen content in the fermentation groups suggested that F-OPPF regulates blood glucose by enhancing glycogenesis. Current in vivo research on the improvement of glucose metabolism by GL mainly focuses on polysaccharides. Similar to the findings of this study, Liu et al. [1] reported that GL polysaccharides improved the glucose metabolism-related parameters in T2DM rats by enhancing insulin sensitivity, increasing glycogen synthesis, and facilitating glucose transportation. The enhanced hypoglycemic effect post-fermentation may stem from the enhanced α-amylase and α-glucosidase inhibitions, which can be attributed to bioactive compounds secreted by GL mycelium, including GL triterpenes, polysaccharides, and phenol compounds, along with the release of bioactive components in the substrate. Additionally, weight loss was associated with impaired energy metabolism, muscle wasting, and tissue protein loss due to carbohydrate unavailability [57]. F-OPPF intake may improve body weight by enhancing carbohydrate utilization and food efficiency.
The O group demonstrated some improvement in lipid metabolism in T2DM rats, possibly due to the promotion of cholesterol excretion by fibers in oat and purple potato and the reduction in VLDL hepatic synthesis [58]. Bensalah et al. [54] indicated that whole oat improved blood lipid levels and reversed cholesterol transport by reducing serum total cholesterol, triacylglycerols, and very-low- and low-density lipoprotein cholesterol contents and increasing lipids, cholesterol excretion, and high-density lipoprotein cholesteryl esters (HDL2-CE) concentrations. Improvement of lipid metabolism in the FH group compared to the O group may be attributed to increased fiber content, improvement of fiber adsorption capacity, and the effect of active components secreted by GL mycelium. This study found that GL fermentation increased the cholesterol, sodium cholate, and glucose adsorption capacities of insoluble dietary fiber in OPP. Additionally, similar to the findings of this study, Zhu et al. [59] reported that Ganoderma triterpenoids improved lipid accumulation and insulin resistance induced by a high-fat diet, which could be explained by regulating SREBPs target genes and metabolism-related genes in the liver or adipose tissue. Hajjaj et al. [60] indicated that Ganoderma triterpenoids could suppress cholesterol synthesis by inhibiting catalytic enzymes such as lanosterol 14-demethylase. The significant decrease in lipid metabolism markers of the fermented groups suggested that F-OPPF can promote cholesterol removal from peripheral tissues to the liver for catabolism, thereby reducing cardiovascular disease risk.
Glyco- and lipo-metabolism disorders in the DC group were possibly associated with inadequate antioxidant defenses and lipid peroxidation. Post-intervention, oxidative stress indicators in the O group improved (p < 0.01). Oat and purple potato have certain antioxidant capacities due to bioactive compounds like phenolic acids, avenanthramides, and anthocyanins, which inhibit lipid oxidation [61]. Compared to the O group, oxidative stress in fermented groups further improved, indicating that GL mycelium fermentation enhances the antioxidant capacity of oat and purple potato. In addition to the bioactive compounds released by the mycelium itself, fermentation can produce and release different antioxidant components by changing substrate structures and breaking down cell walls [40], increasing the active component content. Cen et al. [17] indicated that the antioxidant capabilities of sweet potato residue fermented by GL were largely linked to the contents of total phenol, flavonoid, triterpene, and polysaccharide, which showed a strong positive correlation with free radical scavenging ability, demonstrating previous findings.
Although GL has been proven to ameliorate the tissue injury induced by T2DM, few studies have been conducted on the organ protection of its solid-state fermentation products. In the study, F-OPPF as a diet improved the function and pathological morphology of organs in T2DM rats. These improvements are likely related to reduced oxidative stress and inflammation. Zhao et al. [62] reported that the intervention with low-glycemic-index (GI) biscuits made from potato and oat alleviated pathological damage, glucose and lipid metabolic disorders, and inflammation in T2DM rats induced by a high-fat diet and streptozotocin by reversing the TC, TG, HDL-C, and HDL-C levels and transforming growth factor-β, interleukin-1β, interleukin-6, and tumor necrosis factor-α, demonstrating previous findings. Post-fermentation, this protective effect of oat and purple potato was further improved. GL can decrease islet cell apoptosis by inhibiting the mitochondrial apoptotic pathway and activating the PI3K/Akt survival pathway [63]. Adeyi et al. [64] reported that GL ethanol extract increased catalase (pancreas and heart) and superoxide dismutase (pancreas, heart, liver, and kidneys) activities in hyperglycemic rats and abated cytomorphological derangements in the organs. Furthermore, the synergistic action of composite components in F-OPPF can also enhance its protective efficacy. In human experiments, the synergistic effect of GL triterpene and polysaccharide reduces free radical production, enhancing antioxidant and hepatoprotective effects [65].

5. Conclusions

The research conducted in the present study demonstrated that GL mycelium fermentation enhanced the nutritional and functional values of oat and purple potato. Specifically, the triterpene content in F-OPPF significantly improved from 8.53 mg/g to 17.23 mg/g under optimal conditions (temperature: 28 °C, inoculum size: 10%, material quantity: 36 g/250 mL, and fermentation time: day 13). This biotransformation led to enhanced nutritional quality, with increased contents of protein, soluble protein, crude fiber, ash, mineral elements, and essential amino acids. The contents of polysaccharides, triterpenes, flavonoids, and total phenols peaked on day 15 (26.46 mg/g), day 13 (17.23 mg/g), day 13 (1.11 mg/g), and day 15 (3.20 mg/g), with an increase by 1.97, 1.02, 2.36, and 1.54 times compared to the initial values, respectively. Fermentation did not alter the types of reactive groups and crystals (C + V-type) of the substrate, but it did increase crystallinity. Additionally, F-OPPF exhibited better performance in antioxidant and hypoglycemic activities and IDF adsorption capacity. In vivo results indicated that F-OPPF alleviated diabetic symptoms and concurrent injuries in T2DM rats, including the improvement of body weight; glyco- and lipo-metabolism (FBG, GSP, glycogen, OGTT, TC, TG, LDL-C, and HDL-C); oxidative stress (MDA, T-SOD, and GSH-Px); and the function of the pancreas (ITT, FINS, HOMA-IR, and ISI), liver (AST and ALT), and kidneys (BUN and Scr), as well as the recovery of tissue morphology with clear structure, good arrangement, and intact cells, positioning it as a promising raw material for diabetic-friendly foods, suggesting promising market potential. Future research, however, needs to explore the effect of GL fermentation on changes in the flavor of grains in more detail. Although our study contributes to understanding the physiological improvements of F-OPPF on diabetic damage, the molecular mechanisms remain unknown. Additional studies are needed on the hypoglycemic mechanism of grains fermented by GL mycelium.

Author Contributions

Conceptualization, J.G. (Jie Gang) and Y.G.; methodology, Y.G., T.Z., A.Z., D.Z. and X.H.; software, Y.G.; validation, Y.G.; formal analysis, J.G. (Jie Gang) and Y.G.; investigation, X.F. and J.G. (Jiajun Geng); resources, T.Z., D.Z., X.H. and X.F.; data curation, Y.G. and J.G. (Jiajun Geng); writing—original draft preparation, Y.G.; writing—review and editing, J.G. (Jie Gang); visualization, J.G. (Jie Gang) and Y.G.; supervision, J.G. (Jie Gang); project administration, J.G. (Jie Gang); funding acquisition, J.G. (Jie Gang). All authors have read and agreed to the published version of the manuscript.

Funding

This research was funded by the Dalian Minzu University and Tongren Sciences Academy Joint Research Project (2019110057); Dalian Minzu University Service National Strategic Special Project (2020fwgj020); and Fundamental Research Funds for the Central Universities (0919-140279).

Institutional Review Board Statement

All the procedures were conducted in accordance with Chinese laws and regulations and were approved by the Department of Science & Technology of Liaoning Province on 7 September 2023 (License No. SCXK (Liao) 2020-0001).

Informed Consent Statement

Not applicable.

Data Availability Statement

The data that support the findings of this study are available from the corresponding author upon reasonable request.

Conflicts of Interest

The authors declare no conflicts of interest.

References

  1. Liu, Y.; Li, Y.; Zhang, W.; Sun, M.; Zhang, Z. Hypoglycemic effect of inulin combined with ganoderma lucidum polysaccharides in T2DM rats. J. Funct. Foods 2019, 55, 381–390. [Google Scholar] [CrossRef]
  2. Janssen, J.-A.-M.-J.-L. Hyperinsulinemia and Its Pivotal Role in Aging, Obesity, Type 2 Diabetes, Cardiovascular Disease and Cancer. Int. J. Mol. Sci. 2021, 22, 7797. [Google Scholar] [CrossRef] [PubMed]
  3. Stitt, A.-W.; Curtus, T.-M.; Chen, M.; Medina, R.-J.; Mckay, G.-J.; Jenkins, A.; Lois, N. The progress in understanding and treatment of diabetic retinopathy. Prog. Retin. Eye Res. 2016, 51, 156–186. [Google Scholar] [CrossRef] [PubMed]
  4. Goedecke, J.-H.; Micklesfield, L.-K. The effect of exercise on obesity, body fat distribution and risk for type 2 diabetes. Diabetes Phys. Act. 2014, 60, 82–93. [Google Scholar] [CrossRef]
  5. Sanders, T.-A. How important is the relative balance of fat and carbohydrate as sources of energy in relation to health? Proc. Nutr. Soc. 2016, 75, 147–153. [Google Scholar] [CrossRef]
  6. Baudet, M.; Daugareil, C.; Ferrieres, J. Cardiovascular disease prevention and life style modifications. Ann. Cardiol. d’Angéiologie 2012, 61, 93–98. [Google Scholar] [CrossRef]
  7. Ruxton, C.; Derbyshire, E. The health benefits of whole grains and fibre. Nutr. Food Sci. 2014, 44, 492–519. [Google Scholar] [CrossRef]
  8. Oghbaei, M.; Prakash, J.; Yildiz, F. Effect of primary processing of cereals and legumes on its nutritional quality: A comprehensive review. Cogent. Food Agric. 2016, 2, 1136015. [Google Scholar] [CrossRef]
  9. Liu, R.; Li, J.; Wu, T.; Li, Q.; Meng, Y.; Zhang, M. Effects of ultrafine grinding and cellulase hydrolysis treatment on physicochemical and rheological properties of oat (Avena nuda L.) β-glucans. J. Cereal Sci. 2015, 65, 125–131. [Google Scholar] [CrossRef]
  10. Ma, X.; Gu, J.; Zhang, Z.; Jing, L.; Xu, M.; Dai, X.; Cai, X. Effects of Avena nuda L. on metabolic control and cardiovascular disease risk among Chinese patients with diabetes and meeting metabolic syndrome criteria: Secondary analysis of a randomized clinical trial. Eur. J. Clin. Nutr. 2013, 67, 1291–1297. [Google Scholar] [CrossRef]
  11. Nurdjanah, S.; Nurdin, S.-U.; Astuti, S.; Manik, V.-E. Chemical components, antioxidant activity, and glycemic response values of purple sweet potato products. Int. J. Food Sci. 2022, 2022, 7708172. [Google Scholar] [CrossRef] [PubMed]
  12. Ramdath, D.-D.; Padhi, E.; Hawke, A.; Sivaramalingam, T.; Tsao, R. The glycemic index of pigmented potatoes is related to their polyphenol content. Food Funct. 2014, 5, 909–915. [Google Scholar] [CrossRef] [PubMed]
  13. Palupi, E.; Delina, N.; Nurdin, N.-M.; Navratilova, H.-F.; Rimbawan, R.; Sulaeman, A. Kidney bean substitution ameliorates the nutritional quality of extruded purple sweet potatoes: Evaluation of chemical composition, glycemic index, and antioxidant capacity. Foods 2023, 12, 2023. [Google Scholar] [CrossRef] [PubMed]
  14. Sharma, C.; Bhardwaj, N.; Sharma, A.; Tuli, H.-S.; Katyal, P.; Beniwal, V.; Gupta, G.-K.; Sharma, A.-K. Bioactive metabolites of Ganoderma lucidum: Factors, mechanism and broad spectrum therapeutic potential. J. Herb. Med. 2019, 17, 100268. [Google Scholar] [CrossRef]
  15. Fatmawati, S.; Kondo, R.; Shimizu, K. Structure-activity relationships of lanostane-type triterpenoids from Ganoderma lingzhi as α-glucosidase inhibitors. Bioorg. Med. Chem. Lett. 2013, 23, 5900–5903. [Google Scholar] [CrossRef]
  16. Ren, L. Protective effect of ganoderic acid against the streptozotocin induced diabetes, inflammation, hyperlipidemia and microbiota imbalance in diabetic rats. Saudi J. Biol. Sci. 2019, 26, 1961–1972. [Google Scholar] [CrossRef]
  17. Cen, Q.; Fan, J.; Zhang, R.; Chen, H.; Hui, F.; Li, J.; Qin, L. Impact of Ganoderma lucidum fermentation on the nutritional composition, structural characterization, metabolites, and antioxidant activity of Soybean, sweet potato and Zanthoxylum pericarpium residues. Food Chem. X 2024, 21, 101078. [Google Scholar] [CrossRef]
  18. GB 5009.88-2023; National Food Safety Standard–Determination of Dietary Fiber in Foods. National Health Commission of the People’s Republic of China: Beijing, China, 2023.
  19. GB 5009.9-2023; National Food Safety Standard–Determination of Starch in Foods. National Health Commission of the People’s Republic of China: Beijing, China, 2023.
  20. GB 5009.5-2016; National Food Safety Standard–Determination of Protein in Foods. National Health Commission of the People’s Republic of China: Beijing, China, 2016.
  21. GB 5009.6-2016; National Food Safety Standard–Determination of Fat in Foods. National Health Commission of the People’s Republic of China: Beijing, China, 2016.
  22. GB/T 15672-2009; Determination of Total Sugar Contents in Edible Fungi. National Standardization Administration of China: Beijing, China, 2009.
  23. GB/T 6434-2022; Determination of Crude Fiber Content in Feed. National Standardization Administration of China: Beijing, China, 2022.
  24. GB 5009.4-2016; National Food Safety Standard–Determination of Ash in Foods. National Health Commission of the People’s Republic of China: Beijing, China, 2016.
  25. GB 5009.268-2016; National Food Safety Standard–Determination of Multielement in Foods. National Health Commission of the People’s Republic of China: Beijing, China, 2016.
  26. GB 5009.124-2016; National Food Safety Standard–Determination of Amino Acids in Foods. National Health Commission of the People’s Republic of China: Beijing, China, 2016.
  27. Zhai, F.-H.; Wang, Q.; Han, J.-R. Nutritional components and antioxidant properties of seven kinds of cereals fermented by the basidiomycete Agaricus blazei. J. Cereal Sci. 2015, 65, 202–208. [Google Scholar] [CrossRef]
  28. McDonald, S.; Prenzler, P.-D.; Autolovich, M.; Robards, K. Phenolic content and antioxidant activity of olive extracts. Food Chem. 2001, 73, 73–84. [Google Scholar] [CrossRef]
  29. NY/T 3676-2020; Determination of Total Triterpene Contents in Ganoderma lucidum–Spectrophotometric Method. Ministry of Agriculture and Rural Affairs of the People’s Republic of China: Beijing, China, 2020.
  30. Tang, M.; Wang, L.; Cheng, X.; Wu, Y.-W.; Jie, O. Non-starch constituents influence the in vitro digestibility of naked oat (Avena nuda L.) starch. Food Chem. 2019, 297, 124953. [Google Scholar] [CrossRef]
  31. Jia, M.; Chen, J.; Liu, Z.; Xie, Y.; Nie, P.; Chen, Y.; Xie, J.; Yu, Q. Structural characteristics and functional properties of soluble dietary fiber from defatted rice bran obtained through Trichoderma viride fermentation. Food Hydrocoll. 2019, 94, 468–474. [Google Scholar] [CrossRef]
  32. Peerajit, P.; Chiewchan, N.; Devahastin, S. Effects of pretreatment methods on health-related functional properties of high dietary fibre powder from lime residues. Food Chem. 2012, 132, 1891–1898. [Google Scholar] [CrossRef]
  33. Zheng, Y.; Li, Y. Physicochemical and functional properties of coconut (Cocos nucifera L) cake dietary fibers: Effects of cellulase hydrolysis, acid treatment and particle size distribution. Food Chem. 2018, 257, 135–142. [Google Scholar] [CrossRef] [PubMed]
  34. GB/T 34791-2017; Quality Control Requirements for Experimental Animals. National Standardization Administration of China: Beijing, China, 2017.
  35. Li, W.; Liu, Y.; Wang, Z.; Han, Y.; Tian, Y.-H.; Zhang, G.-S.; Sun, Y.-S.; Wang, Y.-P. Platycodin D isolated from the aerial parts of Platycodon grandiflorum protects alcohol-induced liver injury in mice. Food Funct. 2015, 6, 1418–1427. [Google Scholar] [CrossRef]
  36. Liu, Y.; Zhou, Y.; Zhu, C.; Meng, Y.; Wang, J.; Chen, X.; Huang, J. Optimization of fermentation process of wheat germ protein by Aspergillus niger and analysis of antioxidant activity of peptide. Fermentation 2024, 10, 121. [Google Scholar] [CrossRef]
  37. Chen, H.; Fang, L.; Yu, X. Influence of different cultivation methods on ganoderic acid synthesis and solid–state fermentation condition optimization. Sci. Technol. Food Ind. 2017, 38, 167–172. [Google Scholar] [CrossRef]
  38. Lou, H.; Yang, C.; Gong, Y.; Li, Y.; Li, Y.; Tian, S.; Zhao, Y.; Zhao, R. Edible fungi efficiently degrade aflatoxin B1 in cereals and improve their nutritional composition by solid-state fermentation. J. Hazard. Mater. 2023, 451, 131139. [Google Scholar] [CrossRef]
  39. Yin, L.; Liu, Z.; Lu, X.; Cheng, J.; Lu, G.; Sun, J.; Yang, H.; Guan, Y.; Pang, L. Analysis of the nutritional properties and flavor profile of sweetpotato residue fermented with Rhizopus oligosporus. LWT 2023, 174, 114401. [Google Scholar] [CrossRef]
  40. Yang, L.; Fu, T.; Yang, F. Biovalorization of soybean residue (okara) via fermentation with Ganoderma lucidum and Lentinus edodes to attain products with high anti-osteoporotic effects. J. Biosci. Bioeng. 2020, 129, 514–518. [Google Scholar] [CrossRef]
  41. GB 2762-2022; National Food Safety Standard–Limit of Pollutants in Foods. National Health Commission of the People’s Republic of China: Beijing, China, 2022.
  42. Sun, H.; Fan, J.; Tian, Z.; Ma, L.; Meng, Y.; Yang, Z.; Zeng, X.; Liu, X.; Kang, L.; Nan, X. Effects of treatment methods on the formation of resistant starch in purple sweet potato. Food Chem. 2022, 367, 130580. [Google Scholar] [CrossRef]
  43. Shah, A.; Masoodi, F.-A.; Gani, A.; Ashwar, B. Dual enzyme modified oat starch: Structural characterisation, rheological properties, and digestibility in simulated GI tract. Int. J. Biol. Macromol. 2018, 106, 140–147. [Google Scholar] [CrossRef] [PubMed]
  44. Snape, C.-E.; Morrison, W.-R.; Maroto-Valer, M.-M.; Karkalas, J.; Pethrick, R.-A. Solid state13C NMR investigation of lipid ligands in V-amylose inclusion complexes. Carbohyd. Polym. 1998, 36, 225–237. [Google Scholar] [CrossRef]
  45. Gupta, R.; Gaur, S. Investigating the effect of natural fermentation in modifying the physico-functional, structural and thermal characteristics of pearl and finger millet starch. J. Sci. Food Agric. 2023, 104, 2440–2448. [Google Scholar] [CrossRef] [PubMed]
  46. Zhao, T.; Li, X.; Zhu, R.; Ma, Z.; Liu, L.; Wang, X.; Hu, X. Effect of natural fermentation on the structure and physicochemical properties of wheat starch. Carbohyd. Polym. 2019, 218, 163–169. [Google Scholar] [CrossRef]
  47. Lu, Z.-H.; Li, L.-T.; Min, W.-H.; Wang, F.; Tatsumi, E. The effects of natural fermentation on the physical properties of rice flour and the rheological characteristics of rice noodles. Int. J. Food Sci. Technol. 2005, 40, 985–992. [Google Scholar] [CrossRef]
  48. Shaikh, F.; Ali, T.-M.; Mustafa, G.; Hasnain, A. Comparative study on effects of citric and lactic acid treatment on morphological, functional, resistant starch fraction and glycemic index of corn and sorghum starches. Int. J. Biol. Macromol. 2019, 135, 314–327. [Google Scholar] [CrossRef]
  49. Hua, M.; Lu, J.; Qu, D.; Liu, C.; Zhang, L.; Li, S.; Chen, J.; Sun, Y. Structure, physicochemical properties and adsorption function of insoluble dietary fiber from ginseng residue: A potential functional ingredient. Food Chem. 2019, 286, 522–529. [Google Scholar] [CrossRef]
  50. Wang, Y.-Q.; Wang, J.-D.; Cai, Z.-H.; Huang, H.; Zhang, S.; Fu, L.-N.; Zhao, P.-Q.; Yan, X.-Y.; Fu, Y.-J. Improved physicochemical and functional properties of dietary fiber from Rosa roxburghii pomace fermented by Bacillus natto. Food Biosci. 2022, 50, 102030. [Google Scholar] [CrossRef]
  51. Meng, X.; Liu, F.; Xiao, Y.; Cao, J.; Wang, M.; Duan, X. Alterations in physicochemical and functional properties of buckwheat straw insoluble dietary fiber by alkaline hydrogen peroxide treatment. Food Chem. X 2019, 3, 100029. [Google Scholar] [CrossRef]
  52. Lu, Y.; Jiang, H.; Zhang, H.; Li, R.; Zhang, Q.; Luo, D.; Li, M. Serum oxidized low density lipoprotein serves as a mediator for the inverse relationship between serum D-ribose and cognitive performance in type 2 diabetic patients. Free. Radic. Biol. Med. 2021, 171, 91–98. [Google Scholar] [CrossRef]
  53. Zampieri, M.; Karpach, K.; Salerno, G.; Raguzzini, A.; Barchetta, I.; Cimini, F.-A.; Dule, X.; Reale, A. PAR level mediates the link between ROS and inflammatory response in patients with type 2 diabetes mellitus. Redox Biol. 2024, 75, 103243. [Google Scholar] [CrossRef] [PubMed]
  54. Bensalah, F.; Harrat, N.-I.; Affane, F.; Chekkal, H.; Lamri-Senhadii, M. Incorporation of whole oat, especially bran, into a high-fat diet, improves cardio–metabolic risk factors in type 2 diabetic rats. Nutr. Food Sci. 2018, 49, 600–616. [Google Scholar] [CrossRef]
  55. Lazar, M.-A. How obesity causes diabetes: Not a tall tale. Science 2005, 307, 373–375. [Google Scholar] [CrossRef] [PubMed]
  56. Edeas, M.; Attaf, D.; Mailfert, A.-S.; Nasu, M.; Joubet, R. Maillard reaction, mitochondria and oxidative stress: Potential role of antioxidants. Pathol. Biol. 2010, 58, 220–225. [Google Scholar] [CrossRef]
  57. Li, F.; Zhang, Y.; Zhong, Z. Antihyperglycemic effect of ganoderma lucidum polysaccharides on streptozotocin-induced diabetic mice. Int. J. Mol. Sci. 2011, 12, 6135–6145. [Google Scholar] [CrossRef]
  58. Harris, K.-A.; Kris-Etherton, P.-M. Effects of whole grains on coronary heart disease risk. Curr. Atheroscler. Rep. 2010, 12, 368–376. [Google Scholar] [CrossRef]
  59. Zhu, J.; Jin, J.; Ding, J.; Li, S.; Xia, J. Ganoderic acid a improves high fat diet-induced obesity, lipid accumulation and insulin sensitivity through regulating srebp pathway. Chem.-Biol. Interact. 2018, 290, 77–87. [Google Scholar] [CrossRef]
  60. Hajjaj, H.; Mace, C.; Roberts, M.; Niederberger, P.; Fay, L.-B. Effect of 26-oxygenosterols from ganoderma lucidum and their activity as cholesterol synthesis inhibitors. Appl. Environ. Microb. 2005, 71, 3653–3658. [Google Scholar] [CrossRef]
  61. Tsopmo, A. Processing and Impact on Active Components in Food; Academic Press: San Diego, CA, USA, 2015; pp. 361–368. [Google Scholar] [CrossRef]
  62. Zhao, R.; Li, N.; Liu, W.; Liu, Q.; Zhang, L.; Peng, X.; Zhao, R.; Hu, H. Low glycemic index potato biscuits alleviate physio-histological damage and gut dysbiosis in rats with type-2 diabetes mellitus induced by high-sugar and high-fat diet and streptozotocin. J. Nutr. Biochem. 2023, 119, 109401. [Google Scholar] [CrossRef]
  63. Li, L.; Li, R.-C.; Song, Y.-H.; Wu, W.-Y.; Yin, S.-H.; Fu, W.-W.; Li, W. Effects of a Ganoderma atrum polysaccharide against pancreatic damage in streptozotocin-induced diabetic mice. Food Funct. 2019, 10, 7227–7238. [Google Scholar] [CrossRef]
  64. Adeyi, A.-O.; Awosanya, S.-A.; Adeyi, O.-E.; James, A.-S.; Adenipekun, C.-O. Ganoderma lucidum ethanol extract abrogates metabolic syndrome in rats: In vivo evaluation of hypoglycemic, hypolipidemic, hypotensive and antioxidant properties. Obes. Med. 2021, 22, 100320. [Google Scholar] [CrossRef]
  65. Chiu, H.-F.; Fu, H.-Y.; Lu, Y.-Y.; Han, Y.-C.; Shen, Y.-C.; Venkatakrishnan, K.; Golovinskaia, O.; Wang, C.-K. Triterpenoids and polysaccharide peptides-enriched Ganoderma lucidum: A randomized, doubleblind placebo-controlled crossover study of its antioxidation and hepatoprotective efficacy in healthy volunteers. Pharm. Biol. 2017, 55, 1041–1046. [Google Scholar] [CrossRef]
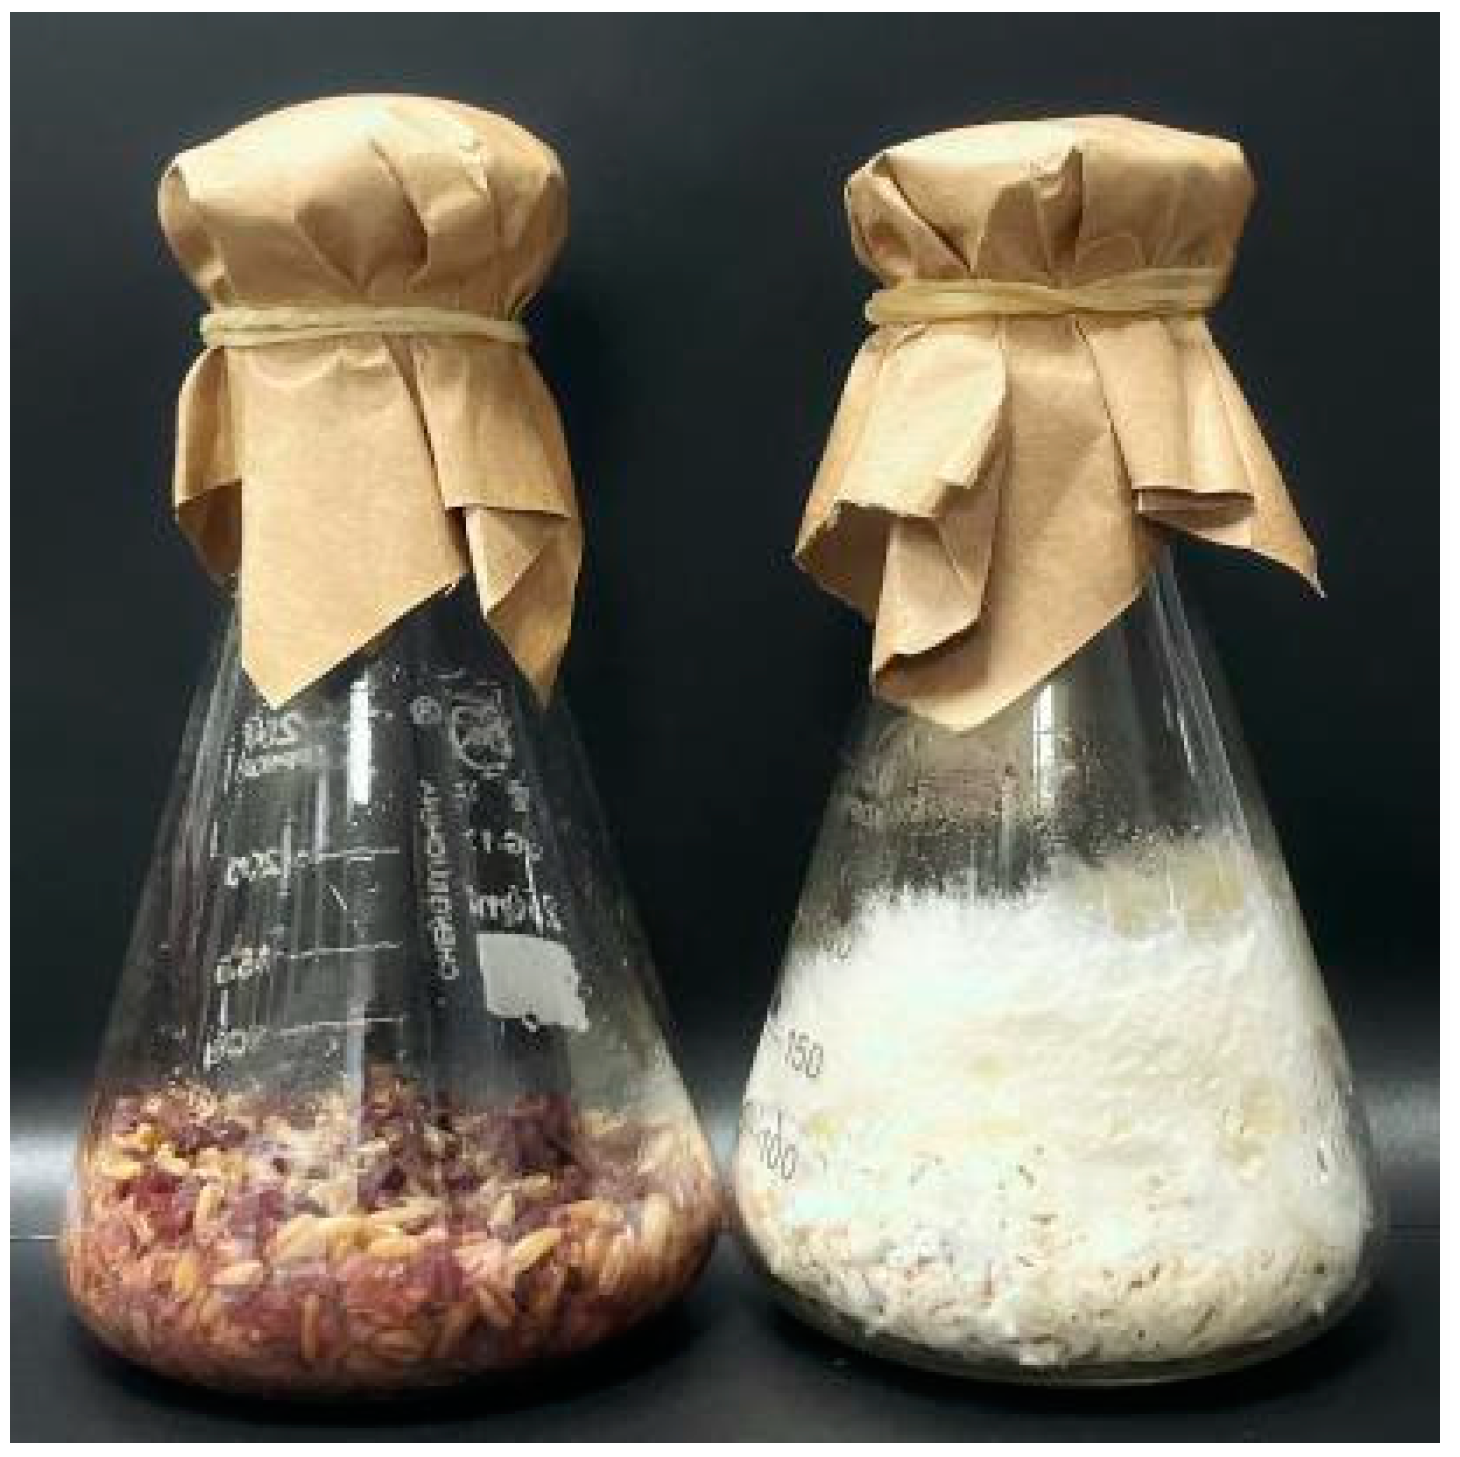
Figure 1. The overall appearance of OPP and F-OPP on day 11 of fermentation (OPP: compound medium of oat and purple potato; F-OPP: fermented OPP).
Fermentation 10 00618 g001
Figure 2. Effect of temperature (a), material quantity (b), and inoculum size (c) on triterpene content (values with different lowercase letters indicate significant differences at p < 0.05).
Fermentation 10 00618 g002
Figure 3. Three-dimensional response surface diagrams of the effect of interaction between temperature and material quantity (a), temperature and inoculum size (b), material quantity and inoculum size (c) on triterpene content.
Fermentation 10 00618 g003
Figure 4. Changes in triterpene content during fermentation process (values with different lowercase letters indicate significant differences at p < 0.05).
Fermentation 10 00618 g004
Figure 5. Changes in the contents of polysaccharide (a), flavonoid (b), and total phenol (c) during the fermentation process (values with different lowercase letters indicate significant differences at p < 0.05).
Fermentation 10 00618 g005
Figure 6. Scanning electron micrographs of OPPF ((a) ×5k; (c) ×7k) and F-OPPF ((b) ×5k; (d) ×7k) (OPPF: flour of compound medium of oat and purple potato; F-OPPF: fermented product).
Fermentation 10 00618 g006
Figure 7. X-ray diffraction spectra of OPPF, F-OPPF, OPPS, and F-OPPS (OPPF: flour of compound medium of oat and purple potato; F-OPPF: fermented product; OPPS: OPPF starch; and F-OPPS: F-OPPF starch).
Fermentation 10 00618 g007
Figure 8. FTIR spectra of OPPF, F-OPPF, OPPS, and F-OPPS (OPPF: flour of compound medium of oat and purple potato; F-OPPF: fermented product; OPPS: OPPF starch; and F-OPPS: F-OPPF starch).
Fermentation 10 00618 g008
Figure 9. Thermogravimetric curves of OPPF and F-OPPF: (a) thermogravimetric cures; (b) derivative thermogravimetric cures (OPPF: flour of compound medium of oat and purple potato; F-OPPF: fermented product).
Fermentation 10 00618 g009
Figure 10. Changes in antioxidant activities of ethanol extract after fermentation: DPPH (a), hydroxyl (b), and superoxide anion (c) radical scavenging rates with concentration; DPPH (d), hydroxyl (e), and superoxide anion (f) radical scavenging capacities with fermentation time (OPPF: flour of compound medium of oat and purple potato; F-OPPF: fermented product. Values with different uppercase letters at the same extraction concentration indicate significant differences at p < 0.05 between treatments; values with different lowercase letters represent significant differences at p < 0.05 within the same treatment at different extraction concentrations or fermentation time points).
Fermentation 10 00618 g010
Figure 11. Changes in hypoglycemic activities of ethanol extract after fermentation: (a) α-amylase inhibition rate with concentration, (b) α-glucosidase inhibition rate with concentration, (c) α-amylase inhibition capacity with fermentation time, (d) α-glucosidase inhibition capacity with fermentation time (OPPF: flour of compound medium of oat and purple potato; F-OPPF: fermented product. Values with different uppercase letters at the same extraction concentration indicate significant differences at p < 0.05 between treatments; values with different lowercase letters represent significant differences at p < 0.05 within the same treatment at different extraction concentrations or fermentation time points).
Fermentation 10 00618 g011
Figure 12. The adsorption capacities of insoluble dietary fiber in OPPF and F-OPPF: (a) sodium cholate adsorption, (b) cholesterol adsorption, (c) glucose adsorption, and (d) GDRI (GDRI: glucose dialysis retardation index. * p < 0.05 between treatments; ** p < 0.01 between treatments; values with different uppercase letters at the same adsorption/dialysis time point or glucose concentration indicate significant differences at p < 0.05 between treatments; and values with different lowercase letters represent significant differences at p < 0.05 within the same at different adsorption/dialysis time points or glucose concentrations).
Fermentation 10 00618 g012
Figure 13. Effect of F-OPPF on body weight (a), FBG (b), and GSP (c) in T2DM rats (FBG: fasting blood glucose; GSP: glycated serum protein; NC: normal control group; DC: diabetic control group; PC: positive control group; O: OPPF group; FL/FM/FH: low/medium/high-dose F-OPPF group. ## p < 0.01 between the diabetic control group and normal control group; ** p < 0.01 between the intervention groups and diabetic control group; and  p < 0.05, ∆∆ p < 0.01 between the fermented groups and OPPF group).
Fermentation 10 00618 g013
Figure 14. Effect of F-OPPF on OGTT and ITT in T2DM rats: (a) blood glucose levels during the OGTT; (b) the AUC in the OGTT; (c) descension rate of blood glucose during the ITT; (d) the AUC in the ITT (OGTT: oral glucose tolerance test; ITT: insulin tolerance test; AUC: area under the blood glucose curve; NC: normal control group; DC: diabetic control group; PC: positive control group; O: OPPF group; FL/FM/FH: low/medium/high-dose F-OPPF group. ## p < 0.01 between the diabetic control group and normal control group; ** p < 0.01 between the intervention groups and diabetic control group; and ∆∆ p < 0.01 between the fermented groups and OPPF group).
Fermentation 10 00618 g014
Figure 15. Effect of F-OPPF on TC (a), TG (b), HDL-C (c), and LDL-C (d) levels in T2DM rats (TC: total cholesterol; TG: total triglyceride; HDL-C: high-density lipoprotein cholesterol; LDL-C: low-density lipoprotein cholesterol; NC: normal control group; DC: diabetic control group; PC: positive control group; O: OPPF group; FL/FM/FH: low/medium/high-dose F-OPPF group. ## p < 0.01 between the diabetic control group and normal control group; * p < 0.05, ** p < 0.01 between the intervention groups and diabetic control group; and  p < 0.05 between the fermented groups and OPPF group).
Fermentation 10 00618 g015
Figure 16. Effect of F-OPPF on MDA levels (a), T-SOD (b), and GSH-Px (c) activities in T2DM rats (MDA: malondialdehyde; T-SOD: total superoxide dismutase; GSH-Px: glutathione peroxidase; NC: normal control group; DC: diabetic control group; PC: positive control group; O: OPPF group; FL/FM/FH: low/medium/high-dose F-OPPF group. ## p < 0.01 between the diabetic control group and normal control group; * p < 0.05, ** p < 0.01 between the intervention groups and diabetic control group; and  p < 0.05, ∆∆ p < 0.01 between the fermented groups and OPPF group).
Fermentation 10 00618 g016
Figure 17. Effect of F-OPPF on FINS level (a), HOMA-IR index (b), and ISI (c) in T2DM rats (FINS: fasting serum insulin; HOMA-IR: homeostasis model assessment of insulin resistance; ISI: insulin sensitivity index; NC: normal control group; DC: diabetic control group; PC: positive control group; O: OPPF group; FL/FM/FH: low/medium/high-dose F-OPPF group. ## p < 0.01 between the diabetic control group and normal control group; ** p < 0.01 between the intervention groups and diabetic control group; and  p < 0.05 between the fermented groups and OPPF group).
Fermentation 10 00618 g017
Figure 18. Effect of F-OPPF on the pathological morphology of pancreas in T2DM rats: (a) NC, (b) DC, (c) PC, (d) O, (e) FL, (f) FM, and (g) FH (NC: normal control group; DC: diabetic control group; PC: positive control group; O: OPPF group; and FL/FM/FH: low/medium/high-dose F-OPPF group).
Fermentation 10 00618 g018
Figure 19. Effect of F-OPPF on AST (a), ALT (b) activities, and liver glycogen content (c) in T2DM rats (AST: aspartate transaminase; ALT: alanine transaminase; NC: normal control group; DC: diabetic control group; PC: positive control group; O: OPPF group; FL/FM/FH: low/medium/high-dose F-OPPF group. ## p < 0.01 between the diabetic control group and normal control group; * p < 0.05, ** p < 0.01 between the intervention groups and diabetic control group; and  p < 0.05, ∆∆ p < 0.01 between the fermented groups and OPPF group).
Fermentation 10 00618 g019
Figure 20. Effect of F-OPPF on the pathological morphology of liver in T2DM rats: (a) NC, (b) DC, (c) PC, (d) O, (e) FL, (f) FM, and (g) FH (NC: normal control group; DC: diabetic control group; PC: positive control group; O: OPPF group; and FL/FM/FH: low/medium/high-dose F-OPPF group).
Fermentation 10 00618 g020
Figure 21. Effect of F-OPPF on BUN (a) and Scr (b) levels in T2DM rats (BUN: blood urea nitrogen; Scr: serum creatinine; NC: normal control group; DC: diabetic control group; PC: positive control group; O: OPPF group; FL/FM/FH: low/medium/high-dose F-OPPF group. ## p < 0.01 between the diabetic control group and normal control group; ** p < 0.01 between the intervention groups and diabetic control group; and ∆∆ p < 0.01 between the fermented groups and OPPF group).
Fermentation 10 00618 g021
Figure 22. Effect of F-OPPF on the pathological morphology of kidneys in T2DM rats: (a) NC, (b) DC, (c) PC, (d) O, (e) FL, (f) FM, and (g) FH (NC: normal control group; DC: diabetic control group; PC: positive control group; O: OPPF group; and FL/FM/FH: low/medium/high-dose F-OPPF group).
Fermentation 10 00618 g022
Table 1. Factors and levels in the response surface methodology for fermentation condition optimization of triterpene content.
LevelA—Temperature/(°C)B—Material Quantity/(g)C—Inoculum Size/%
−126308
0283510
1304012
Table 2. Three-factor, three-level Box–Behnken design and results.
RunsA—Temperature/°CB—Material Quantity/gC—Inoculum Size/%Triterpene Content
/(mg/g)
126301012.78 ± 0.78 ef
230301013.39 ± 0.47 bcde
326401014.05 ± 0.62 bc
430401013.04 ± 0.66 de
52635813.29 ± 1.01 bcde
63035811.81 ± 0.36 f
726351213.76 ± 1.04 bcde
830351213.84 ± 0.28 bcd
92830812.88 ± 0.38 de
102840813.17 ± 0.56 cde
1128301213.35 ± 0.34 bcde
1228401214.22 ± 0.73 b
1328351015.93 ± 0.67 a
1428351015.87 ± 0.58 a
1528351015.86 ± 0.54 a
1628351015.91 ± 0.58 a
1728351015.51 ± 0.42 a
Annotation: Results are expressed as means ± standard deviation (n = 3). Values with different lowercase letters in the same column indicate significant differences (p < 0.05).
Table 3. ANOVA for response surface quadratic model.
SourceSum of SquaresdfMean SquareF-Valuep-Value
Model26.7992.9855.93<0.0001
A-Temperature0.40510.4057.610.0282
B-Material Quantity0.540810.540810.160.0153
C-Inoculum Size2.0212.0237.950.0005
AB0.656110.656112.330.0098
AC0.608410.608411.430.0117
BC0.084110.08411.580.2491
A27.8517.85147.51<0.0001
B25.4315.43102.00<0.0001
C26.8516.85128.7<0.0001
Residual0.372670.0532
Lack of Fit0.252330.08412.80.173
Pure Error0.120340.0301
Cor Total27.1716
Table 4. Main nutritional composition contents of OPPF and F-OPPF (g/100 g DM).
SampleTotal StarchProteinFatSoluble ProteinTotal SugarCrude FiberAsh
OPPF76.03 ± 1.47 a10.90 ± 0.46 b5.28 ± 0.07 a8.31 ± 0.07 b68.59 ± 1.36 a1.73 ± 0.09 b1.71 ± 0.07 b
F-OPPF54.60 ± 1.05 b12.21 ± 0.35 a5.42 ± 0.05 a13.12 ± 0.12 a58.42 ± 1.06 b3.10 ± 0.06 a2.31 ± 0.11 a
Annotation: Results are expressed as means ± standard deviation (n = 3). OPPF: flour of compound medium of oat and purple potato; F-OPPF: fermented product. Values with different lowercase letters in the same column indicate significant differences (p < 0.05).
Table 5. Mineral element contents of OPPF and F-OPPF (mg/kg DM).
IndexOPPFF-OPPF
Na95.25 ± 0.08 b137.82 ± 0.14 a
Mg896.59 ± 0.08 b1323.90 ± 2.57 a
K5198.41 ± 47.34 a5163.30 ± 0.08 b
Ca294.56 ± 1.57 b458.11 ± 3.34 a
V0.01 ± 0.00 a0.01 ± 0.00 a
Mn25.69 ± 0.02 b40.23 ± 0.03 a
Fe74.03 ± 3.62 a53.59 ± 0.28 b
Cu3.04 ± 0.00 b4.23 ± 0.22 a
Zn12.28 ± 0.56 b16.67 ± 0.12 a
Se0.01 ± 0.00 b0.02 ± 0.01 a
Sr2.97 ± 0.01 b4.56 ± 0.04 a
Cr0.63 ± 0.06 b0.70 ± 0.03 a
Ni1.73 ± 0.06 a2.66 ± 0.29 a
As0.10 ± 0.00 a0.05 ± 0.03 a
Cd0.01 ± 0.00 a0.01 ± 0.00 a
Hg<0.00 ± 0.00 a<0.00 ± 0.00 a
Pb0.02 ± 0.00 a0.02 ± 0.00 a
Annotation: Results are expressed as means ± standard deviation (n = 3). OPPF: flour of compound medium of oat and purple potato; F-OPPF: fermented product. Values with different lowercase letters in the same row indicate significant differences (p < 0.05).
Table 6. Amino acid contents of OPPF and F-OPPF (mg/g DM).
IndexOPPFF-OPPF
Thr0.40 ± 0.03 b0.45 ± 0.03 a
Val0.56 ± 0.04 b0.56 ± 0.08 a
Ile0.45 ± 0.03 b0.46 ± 0.03 a
Met0.04 ± 0.01 b0.15 ± 0.02 a
Leu0.80 ± 0.06 a0.77 ± 0.04 b
Lys0.43 ± 0.03 a0.37 ± 0.03 a
Phe0.61 ± 0.04 a0.56 ± 0.04 b
Tyr0.34 ± 0.03 b0.36 ± 0.03 a
Asp0.95 ± 0.05 b0.98 ± 0.06 a
Ser0.53 ± 0.03 b0.56 ± 0.03 a
Glu2.11 ± 0.08 a1.69 ± 0.08 a
Gly0.51 ± 0.04 a0.55 ± 0.03 a
Ala0.52 ± 0.02 b0.54 ± 0.02 a
His0.26 ± 0.03 b0.26 ± 0.03 a
Arg0.67 ± 0.03 b0.67 ± 0.04 a
Pro0.52 ± 0.05 b0.53 ± 0.05 a
Annotation: Results are expressed as means ± standard deviation (n = 3). OPPF: flour of compound medium of oat and purple potato; F-OPPF: fermented product. Values with different lowercase letters in the same row indicate significant differences (p < 0.05).
Disclaimer/Publisher’s Note: The statements, opinions and data contained in all publications are solely those of the individual author(s) and contributor(s) and not of MDPI and/or the editor(s). MDPI and/or the editor(s) disclaim responsibility for any injury to people or property resulting from any ideas, methods, instructions or products referred to in the content.