1. Introduction
Bread is the most consumed food in the world and is therefore an important product for nutritional improvement [
1]. The oldest bread in the world is flatbread, a traditional staple food from the Mediterranean region [
2]. The production of flatbread, having its roots in traditional methods, has now moved to mechanical industrial processes. Flatbreads are categorized as a single- and double-layered, whereby single-layered flatbreads can be leavened or unleavened [
3]. In the Mediterranean region, the most common are single-layered flatbreads (77%) made of refined wheat flour leavened with baker’s yeast [
2] that can be additionally garnished. Flatbread production includes steps such as kneading, optional dough proofing, shaping, and baking [
4]. Flatbread products are characterized by a low dietary fiber (DF) content, due to the fact that refined wheat flour is the main ingredient [
5]. Oat, barley, millet, rye, sorghum, or legume flour have been used as enriching ingredients to increase the protein, mineral, and DF content of wheat-based flatbreads [
6,
7,
8,
9,
10,
11]. By using different enriching ingredients and breadmaking processes, flatbreads with increased nutritional value and tailored to specific diets can be produced, while preserving their overall quality [
6].
Alternative cereals, such as oats and barley, possess several valuable properties that meet the requirements for functional diet components. Oat and barley flour, but also bran as a by-product of flour milling, are a good source of DF, especially soluble ones such as mixed-linkage (1 → 3), (1 → 4)-β-D-glucans. The consumption of β-glucans has been associated with a reduction in diabetes symptoms, the ability to lower plasma cholesterol, the improvement of lipid metabolism and a reduction in colon cancer risk [
12,
13]. Although barley flour was traditionally used in breadmaking, its usage declined over time. Several studies addressed the challenge of using barley or oat flour in making flatbread. Wheat flour was supplemented with barley flour at levels of 15, 30, 45 and 60% (flour weight) in the development of Balzama flatbreads with a high β-glucan content and a relatively low glycemic index [
14]. The replacement of 50% wheat flour with barley flour also significantly lowered the glycemic index of roti flatbread [
15]. To improve the quality and nutritional value of barbari bread, barley flour was used together with wholewheat flour in a 1:1 ratio [
16]. The use of oat flour at 25 and 50% to wheat flour was tested in chapatti flatbread, which increased the content of bioactive compounds [
17]. The use of bran, as a by-product of the milling industry, could additionally play an important role in the environmental sustainability of flatbread production.
The fermentation process used influences the overall quality of the bread. In the modern bakery industry, sourdough is used not only as an alternative to baker’s yeast, but also to reduce the need for additives, improve sensory properties, nutritional value, and prolong the shelf-life of bread [
18,
19]. Sourdough can be spontaneously fermented by naturally present microorganisms (type I) or with added lactic acid bacteria (LAB) and yeast (type II sourdough) [
20]. The interaction between flour and inoculated LAB has the greatest influence on achieving the desired nutritional and technological properties of bread [
21]. The sourdough fermentation of wholegrain flour or bran under suitable hydration conditions successfully increases the bioavailability of minerals, protein digestibility [
18], and the solubilization of DF [
22]. Wholegrain and bran contain a high amount of phytic acid (PA), an antinutrient which impairs mineral bioavailability by forming insoluble complexes with iron, magnesium, zinc, and calcium cations [
18]. Prolonged fermentation enables the degradation of most of the PA, which is due to the microbial phytase activity, but also due to the endogenous cereal enzyme activated at lower pH values [
16,
23]. Pejcz et al. [
13] fermented wholegrain barley flour with LV1 starter (0.5%), dough yield (DY) 200, at 30 °C for 18 h, aiming to enrich wheat bread with dietary fiber, mainly β-glucans. With the same aim, Rieder et al. [
22] used sourdough obtained from barley flour and oat bran fermented with
L. plantarum at 30 °C for 18 h. Whereas the acidification of barley flour was found to be mostly successful, it was inadequately characterized in the case of oat flour or bran. To our knowledge, the influence of bran addition on the acidification kinetics of oat and barley flour has not been investigated. Hence, this paper presents a comparative study of the sourdough fermentation of the two most important β-glucan sources among cereals, oats and barley.
A retarded dough method is generally used to improve the flavor of sourdough bread [
24]. Retarded dough stored between 0 and 10 °C for up to 14–24 h results in better-tasting products with a pleasant, slightly sour flavor, a light chewy crumb, and a thick, brown crust [
24]. Further on, the retardation method was introduced to extend the shelf-life of the dough and perform the baking on demand [
7]. However, due to a large surface area, retarded flat doughs are more prone to enzymatic browning, which eventually affects the consumer’s acceptance of the final product [
25]. This browning is caused by the action of polyphenol oxidase (PPO) and peroxidase enzymes that are mainly concentrated in the bran fractions and catalyze the oxidation of free and reduced phenolic compounds to quinones, which interact and form brown pigments. Therefore, bran-containing dough is more susceptible to enzymatic browning [
26].
Additives, such as ascorbic and citric acid, L-cysteine, and 4-hexylresorcinol, which is a competitive enzyme inhibitor, were tested as anti-browning agents, as well as heat and microwave treatment [
25,
27]. Discoloration of barley-based dough can be controlled by heat treatment, with oxygen exclusion, by lowering the phenolics content or PPO activity, and by using enzyme inhibitors [
25,
27]. A combination of chemicals and microwaves can slow down changes in the lightness of barley dough during 96 h of retardation for multigrain Indian flatbread [
25,
27]. However, on the market, there is a strong trend of breads enriched with bioactive compounds and clean label breads without additives. The use of sourdough as a natural improver in a retarded dough and its potential to inhibit enzymatic browning in the making of healthier flatbreads has not yet been well addressed.
Thus, the aim of this study was to investigate the acidification kinetics of the sourdough fermentation of oat and barley flour with or without adding bran using a commercial starter. We hypothesized that the addition of bran will improve the acidification kinetics of oat and barley sourdough and that the addition of sourdough will slow down the browning of the dough during retardation and additionally reduce the phytates content. Hence, the influence of sourdough type II on the nutritive value and quality of single-layered flatbread made using the no-time method, and retarded dough method (24 and 48 h) was investigated at two addition levels (30 and 50% dough weight).
2. Materials and Methods
2.1. Ingredients
The semi-refined wheat flour (Čakovečki mlinovi Inc., Čakovec, Croatia) contained 11.0% protein, 11.9% moisture, and 2.3% fat. Its amylolytic activity was 1640 Brabender units (BU). The oat flour (Granolio Inc., Zagreb, Croatia) contained 12.4% protein, 11.5% moisture, and 7.9% fat. The barley flour (Ivan Varga family-run farm, Orehovica, Croatia) contained 11.2% protein, 12.4% moisture, and 1.8% fat. The oat bran (Eko-Jazo Ltd., Ivanovac, Croatia) and barley bran (Ivan Varga family-run farm, Orehovica, Croatia) contained 19.9 and 11.0% protein, 11.4 and 12.2% moisture, and 4.7 and 1.3% fat, respectively, as reported previously by Grgić et al. [
28].
The particle geometric mean diameter was determined according to the ICC standard 207 by sieving at the mesh apertures of 670, 355, 282, 225, 180 and 125 µm [
28], and was 231 µm for oat flour, 295 µm for barley flour, 531 µm for oat bran and 514 µm for barley bran.
A commercial freeze-dried starter LIVENDO LV1® (Lesaffre, France) was used to prepare the sourdough.
2.2. Chemical Analyses of Flour/Bran and Flatbread
The dry weight (d.w.) content of the flour and bran was determined in duplicate according to AOAC method 925.10 [
29], whereas for the flatbread, AACC method 44-15.02 [
30] was followed.
The total dietary fiber was determined in duplicate according to AOAC method 2011.25 using the Total Dietary Fibre Assay Kit (Megazyme, Bray, Ireland).
The concentrations of minerals in the oat, barley flour, and bran were determined using atomic absorption spectrometry (AAS). Ashing of a well-homogenized sample (5 g) was performed in a muffle furnace (KR-170, Heraeus, Hanau, Germany) at 550 °C according to AOAC method 923.03 [
29]. After cooling to room temperature, the ash was weighed. Then, it was dissolved during heating with 5 mL of 5 M nitric acid, and quantitatively transferred to a 25 mL volumetric flask with deionized water. The sample solutions were further diluted to ensure that the concentration of each analyte was within the linear range of the method. Lanthanum (III)-chloride (1%,
v/
v) was added to the diluted solutions, standards, and to blank samples to avoid interference of the phosphates with magnesium. The atomic absorption spectrometer (Perkin Elmer 2380; Norwalk, CT, USA) was set to an acetylene flow of 2.2 L/min and an air flow of 14.5 L/min. The calibration curves were prepared for each analyte using standard solutions (Supelco, Darmstadt, Germany) at five concentration levels and the measurement was performed in at least five consecutive replicates at the following wavelengths: 324.7 nm for Cu, 248.3 nm for Fe, 213.9 nm for Zn, and 285.2 nm for Mg.
The activity of α-amylase was determined spectrophotometrically following the α-amylase SD method (K-AMYLSD 04/19, Megazyme, Bray, Ireland) and the manufacturer’s instructions.
Polyphenol oxidase (PPO) activity was assessed in accordance with the AACC 22-85.01 method [
30] with a slight modification [
31]. Sample (50 mg) was vortexed with a 10 mM solution of L-DOPA in a 50 mM MOPS buffer (1.5 mL) at 1.000 rpm for 15 min. After centrifugation at 14.800 rpm for 5 min, the resulting supernatant was used for spectrophotometric measurement at 475 nm. The PPO activity was calculated as the difference in the absorbance of sample and blank and expressed as Δ475/g sample.
The β-glucan content in flatbread was determined according to AOAC Method 995.16 and AACC Method 32-23 [
30], using the Mixed-linkage β-glucan Assay Kit (Megazyme, Bray, Ireland). Phytic acid content was determined spectrophotometrically at 655 nm using the Phytic Acid Assay Kit (K-PHYT 05/19) following the manufacturer’s instructions (Megazyme, Bray, Ireland).
All spectrophotometric analyses were performed in duplicates using the spectrophotometer PerkinElmer Lambda 35 UV/Vis (Waltham, MA, USA).
2.3. Sourdough Fermentation and Characterization
Sourdough was prepared using flour only or a blend of flour and bran. The amount of the bran ratio added to flour for sourdough fermentation was determined in the preliminary experiment. In the bran-including fermentations, oat or barley flour was mixed with the bran in a ratio of 3:1. To obtain DY 300, 240 g of sterile tap water was added to 120 g of floury material. The starter LIVENDO LV1® was added at 0.5 g/100 g of the floury material, and the dough was mixed for 5 min. The sourdough was fermented in sealed jars in a thermostat (INB 500, Memmert, Schwabach, Germany) at 30 °C for 15–24 h.
Measurement of pH, Total Titratable Acidity and Viable Cell Counts in Sourdough
The pH value during sourdough fermentation was recorded every 5 min during 24 h of fermentation using a PH-230SD pH meter equipped with a data logger (Lutron Electronic Enterprise Co., Ltd., Taipei City, Taiwan).
The total titratable acidity (TTA) of the sourdough (10 g) was determined after suspending it in distilled water (90 mL) by titration with 0.1 M NaOH to a final pH of 8.5 [
32]. The TTA is expressed as the average volume (mL) of NaOH consumed for two replicate titrations.
The organic acids were determined according to the method of Lefebvre et al. [
33] with slight modifications. Ten grams of sourdough were suspended in distilled water on a magnetic stirrer for 30 min and diluted to 50 mL in a flask. After centrifugation (Rottina, Hettich, Kirchlengern, Germany) at 13.081 rpm for 5 min, the supernatant (5 mL) was transferred to a test tube. Carrez-I solution (1 mL) and Carrez-II solution (1 mL) were added, after which the sample was centrifuged at 4000 rpm for 5 min. A filtered supernatant was used for determination of the organic acids content in duplicate using the D-lactic acid and L-lactic acid Assay Kit (K-DLATE 08/18) and Acetic acid Assay Kit (K-ACETRM 04/20) (Megazyme, Bray, Ireland). A molar ratio between the lactic acid and acetic acid represents the fermentation quotient (FQ).
The number of viable cells in the sourdough at the end of fermentation was determined according to ISO 7954:2002 [
34] for yeasts (
Saccharomyces spp.) and ISO 15214:98 [
35] for LAB (
Lactobacillus spp.). Three decimal dilutions were analyzed in two replicates. The results are expressed as colony-forming units (CFU) per g of sourdough.
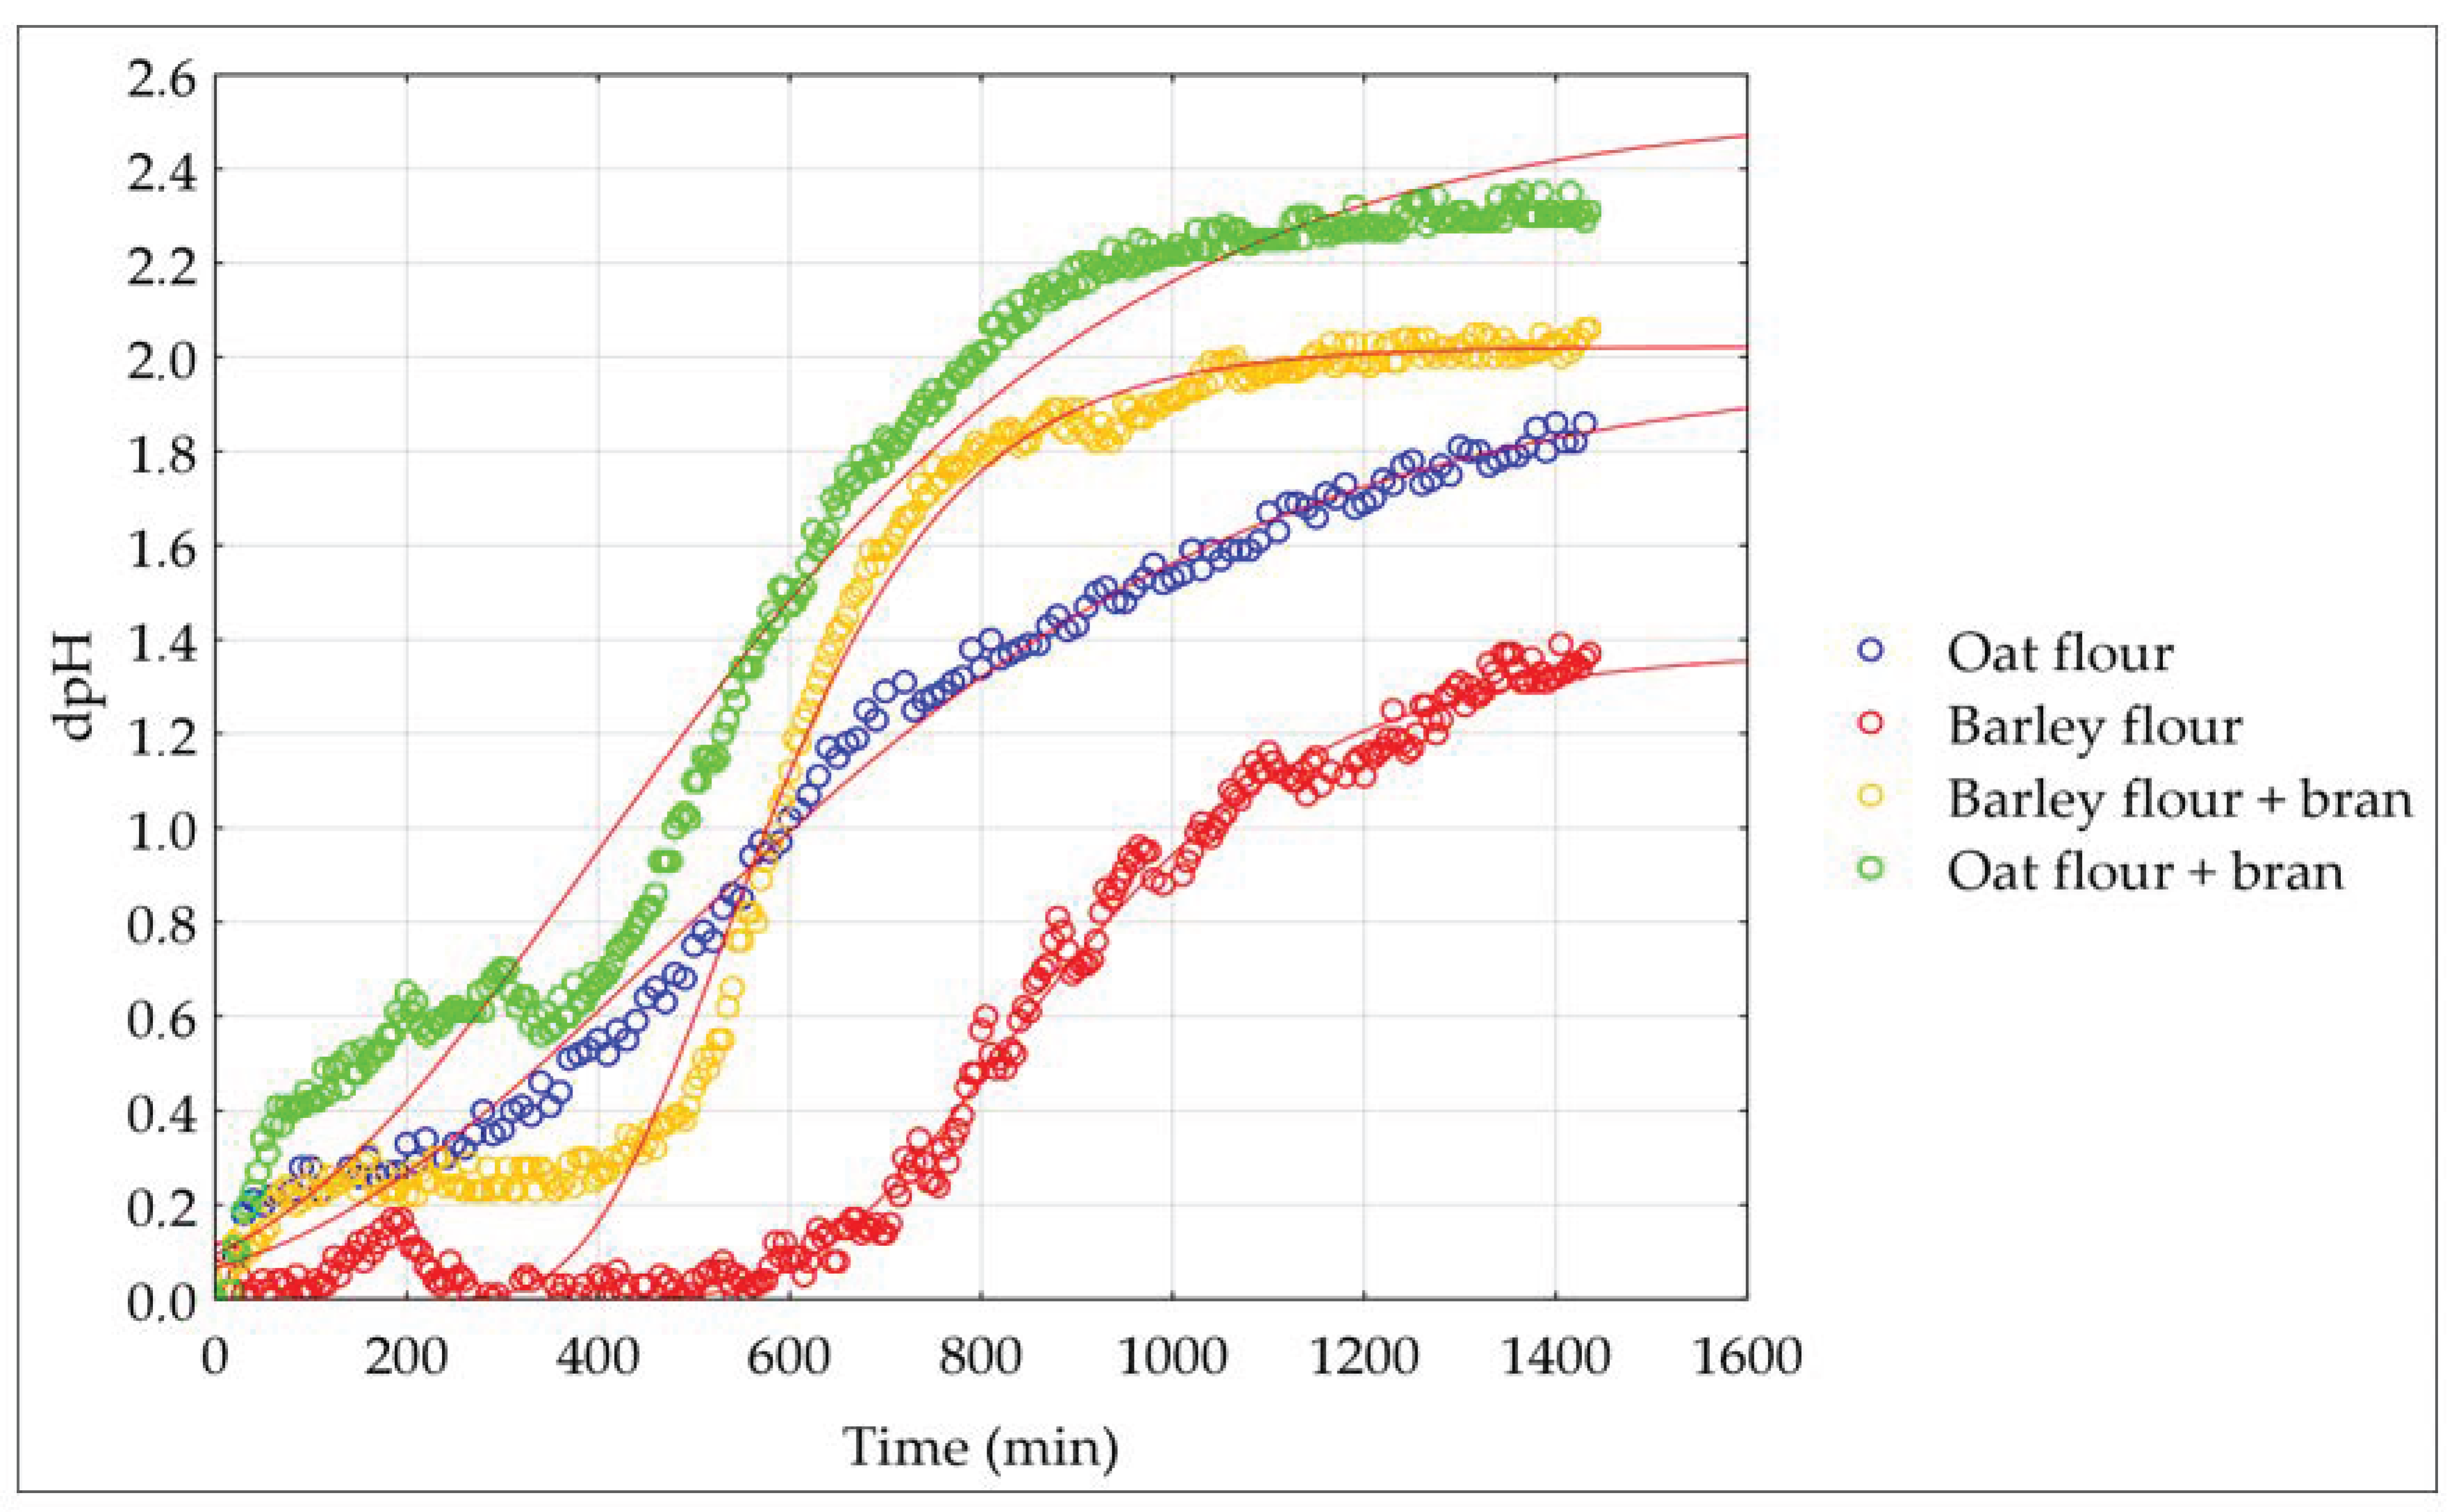
2.4. Modelling of Sourdough Fermentation Kinetics
Acidification data (difference in pH value) were modelled according to the Gompertz equation as modified by Zwietering et al. [
36]:
where y is log (dpH dt
−1, units of pH min
−1); k is the initial level of the dependent variable; A (ΔpH) is the difference in pH (units) between the initial value and the value reached in the stationary phase of the sourdough fermentation; µ
max is the maximum acidification rate,
is the length of the latency phase expressed in minutes, and t is the time.
2.5. Experimental Design
After establishing the more desirable type of milling product (flour and bran) for sourdough fermentation, the application of sourdough in flatbread was investigated. Based on the results of selected properties of flatbreads, dough retardation lasting 24 h was further compared with a no-time process. A two-level full factorial design of the experiment involved three independent variables, i.e., substrate type, sourdough level, and retardation time (
Table 1). The measured responses were specific volume, baking loss, spread ratio, crumb hardness, cohesiveness, resilience, crust and crumb color, PA, and β-glucans content.
2.6. Breadmaking
A single-layered Croatian type of flatbread (‘Pogača’) was made using a no-time and retarded dough method. Four different types of control breads without sourdough and matching four types of breads with sourdough were prepared. Three pieces of each type of bread were baked either after a no-time (0 h) process or dough retardation (24 or 48 h) process. The sourdough, fermented for 15 h from a blend of oat or barley flour and bran, was used in the breadmaking within 1 h of storage in a refrigerator.
In the controls, 18 or 30% (w/w) of oat or barley flour/bran blend replaced wheat flour, while in the sourbreads, 30 or 50% of oat or barley sourdough was added at dough weight, respectively, which corresponded to the substituted flour weight in the controls. The other ingredients were semi-refined wheat flour (69.6 and 81.8%, respectively), water in an amount adjusted to 200 BU (82–88.5%, total flour), instant baker’s yeast (0.8%), oil (4%) and salt (2%). Water in the sourdough was taken into account so that the total amount of water in the controls and sourbreads was the same. The dough was mixed in a spiral mixer (Diosna SP12, Osnabrück, Germany). First flour was mixed with water for 2 min at 90 rpm, then yeast and salt were added, and fast mixing was continued for 5 min at 120 rpm. In the third minute, oil was added. After the bulk fermentation (28 °C, relative humidity 75%, 20 min), dough was divided into round balls (450 g) and placed in metal pans (20 cm diameter). Dough was subjected to retardation at a temperature 2 ± 2 °C, up to 48 h or to direct proofing at 28 °C, and relative humidity 75% for 1 h (Wiesheu, Affalterbach, Germany). Breads were baked in triplicates at 240 °C for 30 min with 0.21 mL cm−2 of steam in a deck oven (Wiesheu, Affalterbach, Germany). After cooling for 1.5 h at room temperature (20–22 °C) and 50–60% relative humidity, the breads were used for the subsequent measurements.
2.7. Evaluation of Dough and Bread Physical Properties
The pH of the bread dough was measured (in duplicates) at room temperature using the pH meter Testo 206 (Testo, Berlin, Germany).
Dough weight loss (in triplicates) was calculated by measuring the weight of the dough before and after retardation according to the Equation below (2):
where
m1 is the weight of dough before retardation and
m2 is the weight after retardation (tempered at room temperature).
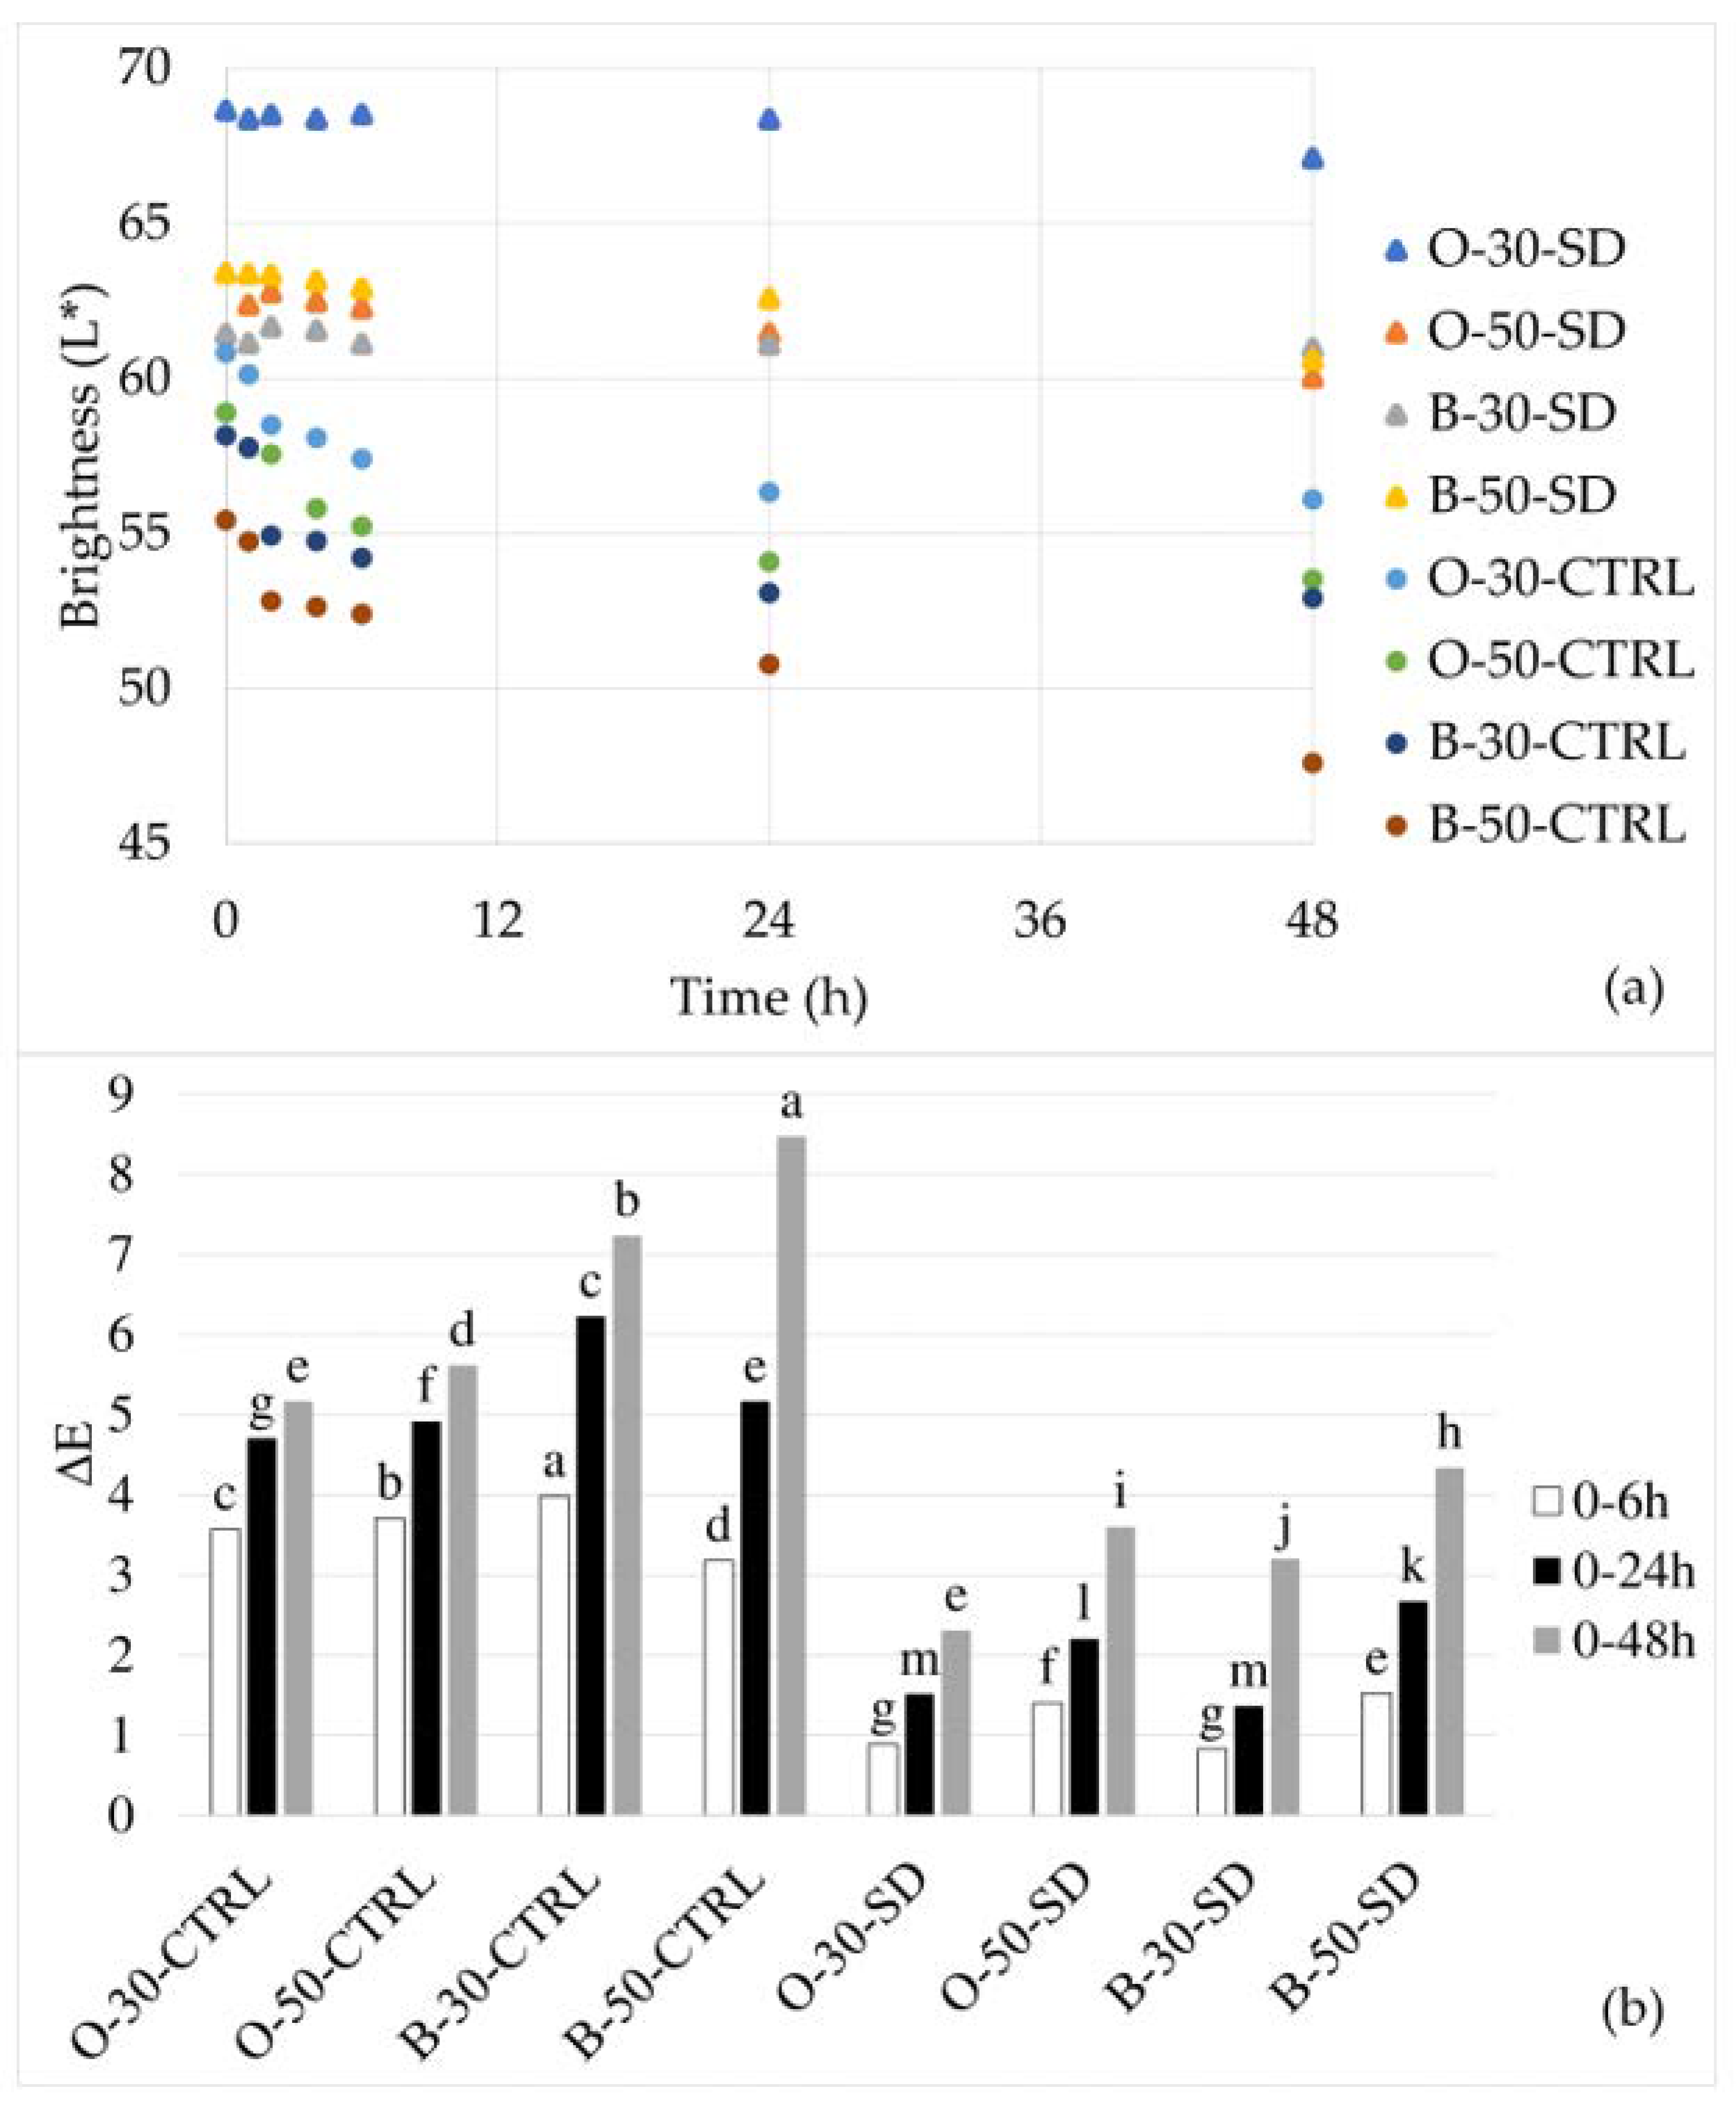
The color of the dough during 0, 1, 2, 4, 6, 24 and 48 h of retardation was measured in triplicates, whereas the color of crumb and upper crust of bread baked after 0 and 24 h of retardation was measured at six points. All measurements were performed with a colorimeter (CM-700d, Konica Minolta, Osaka, Japan). In addition to the
L* value, which expresses the brightness or whiteness of a sample with 0 as black and 100 as pure white, redness (
a*) and yellowness (
b*) were measured. The total color difference (TCD) before and after dough retardation was calculated using Equation (3):
Baking loss was calculated from the weight (in triplicates) of the dough before proofing and the bread after baking and 1 h of cooling at room temperature, according to Equation (4):
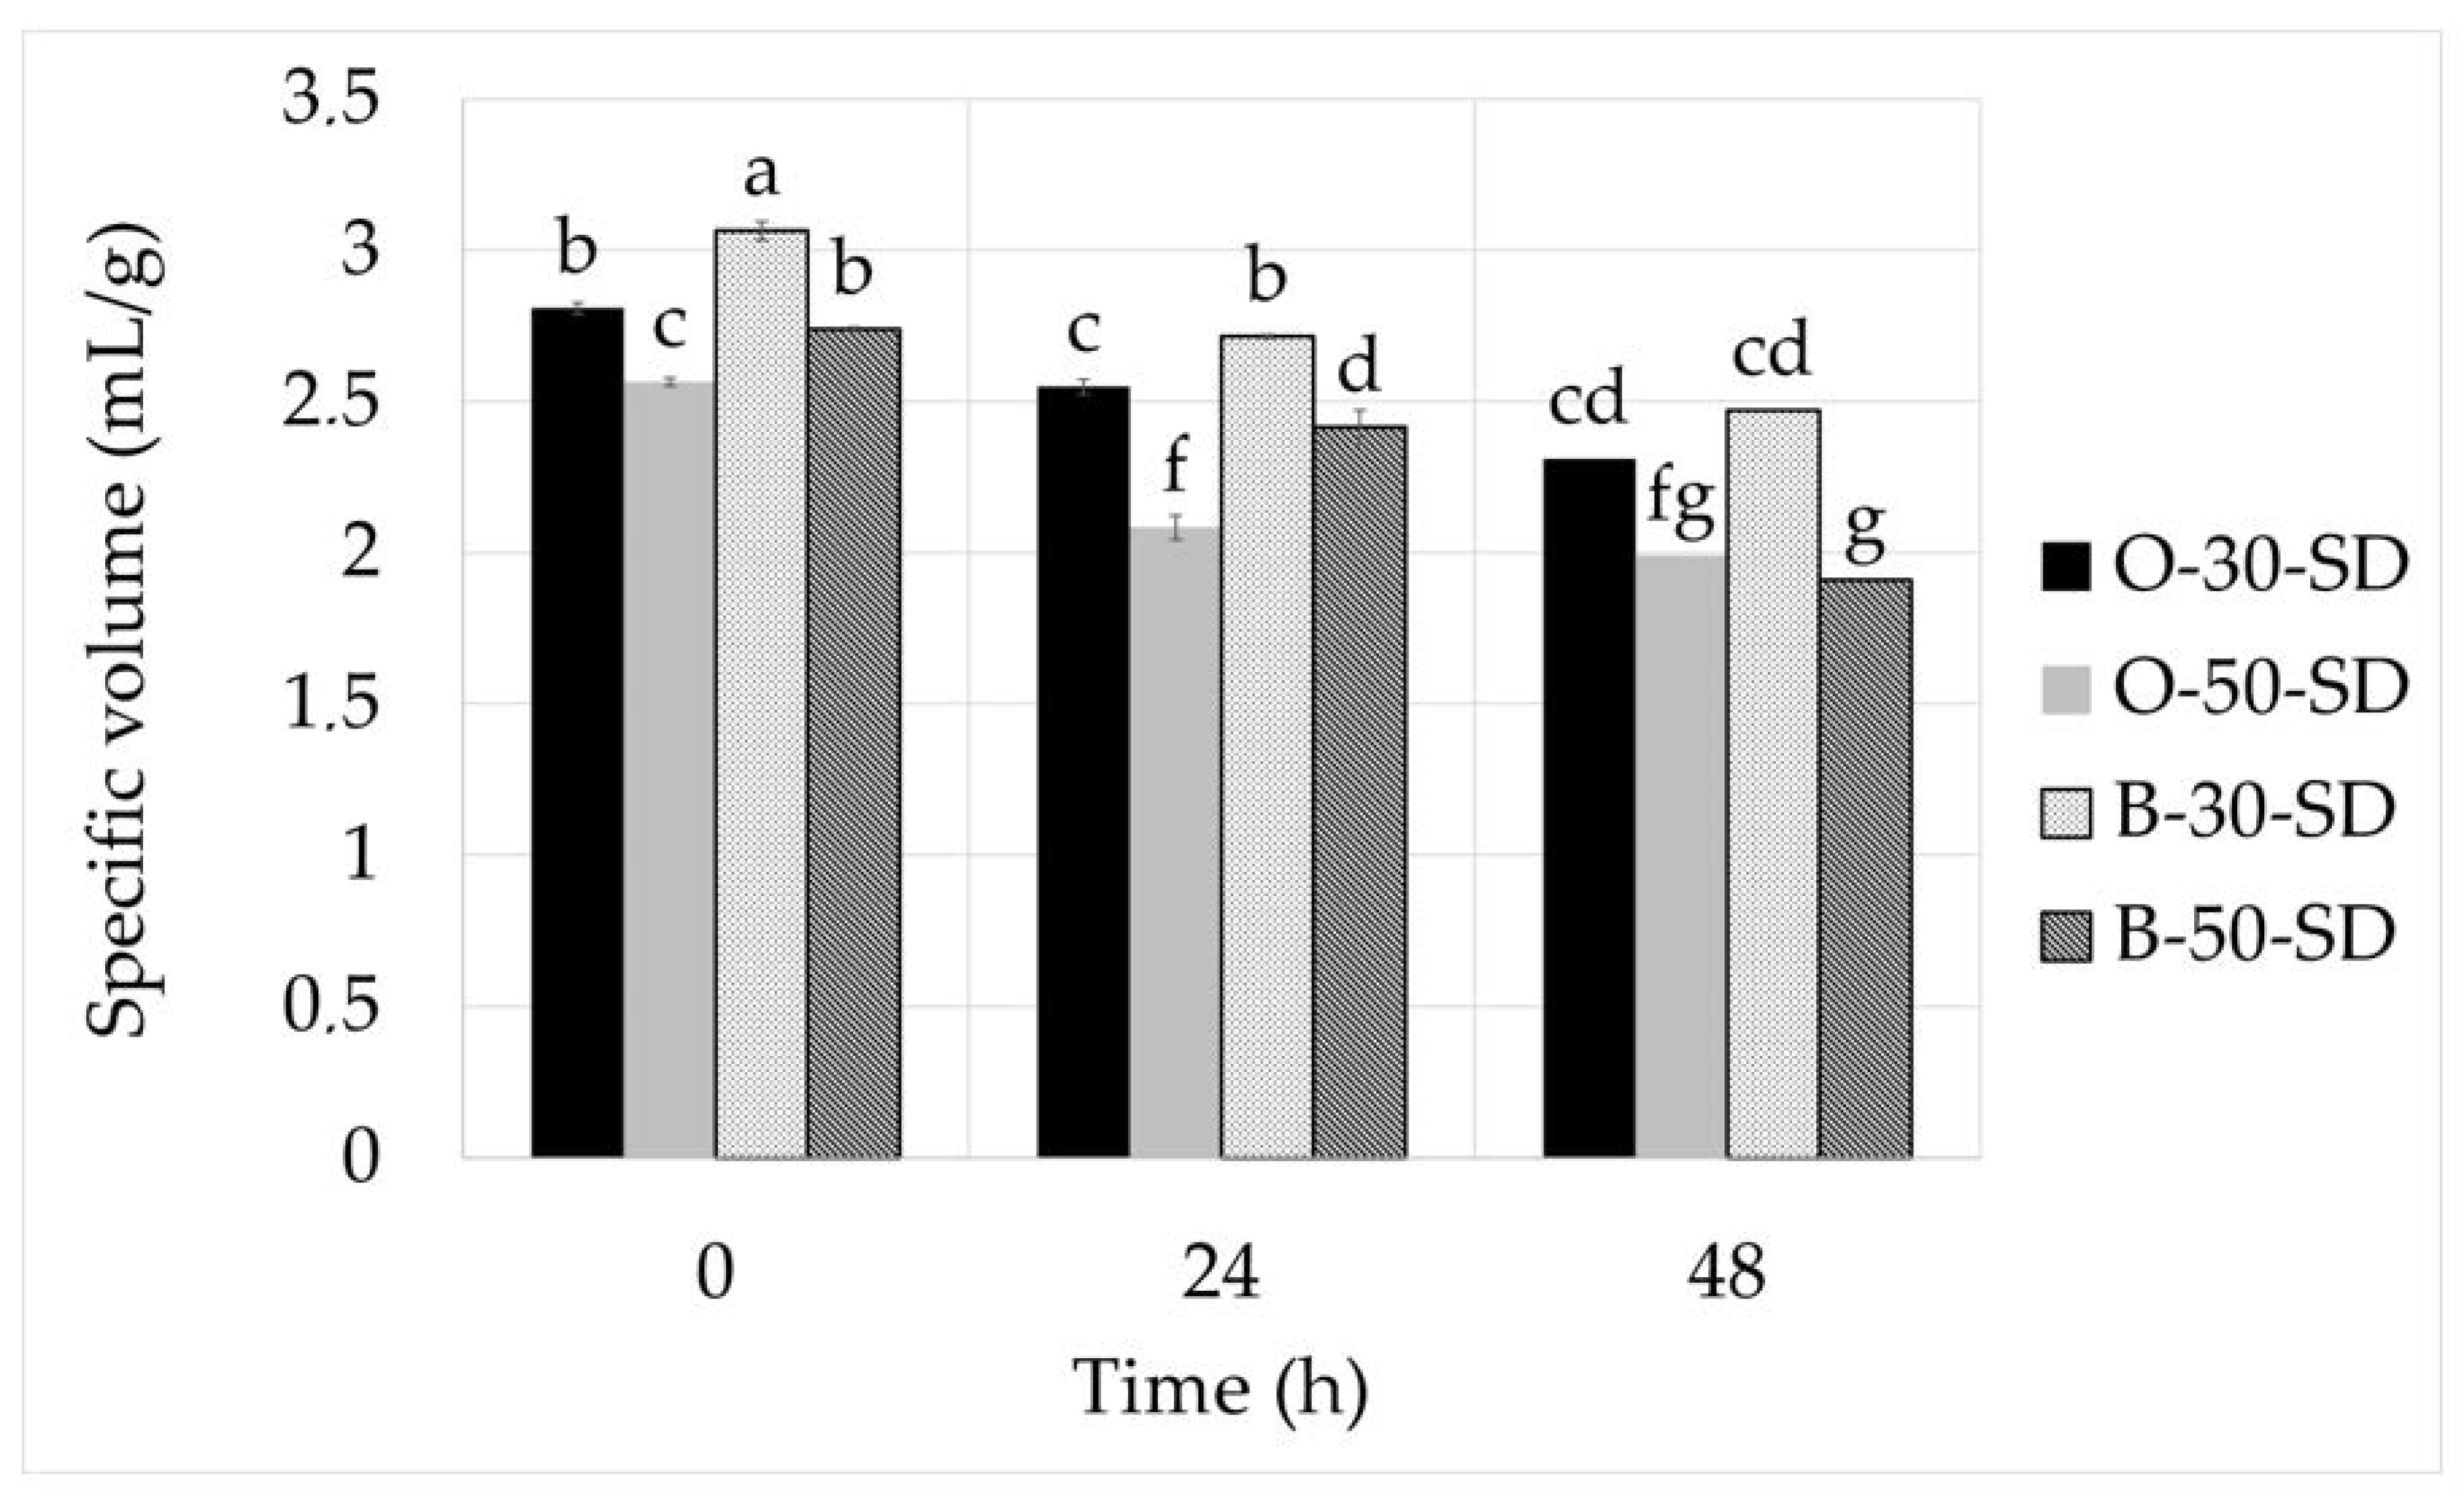
The volume of the bread was determined in triplicates according to AACC 10-05.01 method (AACC International, 2010) [
30]. The specific volume was calculated as a ratio of volume to weight.
The width (at 2 points) and height (at 4 points) of the triplicate breads were measured with a caliper and the spread was calculated as their ratio.
The texture profile of the crumb was determined using a TA1 texture analyzer (Ametek Llyod Instruments Ltd., West Sussex, UK) with an aluminum probe of a diameter of 55 mm [
37]. Immediately before the analysis, the crumb, with a thickness of 12.5 mm, was cut into 36 mm diameter pieces, and two pieces were stacked together. The double-compression test was performed in six replicates under the following conditions: probe speed before, during and after the test 2 mm/s, trigger force 5 N, strain 50%, and pause duration 30 s. The results processed using the program Nexygen PLUS 3 Software (Ametek Lloyd Instruments Ltd., West Sussex, UK) are expressed as hardness, cohesiveness, and the resilience of the crumb.
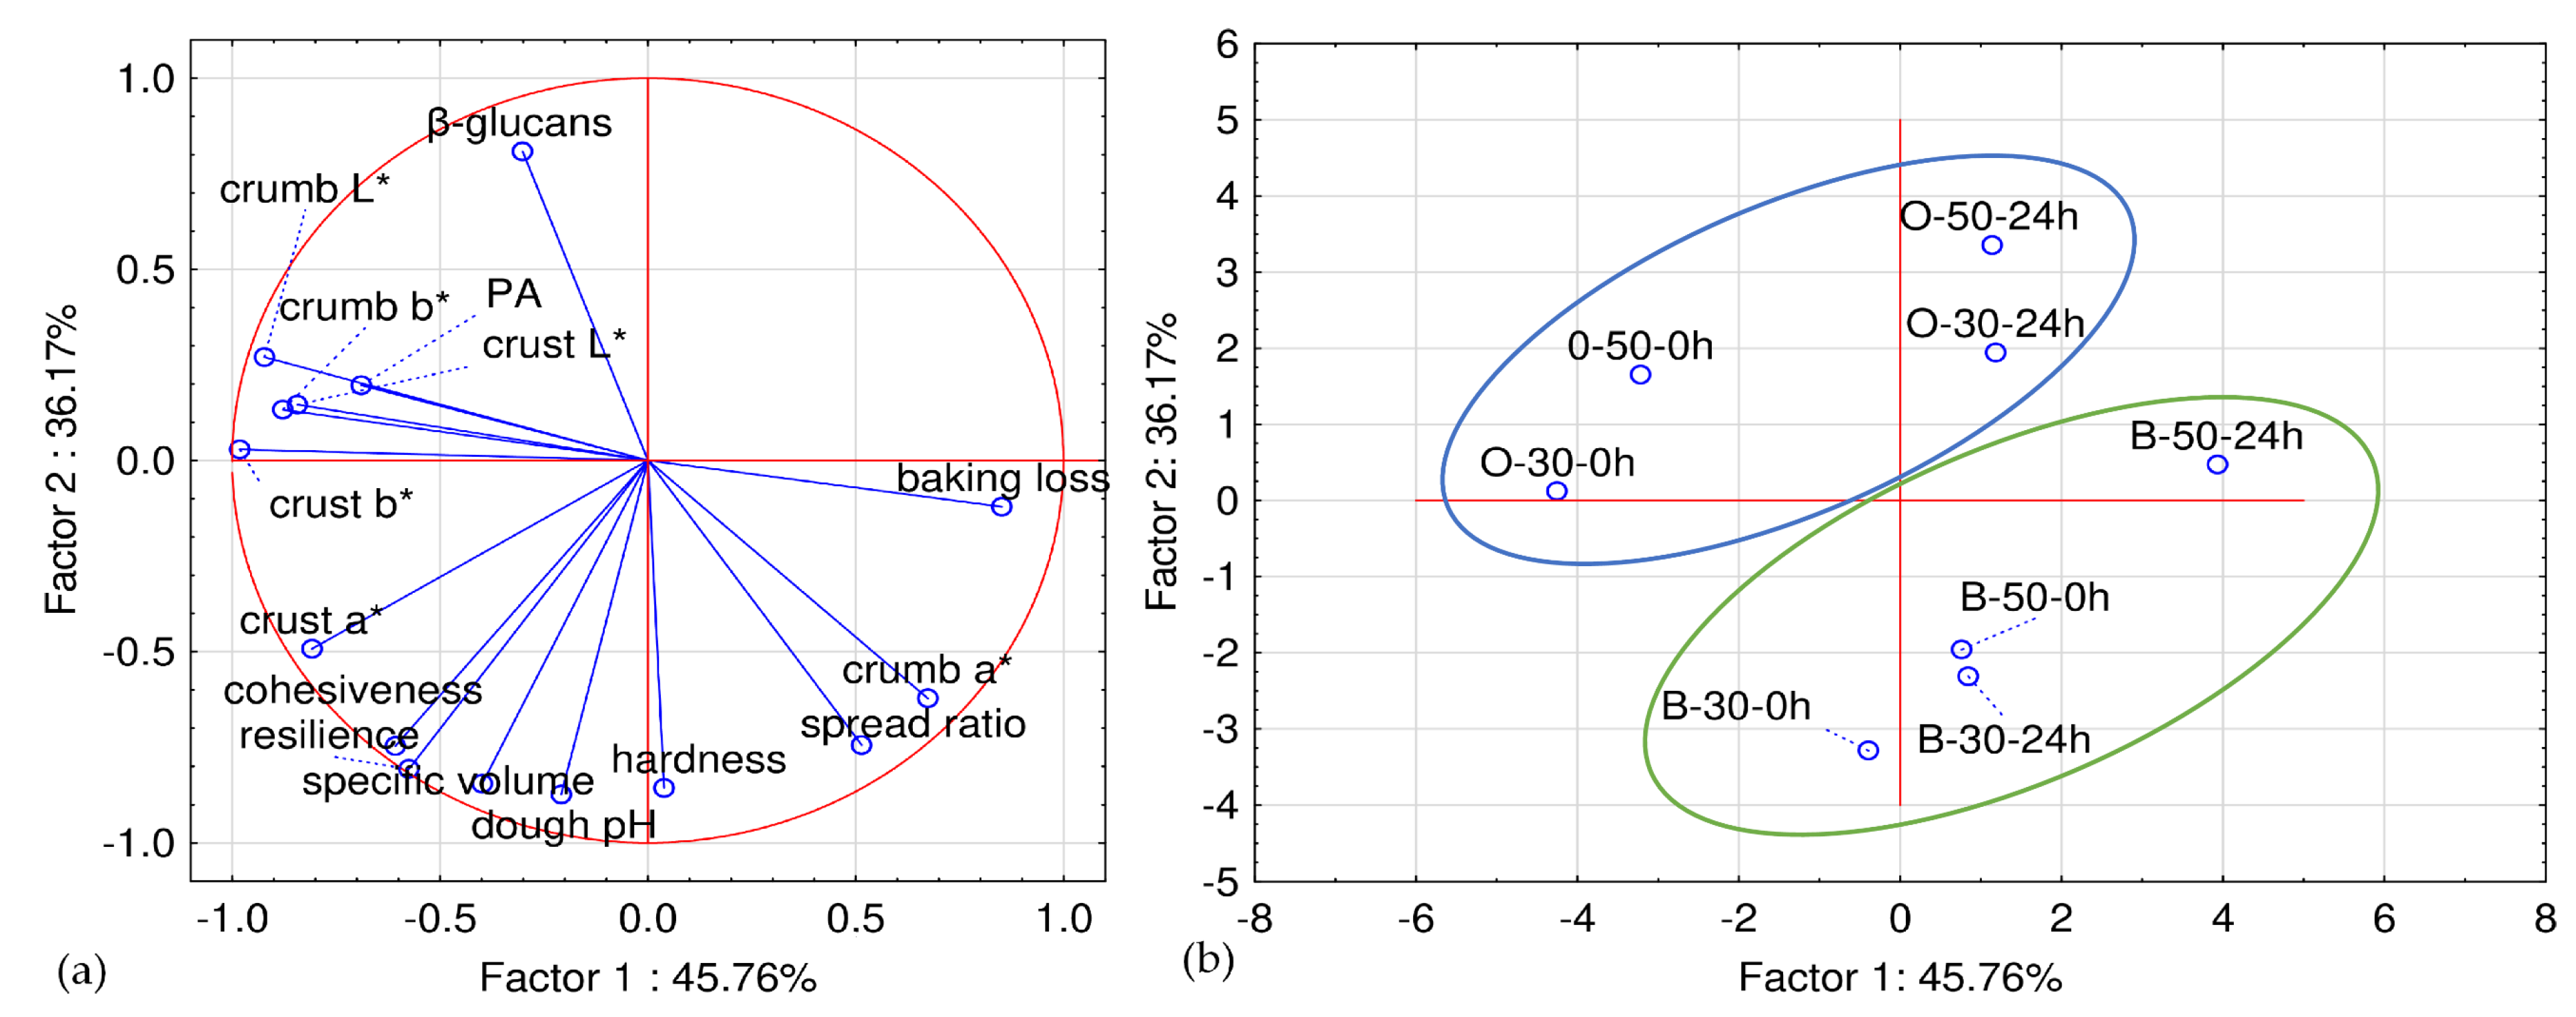
2.8. Statistical Analyses
To determine the influence of flour type, sourdough level, and retardation time on flatbread physical and nutritive properties, recorded data were subjected to factorial analysis of variance (ANOVA). The Tukey test for honest significant differences was used to assess differences between means. ANOVA, Tukey’s post hoc test, Pearson’s correlation test, and principal component analysis (PCA) were considered statistically significant when p < 0.05. Analyses were carried out with Statistica 14.1.0 (TIBCO Software Inc., Palo Alto, CA, USA).


