1. Introduction
Hydroxytyrosol (HT), 3,4-dihydroxyphenylethanol, is present in certain foods, such as olives and olive oil, in an average amount of 629.1 mg kg
−1 and 5.2 mg kg
−1, respectively [
1]. Its concentration in wine has also been reported at levels between 0.5 and 9.6 mg L
−1 [
1]. As a result, it is present in the Mediterranean diet. Recently, these authors have estimated the dietary intake of free HT in the European adult population at 0.13–6.82 mg day
−1, with table olives and wine being the main contributors [
1].
At the same time, the occurrence of HT in wines has been associated with yeast synthesis [
2]. At least to some extent, the presence of HT in wine is a consequence of the hydroxylation of tyrosol, which in turn is produced during alcoholic fermentation (AF) through the Ehrlich pathway (a catabolic pathway leading to the formation of higher alcohols from amino acids) by yeast [
3]. Thus, its synthesis includes the transamination of tyrosine, decarboxylation of p-hydroxyphenylpyruvate by pyruvate decarboxylase, reduction of p-hydroxyphenylaldehyde by alcohol dehydrogenase to the immediate precursor tyrosol, and, subsequently, hydroxylation to HT [
4].
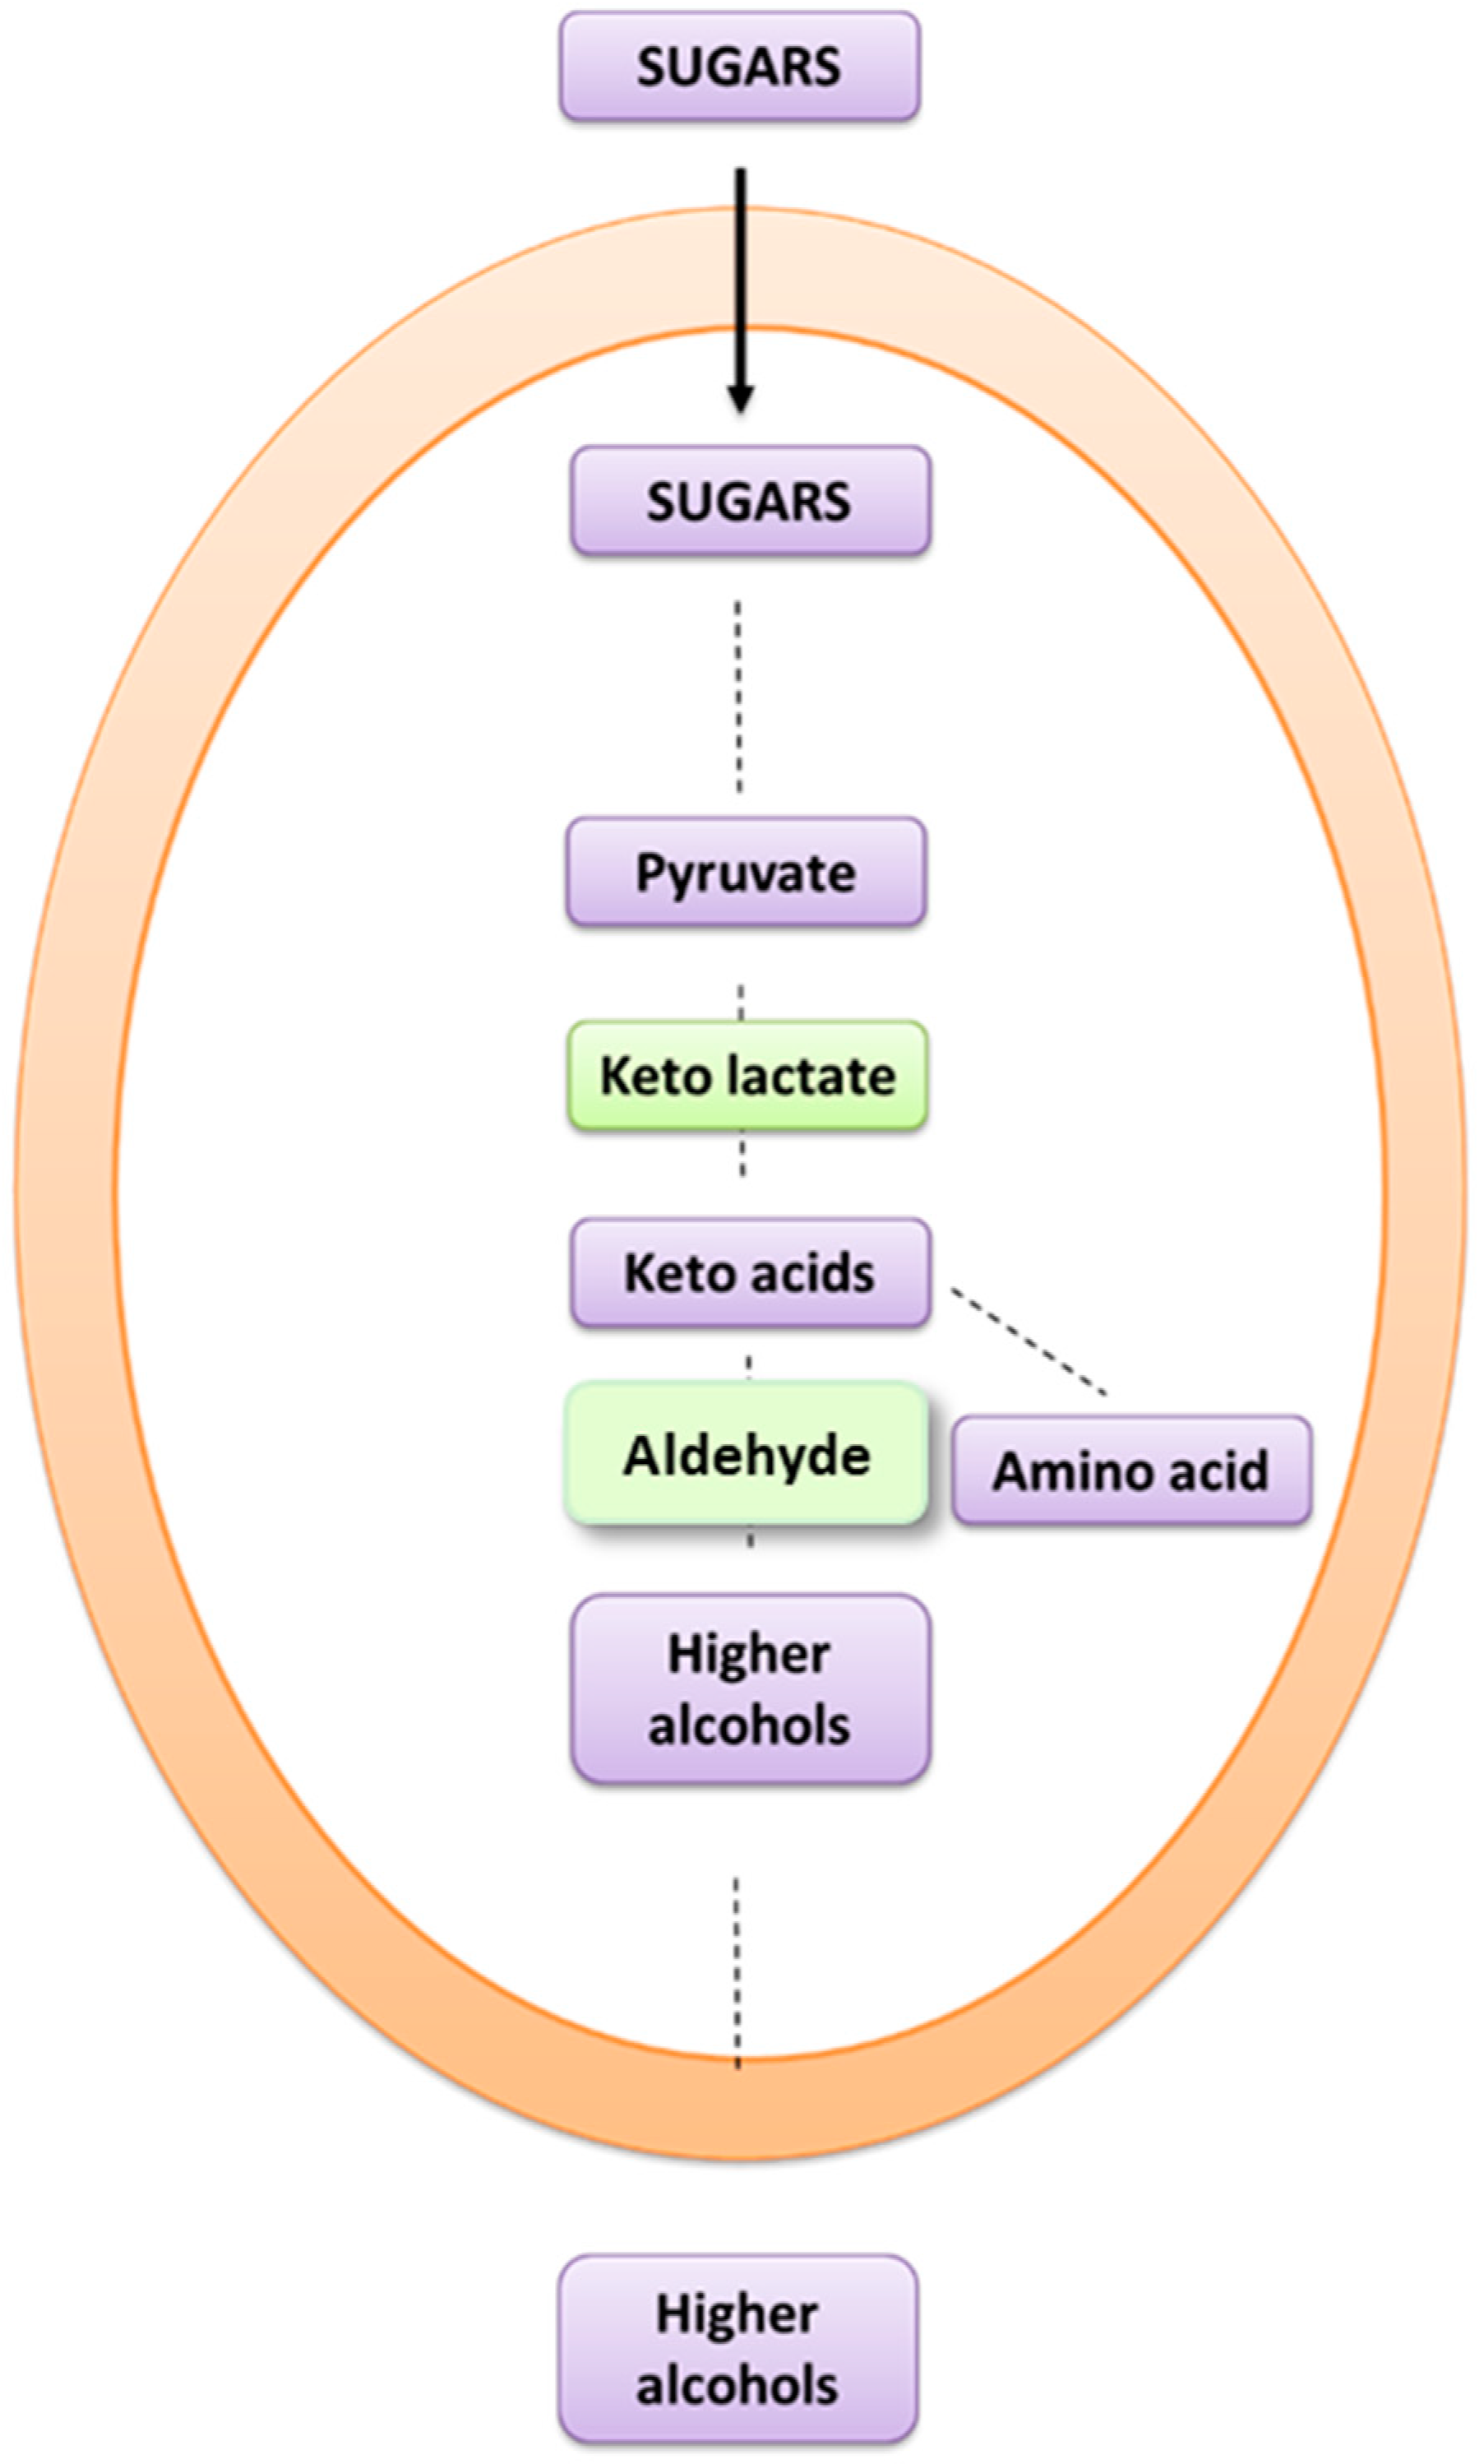
For a long time, the Ehrlich pathway has been the more recognized route to produce fusel alcohols [
3,
5]. Amino acids are deaminated to produce alpha-keto acids, followed by decarboxylation to an aldehyde and, finally, reduction to a fusel alcohol [
6]. However, Nisbet et al. [
6] proved a different pathway, based on the production of alpha-keto acids from sugars during amino acid biosynthesis (anabolic pathway), which may then be degraded to fusel alcohols. The contribution of hexoses to the production of higher alcohols was studied using labeled compounds such as [U13C]-glucose. They ascertained the importance of the anabolic pathway in the formation of fusel alcohols, as more than 75% of the fusel alcohols associated with amino acid metabolism were hexose derived. Furthermore, HT synthesis by yeast has been elucidated by adding isotopically labeled tyrosine to the initial synthetic must [
7]. Apart from the intermediates of the Ehrlich pathway ending in tyrosol, the presence of labeled and, most importantly, non-labeled HT was evidenced in this work. Hence, these results demonstrated that HT can be synthesized not only from the amino acid tyrosine in must but also, to a greater extent, from other sources such as sugars.
HT is a phenolic compound that possesses well-recognized bioactive properties [
8]. De Las Hazas et al. [
9] have demonstrated its biological effects as an antioxidant, anti-inflammatory, and antimicrobial agent. Interestingly, other studies have proven its function against cancer, cardiovascular diseases [
10], and its neuroprotective effect [
11]. Thus, the European Food Safety Authority (EFSA) released a positive opinion about its healthy properties regarding the daily intake of HT and related polyphenols [
12]. The health claim pinpoints that “Olive oil polyphenols contribute to the protection of blood lipids from oxidative stress” as they protect LDL from oxidative damage. The statement can be applied to at least 5 mg of HT and its derivatives per 20 g of olive oil consumed daily [
12].
Hence, HT is a molecule with great interest due to its human health benefits [
13,
14]. Furthermore, thanks to the antioxidant and antimicrobial character of HT as well as its bioactive potential, it has attracted attention as a food ingredient that is recognized as safe by the EFSA [
15]. Consequently, the European Commission [
16] authorized the placement of HT on the market as a novel food ingredient. Thereupon, it is a matter of interest either to produce it as an ingredient or to increase the content in fermented foods.
In the case of wine, several factors that can influence the formation of the final fusel alcohols (such as tyrosol) have been explored, including the yeast strain, initial sugar, fermentation temperature, pH, and composition of grape juice, as well as yeast assimilable nitrogen (YAN), aeration, grape variety, and skin contact time [
17]. Regarding the fermentation temperature, the higher the temperature, the higher the fusel alcohol production [
18]. The same occurred at higher sugar contents [
19]. The formation of fusel alcohols in wines was different depending on the grape variety used [
2].
Conversely, little is known regarding factors influencing HT production. A study with 10 different Saccharomyces and non-Saccharomyces yeast strains pinpointed that the
S cerevisiae red fruit strain was the biggest producer of HT among those studied [
17]. In the present study, we have introduced some of the metabolic modifications previously described to overproduce [
20,
21] in a commercial wine strain, QA23, as a strategy to increase the HT content in the final wines. In short, the construction of this metabolic engineering strain involved the overexpression of a variant of the
S. cerevisiae gene ARO4 to abolish the feedback inhibition by tyrosine (ARO4*) and the heterologous overexpression of E. coli hydroxylase HpaBC complex components (hpaB and hpaC genes).
The antioxidant character and bioactive potential of HT make it the perfect candidate as a food ingredient. Among all the applications that HT could have as an antioxidant and bioactive compound, the wine industry has a great interest in using it as an alternative to SO
2 or to reduce the use of SO
2 in wine since certain consumers are sensitive to it. A great variety of alternatives have been studied, such as the use of oenological tannins combined with lysozyme to reduce the amount of SO
2 in white wines; however, the volatile composition was significantly modified [
22]. Some studies have shown that polyphenolic extracts can protect wine from oxidation; those extracts (Hytolive
®, Genosa I + D, Malaga, Spain) were enriched in HT (26% richness) and added to wines to reach 50 mg L
−1 of HT, and they showed excellent antioxidant and antimicrobial properties in vitro and have preservative properties in red and white wines [
23,
24]. However, in these studies, the volatile and sensory profiles of the wines were affected by the nature of the extracts, which came from by-products of the olive industry, as well as the unctuous character of these extracts. Thus, increasing the HT in the wine may be a good strategy to reduce or eliminate SO
2, especially considering the fact that HT is naturally found in wine.
In this regard, the main goals of the present work were to (i) evaluate if different conditions of yeast assimilable nitrogen (YAN) influence the final HT concentration; (ii) study the sugar content that can promote a higher concentration of tyrosol, and therefore the final compound of the route, HT; and (iii) study how a strain genetically improved for the overproduction of HT and influences the final concentration of this compound.
2. Materials and Methods
2.1. Reagents
HT standard was purchased from Extrasynthese (Genay, France); tyrosol was purchased from Sigma-Aldrich (Madrid, Spain); and HPLC-MS-grade methanol and acetonitrile were acquired from Merck (Darmstadt, Germany).
2.2. Yeast Strains
A commercial wine yeast strain of
S. cerevisiae Lalvin YSEO QA23 (Lallemand, Montréal, Canada), herein named QA23-WT, and its metabolically engineered strain, herein named QA23-ME, were used in the fermentation of synthetic must (SM). The modification consisted of (i) a single integration of the ARO4* gene to endogenously increase tyrosol and (ii) multiple integration of the HpaBC enzyme complex of
Escherichia coli, which hydroxylates tyrosol to HT, as previously described in Muñiz-Calvo et al. [
20].
2.3. Synthetic Must
The SM was prepared for the two experiments as instructed in Riou et al. [
25], with slight differences. The content was the same in the following ingredients: acids (malic acid 5 g L
−1, citric acid 0.5 g L
−1 and tartaric acid 3 g L
−1), minerals (KH
2PO
4 0.75 g L
−1, K
2SO
4 0.5 g L
−1, MgSO
4 7H
2O 0.25 g L
−1, NaCl 0.2 g L
−1 and CaCl
2 0.155 g L
−1), 1 mL of trace elements, and 10 mL of a vitamin solution (myoinositol 2 g L
−1, calcium pantothenate 0.15 g L
−1, thiamine hydrochloride 0.025 g L
−1, nicotinic acid 0.2 g L
−1, pyridoxine 0.025 g L
−1, and biotin 3 mL). The pH was adjusted to 3.3 with NaOH. The differences are focused on the YAN concentration and sugar contents for each experiment. For the first (A), the aim was to screen the conditions of YAN related to HT production by yeast; thus, the sugar content was set to 200 g L
−1 (fructose 100 g L
−1 and glucose 100 g L
−1) and (210 mg L
−1 or 300 mg L
−1). For the second (B), YAN was set to 210 mg L
−1, and two different concentrations of sugar were tested (100 g L
−1 and 240 g L
−1). All the conditions are presented in
Table 1.
YAN was obtained by mixing amino acids and NH
4Cl. A final YAN of 300 mg L
−1 was achieved by 180 mg L
−1 of amino acids and 120 mg L
−1 of NH
4Cl. Additionally, a final YAN of 210 mg L
−1 was obtained, where 90 mg L
−1 came from amino acids and 120 mg L
−1 from ammonium (NH
4Cl). The amino acid stock solution was prepared following the instructions presented by Riou et al. [
25]: tyrosine 1.5 g L
−1, tryptophan 13.4 g L
−1, isoleucine 2.5 g L
−1, aspartic acid 3.4 g L
−1, glutamic acid 9.2 g L
−1, arginine 28.3 g L
−1, leucine 3.7 g L
−1, threonine 5.8 g L
−1, glycine 1.4 g L
−1, glutamine 38.4 g L
−1, alanine 11.2 g L
−1, valine 3.4 g L
−1, methionine 2.4 g L
−1, phenylalanine 2.9 g L
−1, serine 6 g L
−1, histidine 2.6 g L
−1, lysine 1.3 g L
−1, cysteine 1.6 g L
−1, and proline 46.1 g L
−1. SM containing 1.3% (
v/
v) of amino acid solution was prepared for 300 mg L
−1 of YAN and 0.65% (
v/
v) of amino acid solution for 210 mg L
−1 of YAN. The NH
4Cl concentration was the same in both cases. Each fermentation condition was tested in septuplicate flasks of 1L with 750 mL of SM. SM was sterilized with bottle-top vacuum filters (Nalgene PES membrane).
2.4. Inoculation
Firstly, each yeast strain was plated onto yeast extract peptone dextrose (YPD) (1% yeast extract, 2% glucose, 2% agar, and 2% peptone) and incubated at 28 °C for 48 h. Secondly, two flasks of 250 mL were used for each strain (4 in total) with 100 mL of YPD (1% yeast extract, 2% glucose, and 2% peptone). They were set overnight at 28° C and 150 rpm to let the yeast grow before every experimental process. Once the strains were activated, each fermentation flask of 1L with 750 mL of SM was inoculated with 10⁶ cells mL−1 and capped with a tap equipped with a capillary to release carbon dioxide. The AFs were incubated at 25ºC and 150 rpm. Fermentations were monitored daily by weighing the flasks before and after sampling, measuring OD600, and counting cells with a Neubauer Camera and cytometer (Beckman Coulters, Brea, CA, USA). Fermentations lasted for 10 days except that one with 100 g L−1 of sugar, which lasted 7 days.
2.5. Sampling
Samples were collected daily from inoculation until the end of the AF. The sample volume collected was calculated to have 109 cells. Samples were centrifuged at 4500 rpm at a temperature of 4 °C for 3 min. The supernatants were preserved at −80 °C until analysis. The end of alcoholic fermentation was reached when the differences between daily weights were not significant.
2.6. Sample Treatment
Before the analysis, samples were cleaned using Solid Phase Extraction (SPE) with C18 cartridges (Variant, Agilent, Santa Clara, CA, USA), as previously described [
2]. The first step was conditioning the cartridge using 2 mL of methanol and, sequentially, 2 mL of MiliQ water. Once conditioned, 2 mL of the sample was loaded, 1 mL by 1 mL. Then, 2 mL of the water/methanol (90:10,
v/
v) solution were used to wash the sample. In the case of samples from fermentations with 240 g L
−1 of sugar, two washes were necessary to remove all residual sugars. The compounds of interest were eluted with 1 mL of methanol. Samples were dried at 2000 rpm and at 30 °C for 8 h with a vacuum concentrator (HyperVAC-LITE, Gyrozen, Daejeon, Republic of Korea). Subsequently, samples were reconstituted with 400 μL of water/acetonitrile (90:10,
v/
v) and preserved at −80 °C until analysis.
2.7. UHPLC-MS Parameters
A liquid chromatography system with a binary UHPLC Dionex Ultimate 3000 RS connected to a quadrupole-orbitrap Q exactive hybrid mass spectrometer (ThermoFisher Scientific, Waltham, MA, USA) with an HESI ionization probe (HESI-II) was used for the determination of tyrosol and HT. The column was a Zorbax SB-C18 (2.1 × 100 mm, 1.8 µm, Agilent) with a flow of 0.4 mL/min. The gradient consisted of (A) water with 0.2% of acetic acid and (B) acetonitrile. The binary gradient was used with the following profile: 0–1 min 5% B, 1–7 min from 5% to 100% B, 7–8.5 min 100% B, and 8.5–10 min 5% B. The volume selected for the injection was 5 μL. The compounds were dissolved in water/methanol (90:10 v/v). A method of parallel reaction monitoring (PRM) was used in a negative mode with a resolution of 35,000 at m/z 200 FWHM, an isolation window of 1 m/z, and a normalized collision energy at 40 eV. The masses were optimized for tyrosol (137.06080) and HT (153.05572). The transitions for tyrosol were 137.06080–92.06080, and for HT, they were 153.05572–123.05572. HESI source parameters were spraying voltage, 3.0 kV; S lens level, 50; capillary temperature, 320 °C; sheath, auxiliary and sweep gas flow, 50, 15, and 2, respectively (arbitrary units); and probe heater temperature, 425 °C. The data were treated with the software TraceFinder 5.1.
The method was previously validated [
2] in terms of the limit of detection (LOD), limit of quantification (LOQ), precision, linearity, recovery, and matrix effects. To set the linearity, LOD, and LOQ parameters, a fermentation medium was prepared in order to simulate the matrix characteristics. Eleven concentrations were prepared (1000, 500, 100, 50, 25, 12.5, 6.25, 3.12, 1.56, 0.78, and 0.39 ng mL
−1) and cleaned using SPE. Three replicates were determined for each solution. The detection limits were calculated based on the standard deviation of the response (σ) and the slope [
2]. Calibration curves with their slope (S), intercept, and correlation coefficient (r) were calculated by plotting the peak area vs. the concentration of the standards. The results indicated linearity by a curve with r
2 = 0.9995 and an LOD of 0.035 ng mL
−1 and an LOQ of 0.108 ng mL
−1. The precision was evaluated with the standard deviation of two concentrations (0.1–1 ng mL
−1) for 5 days with 5 replicates per concentration, and repeatability was calculated during a work session. The obtained parameters showed good precision and repeatability [
2]. The last one was the matrix effect; the resulting value was 1.05%, which is an irrelevant value, and consequently no matrix effect is considered.
2.8. Statistical Analysis
The results are expressed as the mean ± standard deviation (SD). Data were subjected to analysis of variance (ANOVA, South St. New Providence, NJ, USA). Differences at p < 0.05 were considered statistically significant. Statistica software version 14.00 (TIBCO Software, Palo Alto, CA, USA) was used for data analysis.
3. Results
A genetically modified
S. cerevisiae strain was tested for its capacity to increase HT production. The genetic modifications carried out on QA23 strain were the multiple integration of a bacterial hydroxylase and reductase complex, namely HpaBC, under the control of strong constitutive promoters PTEF1 and PPGK1 into the genome using Ty1Cons2 sequences as homologous recombination targets, and the single integration of allelic variant ARO4K229L, henceforth ARO4*, under the control of TDH3 promoter in chromosome locus X-3. Such modifications would confer on the QA23 strain the ability to hydroxylate tyrosol as a result of the activity of the HpaBC complex, and at the same time, the tyrosine-insensitive variant ARO4* would increase metabolic flux towards tyrosol. These modifications were performed according to previous work [
20]. Briefly, genes hpaB and hpaC and the bidirectional promoter PTEF1-PGK1 were PCR-amplified from plasmids p426GPD-hpaB, p425GPD-hpaC, and pCfB2628, respectively [
20], while ARO4* with the TDH3 promoter was amplified from plasmid p423GPD-ARO4*. In parallel, vectors bearing the Ty1Cons2 and X-3 sequences for homology recombination from the EasyCloneMulti and EasyClone vector set pCfB2988 and pCfB257 were prepared by sequential treatment with enzymes AsiSI (SfaAI) (Thermo Fisher Scientific, Waltham, MA, USA) and BsmI (New England Biolabs, Ipswich, MA, USA). After purification, PCR products were cloned into pre-treated vectors by the USER™ method (New England Biolabs). Ligation products were transformed into E. coli, and successful cloning of both vectors was verified by Sanger sequencing (EUROFINS genomics, Ebersberg, Germany). Prior to yeast transformation, the resulting integrative vectors pCfB2988 HpaBC and pCfB257 ARO4* were linearized by FastDigest NotI (Thermo scientific, Vilnius, Lithuania), and the fragments containing the desired sequences to integrate were purified from agarose gel. Yeast cells were transformed with 1–1.5 µg of the linear fragment from the integrative vectors by the PEG/LiAc method and plated on a selective agar medium according to strain auxotrophic markers.
Additionally, different concentrations of sugar and YAN were evaluated to establish the optimal conditions regarding must composition.
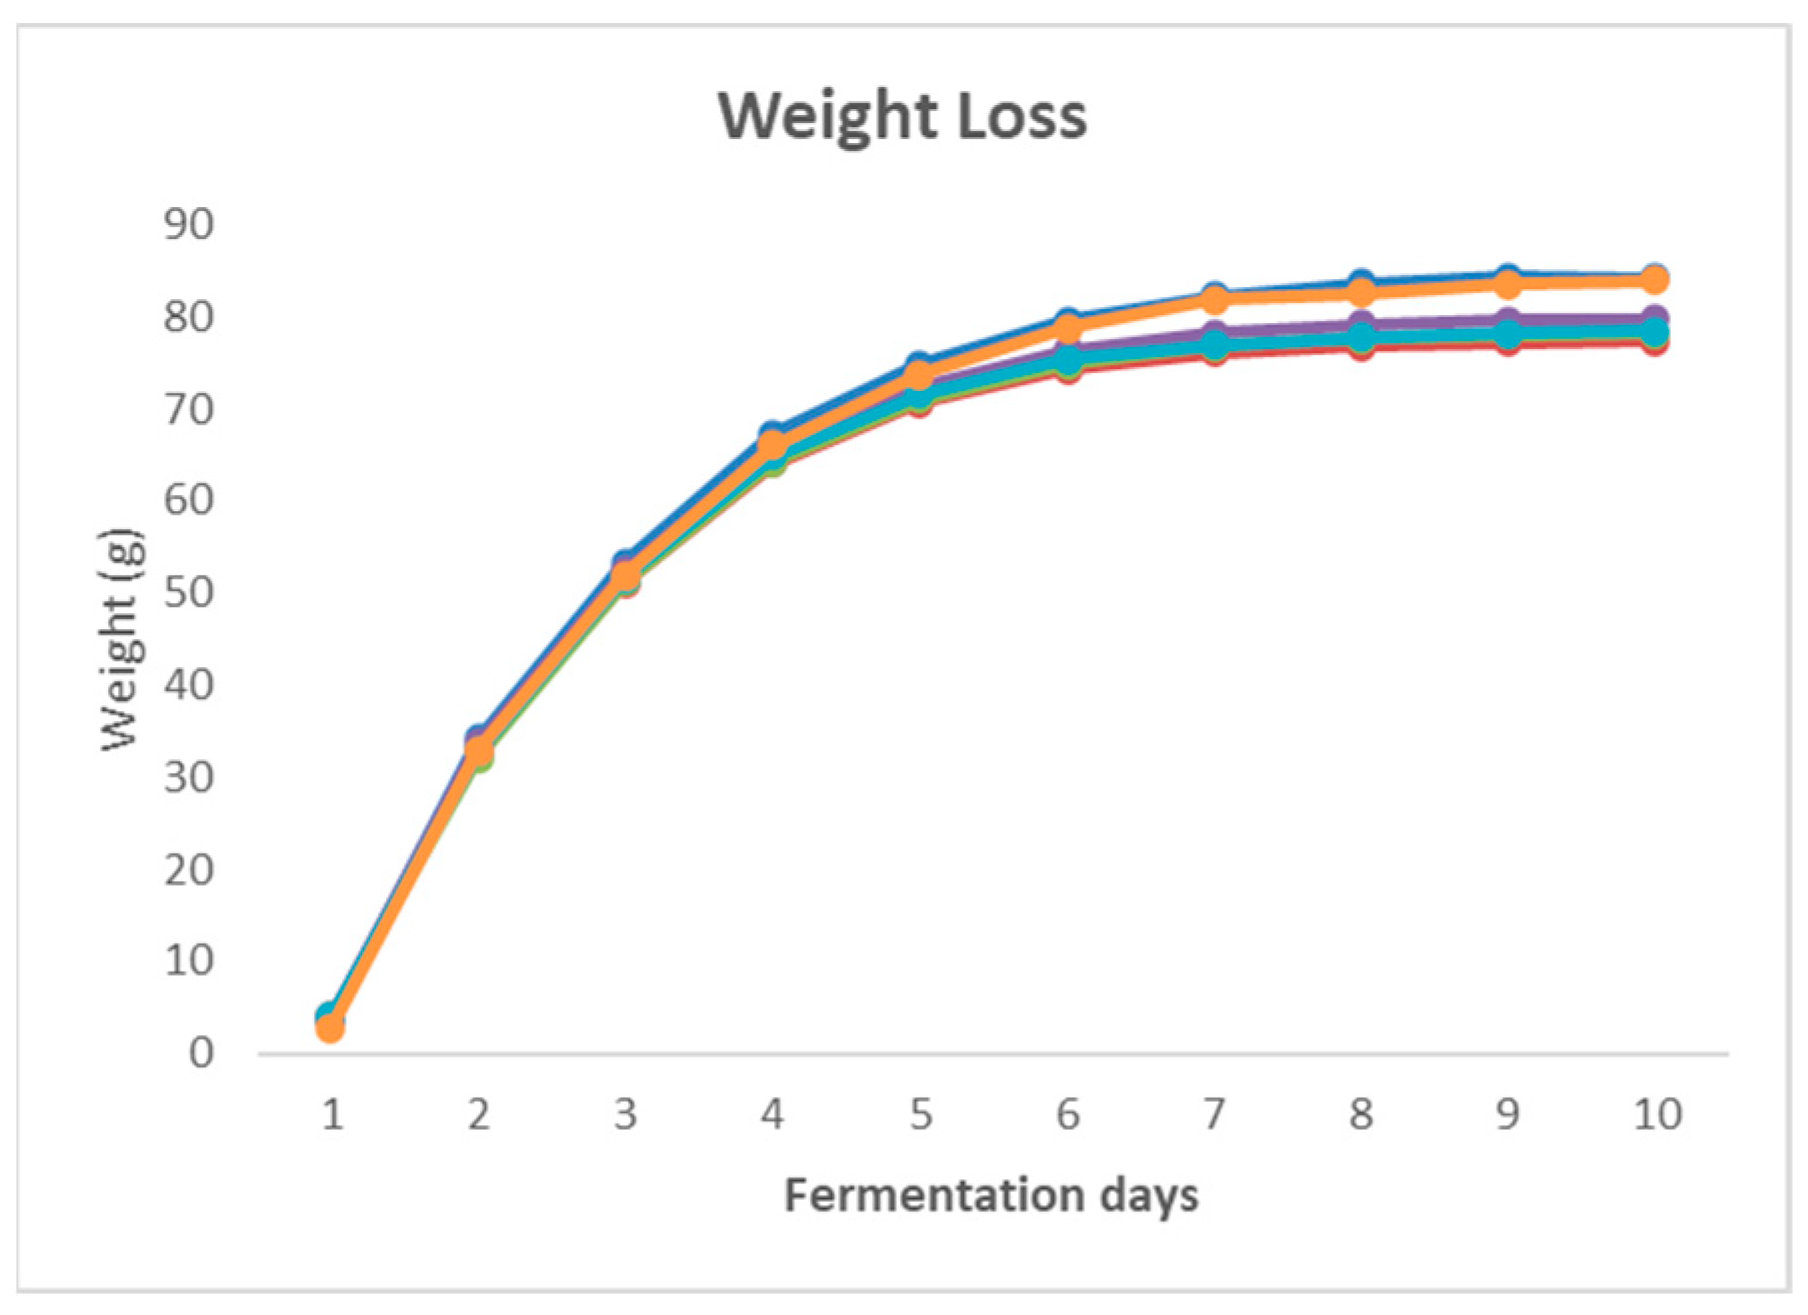
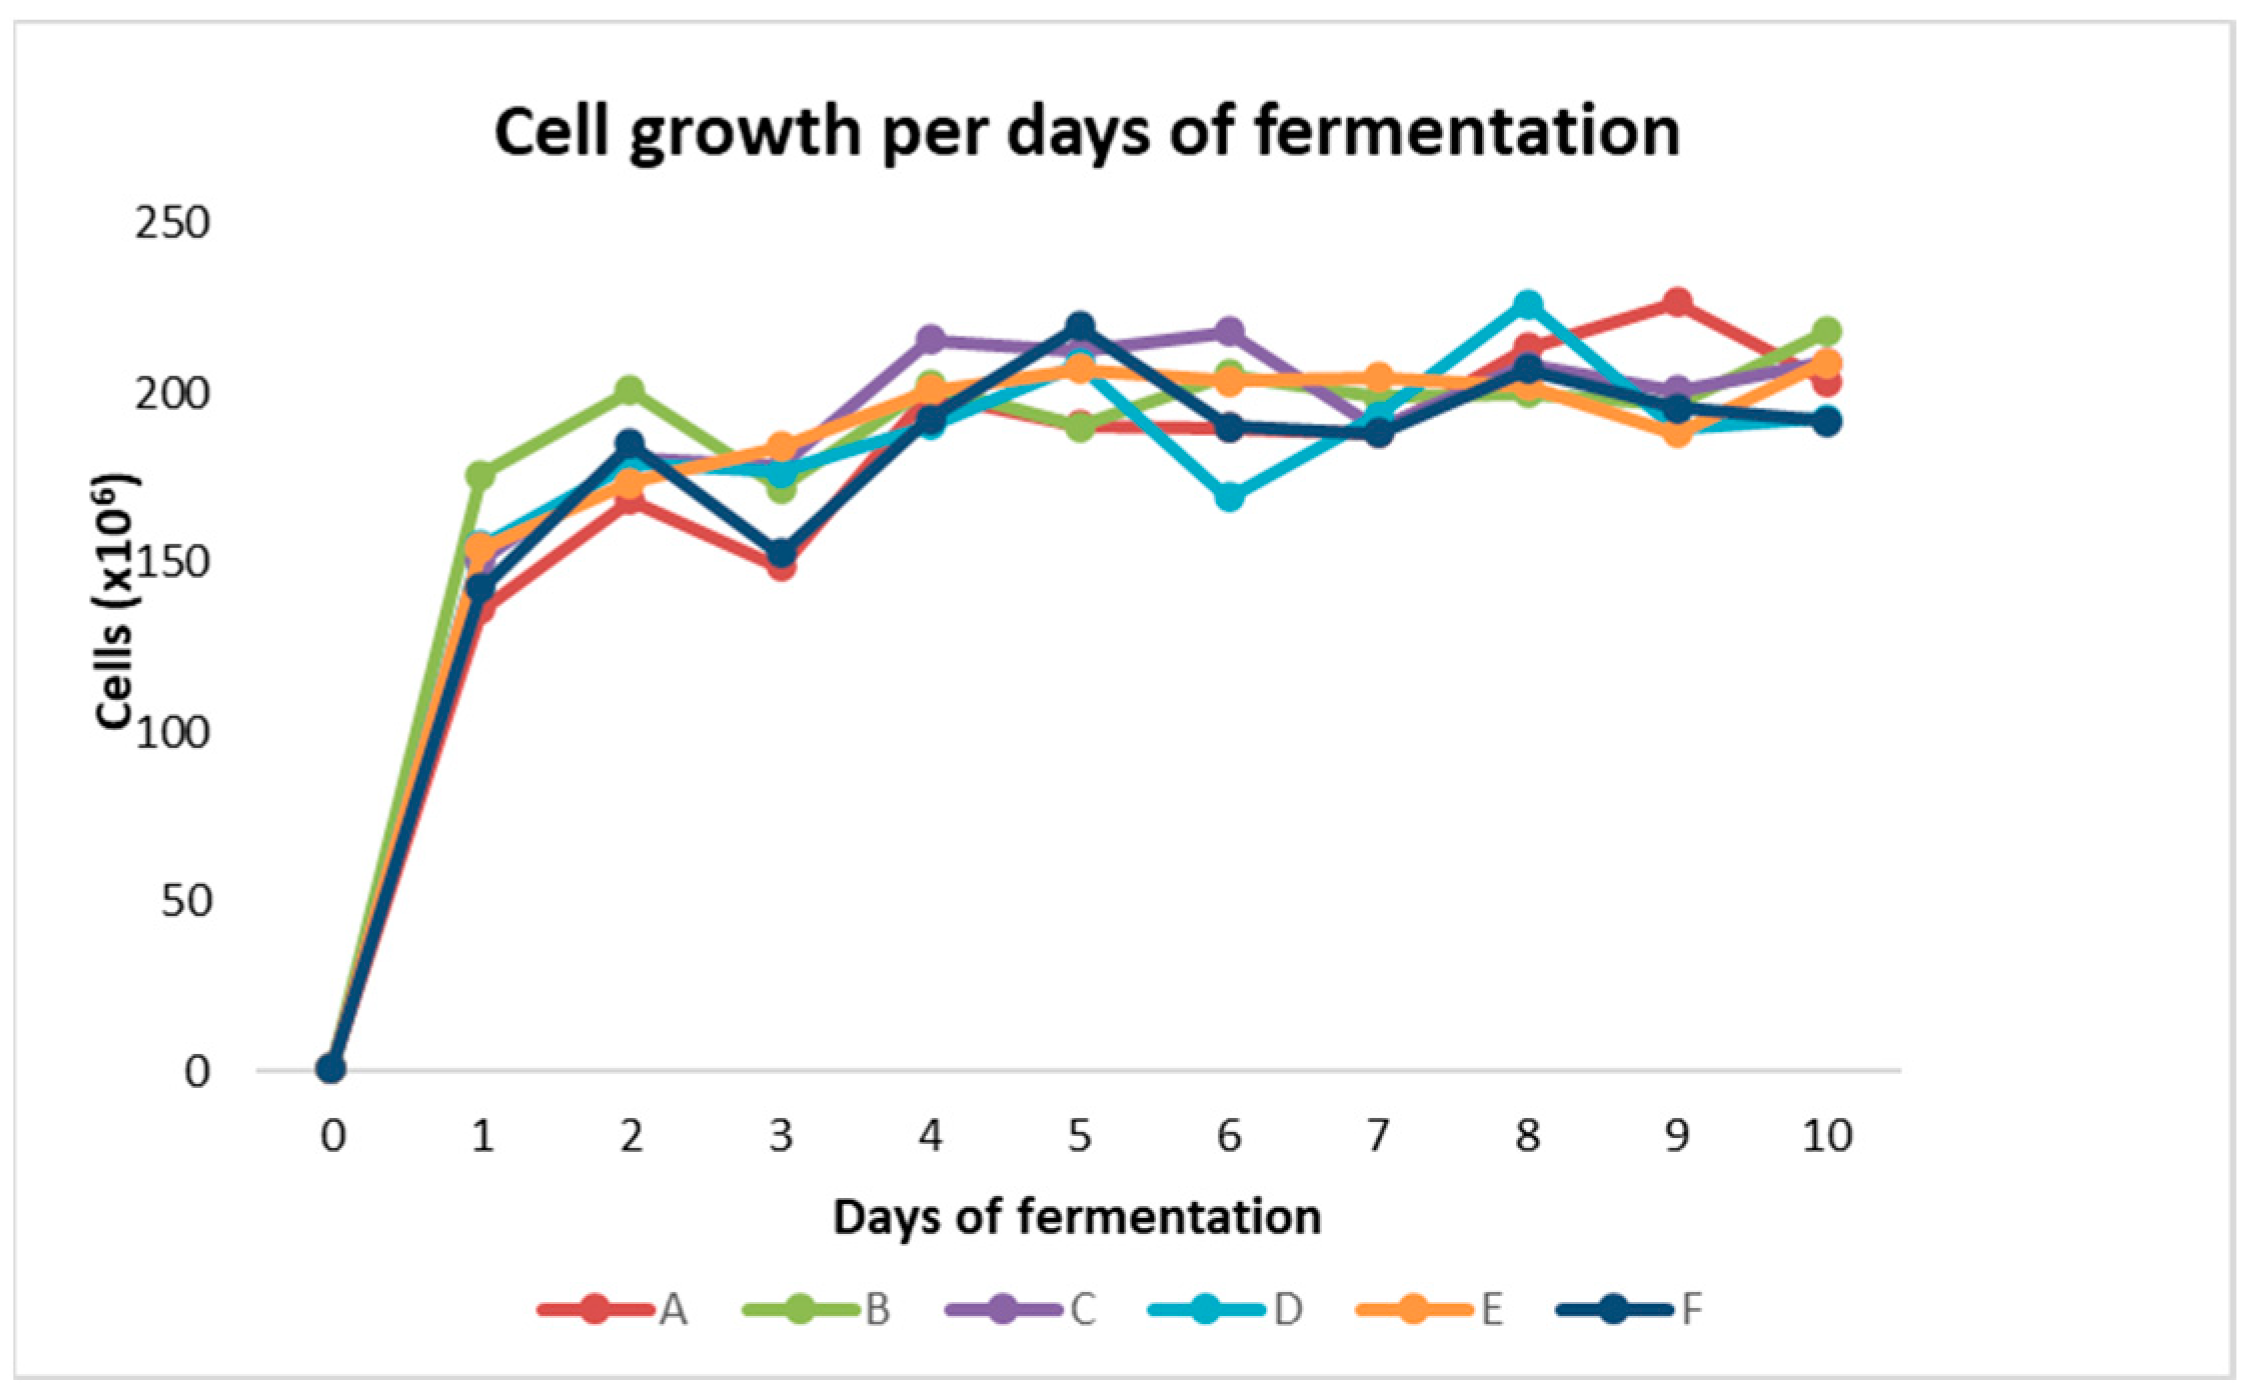
Figure 1 shows the weight loss in terms of CO
2 during the 10 days of fermentation obtained from the daily weight of the flask. The graphic shows the difference between the phases, exponential and stationary, and
Figure 2 shows the cell growth per day.
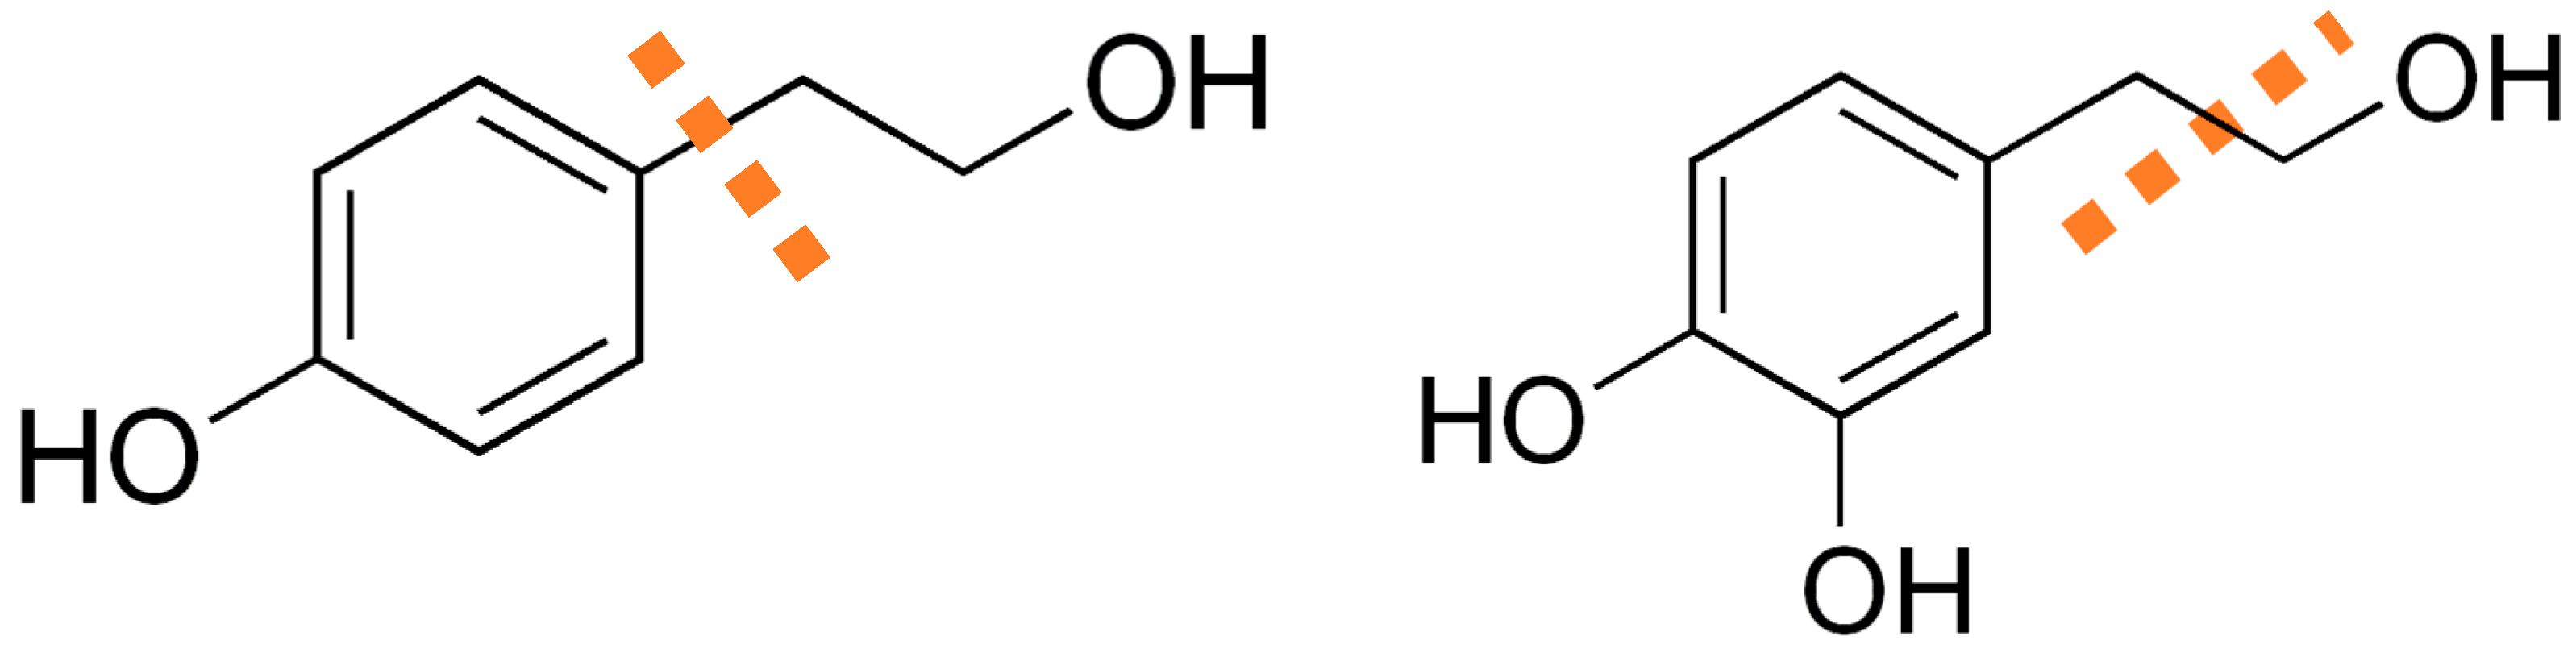
Applying the UPLC-MS/MS, the analysis was according to the standards, and the fragmentation of each compound is represented in
Figure 3. The results are shown in
Table 2; HT and tyrosol are produced by the wild type of strain, QA23-WT, and its metabolically engineered version, QA23-ME, at the two concentrations of YAN (210 and 300 mg L
−1) and the two concentrations of 1:1 of the mix glucose–fructose (100 and 240 g L
−1).
HT was already detected at the beginning of the alcoholic fermentation and in every sample (
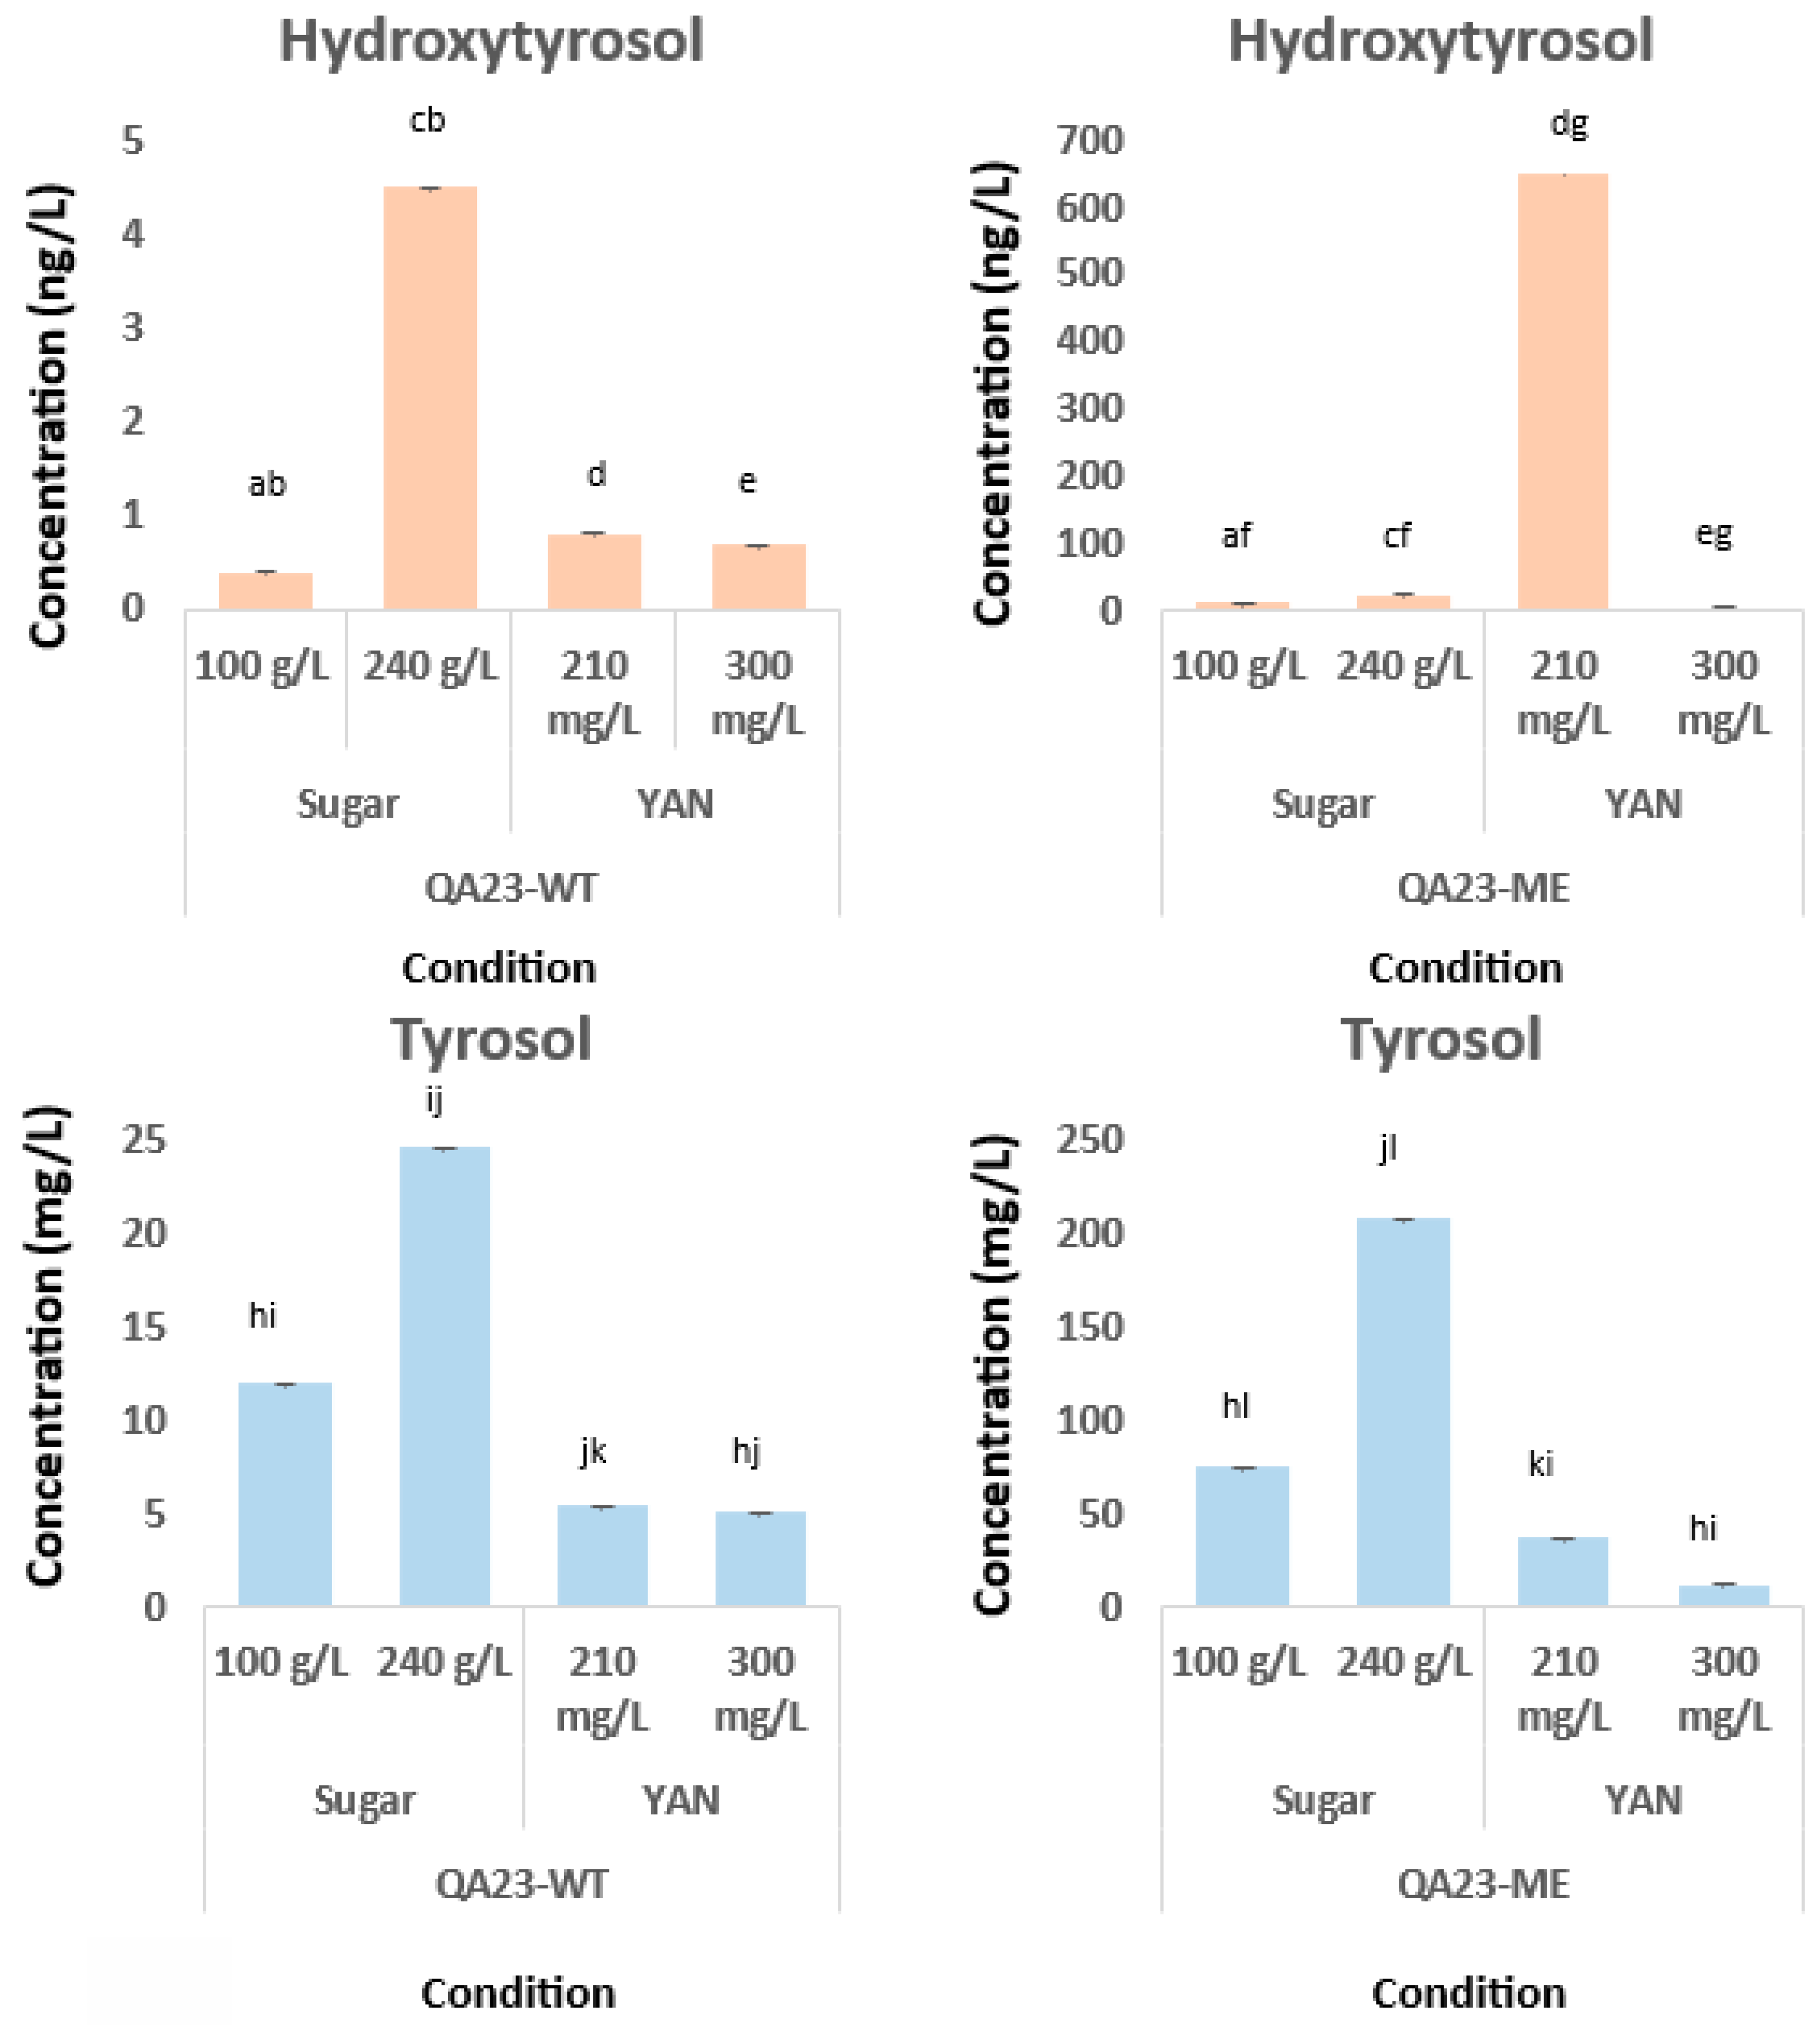
Table 2), regardless of the involved strain, YAN, or sugar conditions. To confirm that HT and tyrosol were produced by yeast, must without inoculation was analyzed (on day 0 of fermentation), revealing that HT and tyrosol were not present. Regarding the study of nitrogen assimilation, QA23-WT resulted in HT between 0.04 and 0.81 ng mL
−1, while QA23-ME was synthesized between 13 and 809 times higher HT concentrations (0.49–651.8 ng mL
−1) for those fermentations performed with 210 mg L
−1 of YAN. For 300 mg L
−1 of the initial YAN, the QA23-WT strain produced between 0.13 and 0.70 ng mL
−1 of HT. These results agree with a previous study by Rebollo-Romero et al. [
17], reporting a concentration of 1 ng mL
−1 of HT in the same SM conditions. However, the modified strain QA23-ME was able to synthesize HT at a concentration between 0.61 and 5.15 ng mL
−1 (ca. 4.6–7.4 times higher). Although QA23-WT produced similar HT concentrations at 210 and 300 mg L
−1 of YAN, QA23-ME produced significantly higher HT concentrations at 210 mg L
−1 of YAN. These results highlight that the initial YAN content has little impact on QA23-WT (indeed, no significant differences were observed), while the effect on QA23-ME was remarkable.
HT maximum production took place on different days in each condition. The days with the highest production were at the beginning of the fermentation (on day 3 for QA23-WT and day 1 for QA23-ME) for 300 mg L
−1 of YAN. These results are in accordance with the data reported by Rebollo-Romero et al. [
17] for QA23-WT, whose maximum concentration was reached on the third day at an identical YAN content. On the other hand, the AF assays performed with YAN values of 210 mg L
−1 showed the highest HT concentration later (on days 8 and 10 for QA23-WT and QA23-ME, respectively).
HT production was also monitored at two different sugar concentrations. For the lowest sugar concentration, 100 g L−1, the production of HT by QA23-WT ranged between 0.60 and 0.41 ng mL−1 compared to 2.81 and 12.60 ng mL−1 for QA23-ME (11–30 times higher). It is important to note that due to the lower sugar levels, the AF lasted for only 7 days, in comparison with the 10 days employed for the 240 g L−1. At 240 g L−1 of sugar, QA23-WT was able to produce HT at concentrations ranging between 0.16 and 4.52 ng mL−1 and 1.05 and 23.40 ng mL−1 for QA23-ME. Higher HT concentrations were obtained with 240 g L−1 rather than with 100 g L−1 of sugar, with significant differences for both strains. In fact, at 240 g L−1 of sugar, the HT concentration was up to 10 times higher than at 100 g L−1 of sugar for the original QA23 and up to 1.8 times higher for the modified one. These results highlight the crucial role of sugar concentrations in HT yeast synthesis.
The day of the highest HT production varies according to the sugar condition and the type of yeast. In the case of QA23-ME, the highest production was during the early days: day 2 for the condition of 100 g L−1 of sugar and day 3 for the condition of 240 g L−1 of sugar. On the other hand, focusing on QA23-WT, days 5 and 10 are the ones with the biggest concentrations in each case, 100 g L−1 and 240 g L−1 of sugar, respectively.
The tyrosol concentration ranged between 0.01 and 5.36 mg L
−1 for QA23 and between 0.07 and 37.35 mg L
−1 for the modified one at 210 mg L
−1 of YAN. This synthesis was clearly accumulative throughout the fermentation process because the last few days showed the highest content for both yeasts under study. It is important to point out that the production of tyrosol by QA23-ME increased sharply on day 5 and, subsequently, (1 day after) HT increased too (
Table 2). This change is not so remarkable in the other conditions or strains tested. There was a coincidence on the day with the highest tyrosol and HT content (day 10) for the modified QA23-ME yeast. The highest concentration of tyrosol was obtained with 210 mg L
−1 of YAN, reaching values three times higher than at 300 mg L
−1 of YAN. Regarding the sugar content, there were significant differences in tyrosol between strains for both conditions. For experiments with must containing 100 g L
−1 of sugar, tyrosol concentrations ranged between 2.39 and 12.09 mg L
−1 for QA23-WT and 26.48 and 74.48 mg L
−1 for QA23-ME, while sugar concentrations of 240 g L
−1 were between 0.347 and 24.59 mg L
−1 for QA23-WT and 10.50 and 207.41 mg L
−1 for QA23-ME (
Table 3). In the case of tyrosol, the highest production was at day 5 for 240 g L
−1 of sugar and QA23-ME, reaching a concentration of 207.41 mg L
−1, which is three times higher than that for QA23-WT. Hence, for both strains, the highest values of tyrosol were obtained with a higher sugar content.
4. Discussion
Comparing HT results with fermentations made with natural must (white grape varieties of Corredera, Moscatel, Chardonnay, Sauvignon Blanc, Palomino Fino, and Vijiriega), containing an initial sugar concentration of around 200 g L
−1 [
2] and using QA23-WT, higher HT concentrations were obtained in the natural grape musts than in the synthetic ones (
Table 2). Indeed, Sauvignon Blanc reached 300 ng mL
−1 of HT on day 5. Moreover, analyses of commercial wines have shown HT at significantly higher concentrations of 0.5–9.6 mg L
−1 [
10]. The higher HT concentration in natural grape must than in synthetic would need further research to evaluate the winemaking conditions responsible for that difference. In addition, during the alcoholic fermentation process, the natural yeast in the grapes contributes to the final HT content [
26].
It is well known that the composition of the medium can affect the rate of fermentation and the production of metabolites [
27]. Recently, it has been reported that the synthesis of aromatic alcohols (tryptophol, phenylethanol, and tyrosol) by wine yeasts is modulated by the availability of glucose, nitrogen, and aromatic amino acids [
28]. Furthermore, tryptophol and phenylethanol have quorum sensing activity enhanced by limited nitrogen conditions [
29]. To carry out the AF, it is important that yeast has available nitrogen [
30]. Indeed, a minimum concentration of 140 mg L
−1 of YAN is necessary for the normal development of the AF [
31]. Thus, the two selected concentrations of YAN for our experiments were above this critical amount. Hazelwood et al. [
5] revealed that a medium with limited glucose results in less production of alcohols such as tyrosol. Generally, a direct relationship between initial nitrogen content and higher alcohol concentration was observed when the nitrogen content remained low, whereas at moderate-to-high nitrogen quantities, there was an inverse relationship [
32]. Furthermore, Gonzalez et al. [
33] assessed that the production of aromatic compounds (tryptophol, phenylethanol, and tyrosol) depends on the glucose and nitrogen availability. Our results agree with this conclusion, as the limitation of nitrogen promoted the production of fusel alcohols, while a low glucose content inhibited it. Other studies also showed an inverse correlation between fusel alcohol production and the nitrogen content [
34,
35], evidencing that fusel alcohols increase as the nitrogen concentration is closer to growth-limiting levels. Indeed, it has been reported that those alcohols act as auto-signaling molecules and are activated under nitrogen-poor conditions.
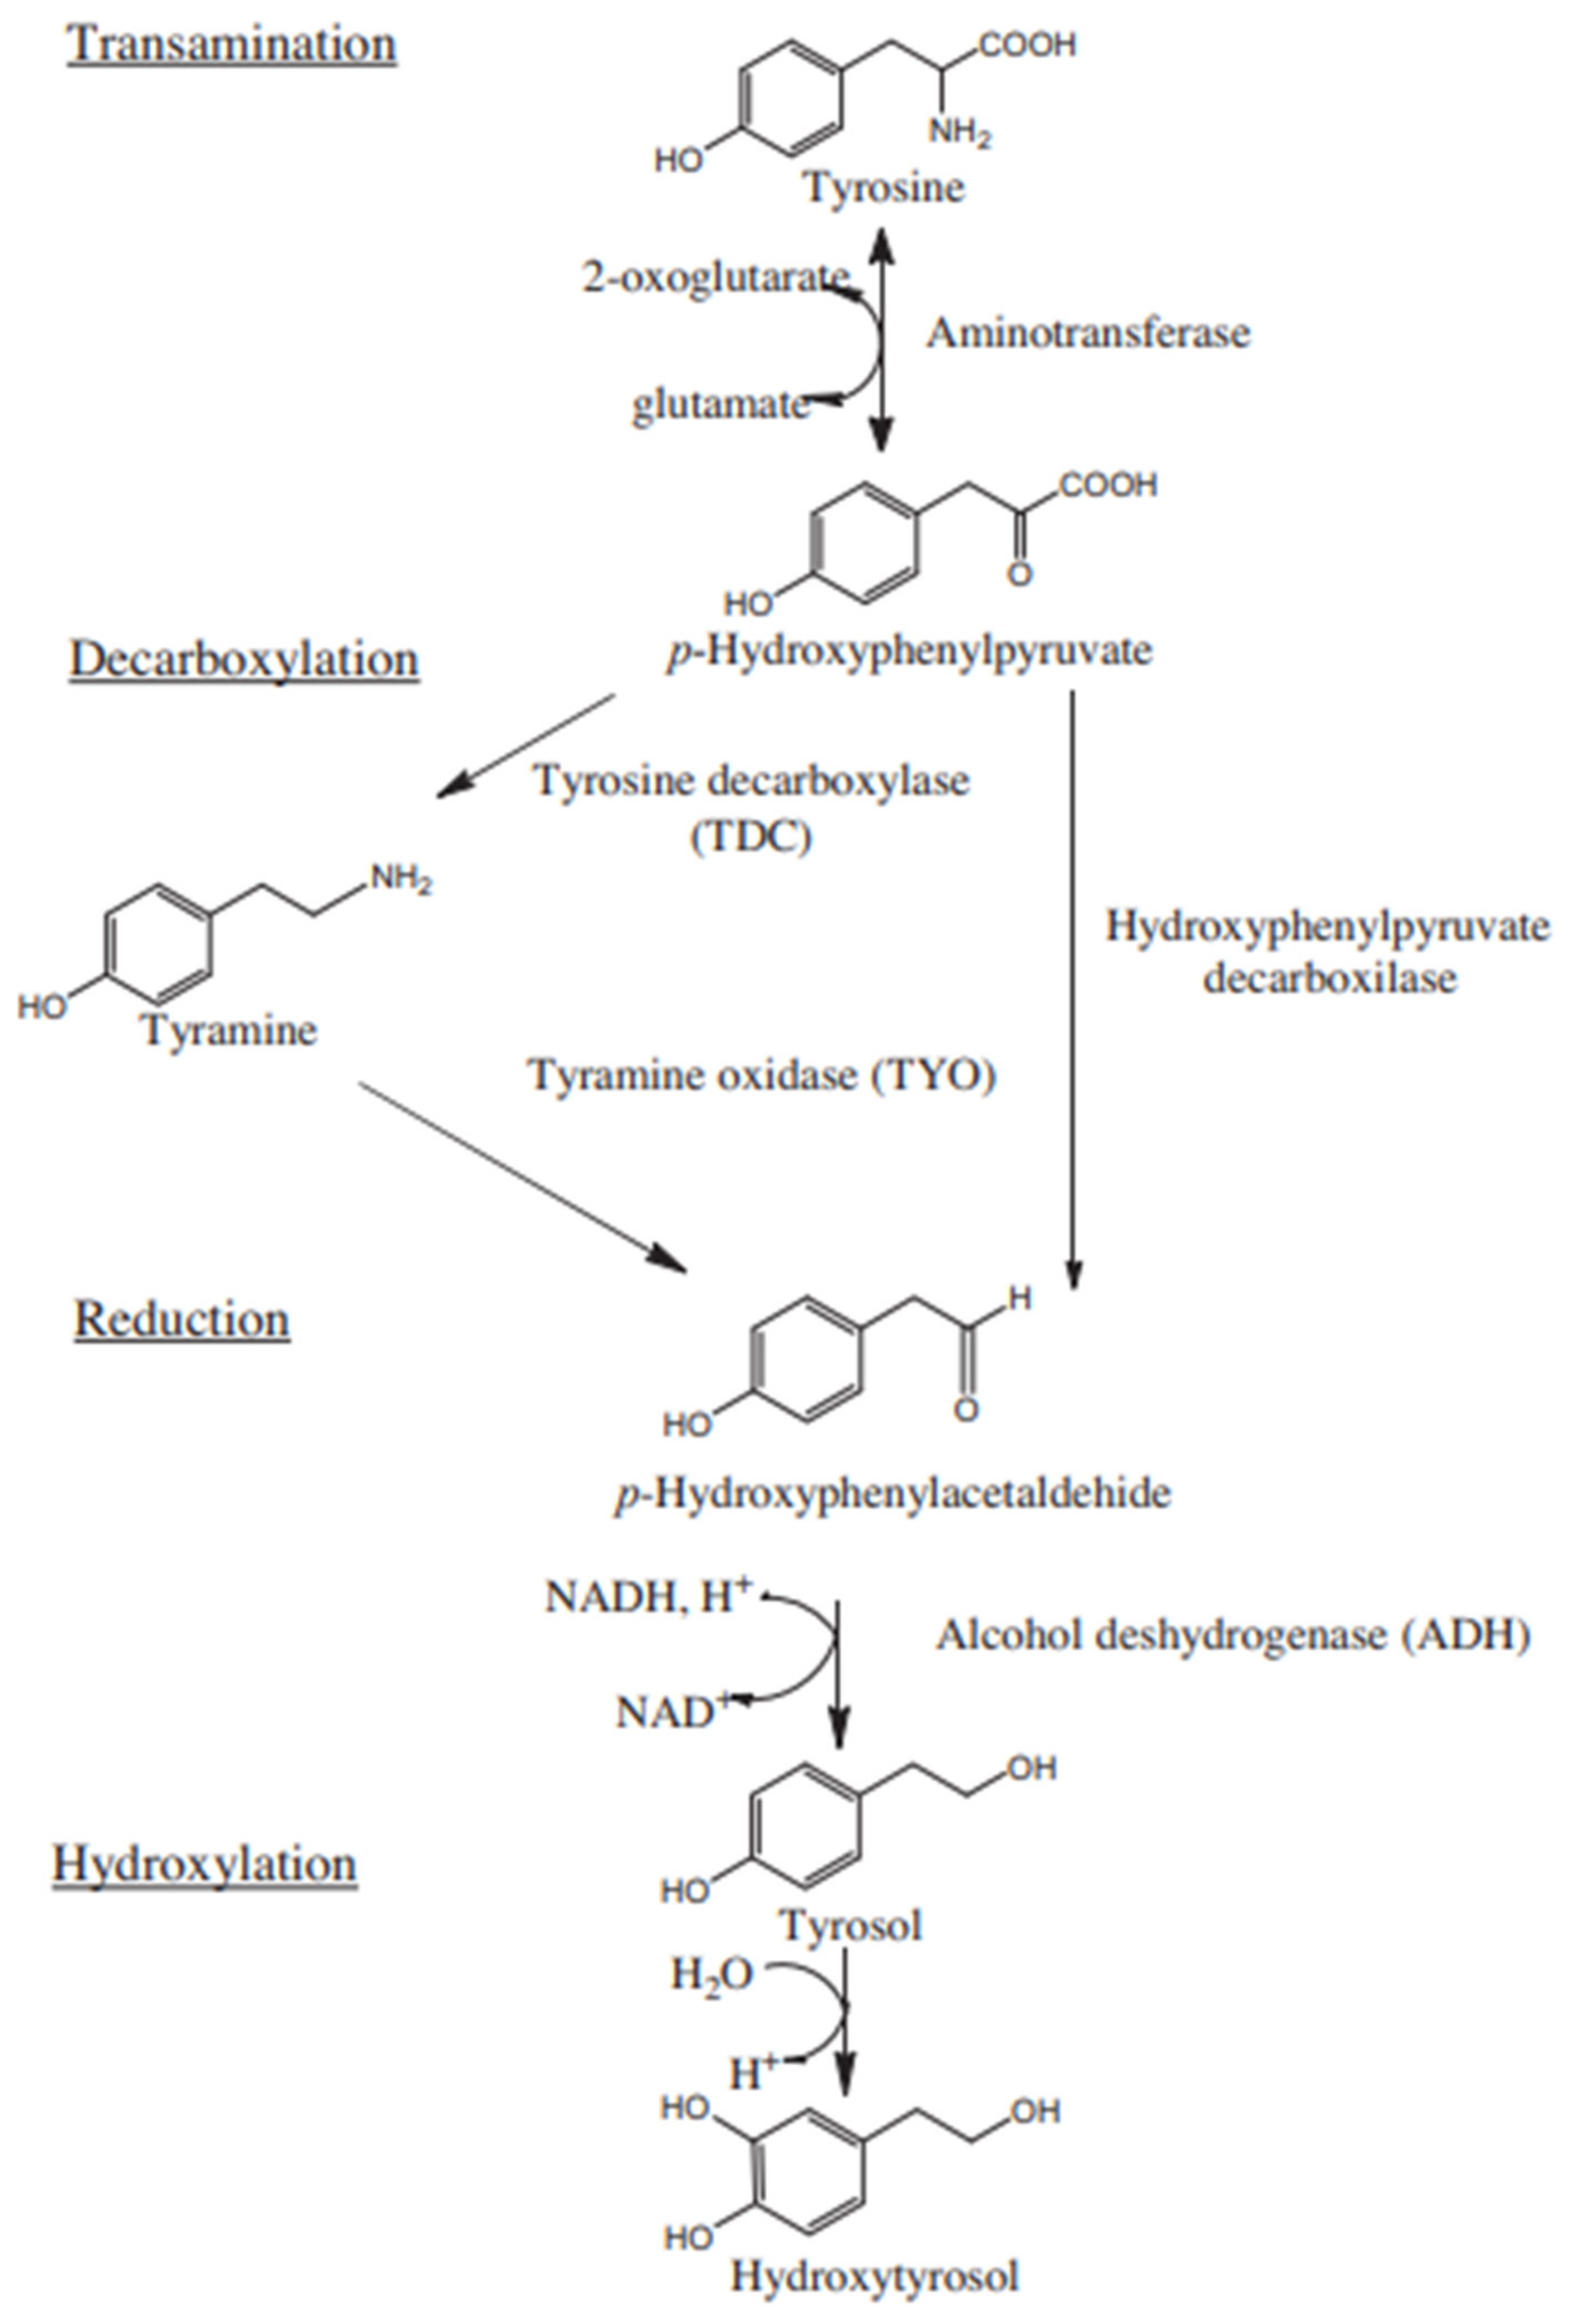
Alvarez-Fernandez et al. [
2] depicted the Ehrlich route from tyrosine to tyrosol and subsequently in hydroxylation to HT, as can be seen in
Figure 4, which shows the influence of tyrosine in the production of HT and higher alcohols such as tyrosol. However, based on previous studies [
3], a possible route from glucose to higher alcohols is considered. This pathway is presented in
Figure 4.
These results are in line with the ones shown by Rebollo-Romero et al. [
17], in which two different concentrations of the precursor tyrosine were added to the synthetic must, 10 mg L
−1 and 60 mg L
−1. The higher tyrosine concentration did not result in better HT production. Rebollo-Romero et al. [
17] only studied how tyrosine influenced the final HT concentration. Comparatively, we have gone one step further and studied how YAN (including tyrosine, among other amino acids, and ammonium sulfate) may affect the production of HT. In our conditions, lower YAN concentrations produced the highest HT concentration. Moreover, we not only focused on YAN but also on how glucose affects HT production, including a modified strain. With this in mind, Nisbet et al. [
6] detailed that fusel alcohols are 15% hexose-derived, another contributor to tyrosol production (
Figure 5). Related to this, our results show increases in tyrosol but also in HT, which has the highest sugar content. Indeed, Gallardo-Fernández et al. [
7] found that HT was mainly formed from another source that was different from the initial tyrosine in the must using isotopically labeled precursors. Our results suggest that a high content of sugar could be a more relevant factor than YAN to HT production, as shown in
Figure 6.
Currently, there are several strategies designed to increase HT production, including metabolic engineering. Our genetic modification of the wine strain QA23 consisted of an overexpression of the deregulated version of the ARO4 gene (ARO4*) and the multicopy integration in the yeast genome of the HpaBC genes of E. coli, leading to an increase in tyrosol production, which was subsequently hydroxylated into HT by the HpaBC complex [
20]. We are aware that the wine industry is very reluctant to use GMOs during wine fermentation. However, our previous studies [
20] and this work provide evidence that wine yeast is a good candidate to be used as a cell factory to produce different food additives with high bioactivity. This process may be more affordable compared to the obtention of HT from different wastes and other subproducts. Moreover, in the wine industry, HT has been evaluated as an alternative antioxidant to sulfur dioxide. However, HT extracted from olive waste can alter the aromatic profile of the final wine product [
24]. Furthermore, its obtention by yeast bio factories represents a greener process than solvent extraction, and it is affordable since sugar is the main substrate in its production.
In this study, we delve into the interplay between YAN and glucose and their impact on bioactive compounds produced by yeast, such as HT, and how a genetically modified yeast strain works in a synthetic must. This could be a preliminary study for further investigation. The main novelty of this work is its contribution to the HT investigation. A great range of the studies focus on fusel alcohols, but few study HT.

 ,
, 


