Article

Effect of Total Mixed Ration on Growth Performance, Rumen Fermentation, Nutrient Digestion, and Rumen Microbiome in Angus Beef Cattle during the Growing and Fattening Phases

The State Key Laboratory of Animal Nutrition and Feeding, College of Animal Science and Technology, China Agricultural University, No. 2 Yuanmingyuan West Road, Haidian District, Beijing 100193, China
*
Author to whom correspondence should be addressed.
Fermentation 2024, 10(4), 205; https://doi.org/10.3390/fermentation10040205
Submission received: 1 February 2024 / Revised: 29 March 2024 / Accepted: 31 March 2024 / Published: 10 April 2024
(This article belongs to the Section Industrial Fermentation)

Abstract

:
This study investigates the impact of varying concentrate levels in the diets of Angus beef cattle on their performance, nutrient digestion, and metabolism during the growth (7 to 12 months) and fattening (13 to 30 months) phases. Fifteen Angus steers were continuously fed and divided into low-concentrate (L) and high-concentrate (H) groups based on the fattening period and dietary formulations. Throughout each 9-week trial phase, a comprehensive range of parameters was systematically measured, including dry matter intake (DMI), average daily gain (ADG), gain-to-feed ratio (G/F), blood parameters, rumen fluid composition, and microbial diversity. In the fattening phases, an increase in concentrate levels resulted in a significant rise in the cattle’s DMI. Although there was a minor increase in ADG compared to the growing phases, this increase was not statistically significant. The efficiency of nitrogen (N) utilization in the cattle decreased, accompanied by a significant reduction in the apparent digestibility of nutrients. Ruminal fermentation produced more energy substances; however, there was a notable decrease in the abundance of fiber-decomposing microbes (such as the NK4A214_group, Ruminococcus, Papillibacter, and Acetitomaculum) and a significant increase in the abundance of starch-degrading microbes (including Bacteroidota and Prevotellaceae). Additionally, there was a significant reduction in the abundance of immune system-related functional pathways. This suggests that high-concentrate fattening does not necessarily lead to improved growth performance and may negatively affect metabolic health and nutrient digestion.

1. Introduction

ADG is a critical attribute influencing the performance and economic efficiency of beef cattle [1]. In the fattening phase, it is common practice to feed beef cattle high-energy, grain-based rations that include grain processing by-products. However, as the proportion of grain-based diets and their by-products increases, variations in dietary utilization among beef cattle can occur. This variability may lead to reduced feed efficiency, impaired muscle development, and lower meat quality [2,3].
Increasing the levels of dietary concentrate and ruminal energy density in beef cattle can enhance feed efficiency and ADG. However, as body weight and age increase, a significant deceleration in growth rate becomes evident [4].
Rumen bacterial microorganisms play a crucial role in feed digestion and nutrient metabolism. The composition and abundance of the rumen microbiota may vary across different stages of fattening, reflecting alterations in feed composition and rumen pH [5,6].
As the level of dietary concentrates increases, rumen microorganisms break down a variety of fermentable substrates, leading to a marked increase in volatile fatty acids (VFAs) and a decrease in rumen pH. When this exceeds the rumen’s absorption capacity, it can result in rumen acidosis and damage to the rumen epithelium, ultimately impairing animal performance [7,8,9,10].
Serum biochemical indices are vital indicators of metabolic status and health in beef cattle, reflecting their nutritional status and overall metabolic well-being [11].
Furthermore, high concentrate levels may compromise diet digestibility in beef cattle [12,13]. Research indicates that energy intake does not always linearly correlate with energy-generated weight gain; in fact, increased weight gain may shift the balance from lean to adipose tissue [14,15].
Given that feed costs represent the largest expense in production, it is crucial to develop a cost-effective feeding program that maximizes feed conversion efficiency while avoiding overfeeding and the accumulation of excessive subcutaneous fat [16,17]. Consequently, examining changes in production performance, nutrient digestion, and metabolism during the fattening phase is essential for achieving optimal fattening outcomes and minimizing costs. Additionally, understanding the variances in production performance, rumen fermentation parameters, rumen microbiota, and serum biochemical indices between the growing and fattening periods is key to effective beef cattle fattening management [18,19].
This study is designed to systematically assess the changes in production performance, rumen fermentation parameters, rumen bacterial microbiota, serum biochemical indices, and apparent nutrient digestibility in beef cattle throughout the growing and fattening periods. Our goal is to offer scientific insights that will inform beef cattle fattening management and aid in the optimization of feeding strategies.

2. Materials and Methods

2.1. Experimental Animals and Feeding Management

Fifteen Angus beef cattle, each in good body condition and health and aged between 185 to 225 days (with an average weight of 573.571 ± 53.35 kg), were selected for the study. These cattle were housed in pens equipped with an automated feed intake recording system, designed by Shanghai Zhenghong Farming Machinery Equipment Co., Ltd. (Shanghai, China) [20]. Each pen featured 10 feed bunks to precisely measure the daily feed intake of each animal. The study spanned 144 days, consisting of a 14-day preliminary phase; a 63-day growth period (L group), where cattle transitioned from a low-concentrate to a high-concentrate diet over 60 days; and a 62-day fattening period (H group). During this time, the cattle were provided with a total mixed ration (TMR) formulated in accordance with NASEM (2016) guidelines [21]. Water was made available ad libitum. The TMR was distributed at 8:00 AM and 4:00 PM daily, utilizing a 35 m3 Omas vertical diet-feeder (Codogno, Italy) equipped with a “beef-specific auger”.
The TMR was systematically collected every four weeks, dried at 60 °C for 48 h to produce air-dried samples, and then analyzed for standard nutritional components. TMR and leftover samples were collected biweekly and dried at 105 °C for 24 h to determine their dry matter content, aiding in the calculation of the cattle’s daily DMI. The comprehensive composition and nutritional levels of the diets are detailed in Table 1. The analysis of dry matter (DM), crude protein (CP), and starch was performed in accordance with the Association of Official Agricultural Chemists (AOAC) guidelines [22], while neutral detergent fiber (NDF) determination was conducted using the method established by Van Soest et al. [23]; crude fat (EE) content was determined using a Soxhlet extractor (New York, NY, USA).

2.2. Experimental Design

This study was conducted with the approval of the Animal Welfare and Ethical Committee of China Agricultural University (Protocol No. AW08059102-3). The beef cattle were weighed in the morning before feeding on the first two days, the 31st and 32nd days, and the 62nd and 63rd days of both the pre-fattening and post-fattening periods to record weight data for ADG calculations. The daily feed intake of each animal was measured using an automated feed intake recording system, and together with the determined dry matter content of the feed, the daily DMI was calculated. The gain-to-feed ratio (G/F) was derived from the ADG and DMI figures. Based on the dietary concentrate level, the beef cattle were divided into two groups: low-concentrate (L, growing period) and high-concentrate (H, fattening period) fattening periods. During the growth and fattening periods, blood, rumen fluid, and feces samples were collected from the cattle for analysis of serum biochemical parameters and rumen fermentation. The study employed paired t-tests and correlation analyses to examine the relationships between production performance and nutrient metabolism at different fattening stages. The calculations were as follows:
ADG (kg/day) = (Final weight − Initial weight)/Number of experimental days;
DMI (kg) = Daily feed intake × Dry matter content of the feed;
G/F = ADG/DMI.

2.3. Sample and Data Collection

Throughout the growth and fattening periods, rumen fluid samples were collected from the cattle early in the morning before feeding, utilizing an oral rumen cannula. After filtering these samples through medical gauze, they were placed into screw-capped cryovials and immediately submerged in liquid nitrogen for preservation. Blood samples were obtained from the tail veins of the cattle, allowed to clot for 30 min, and then centrifuged at 4000 rpm for 10 min at a temperature of 4 °C. The serum separated by centrifugation was distributed into 0.5 mL centrifuge tubes and stored at −20 °C, awaiting further analysis of serum biochemical and antioxidant parameters. A group of five students, assigned to conduct the experiment, was responsible for this sample collection process.

2.4. Serum Indices Measure

Serum analysis was performed using commercial kits according to the manufacturer’s guidelines, covering total protein (TP), albumin (ALB), globulin (GLB), total bilirubin (TBIL), blood urea nitrogen (BUN), and blood glucose (GLU). Serum antioxidant levels were evaluated using a colorimetric method, employing a reagent kit from the Nanjing Jiancheng Bioengineering Institute, with total antioxidant capacity (T-AOC) as the specific index measured. The pH of the rumen fluid was determined using a pH meter (model PHS-3C, produced by Shanghai Laiyi Instrument Factory, Shanghai, China). The ammonia nitrogen (NH3-N) concentration was assessed via the phenol-hypochlorite sodium colorimetric method [24]. Total volatile fatty acid (TVFA) concentrations were quantified using gas chromatography [25].

2.5. Apparent Digestibility of Nutrients

The apparent digestibility of nutrients was assessed using the acid insoluble ash (AIA) method. The AIA content in both the diet and feces was determined according to Vogtmann et al. [26]. The analyses of dry matter (DM) and crude protein (CP) adhered to the guidelines set forth by AOAC (2000), while the neutral detergent fiber (NDF) analysis was conducted using the method developed by Van Soest et al. [23]. The apparent digestibility of nutrients was calculated using the following formula:
Apparent digestibility of a nutrient (%) = 100 × [1 − (RAIA/MAIA × Mn/Rn)]
where RAIA is the AIA content in the diet, MAIA is the AIA content in the feces, Mn is the content of a specific nutrient in the feces, and Rn is the content of the same nutrient in the diet.

2.6. 16S rRNA Sequencing

DNA was extracted, PCR amplified, and sequenced according to the protocol described by Yi et al. [27]. The sequences obtained were first demultiplexed, then merged using FLASH (v1.2.7) [28], and cleaned with fastp (v0.19.6) [29]. High-quality sequences underwent denoising with the DADA2 plugin [30] within the Qiime2 [31] (version 2020.2) pipeline, achieving single nucleotide resolution based on sample error profiles. This process produces amplicon sequence variants (ASVs), which are denoised sequences. Taxonomic classification of ASVs was performed using the naive Bayes consensus taxonomy classifier in Qiime2, referencing the SILVA 16S rRNA database (v. 138). The Alpha Diversity Index and the count of observed ASVs were used to assess the gut bacterial community’s diversity. Comparative analysis across samples utilized the Wilcoxon rank-sum test, while Beta diversity was analyzed to identify differences in the main components. The weighted UniFrac dissimilarity index facilitated the examination of bacterial community structure changes between the growing and fattening periods in cattle, using principal coordinates analysis (PCoA) and PERMANOVA. For simplicity, less abundant groups were categorized under “others” for clearer data representation. Significant differences in bacterial communities between the growing and fattening phases, focusing on taxa with a mean relative abundance greater than 0.1% in any group, were identified using the Wilcoxon rank-sum test or Mann–Whitney U test, with p < 0.05 considered statistically significant. LEfSe was employed to pinpoint taxa associated with specific conditions, using a logarithmic LDA score threshold of 4.0 for discriminative biomarkers.
Metagenomic predictions were made using PICRUSt (version 1.1.1), after normalizing for 16S rRNA gene copy numbers, to aggregate KEGG genes into metabolic pathways. The differential enrichment of pathways between the growing and fattening phases was determined using the Wilcoxon rank-sum test. Additionally, functional predictions of microbial communities from both growing and fattening cattle were analyzed using PICRUSt2 (version 2.2.0), in combination with the rank-sum test, to provide insights into microbial functions related to cattle development stages.

2.7. Data Statistical Analysis

A total of 29 rumen fluid samples were analyzed to study the rumen microbiota, comprising 15 samples from growing beef cattle and 14 from fattening beef cattle; one sample was missing due to an oral injury in one animal. For the analysis of growth performance, serum biochemical indices, rumen fluid fermentation parameters, and apparent nutrient digestibility, initial data organization was conducted using Excel 2019. Statistical analyses, including paired t-tests (Student’s t-test), were performed with the SAS 9.4 software. Statistical comparisons involved the Wilcoxon rank-sum test and the Mann–Whitney U test for evaluating differences in bacterial communities between the growing and fattening phases, and the Wilcoxon rank-sum test for assessing differentially enriched metabolic pathways between the groups. Adjustments for multiple comparisons were made using the false discovery rate (FDR) correction method. Results are expressed as mean ± standard error of the mean (SEM). A significance level of p < 0.05 was set for all analyses, with p < 0.01 indicating highly significant differences, and 0.05 < p < 0.1 suggesting trends.

3. Results

3.1. The Production Performance and Serum Biochemical Indicators in Angus Beef Cattle Undergo Significant Changes during the Growth and Fattening Periods

As shown in Table 2, during the fattening period, the DMI of Angus beef cattle significantly increased (p < 0.01). Although production performance indicators, including ADG and G/F, showed an upward trend, they did not reach statistical significance (p > 0.05). Notably, levels of serum TP, GLB, urea, and T-AOC significantly rose (p < 0.01). Conversely, TBiLL levels significantly decreased (p < 0.05). Additionally, GLU levels markedly reduced during this period (p < 0.01).

3.2. Rumen Fermentation Parameters

As shown in Table 3, during the fattening period of Angus beef cattle, there was a significant increase in the concentration of NH3-N in the rumen fluid, alongside a notable decrease in pH value (p < 0.01). The levels of TVFAs, such as acetate, propionate, butyrate, iso-valerate, and valerate, increased relative to the growth phase, while the level of isobutyrate decreased. However, these changes in TVFA concentrations did not reach statistical significance. The concentrations of butyrate and isovalerate showed an upward trend (0.05 < p < 0.10). The acetic acid to propionic acid (A/P) ratio significantly increased (p < 0.05); the molar percentage of propionate significantly decreased (p < 0.05). Conversely, the molar percentage of butyrate saw a significant increase (p < 0.01); the molar percentage of valerate exhibited a decreasing trend (0.05 < p < 0.10).

3.3. Nutrient Digestibility

As shown in Table 4, DMD, CPD, and NDFD significantly decreased (p < 0.01) during the fattening period.

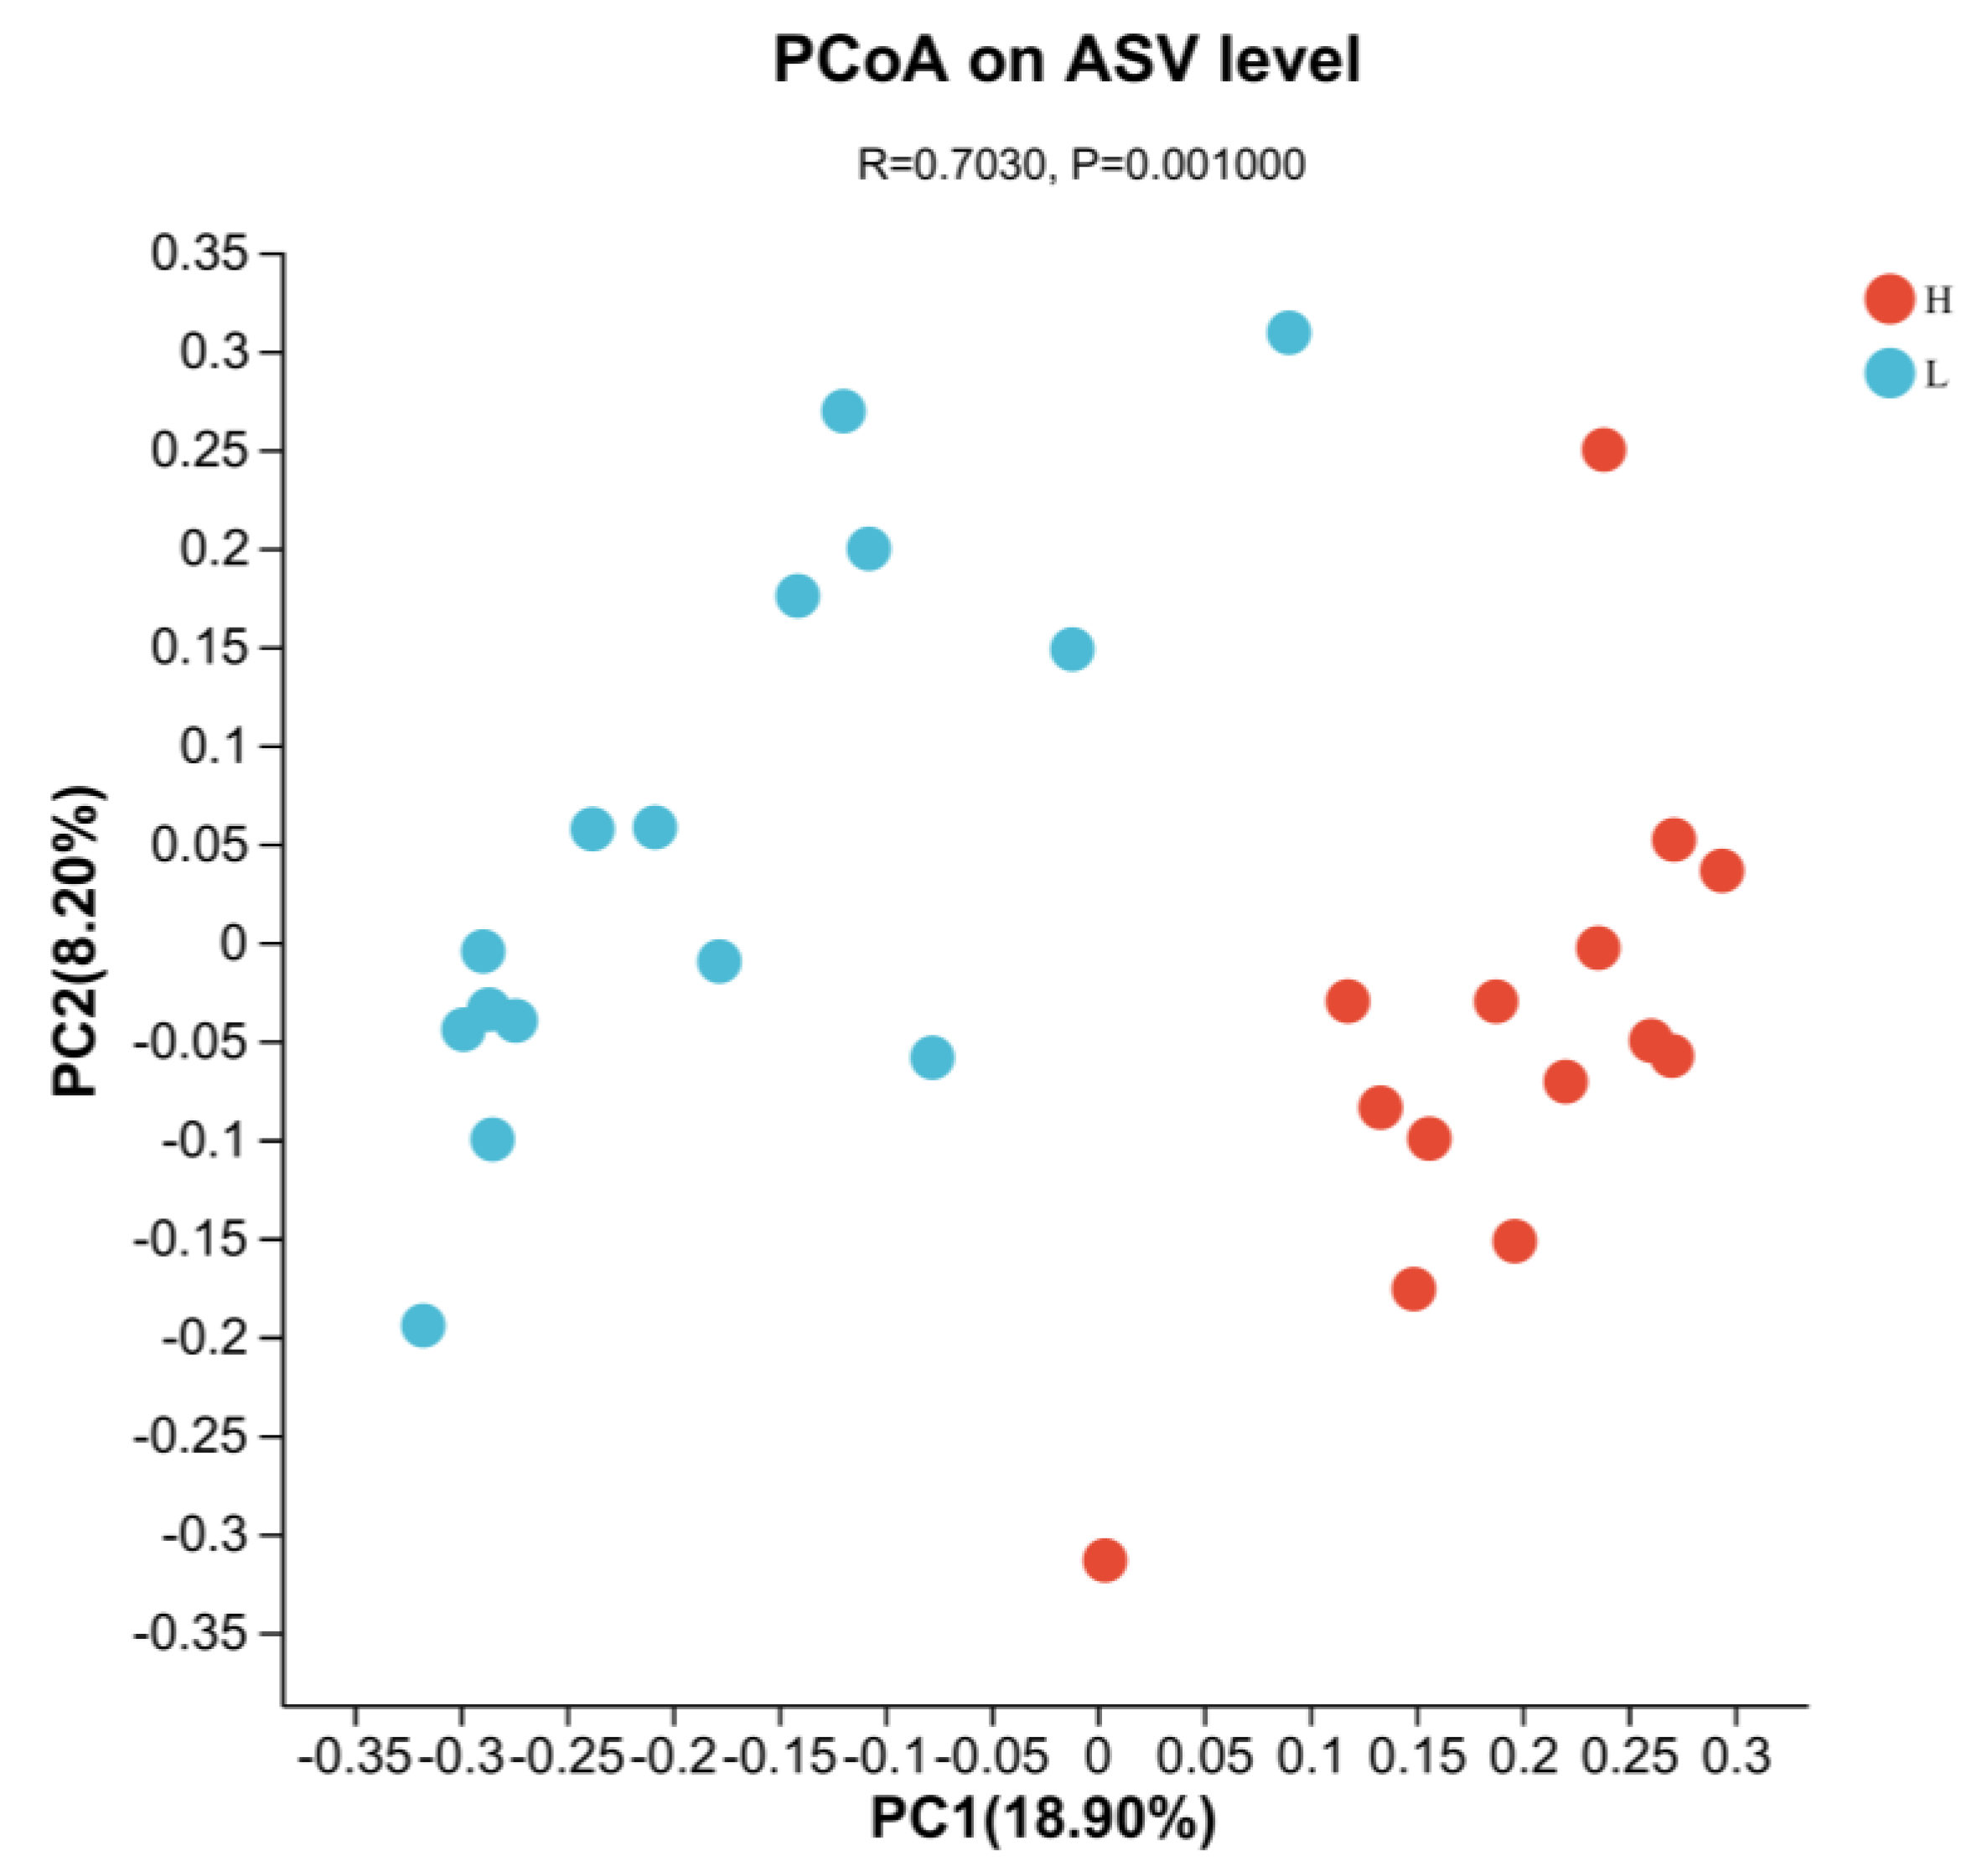
3.4. Indicators of Rumen Microbiota

During the fattening period, there was a notable increase in the richness indexes of the rumen fluid microbial community in beef cattle, with indices reflecting community richness—such as observed species (sobs), Chao1 (chao), and ACE—showing a highly significant rise (p < 0.01). However, metrics assessing community evenness, including Simpson’s evenness (simpsoneven) and Shannon’s evenness (shannoneven), experienced a significant decrease (p < 0.05). This suggests a less uniform distribution of microbial species despite the increased richness. The phylogenetic diversity (PD) index, evaluating the range of phylogenetic lineages within the community, demonstrated a significant increase (p < 0.01), indicating a broadening of evolutionary diversity. Similarly, the Shannon index, which combines species richness and evenness to gauge overall community diversity, also saw a significant uplift (p < 0.01), as shown in Table S1.
From the principal coordinates analysis (PCoA) plot, there was a significant deviation (R = 0.7030, p = 0.001) between the confidence ellipses of the bacterial communities during the fattening (H) and growth (L) periods. This marked deviation signifies a significant change in the bacterial community during the late fattening period compared to the growth period, as depicted in Figure 1.

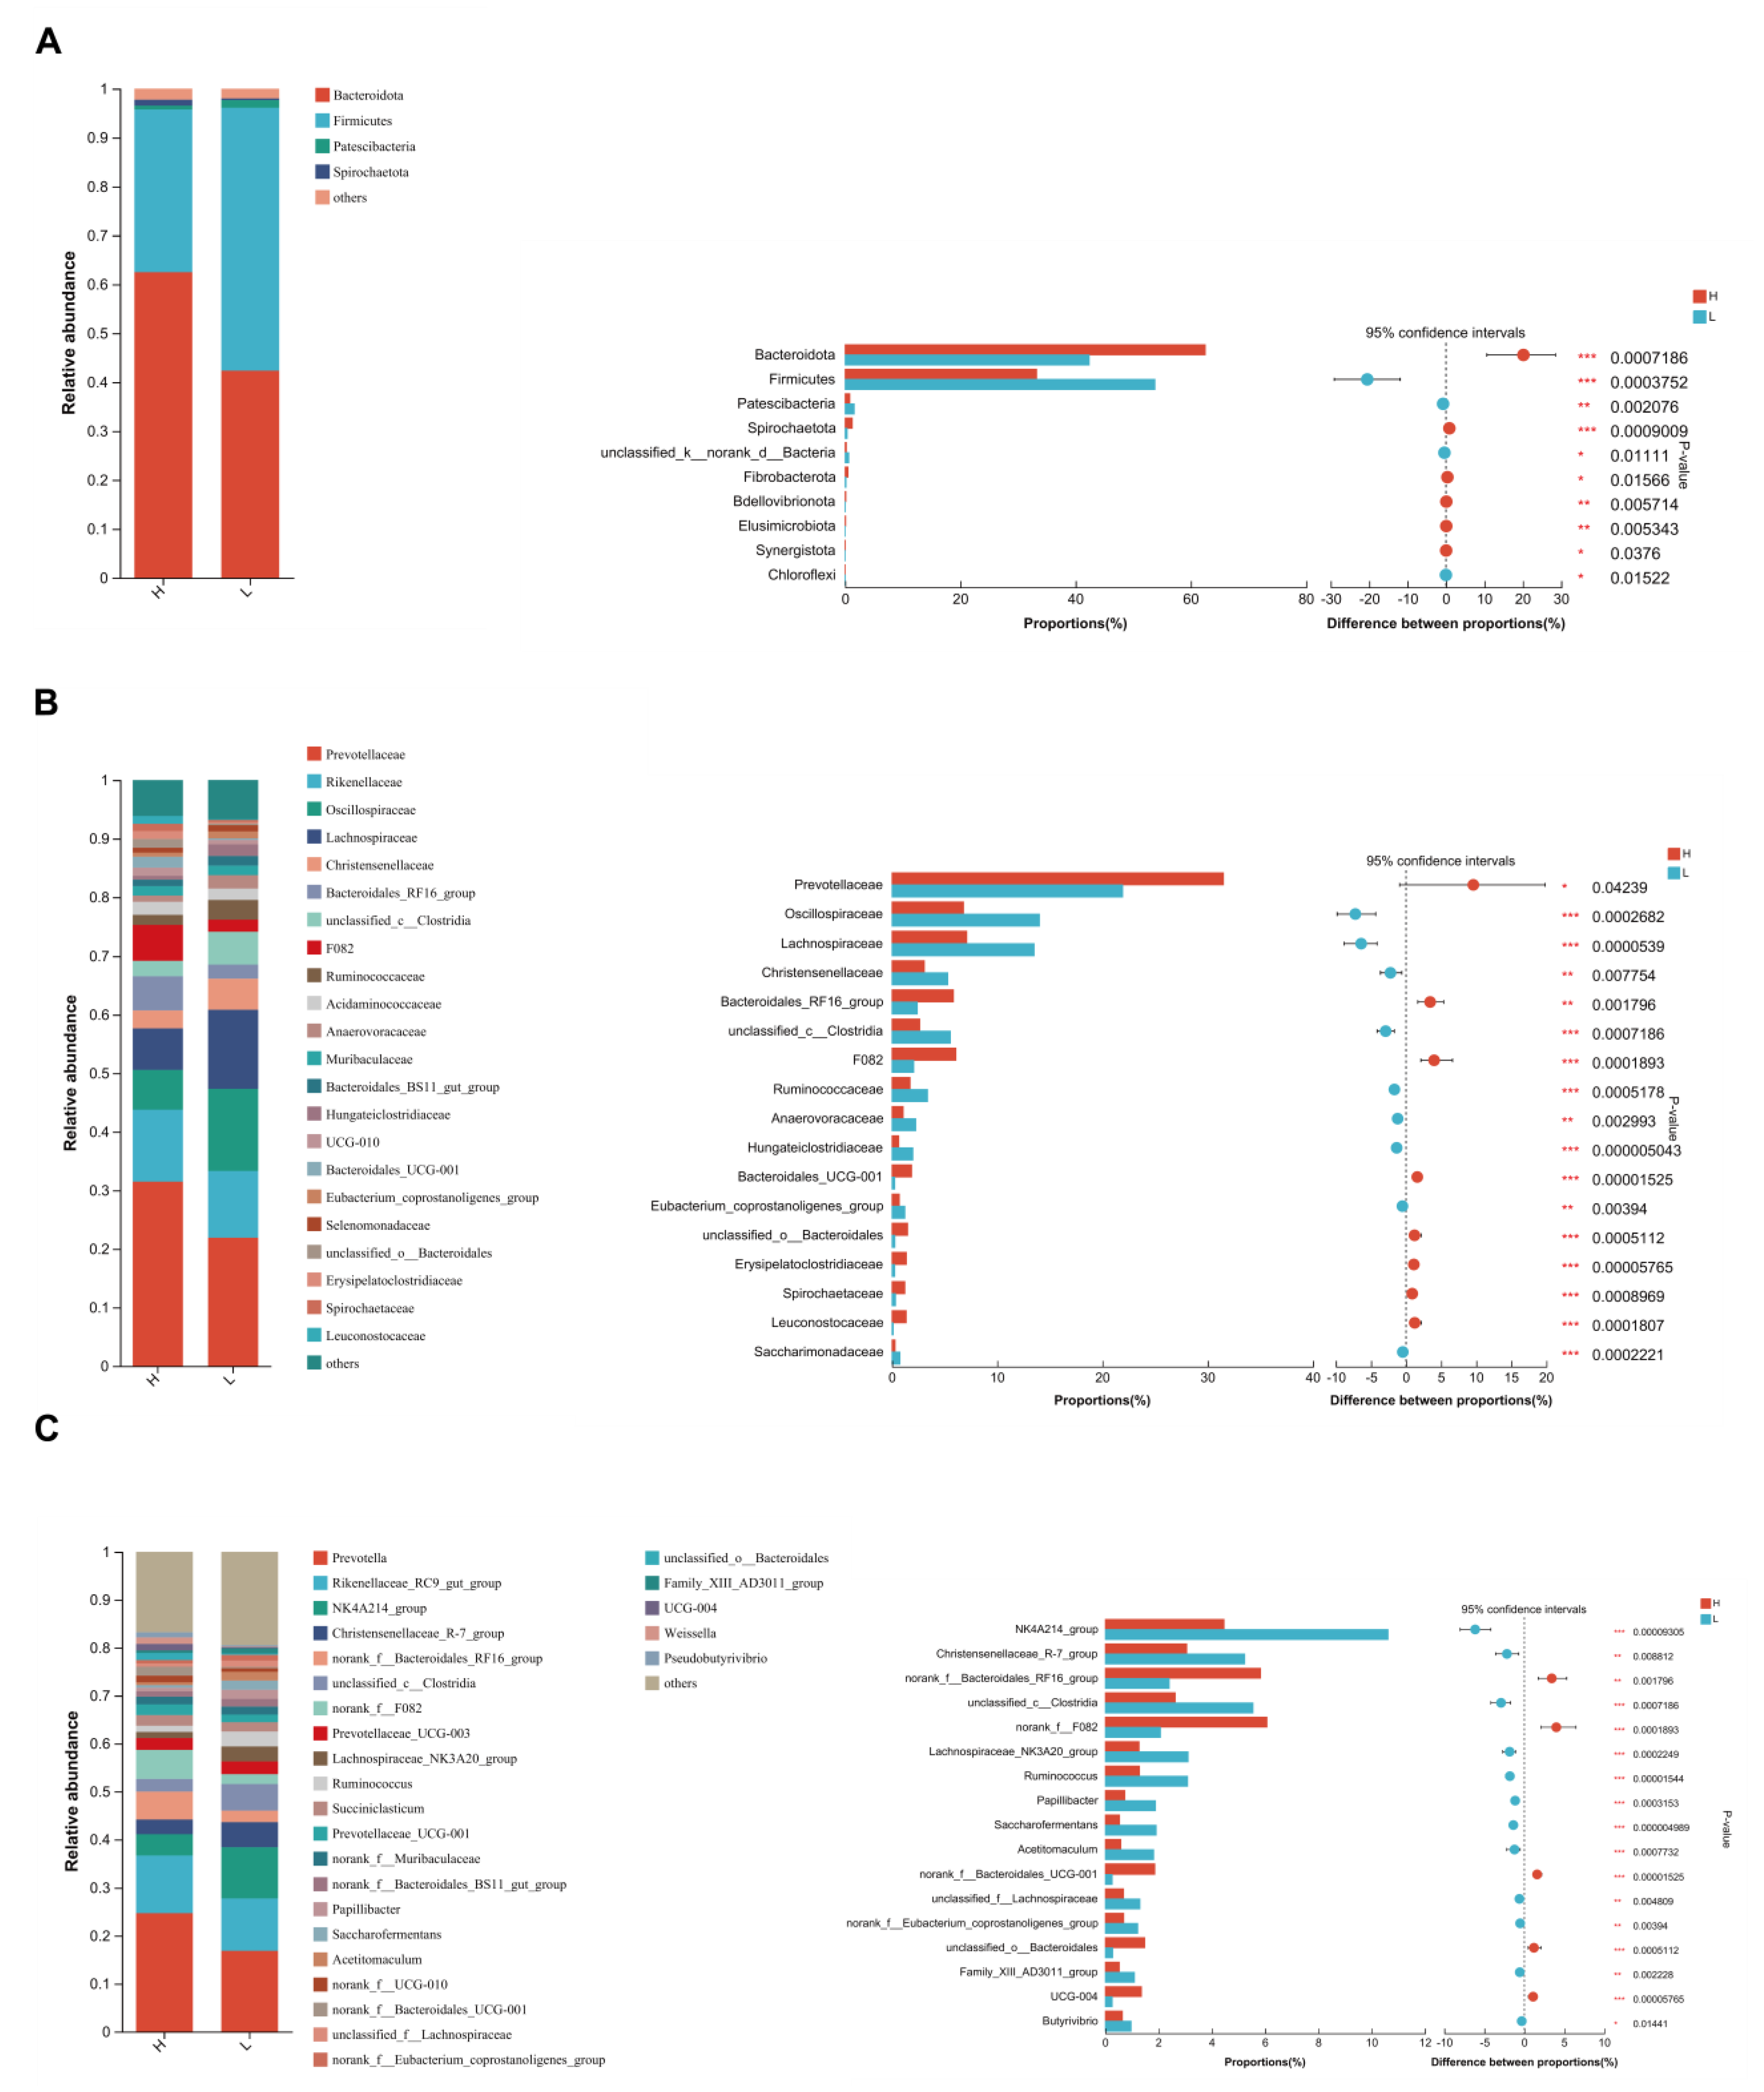
3.5. Significant Alterations of Bacterial Taxonomic Composition in Growing and Fattening Period

During the fattening period, analysis at the phylum level through Wilcoxon tests indicated a significant decrease in the abundance of Firmicutes, Patescibacteria, unclassified_k_norank-d_Bacteria, and Chloroflexi (p < 0.05). Conversely, there was a significant increase in Bacteroidota, Spirochaetota, Fibrobacterota, Bdellovibrionota, Elusimicrobiota, and Synergistota (p < 0.05).
At the family level, the fattening period saw significant enrichment in Prevotellaceae, Bacteroidales_RF16_group, F082, Bacteroidales_UCG-001, unclassified_o__Bacteroidales, Erysipelatoclostridiaceae, Spirochaetaceae, and Leuconostocaceae (p < 0.05). In contrast, during the growing period Oscillospiraceae, Lachnospiraceae, Christensenellaceae, unclassified_c__Clostridia, Ruminococcaceae, Anaerovoracaceae, Hungateiclostridiaceae, Eubacterium_coprostanoligenes_group, and Saccharimonadaceae were significantly more abundant (p < 0.05).
At the genus level, during the fattening period there were significant reductions in the relative abundance of the NK4A214_group, Christensenellaceae_R-7_group, unclassified_c__Clostridia, Lachnospiraceae_NK3A20_group, Ruminococcus, Papillibacter, Saccharofermentans, Acetitomaculum, unclassified_f__Lachnospiraceae, norank_f__Eubacterium_coprostanoligenes_group, Family_XIII_AD3011_group, and Butyrivibrio (p < 0.05). Meanwhile, significant increases were observed in norank_f__Bacteroidales_RF16_group, norank_f__F082, norank_f__Bacteroidales_UCG-001, unclassified_o__Bacteroidales, and UCG-004 (p < 0.05), as depicted in Figure 2.

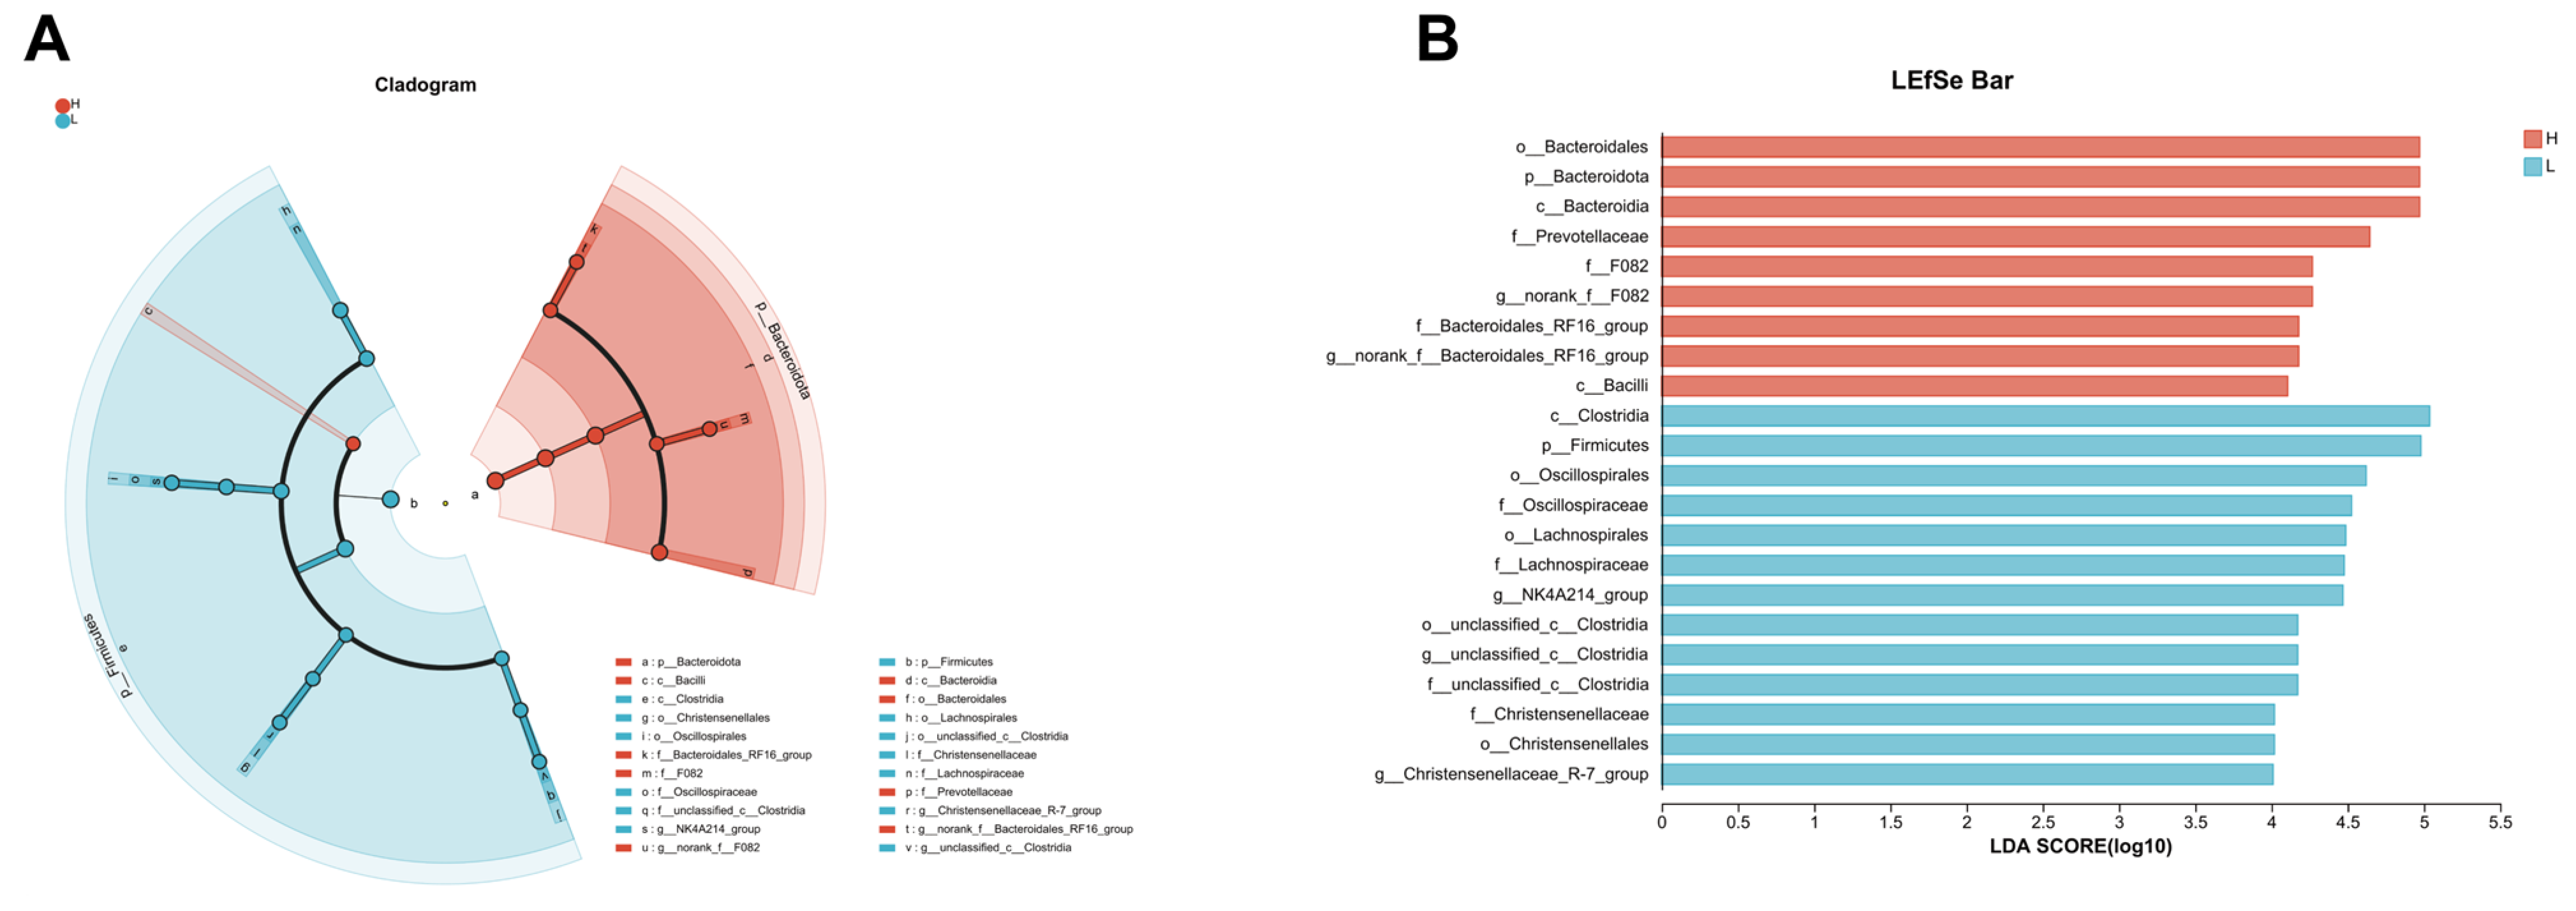
3.6. LEfSe Analysis Reveals Distinct Microbial Profiles between Growing and Fattening Period from Phylum to Genera Level

During the fattening period, Bacteroidales, Bacteroidota, Bacteroidia, and Prevotellaceae were significantly enriched in the rumen fluid of beef cattle. However, the growing period exhibited an enrichment of microorganisms such as Clostridia, Firmicutes, Oscillospirales, Oscillospiraceae, Lachnospirales, Lachnospiraceae, and NK4A214_group (LDA > 4.5, Figure 3).

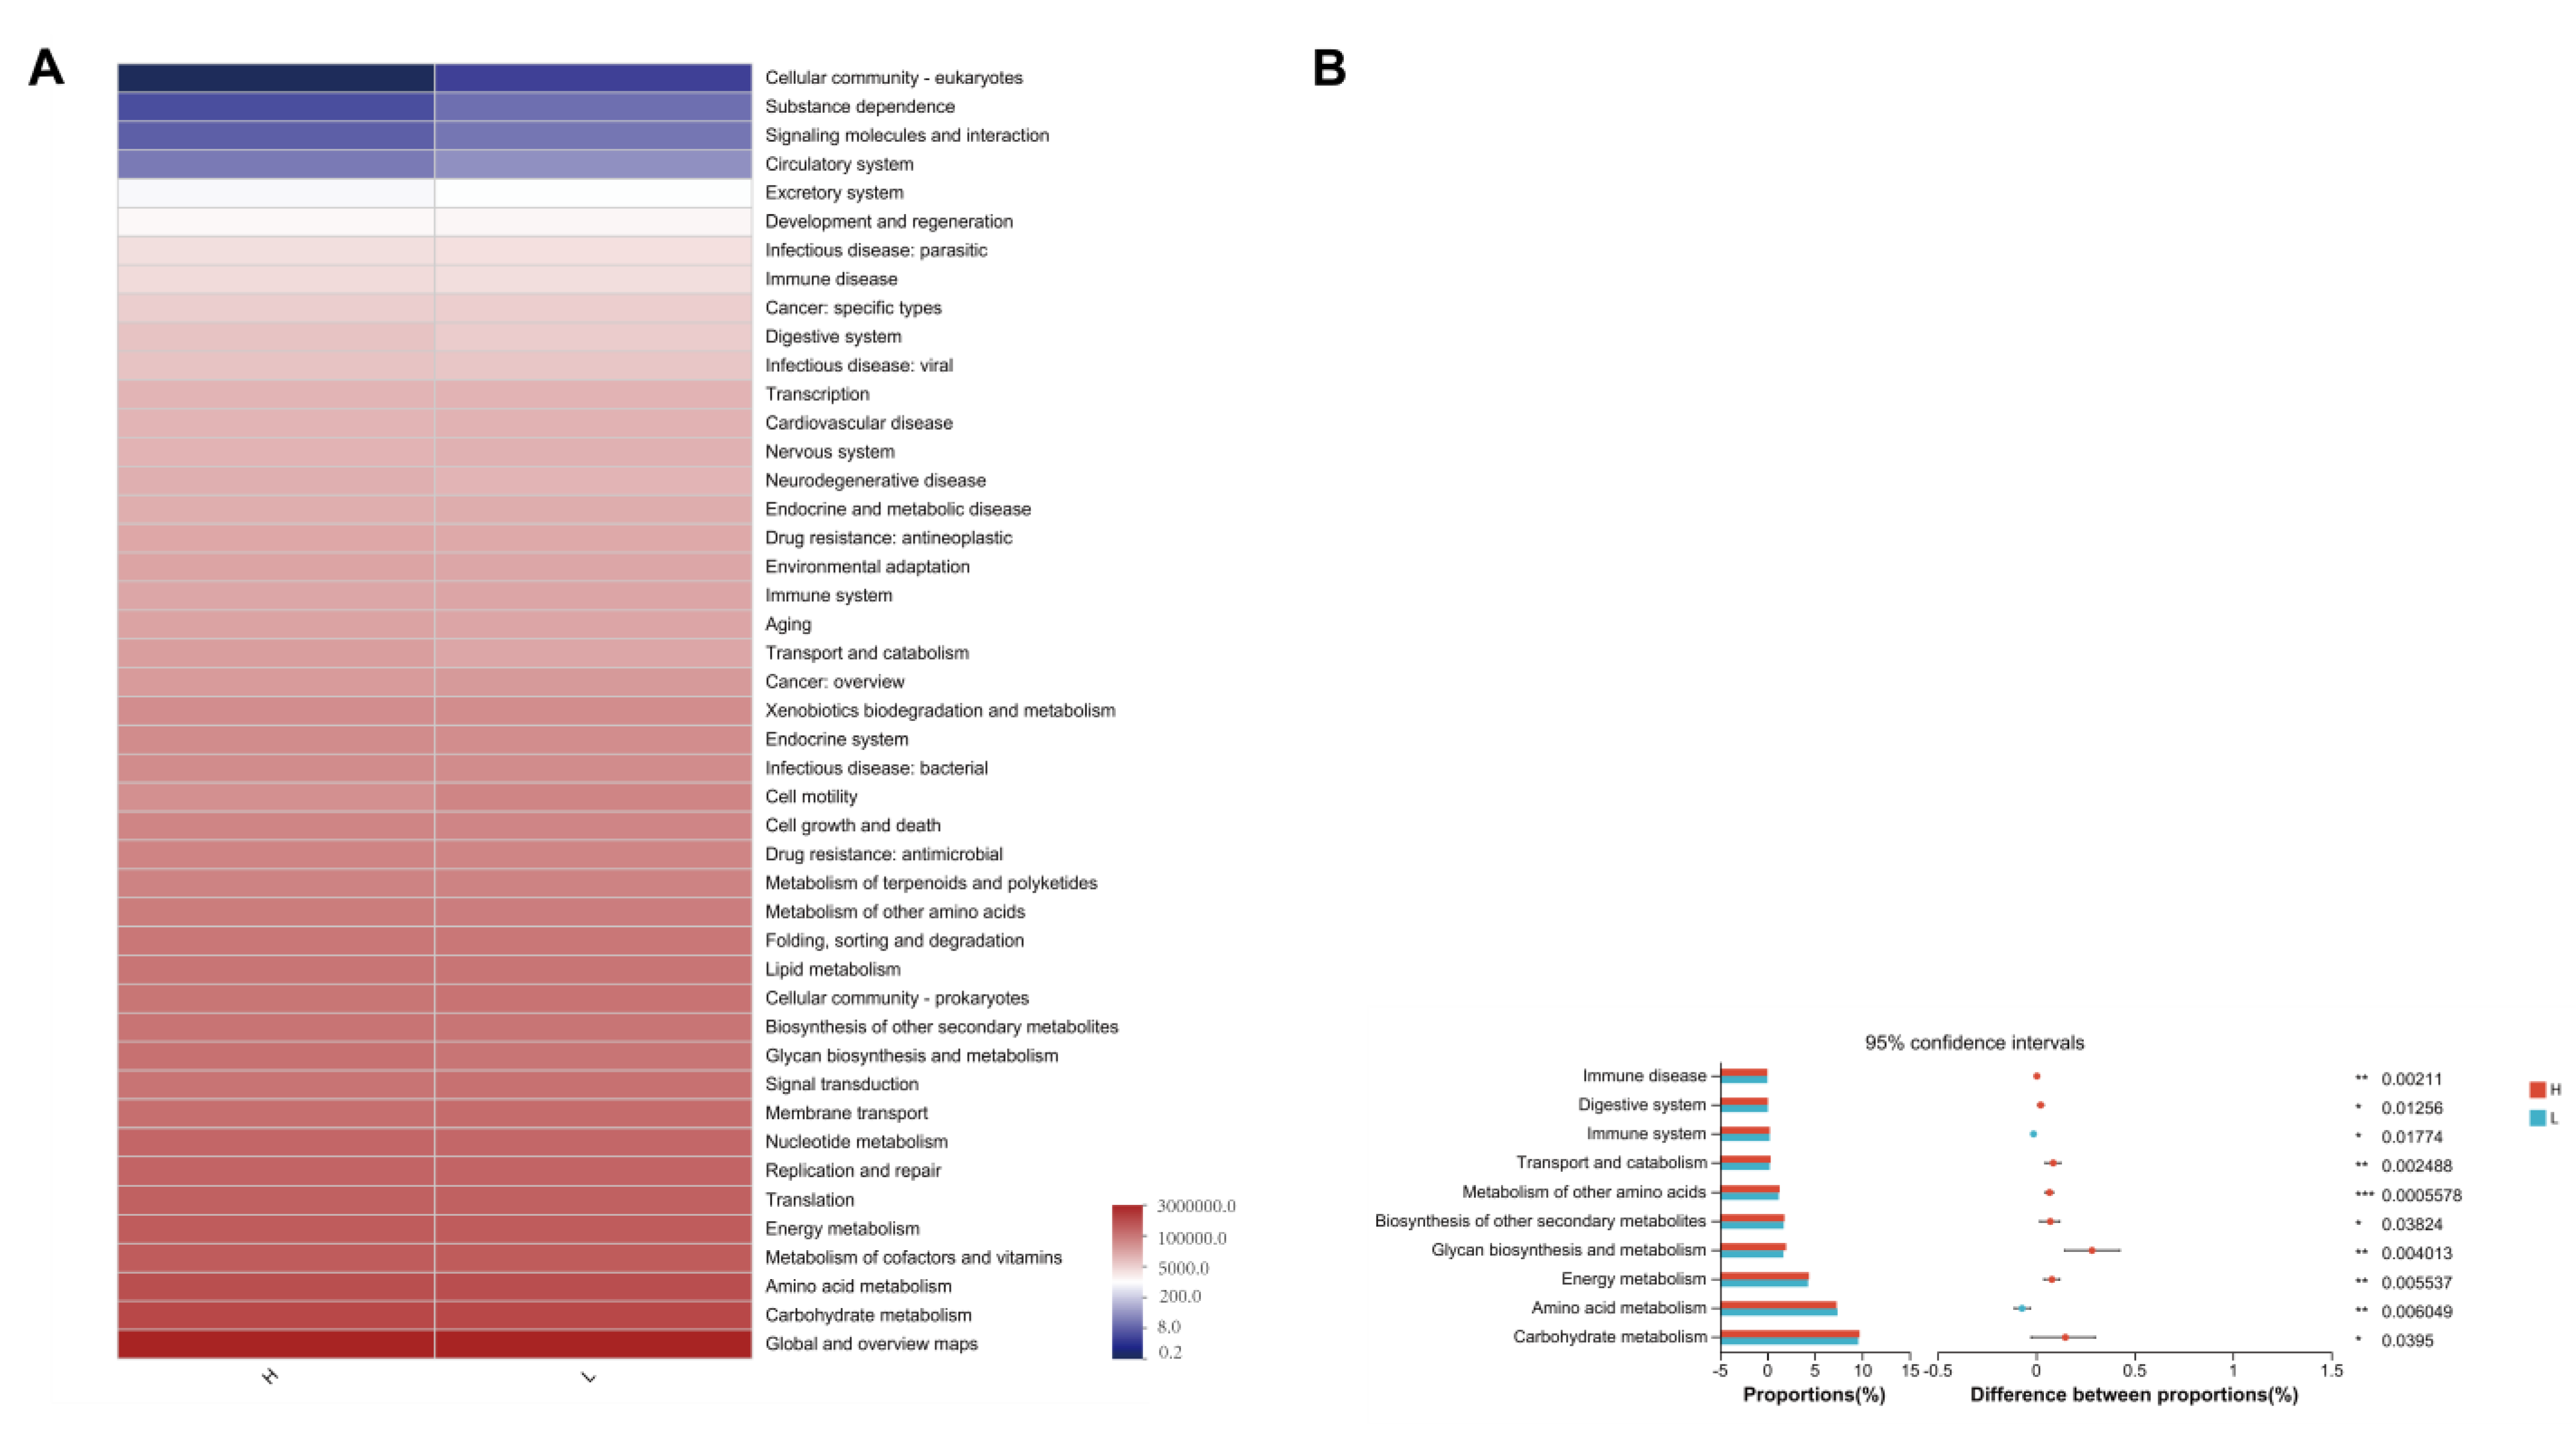
3.7. 16S rRNA Functional Prediction

The functional abundance of KEGG orthologs (KOs) was predicted using PICRUSt2 based on marker gene (16S) sequences for functional analysis. The rank-sum test was then applied to the predicted functional pathways (Figure 4). The study employed PICRUSt2 and the KEGG database to anticipate potential functional changes in the microbiome between the growing and fattening periods. The analysis identified ten predicted pathways (defined by KEGG level 2) that exhibited differential abundance between the two groups.
During the fattening period, cattle showed enrichment in pathways related to immune disease, digestive system, transport and catabolism, metabolism of other amino acids, biosynthesis of other secondary metabolites, glycan biosynthesis and metabolism, energy metabolism, and carbohydrate metabolism (p < 0.05). However, pathways associated with immune system and amino acid metabolism were found to be lower in abundance compared to the growing period (p < 0.05).

4. Discussion

In this study, we observed a paradox where increasing the concentrate level in beef cattle diets during the fattening period did not correspond with anticipated improvements in weight gain and feed efficiency. This discrepancy can be attributed to several interrelated factors.
During the fattening period, despite the increase in TMR energy and DMI, the expected rise in utilization did not materialize. Specifically, there was a significant increase in DMI (p < 0.01) and energy intake during the fattening phase, yet this did not translate into a marked improvement in productivity (Table 1 and Table 2). When assessing the apparent digestibility of beef cattle diets across both growth and fattening phases, we observed significant reductions in the digestibility of essential nutrients such as dry matter, crude protein, and neutral detergent fiber (p < 0.01) during the fattening period (Table 4). Prior research has demonstrated that an uptick in DMI typically leads to diminished digestibility, largely due to decreased rumen retention time, consequently impairing the efficiency of nutrient digestion and absorption [32,33]. This signifies that simply elevating the feed’s energy level and intake does not ensure efficient nutrient utilization and effectiveness in the fattening process. Fattening efficiency involves more than just focusing on DMI and dietary energy levels; it also requires a careful balance between their digestibility and the animals’ capacity to efficiently convert feed into body weight gain.
Additionally, during the fattening period, there was a decrease in the metabolic status and nutrient transport capacity of beef cattle (Table 2). This period also saw changes in the immune response and protein metabolism. Serum bilirubin, known to induce gene transcription promoting fat oxidation, and thus, reducing lipid accumulation [34,35], was significantly reduced during fattening (p < 0.05). This reduction suggests an increase in fat deposition. Concurrently, significant increases in serum GLB and T-AOC (p < 0.01) indicate alterations in immune responses and an upsurge in antioxidant activities [36]. Blood urea nitrogen, a product of amino acid deamination, reflects protein and amino acid metabolism as well as ammonia absorption by the rumen. It is a crucial indicator of protein metabolism in ruminants, inversely related to internal nitrogen deposition and protein utilization [37]. A significant increase in serum urea levels (p < 0.05) during the fattening period indicates lower utilization rates of dietary nitrogen and proteins. Moreover, the rumen is instrumental in feed digestion, production of volatile fatty acids (VFAs), and synthesis and absorption of microbial proteins (MCPs), acting as a critical physical and immune barrier in ruminants [38]. During fattening, there was a significant reduction in the abundance of functional pathways related to immune system and amino acid metabolism (p < 0.05), while pathways associated with immune diseases saw a significant increase (p < 0.01). This suggests a decline in immune function and nitrogen use efficiency during fattening, coupled with increased energy expenditure on immune responses in beef cattle (Figure 4B). In ruminants, the main source of glucose is gluconeogenesis, with propionate acting as a crucial substrate [39]. However, during the fattening period, the concentration of propionate in the rumen fluid of beef cattle did not significantly increase, while blood glucose levels significantly decreased (p < 0.05), which also indicates a reduced efficiency in the conversion of energy substances during the fattening period of beef cattle.
Rumen fermentation parameters such as pH value, NH3-N, and volatile fatty acids (VFAs) reflect the conditions of rumen fermentation and the overall health of the animal [40]. During the fattening period, pathways related to beef cattle digestion, energy metabolism, and carbohydrate metabolism significantly increased (p < 0.01, Figure 4B). At the same time, an increase in the concentration of TVFAs and a significant decrease in pH value (p < 0.01), along with a significant rise in NH3-N levels (p < 0.01), indicate that rumen fermentation produced more energy substrates (Table 3). Ammonia provides a nitrogen source for the synthesis of MCPs [41], which flow into the small intestine and become an essential component of nitrogen storage within the animal body. Previous research has shown that increasing dietary protein and available energy intake can lead to simultaneous increases in rumen NH3-N concentration and microbial protein production in sheep [42], consistent with our findings. However, we also observed a trend toward acetate fermentation in the rumen. Typically, forage and roughage fermentation primarily produce acetate and butyrate, while starch and concentrate feed fermentation mainly produce propionate. This shift may be due to the finer particle size of concentrates, leading to accelerated passage through the rumen and insufficient concentrate digestion within the rumen; moreover, the Prevotellaceae, which utilize various substrates such as cellulose, starch, and protein to mainly produce acetate and succinate [43], saw a significant increase in abundance in the rumen of fattening beef cattle (p < 0.01, Figure 2B), potentially explaining the shift toward acetate fermentation.
During the fattening period, there were significant changes in the diversity and composition of the rumen microbiome in beef cattle (Figure 1, Table S1). As the level of concentrate in the diet increased, there was an increase in the diversity and richness of the rumen microbes. According to the theory proposed by Shabat et al. [44], a simpler rumen microbiome, with more specialized functions, can produce more metabolites that promote growth, the increased microbial diversity observed during the fattening period might not be beneficial for the transformation of ruminal nutrients. There was a significant enrichment in the abundance of Bacteroidota and a significant decline in the abundance of Firmicutes (Figure 2A and Figure 3B). The reduction in cellulolytic bacteria, such as Ruminococcus, correlates with the increased concentration of concentrates in the diet, while the decrease in beneficial bacteria, such as Lachnospiraceae and Christensenellaceae families, points to potential adverse effects on rumen health and nutrient absorption. This decline could hinder the absorption of essential nutrients and fat-soluble vitamins, ultimately impacting the overall health and growth performance of the cattle.
Members of the genus Bacteroides are involved in the degradation of biopolymers, primarily polysaccharides [45], and promote the fermentation of resistant starches, indigestible oligosaccharides and their derivatives, in the rumen for energy provision. This process correlates with the increased intake of starch and energy during the fattening period of beef cattle. The proportion of Prevotellaceae is positively associated with the animal’s feed intake traits; they can degrade and utilize starch and plant cell wall polysaccharides, such as xylan and pectin, though they are not capable of degrading cellulose [46]. They contribute to the carbohydrate and nitrogen metabolism of ruminants, synthesizing new peptides in the process. During the fattening period, the abundance of cellulose-degrading bacteria such as butyrate producers (Butyrivibrio and Papillibacter) [47], saccharide degradation (Ruminococcus, and Saccharofermentans) [48,49], as well as the Lachnospiraceae_NK3A20 group and Acetitomaculum, significantly decreases [50] (Figure 2). This suggests that their reduction is due to the lack of related substrates and the reduced efficacy of ruminal saccharide metabolism, reflecting changes in diet composition, specifically a decrease in fibrous content.
Christensenellaceae was enriched in individuals with low body mass index [51]. In addition, a notable protective association has been observed between the Christensenellaceae family and visceral fat [52]; the significant decrease in the abundance of the NK4A214 group and Christensenellaceae R-7 group, which play key roles in breaking down complex carbohydrates and producing propionate and butyrate, and the significant decrease in the abundance of Lachnospirillaceae, Ruminococcaceae, NK4A214_group, and Christensenellaceae_R-7_group, which are linked to the absorption of fat-soluble vitamins [53,54,55], suggests a potential decline in rumen health as fattening progresses (Figure 2C). The reduction in the abundance of these beneficial bacteria could impair the animal’s ability to absorb essential nutrients, potentially leading to a decline in overall health status.
In summary, to enhance the efficiency of high-concentrate fattening in beef cattle, it is crucial to maintain a balance between nutrient digestion and utilization rates, while also paying close attention to the health status of the rumen.

5. Conclusions

During the fattening period, rumen fermentation in beef cattle favors the fermentation of non-protein nitrogen and crude protein, leading to an increased abundance of microbes associated with the decomposition of proteins, polysaccharides, and starch, while the abundance of fiber-degrading microbes decreases. Despite a significant increase in DMI during the fattening period, the larger base weight of the cattle leads to higher energy requirements for maintenance. The decreased digestion rate of feed nutrients, coupled with elevated oxidative stress and immune responses, results in less net energy for weight gain, thus hindering the expected improvement in production performance.

Supplementary Materials

The following supporting information can be downloaded at: https://www.mdpi.com/article/10.3390/fermentation10040205/s1, Table S1: Alpha diversity index inter-group difference test results table.

Author Contributions

W.L. led the study design and data analysis, while both W.L. and B.Y. contributed to writing the manuscript. Z.Z. (Zhenming Zhou) and H.W. played significant roles in revising the manuscript. Individuals including B.W., X.Y., X.L., R.A., X.C., Z.Z. (Zhiyu Zhou), Y.C., X.Z., X.T., X.F. and N.L., were involved in conducting the feeding experiments and collecting samples. All authors have read and agreed to the published version of the manuscript.

Funding

This work was supported by the National Key R&D Program of China (2023YFD1301302) and the Government Purchase Service (Grant Number: 16200158, 16190050).

Institutional Review Board Statement

The animal study was reviewed and approved by the Animal Care Committee, China Agriculture University (Protocol No. AW08059102-3).

Informed Consent Statement

Not applicable.

Data Availability Statement

The original contributions presented in the study are publicly available. This data can be found at: https://www.ncbi.nlm.nih.gov/bioproject/PRJNA1072312.

Acknowledgments

We thank Xiaodong Li, the Beef Cattle Experimental Base of China Agricultural University (CAU), and Wanxiang Liu, Tingting Ning and Shuping Yang of the Beef Cattle Centre of CAU for their help with the feed chemical analysis and feeding experiments.

Conflicts of Interest

The authors declare no conflicts of interest.

References

  1. Xu, L.; Yang, L.; Wang, L.; Zhu, B.; Chen, Y.; Gao, H.; Gao, X.; Zhang, L.; Liu, G.E.; Li, J. Probe-Based Association Analysis Identifies Several Deletions Associated with Average Daily Gain in Beef Cattle. BMC Genom. 2019, 20, 31. [Google Scholar] [CrossRef] [PubMed]
  2. Krusinski, L.; Maciel, I.C.; Sergin, S.; Goeden, T.; Schweihofer, J.P.; Singh, S.; Rowntree, J.E.; Fenton, J.I. Fatty Acid and Micronutrient Profile of Longissimus Lumborum from Red Angus and Red Angus x Akaushi Cattle Finished on Grass or Grain. Foods 2022, 11, 3451. [Google Scholar] [CrossRef] [PubMed]
  3. Morittu, V.M.; Spina, A.A.; Iommelli, P.; Poerio, A.; Oliverio, F.V.; Britti, D.; Tudisco, R. Effect of Integration of Linseed and Vitamin E in Charolaise\times Podolica Bulls’ Diet on Fatty Acids Profile, Beef Color and Lipid Stability. Agriculture 2021, 11, 1032. [Google Scholar] [CrossRef]
  4. Crossland, W.L.; Jobe, J.T.; Ribeiro, F.R.; Sawyer, J.E.; Callaway, T.R.; Tedeschi, L.O. Evaluation of Active Dried Yeast in the Diets of Feedlot Steers—I: Effects on Feeding Performance Traits, the Composition of Growth, and Carcass Characteristics. J. Anim. Sci. 2019, 97, 1335–1346. [Google Scholar] [CrossRef] [PubMed]
  5. Chen, Y.; Penner, G.B.; Li, M.; Oba, M.; Guan, L.L. Changes in Bacterial Diversity Associated with Epithelial Tissue in the Beef Cow Rumen during the Transition to a High-Grain Diet. Appl. Environ. Microbiol. 2011, 77, 5770–5781. [Google Scholar] [CrossRef] [PubMed]
  6. Liu, J.; Bian, G.; Zhu, W.; Mao, S. High-Grain Feeding Causes Strong Shifts in Ruminal Epithelial Bacterial Community and Expression of Toll-like Receptor Genes in Goats. Front. Microbiol. 2015, 6, 167. [Google Scholar] [CrossRef] [PubMed]
  7. Owens, F.N.; Secrist, D.S.; Hill, W.J.; Gill, D.R. Acidosis in Cattle: A Review. J. Anim. Sci. 1998, 76, 275. [Google Scholar] [CrossRef]
  8. Bevans, D.W.; Beauchemin, K.A.; Schwartzkopf-Genswein, K.S.; McKinnon, J.J.; McAllister, T.A. Effect of Rapid or Gradual Grain Adaptation on Subacute Acidosis and Feed Intake by Feedlot Cattle. J. Anim. Sci. 2005, 83, 1116–1132. [Google Scholar] [CrossRef]
  9. Nagaraja, T.G.; Lechtenberg, K.F. Acidosis in Feedlot Cattle. Vet. Clin. N. Am. Food Anim. Pract. 2007, 23, 333–350. [Google Scholar] [CrossRef]
  10. Nagaraja, T.G.; Titgemeyer, E.C. Ruminal Acidosis in Beef Cattle: The Current Microbiological and Nutritional Outlook. J. Dairy Sci. 2007, 90, E17–E38. [Google Scholar] [CrossRef]
  11. Munsterhjelm, C.; Simola, O.; Keeling, L.; Valros, A.; Heinonen, M. Health Parameters in Tail Biters and Bitten Pigs in a Case–Control Study. Animal 2013, 7, 814–821. [Google Scholar] [CrossRef] [PubMed]
  12. De Souza, J.M.; De Sousa, D.O.; De Mesquita, B.S.; Mesquita, L.G.; Silva, L.F.P. Effect of Sugarcane Fiber Digestibility, Conservation Method and Concentrate Level on the Ruminal Ecosystem of Beef Cattle. AMB Expr. 2017, 7, 55. [Google Scholar] [CrossRef] [PubMed]
  13. Phesatcha, K.; Phesatcha, B.; Wanapat, M.; Cherdthong, A. The Effect of Yeast and Roughage Concentrate Ratio on Ruminal pH and Protozoal Population in Thai Native Beef Cattle. Animals 2021, 12, 53. [Google Scholar] [CrossRef] [PubMed]
  14. Ferrell, C.L.; Jenkins, T.G. Body Composition and Energy Utilization by Steers of Diverse Genotypes Fed a High-Concentrate Diet during the Finishing Period: I. Angus, Belgian Blue, Hereford, and Piedmontese Sires. J. Anim. Sci. 1998, 76, 637. [Google Scholar] [CrossRef]
  15. Meissner, H.H.; Smuts, M.; Coertze, R.J. Characteristics and Efficiency of Fast-Growing Feedlot Steers Fed Different Dietary Energy Concentrations. J. Anim. Sci. 1995, 73, 931–936. [Google Scholar] [CrossRef] [PubMed]
  16. Cantalapiedra-Hijar, G.; Abo-Ismail, M.; Carstens, G.E.; Guan, L.L.; Hegarty, R.; Kenny, D.A.; McGee, M.; Plastow, G.; Relling, A.; Ortigues-Marty, I. Biological Determinants of Between-Animal Variation in Feed Efficiency of Growing Beef Cattle. Animal 2018, 12, s321–s335. [Google Scholar] [CrossRef] [PubMed]
  17. Berry, D.P.; Crowley, J.J. Cell Biology Symposium: Genetics of Feed Efficiency in Dairy and Beef Cattle. J. Anim. Sci. 2013, 91, 1594–1613. [Google Scholar] [CrossRef] [PubMed]
  18. Qiu, X.; Qin, X.; Chen, L.; Chen, Z.; Hao, R.; Zhang, S.; Yang, S.; Wang, L.; Cui, Y.; Li, Y. Serum Biochemical Parameters, Rumen Fermentation, and Rumen Bacterial Communities Are Partly Driven by the Breed and Sex of Cattle When Fed High-Grain Diet. Microorganisms 2022, 10, 323. [Google Scholar] [CrossRef] [PubMed]
  19. Gunun, N.; Sanjun, I.; Kaewpila, C.; Foiklang, S.; Cherdthong, A.; Wanapat, M.; Polyorach, S.; Khota, W.; Kimprasit, T.; Kesorn, P. Effect of Dietary Supplementation of Hydrolyzed Yeast on Growth Performance, Digestibility, Rumen Fermentation, and Hematology in Growing Beef Cattle. Animals 2022, 12, 2473. [Google Scholar] [CrossRef]
  20. Liu, Y.; Liu, C.; Wu, H.; Zhou, Z. Small Intestine Microbiome and Metabolome of High and Low Residual Feed Intake Angus Heifers. Front. Microbiol. 2022, 13, 862151. [Google Scholar] [CrossRef]
  21. National Academies of Sciences. Medicine Nutrient Requirements of Beef Cattle; National Academies of Sciences: Washington, DC, USA, 2016. [Google Scholar]
  22. Horwitz, W. Official Methods of Analysis; Association of Official Analytical Chemists: Washington, DC, USA, 1975; Volume 222. [Google Scholar]
  23. Van Soest, P.; Robertson, J.B.; Lewis, B.A. Methods for Dietary Fiber, Neutral Detergent Fiber, and Nonstarch Polysaccharides in Relation to Animal Nutrition. J. Dairy Sci. 1991, 74, 3583–3597. [Google Scholar] [CrossRef]
  24. Broderick, G.A.; Kang, J.H. Automated Simultaneous Determination of Ammonia and Total Amino Acids in Ruminal Fluid and In Vitro Media. J. Dairy Sci. 1980, 63, 64–75. [Google Scholar] [CrossRef]
  25. Cottyn, B.G.; Boucque, C.V. Rapid Method for the Gas-Chromatographic Determination of Volatile Fatty Acids in Rumen Fluid. J. Agric. Food Chem. 1968, 16, 105–107. [Google Scholar] [CrossRef]
  26. Vogtmann, H.; Pfirter, H.P.; Prabucki, A.L. A New Method of Determining Metabolisability of Energy and Digestibility of Fatty Acids in Broiler Diets. Br. Poult. Sci. 1975, 16, 531–534. [Google Scholar] [CrossRef] [PubMed]
  27. Yi, X.; Wu, B.; Ma, J.; Cui, X.; Deng, Z.; Hu, S.; Li, W.; A, R.; Li, X.; Meng, Q.; et al. Effects of Dietary Capsaicin and Yucca Schidigera Extracts as Feed Additives on Rumen Fermentation and Microflora of Beef Cattle Fed with a Moderate-Energy Diet. Fermentation 2022, 9, 30. [Google Scholar] [CrossRef]
  28. Magoč, T.; Salzberg, S.L. FLASH: Fast Length Adjustment of Short Reads to Improve Genome Assemblies. Bioinformatics 2011, 27, 2957–2963. [Google Scholar] [CrossRef]
  29. Chen, S.; Zhou, Y.; Chen, Y.; Gu, J. Fastp: An Ultra-Fast All-in-One FASTQ Preprocessor. Bioinformatics 2018, 34, i884–i890. [Google Scholar] [CrossRef] [PubMed]
  30. Callahan, B.J.; McMurdie, P.J.; Rosen, M.J.; Han, A.W.; Johnson, A.J.A.; Holmes, S.P. DADA2: High-Resolution Sample Inference from Illumina Amplicon Data. Nat. Methods 2016, 13, 581–583. [Google Scholar] [CrossRef] [PubMed]
  31. Bolyen, E.; Rideout, J.R.; Dillon, M.R.; Bokulich, N.A.; Abnet, C.C.; Al-Ghalith, G.A.; Alexander, H.; Alm, E.J.; Arumugam, M.; Asnicar, F. Reproducible, Interactive, Scalable and Extensible Microbiome Data Science Using QIIME 2. Nat. Biotechnol. 2019, 37, 852–857. [Google Scholar] [CrossRef]
  32. Firkins, J.L. Effects of Feeding Nonforage Fiber Sources on Site of Fiber Digestion. J. Dairy Sci. 1997, 80, 1426–1437. [Google Scholar] [CrossRef]
  33. Tyrrell, H.F.; Moe, P.W. Effect of Intake on Digestive Efficiency. J. Dairy Sci. 1975, 58, 1151–1163. [Google Scholar] [CrossRef]
  34. Stec, D.E.; John, K.; Trabbic, C.J.; Luniwal, A.; Hankins, M.W.; Baum, J.; Hinds, T.D. Bilirubin Binding to PPARα Inhibits Lipid Accumulation. PLoS ONE 2016, 11, e0153427. [Google Scholar] [CrossRef]
  35. Gordon, D.M.; Blomquist, T.M.; Miruzzi, S.A.; McCullumsmith, R.; Stec, D.E.; Hinds, T.D. RNA Sequencing in Human HepG2 Hepatocytes Reveals PPAR-α Mediates Transcriptome Responsiveness of Bilirubin. Physiol. Genom. 2019, 51, 234–240. [Google Scholar] [CrossRef]
  36. Steffen, U.; Koeleman, C.A.; Sokolova, M.V.; Bang, H.; Kleyer, A.; Rech, J.; Unterweger, H.; Schicht, M.; Garreis, F.; Hahn, J.; et al. IgA Subclasses Have Different Effector Functions Associated with Distinct Glycosylation Profiles. Nat. Commun. 2020, 11, 120. [Google Scholar] [CrossRef] [PubMed]
  37. Patra, A.K.; Aschenbach, J.R. Ureases in the Gastrointestinal Tracts of Ruminant and Monogastric Animals and Their Implication in Urea-N/Ammonia Metabolism: A Review. J. Adv. Res. 2018, 13, 39–50. [Google Scholar] [CrossRef]
  38. Hungate, R.E. The Rumen Microbial Ecosystem. Annu. Rev. Ecol. Syst. 1975, 6, 39–66. [Google Scholar] [CrossRef]
  39. Ortega Cerrilla, M.E.; Mendoza Martínez, G. Starch Digestion and Glucose Metabolism in the Ruminant: A Review. Interciencia 2003, 28, 380–386. [Google Scholar]
  40. Zhang, X.; Wang, H.; Guo, X. Comparative Analysis of Rumen Fermentation Parameters and Bacterial Profiles during Adaption to Different Fattening Stages in Beef Cattle Fed TMR with Various Forage Silage. Anim. Feed. Sci. Technol. 2021, 278, 115006. [Google Scholar] [CrossRef]
  41. Firkins, J.L.; Yu, Z.; Morrison, M. Ruminal Nitrogen Metabolism: Perspectives for Integration of Microbiology and Nutrition for Dairy. J. Dairy Sci. 2007, 90, E1–E16. [Google Scholar] [CrossRef]
  42. Martínez, M.E.; Ranilla, M.J.; Tejido, M.L.; Ramos, S.; Carro, M.D. Comparison of Fermentation of Diets of Variable Composition and Microbial Populations in the Rumen of Sheep and Rusitec Fermenters. I. Digestibility, Fermentation Parameters, and Microbial Growth. J. Dairy Sci. 2010, 93, 3684–3698. [Google Scholar] [CrossRef]
  43. Shah, H.N.; Chattaway, M.A.; Rajakurana, L.; Gharbia, S.E. Prevotella. In Bergey’s Man Syst Archaea Bact; Whitman, W.B., Ed.; John Wiley & Sons: New York, NY, USA, 2015; pp. 1–25. [Google Scholar]
  44. Shabat, S.K.B.; Sasson, G.; Doron-Faigenboim, A.; Durman, T.; Yaacoby, S.; Berg Miller, M.E.; White, B.A.; Shterzer, N.; Mizrahi, I. Specific Microbiome-Dependent Mechanisms Underlie the Energy Harvest Efficiency of Ruminants. ISME J. 2016, 10, 2958–2972. [Google Scholar] [CrossRef] [PubMed]
  45. Hooper, L.V.; Wong, M.H.; Thelin, A.; Hansson, L.; Falk, P.G.; Gordon, J.I. Molecular Analysis of Commensal Host-Microbial Relationships in the Intestine. Science 2001, 291, 881–884. [Google Scholar] [CrossRef] [PubMed]
  46. Zened, A.; Combes, S.; Cauquil, L.; Mariette, J.; Klopp, C.; Bouchez, O.; Troegeler-Meynadier, A.; Enjalbert, F. Microbial Ecology of the Rumen Evaluated by 454 GS FLX Pyrosequencing Is Affected by Starch and Oil Supplementation of Diets. FEMS Microbiol. Ecol. 2013, 83, 504–514. [Google Scholar] [CrossRef] [PubMed]
  47. Van Den Abbeele, P.; Belzer, C.; Goossens, M.; Kleerebezem, M.; De Vos, W.M.; Thas, O.; De Weirdt, R.; Kerckhof, F.-M.; Van De Wiele, T. Butyrate-Producing Clostridium Cluster XIVa Species Specifically Colonize Mucins in an in Vitro Gut Model. ISME J. 2013, 7, 949–961. [Google Scholar] [CrossRef] [PubMed]
  48. Nyonyo, T.; Shinkai, T.; Mitsumori, M. Improved Culturability of Cellulolytic Rumen Bacteria and Phylogenetic Diversity of Culturable Cellulolytic and Xylanolytic Bacteria Newly Isolated from the Bovine Rumen. FEMS Microbiol. Ecol. 2014, 88, 528–537. [Google Scholar] [CrossRef] [PubMed]
  49. Díaz Carrasco, J.M.; Cabral, C.; Redondo, L.M.; Pin Viso, N.D.; Colombatto, D.; Farber, M.D.; Fernández Miyakawa, M.E. Impact of Chestnut and Quebracho Tannins on Rumen Microbiota of Bovines. BioMed Res. Int. 2017, 2017, 9610810. [Google Scholar] [CrossRef] [PubMed]
  50. Whitman, W.B. (Ed.) Bergey’s Manual of Systematics of Archaea and Bacteria, 1st ed.; Wiley: New York, NY, USA, 2015; ISBN 978-1-118-96060-8. [Google Scholar]
  51. Fischbach, M.A.; Segre, J.A. Signaling in Host-Associated Microbial Communities. Cell 2016, 164, 1288–1300. [Google Scholar] [CrossRef] [PubMed]
  52. Beaumont, M.; Goodrich, J.K.; Jackson, M.A.; Yet, I.; Davenport, E.R.; Vieira-Silva, S.; Debelius, J.; Pallister, T.; Mangino, M.; Raes, J.; et al. Heritable Components of the Human Fecal Microbiome Are Associated with Visceral Fat. Genome Biol. 2016, 17, 189. [Google Scholar] [CrossRef]
  53. Tao, S.; Bai, Y.; Zhou, X.; Zhao, J.; Yang, H.; Zhang, S.; Wang, J. In Vitro Fermentation Characteristics for Different Ratios of Soluble to Insoluble Dietary Fiber by Fresh Fecal Microbiota from Growing Pigs. ACS Omega 2019, 4, 15158–15167. [Google Scholar] [CrossRef]
  54. Alcazar, M.; Escribano, J.; Ferré, N.; Closa-Monasterolo, R.; Selma-Royo, M.; Feliu, A.; Castillejo, G.; Luque, V.; Closa-Monasterolo, R.; Escribano, J.; et al. Gut Microbiota Is Associated with Metabolic Health in Children with Obesity. Clin. Nutr. 2022, 41, 1680–1688. [Google Scholar] [CrossRef]
  55. Morotomi, M.; Nagai, F.; Watanabe, Y. Description of Christensenella minuta gen. nov., sp. nov., isolated from human faeces, which forms a distinct branch in the order Clostridiales, and proposal of Christensenellaceae fam. nov. Int. J. Syst. Evol. Microbiol. 2012, 62, 144–149. [Google Scholar] [CrossRef] [PubMed]
Figure 1. Principal coordinate analysis (PCoA) distribution of growing period and fattening period.
Fermentation 10 00205 g001
Figure 2. Characterization of core microbial communities and differentially abundant phyla, family, and genera. (A) Relative abundance and differential of the main bacterial phyla in rumen fluid of growing period and fattening period groups. (B) Relative abundance and differential of the main bacterial family in rumen fluid of growing period and fattening period groups. (C) Relative abundance and differential of the main bacterial genera in rumen fluid of growing period and fattening period groups. * Represents 0.01 < p < 0.05, ** represents 0.001 < p < 0.01, and *** represents p < 0.001 in the figure. The “difference between proportions” refers to the disparity in microbial abundance values between the rumen microbiota of growing and fattening cattle. If the value is negative, the data point falls to the left of the dashed line, if it is positive, the point falls to the right of the dashed line. The color of the data point corresponds to samples with higher abundances.
Fermentation 10 00205 g002
Figure 3. Linear discriminant analysis (LDA) effect size (LEfSe) analysis between growing period and fattening period. (A) LEfSe barplot on the bacterial from phylum to genus level. (B) Cladogram demonstrating the taxonomic levels with phyla in the innermost and genera in the outermost ring. Only LDA scores > 4 are shown. All against all as the multiple comparisons. The prefix “p” represents phylum; “c”, class; “o”, order; “f”, family; and “g”, genus.
Fermentation 10 00205 g003
Figure 4. Comparison of functions and metabolisms between growing period and fattening period. (A) Function heatmap figure between growing period and fattening period at level 2. (B) The rank-sum test of PICRUSt analysis of KEGG metabolic pathways at level 2. Graphs show the abundance ratios of different functions between growing period and fattening period cattle; * represents 0.01  <  p  <  0.05, ** represents p  <  0.01. *** represents p  <  0.001. The term “difference between proportions” refers to the variance in predicted functional abundance values of the rumen microbiota between growing period and fattening period cattle. If the value is negative, the data point will be located to the left of the dashed line, while positive values will place the data point to the right of the dashed line. The color of the data point corresponds to the color associated with samples of higher functional abundance.
Fermentation 10 00205 g004
Table 1. Composition and nutrient levels of basal diets (air-dried basis) %.
ItemsContent
Ingredients (% of DM)Growing PeriodFattening Period
Ground corn31.90059.771
Soybean meal9.35013.229
Jujube powder8.250
Whole plant corn silage24.75015.736
Corn stalker20.2507.868
NaCl1.1000.481
Limestone 0.712
MgO 0.236
Premix 12.2000.786
CaHPO41.100
NaHCO31.1001.180
nutrient level100.000100.000
DM53.21063.940
NDF41.7527.27
CP11.33015.440
starch20.6426.776
EE1.632.406
ME 2 MJ/kg DM10.55013.850
1 Premix (per kg of DM) contains 150,000–450,000 IU vitamin A acetate, 40,000–120,000 IU vitamin D3, 400 mg dl-α-tocopherol acetate, 250–750 mg copper, 1000–5000 mg iron, 1000–3000 mg manganese, 1500–3700 mg of zinc, 10–25% calcium, 0.3% total phosphorus, and 15–30% sodium chloride. 2 ME (metabolizable energy) was calculated and other components were determined by NASEM (2016).
Table 2. Growth performance and serum biochemical indices of Angus beef cattle during the growth and fattening periods.
ItemsLHMeanSEMp-Value
No. of animals1515
Performance traits
Initial weight, kg537.571630.286583.92912.634<0.001
Final weight, kg608.714709.714659.21414.340<0.001
ADG, kg/d1.1471.2611.2040.0510.238
DMI, kg/d10.97011.88111.4250.2420.002
G:F0.1050.1060.1050.0030.905
Serum biochemistry
TP (g/L)72.15878.18375.1710.882<0.001
ALB (g/L)38.00037.41737.7080.3470.191
GLB (g/L)34.15840.76737.4630.950<0.001
TBiLL (U/L)2.2171.7061.9610.1490.023
GLU (mmol/L)4.9942.4893.7420.271<0.001
UREA (mmol/L)3.14110.3296.7350.769<0.001
T-AOC (mmol/L)0.2370.4290.3330.020<0.001
Table 3. Changes in rumen fermentation parameters in Angus beef cattle during the growth and fattening periods.
ItemsLHMeanSEMp-Value
No. of animals1514
pH6.8986.3726.610.043<0.001
NH3-N, mg/100 mL4.47110.2387.3550.661<0.001
TVFA, mmol/L63.38472.44567.91453.7080.175
Acetate44.49551.09747.7962.510.194
Propionate10.02510.66710.3460.5910.597
Isobutyrate0.7490.7080.7290.0320.529
Butyrate6.6478.2967.4710.4330.055
Isovalerate1.0751.2741.1750.0570.081
Valerate0.3930.4030.3980.0310.876
VFAs, molar% of TVFA
Acetate70.33370.59770.4650.3020.529
Propionate15.76614.59515.180.2180.01
Isobutyrate1.2591.0031.1310.0590.041
Butyrate10.24511.53310.8890.2670.001
Isovalerate1.7731.7451.7590.0460.756
Valerate0.6240.5280.5760.0230.051
A/P4.4694.8734.6710.0840.015
Table 4. Effect of apparent digestibility of dietary nutrients in Angus beef cattle during the growth and fattening periods.
ItemsLHMeanSEMp-Value
DMD, %72.3256.3067.741.227<0.001
CPD, %66.1255.4562.901.118<0.001
NDFD, %83.5854.9480.111.167<0.001
Disclaimer/Publisher’s Note: The statements, opinions and data contained in all publications are solely those of the individual author(s) and contributor(s) and not of MDPI and/or the editor(s). MDPI and/or the editor(s) disclaim responsibility for any injury to people or property resulting from any ideas, methods, instructions or products referred to in the content.

