Article

Microbial Characterisation of a Two-Stage Anaerobic Digestion Process for Conversion of Agri-Based Feedstock in Biogas and Long-Chain Fatty Acids in a Circular Economy Framework

by
Elisabetta Fanfoni
1,
Erika Sinisgalli
2,
Alessandra Fontana
1,*,
Mariangela Soldano
2,
Mirco Garuti
2,† and
Lorenzo Morelli
1,†
1
Department for Sustainable Food Process (DiSTAS), Università Cattolica del Sacro Cuore, Via Stefano Leonida Bissolati 74, 26100 Cremona, Italy
2
Centro Ricerche Produzioni Animali (CRPA), Viale Timavo 43/2, 42121 Reggio Emilia, Italy
*
Author to whom correspondence should be addressed.
These authors contributed equally to this work.
Fermentation 2024, 10(6), 293; https://doi.org/10.3390/fermentation10060293
Submission received: 7 May 2024 / Revised: 24 May 2024 / Accepted: 29 May 2024 / Published: 31 May 2024
(This article belongs to the Section Industrial Fermentation)

Abstract

:
In addition to energy recovery, the anaerobic digestion of agro-industrial byproducts can also produce different high-value-added compounds. Two-stage and single-stage reactors were compared for microbial communities’ selection and long-chain fatty acid (LCFA) accumulation to investigate which microbial genera are most linked to the production of these compounds. The microbial communities present in the two reactors’ configuration in the steady state were characterised by 16S rRNA amplicon sequencing, while LCFAs were extracted and quantified from digestate samples by gas chromatography. The results showed the differentiation of the microbially dominant families in the two setups: Defluviitaleaceae and Clostridiaceae in the acidogenic and methanogenic reactor of the two-stage reaction respectively, while Dysgonomonadaceae in the single-stage set-up. LCFA accumulation was significantly detected only in the acidogenic reactor, with palmitic (2764 mg/kg), linoleic (1795 mg/kg) and stearic (1751 mg/kg) acids as the most abundant. The dominance of Defluviitaleaceae UCG 011, along with the low abundance of the LCFA oxidiser Syntrophomonas spp. in the acidogenic reactor, could be linked to the accumulation of such compounds. Therefore, the different microbial communities shaped by the two reactors’ configuration affected the accumulation of LCFAs, indicating that the two-stage anaerobic digestion of agro-industrial byproducts was more effective than single-stage digestion.

Graphical Abstract

1. Introduction

In a circular economy framework, the use of wastewater, organic fractions of municipal waste, agri-based feedstock and byproducts from agro-industrial activities for biorefinery processes has drawn much attention in terms of environmental sustainability and technological innovation [1]. Such feedstocks can be converted into a significant number of valuable products, like biofuels, renewable gases, biofertilisers and biomolecules for green chemistry, using a variety of technologies, including anaerobic digestion, pyrolysis and gasification. The economic and ecological effects of these techniques have been largely documented in the literature [2]. Anaerobic digestion (AD) is a well-known technology, implemented on an industrial scale for biogas production [3]. AD of wastes and agri-based feedstock is a flexible system, capable of contributing to many integrated pathways, such as energy production, greenhouse gas emission reduction and byproduct valorisation. Some of the output streams are methane, hydrogen, carbon dioxide and organic acids.
Dark fermentation (DF) is a process based on the early stages of anaerobic digestion (hydrolysis, acidogenesis and acetogenesis) and capable of converting feedstock into a hydrogen-rich biogas and organic acids. When implemented together, DF and AD aim to produce differentiated products in separate reactors connected in series (two-stage AD), which can be carried out by means of layout and process modifications, optimising the use of biomass and operating parameters (i.e., pH, organic loading rate, hydraulic retention time) [4,5]. The acidification and methanogenesis stages are, thus, physically separated to enhance the stability and the overall performance of the process [6]. This setup allows for the conversion of the complex organic material into hydrogen, carbon dioxide and organic acids during the acidogenic stage and the subsequent conversion of these easily biodegradable compounds into methane and carbon dioxide during the methanogenic stage [7]. Since hydrogen production through the DF process alone is not efficient due to the low yields caused by intrinsic metabolic restrictions [8], the recovery of organic acids and their use as biobased chemical building blocks can add value to the overall process [9]. Volatile fatty acids (VFAs) are a subgroup of fatty acids, ranging from two to seven carbon atoms, including acetic, propionic, isobutyric, butyric, isovaleric, valeric, caproic, isocaproic and heptanoic acids. Long-chain fatty acids (LCFAs), ranging from 12 to 26 carbon atoms, result from the hydrolysis of lipid-rich feedstock fed into the anaerobic digester. VFAs and LCFAs have a wide range of industrial applications in numerous areas, such as cosmetics, chemicals, ingredients and pharmaceuticals; thus, they are considered building-block chemicals. In addition, a characteristic of these high-value-added compounds is their eco-friendly nature: they are non-polluting and biodegradable. LCFAs are the result of the hydrolysis of lipid-rich matrices. Syntrophomonas spp. is recognised as syntrophic bacteria capable of participating in the beta-oxidation reaction that converts LCFAs to acetate and H2, which is then subsequently converted to methane by acetoclastic methanogens [10]. Consequently, the absence or low abundance of microorganisms capable of carrying out this degradative pathway leads to the accumulation of LCFAs in the reactors, inhibiting the methanogenic stage and resulting in low biogas yields [11]. This inhibition is reversible since methane production continues as soon as LCFA degradation occurs again. Thus, it is understandable how numerous studies have aimed to avoid the excessive LCFA accumulation and instability in the digestion process, applying, for example, different pre-treatments to biomass (e.g., saponification, emulsification or ultrasonication) [12]. Other studies [13] have focused on the extraction of the LCFAs produced in reactors fed by animal manure and oily effluent, with the aim of understanding the chemical pathways that lead to the adsorption and degradation processes of LCFAs during anaerobic digestion. Few studies [14,15], on the other hand, have been conducted by considering a two-stage process (DF+AD), which can be used with a dual purpose: (a) collecting LCFAs in the acidogenic reactor for their recovery and exploitation; (b) avoiding inhibition issues during the production of biogas and obtaining significant energy yields because the methanogenic phase occurs in a second dedicated reactor. Moreover, this clarifies how DF can contribute to the concept of the circular economy, considering how agri-based wastes are not only reused for energy production but, within the process, there is also a recovery of high-value-added byproducts (LCFAs) and not an out-of-system import of resources [16].
The aim of this study was to simulate, at the lab scale, the process layout of a two-stage anaerobic digestion plant at the full-scale level, to evaluate the effect of reactor configuration (one- and two-stage continuous stirred tank reactors, CSTRs) on the performance of the anaerobic digestion of agri-based feedstock. Specifically, the effect of the different-shaped microbial consortia on the production of LCFAs was investigated by means of 16S rRNA amplicon sequencing and gas chromatograph-based LCFA profiling.

2. Materials and Methods

2.1. Reactor Set-Up

Regarding the two-stage process, the experimental setup simulated the layout and the process of a full-scale two-phase biogas plant facility (TPBG) and consisted of two 23 L lab-scale CSTRs fed agri-based feedstock at mesophilic temperature (42 ± 0.2 °C). The first stage was carried out in an acidogenic reactor (R1) with a working volume of 14 L; the second stage was carried out in a methanogenic reactor (R2) with a working volume of 16 L. For the final calculations of specific methane yield, a reduction factor was counted for R1, according to the effective proportions at the full-scale facility, to consider the net contribution of the R1 reactor to the whole process. A hydraulic retention time (HRT) of 5 days was set for R1 and of 27 days for R2, while the organic loading rate (OLR) was set at 23.7 gVS L−1 day−1 for R1 and 2.34 gVS L−1 day−1. As regards the single-stage process, a third 23 L control reactor (R3) was set up, with a working volume of 16 L, an HRT of 33 days and an OLR of 3.14 gVS L−1 day−1. The three digesters were continuously mixed and kept at the temperature set via a water bath surrounding the reactors. Before reaching the operational conditions, the reactors were slowly adapted to digest the material through a feeding ramp, to stabilize the microbiology and avoid overloading conditions. The feeding procedure was in semicontinuous regime; i.e., the planned amount of digestate (measured as wet weight) was removed, and an equal volume of feeding mixture was added. Following the TPBG operational procedure, R1 was fed the raw agro-industrial feedstock plus digestate recirculation from R2; R2 was fed pig slurry plus the outcoming digestate from R1; R3 was normally fed the feeding mixture. The amount of feeding mixture was divided into three shares per day in the case of R1, while it was added all at once in the case of R2 and R3.
Agro-industrial byproducts and manure were used as feeding substrates for the experiment. The feeding mixture was composed of pig slurry (71% w/w), barley residues (12% w/w), ryegrass silage (7% w/w), poultry manure (5% w/w), olive pomace (3% w/w) and milling byproducts (2% w/w). The substrates were collected every month at the TPBG facility and stored at 4 °C prior to use. The feeding mix to be loaded was prepared every day, during the trial, with stored raw substrates (age < 1 month). To start the reactors, two different inocula were collected: digestate coming out from the first digester (acidogenic stage) of the full-scale TPBG was used as inoculum for R1, while digestate coming from the second digester (methanogenic stage) of the full-scale TPBG was used as inoculum for R2 and R3.

2.2. Sampling, Biomass Characterisation and Process Analyses

Six different types of biomass were used to produce the feedstock of the reactors (F) (Table S1), the acidogenic and methanogenic inocula from the full-scale TPBG facility used to start the lab-scale reactors (T0), and the digestate at two timepoints of the lab-scale reactors steady state (T1 and T2: 2 and 4 months after the reactors’ start-up, respectively) were collected in triplicate and analysed, for a total of 42 samples. The same inoculum was used to start both the methanogenic reactor of the two-stage process (R2) and the single-stage control reactor (R3). All samples were physico-chemically and microbiologically characterised. Specifically, each biomass of the feeding mixture was characterised in terms of total solids (TS) and volatile solids (VS) according to APHA standard methods [17]. The amount of biogas produced by the lab-scale reactors was continuously measured through a manometric system and electronically recorded. Biogas composition was determined using a portable biogas analyser (Biogas 5000, Geotech Instruments, London, UK); the concentrations (v/v) of CH4, CO2, H2, and H2S were measured and registered daily. The temperature inside the reactors was continuously monitored. The digestate was sampled and analysed once per week. pH was monitored weekly through a pH meter (Hach Lange GmbH, Düsseldorf, Germany). Every two weeks, total solids (TS), volatile solids (VS) and chemical oxygen demand (COD) were measured, in addition to the FOS/TAC ratio and VFAs concentration. FOS and TAC were measured by 2 pH-point Nordmann titration method [18] using 0.1 N sulphuric acid with pH 5.0 and pH 4.4 as endpoints; FOS (volatile organic acidity) is expressed as mgHAceq/kg, while TAC (total alkalinity = basic buffer capacity) is expressed as mgCaCO3 eq/kg. VFA concentration was measured using a gas chromatograph (Agilent 7820A, Santa Clara, CA, USA) equipped with a flame ionization detector (FID) and automatic sampler. The column used was a J&W DB-FFAP of 30 m length, 0.25 mm inner diameter and 0.25 μm film thickness. The calibration was made from a mixture of 8 acids (standard solution): acetic (C2), propionic (C3), butyric (C4), isobutyric (iC4), valeric (C5), isovaleric (iC5), caproic (C6) and heptanoic (C7). On the final digestate, obtained at the end of the trial, LCFA concentration was measured. The LCFA extraction from digestate was carried out in chloroform through hydrolysis and methylation using a mixture of methanol/sulfuric acid (85:15%, v/v) and submitting the sample to digestion for 3.5 h at 100 °C [13]. The methyl esters were detected and quantified with the same equipment as the volatile fatty acids (GC-FID and DB-FFAP capillary column) but with different operating parameters.

2.3. Microbial Communities’ Characterisation

2.3.1. DNA Extraction and Amplicon Sequencing

DNA extraction was carried out from 200 mg of each sample using the Fast DNATM SPIN Kit for Soil (MP Biomedicals, LLC, Solon, OH, USA) according to the manufacturer’s protocol. DNA concentration was determined with the Quant-iT dsDNA HS assay kit and the Qubit fluorometer (Invitrogen, Carlsbad, CA, USA). The quality of the extracted DNA was checked with agarose gel electrophoresis and then sent to the sequencing facility for 16S rRNA gene amplicon sequencing (V3-V4 regions) using the Illumina Miseq technology (2 × 300 bp) (Illumina Inc., San Diego, CA, USA).

2.3.2. Bioinformatic and Statistical Analyses

Raw data sequences were elaborated with QIIME2 2021.11 [19]. Specifically, demultiplexing and quality filtering were performed using the q2-demux plugin followed by denoising with Deblur [20]. Samples were rarefied (subsampled without replacement) to 8365 sequences per sample. Taxonomy was assigned to OTUs using the q2-feature-classifier [21] classify-consensus-vsearch taxonomy classifier against the SILVA 138 99% OTU reference sequences [22]. Sample diversity was evaluated and visualized with MicrobiomeAnalyst tool [23]. α-diversity was measured with the Shannon index, and significance was calculated with ANOVA (p-value cut-off = 0.05). β-diversity was estimated using Principal Coordinate Analysis (PCoA) based on Bray–Curtis dissimilarity, and significance was calculated with PERMANOVA (p-value cut-off = 0.05). The same tool was utilized for the visualization of taxonomy-related stacked bar plots. Taxonomic results were filtered as follows: low-count filtering considering 20 reads as minimum count and 20% as prevalence in samples; low-variance filtering, based on inter-quantile range, considering 10% of removal. In order to investigate the relationship between process parameters and microbial families found in the three reactors, canonical correspondence analysis (CCA) was performed with Past4 (4.03) [24]. Finally, Orthogonal Projections to Latent Structures Discriminant Analysis (OPLS-DA), considering data from the three reactors, was carried out using SIMCA 13 (Umetrics, Malmo, Sweden). The supervised OPLS-DA models were constructed considering bacterial genera found in R1, R3 and R3 and the LCFA production observed in them. Additionally, the OPLS-DA model validation parameters (goodness-of-fit R2Y and goodness-of-prediction Q2Y) were inspected, considering a Q2Y prediction ability of >0.5 as the acceptability threshold. The importance of each variable for discrimination purposes was calculated through a VIP (variable importance in projection) selection method, considering, as the minimum significant threshold, VIP scores > 0.8 [25].

3. Results and Discussion

3.1. Process Performance

The trial lasted 125 days, including startup (41 days) and the subsequent steady state (84 days). The steady state was achieved with at least a 2.5 hydraulic retention time and once process conditions (i.e., pH, FOS/TAC, digestate total solids content and volume of gas produced) were kept constant. The specific methane production (SMP) and the methane content in biogas (%CH4) were evaluated for the two-stage (R1 + R2) and single-stage (R3) AD reactors. The average SMP value observed for both processes was 161 NLCH4/kgVS, confirming the similar performances of the two-stage AD compared to single-stage AD considering the energetic point of view. In contrast with various previous literature contributions [26], in which a better performance of the two-stage AD was observed over the single-stage AD, in this study, no significant differences in terms of energy production could be found between the two processes. Similar results were also achieved by [27], confirming that deeper analytical approaches are needed to better understand the mechanisms producing these results. The SMP reached in both processes was lower than expected using this kind of agri-based feedstock. A possible explanation of such a slow process efficiency could be due to the 33 days of hydraulic retention time, which represents a shorter time than the average retention time of 63 days observed for the anaerobic digestion of agri-based feedstocks [28]. Regarding the quality of the produced biogas, the average CH4 content of R2 was 61.8%, while the average CH4 content of R3 was 56.6%. The DF process, as previously mentioned, should be able to produce, mainly, hydrogen and carbon dioxide, while the presence of methane indicates that the process is shifting towards the methanogenic stage, with the consequent consumption of hydrogen and organic acids. Low hydrogen production was observed in the acidogenic reactor R1 (<1000 ppm), and the biogas was composed, on average, of 15% of CH4 and 85% of CO2. The yields of VFAs and hydrogen produced through two-stage AD are largely dependent on process conditions. Studies have remarked that bioprocesses that are favourable for the formation of VFAs at high yields usually produce hydrogen as a byproduct, and vice versa [29]. Indeed, the low hydrogen concentration of the R1 biogas could be due to its consumption by homoacetogens or could be the result of the partial inhibition of microbial hydrogen production at an acidic pH due to the presence of organic acids in undissociated molecules [30]. Although the differences in energy yields were negligible, the two processes showed dissimilarities in terms of process conditions. In the acidogenic reactor R1, in which mainly hydrolysis, acidogenesis and acetogenesis of the AD occurred, the accumulation of VFAs implied by the constant pH value of 5.5 could have led to a reduction in the methane produced, as methanogens require a higher pH. In the steady state, R1 showed the highest concentration of VFAs, mostly related to acetate, propionate and butyrate, in descending order (Table 1). The total VFA concentration was in line with other studies [6,31], even if this depends strictly on feedstock and process parameters.

3.2. Microbial Characterisation

3.2.1. Microbial Diversity

Considering the microbial diversity among the sample categories, an α-diversity analysis based on the Shannon index showed that R1, R2 and R3 had significantly higher (p-value: 4.0025 × 10⁻¹⁸) microbial richness and evenness than feedstock, which presented, on the other hand, high variability (Figure 1a). Regarding the three reactors, R2 and R3 showed similar values of microbial richness, while the acidogenic reactor R1 had lower biodiversity compared with the methanogenic and one-stage counterparts (R2 and R3, respectively). Taking into account β-diversity, PCoA explained, on the three axes, 70% of the overall sample diversity (Figure S1), showing a significant difference between the microbial communities considered (p-value: 0.001) (Figure 1b), especially between R1 and the other reactors and feedstock communities. A slight dissimilarity was also found between R2 and R3, however, likely related to the different process configuration (two- vs. one-stage anaerobic digestion), leading to higher microbial selection in the separated methanogenic stage.

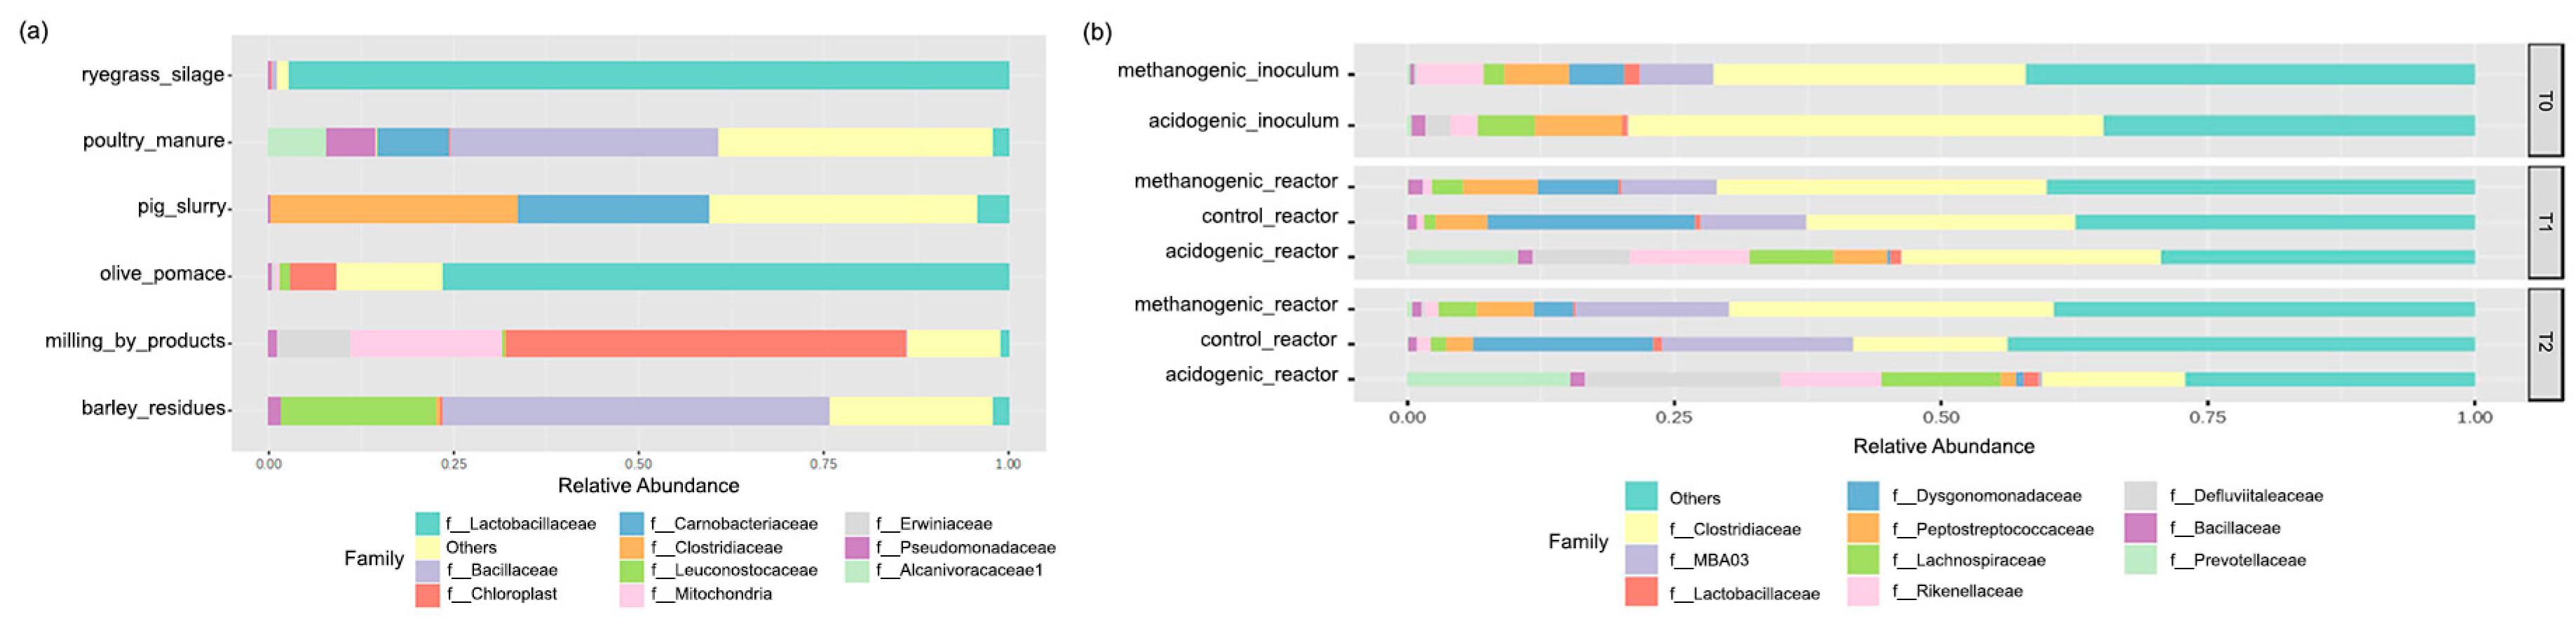
3.2.2. Feedstock and Inoculum Effects on the Dominant Reactors’ Steady-State Microbial Families

The taxonomic profile of the microbial communities was analysed at the family level, considering the feedstock, the two different inocula used to start the reactors (one for the acidogenic reactor [R1] and one for both the methanogenic and control reactors (R2 and R3, respectively)) and the reactors in the steady-state condition. The reactors’ microbial communities were evaluated at two timepoints (defined as T1 and T2) to verify the actual steady state from a microbial perspective and evaluate the possible microbial selection operated by the two different reactor configurations. As shown in Figure 2a, on average, the predominant families in feedstock were Lactobacillaceae, Bacillaceae and Chloroplast. Lactobacillaceae was highly present in ryegrass silage, reaching 97.9% of relative abundance, and in olive pomace (76.6%). Many bacterial species belonging to this family are recognised as key players in silage fermentation processes, as well as improving silage quality [32]. Regarding olive pomace, however, the presence of Lactobacillaceae in this matrix may be related to the metabolic activity during fermentation processes, which lead to the production of acetic acid and lactic acid [33]. The Bacillaceae family was, instead, mostly present in barley residues and poultry manure (52.6% and 36.4%, respectively), while Chloroplast and Mitochondria (20.3%) are the main abundant families found in milling byproducts. Furthermore, the results showed that, in pig slurry, the predominant family found belonged to Clostridiaceae (33.4%). Considering, instead, the microbiota of the two different inocula, they mainly differed in the specific presence of MBA03 and the Dysgonomonadaceae families in the methanogenic inoculum and the Defluviitaleaceae family in the acidogenic inoculum (Figure 2b). This was evidenced as the inoculum consortia mainly shaped the reactors’ microbial composition in the steady state, even if the configuration of the reactors (one- vs. two-stage), sharing the same inoculum, also influenced the distribution of some bacterial families: Clostridiaceae and Lachnospiraceae in R2 and Dysgonomonadaceae in R3.
Regarding the digestate samples in the reactors’ steady state (i.e., the period with stable biogas production, with a daily variation lower than 10% for at least 5 days [34]), the main microbial families showed a moderate difference in terms of relative abundance, even if the two timepoints considered (T1 and T2) were both in the steady-state condition (Figure 2b). The Clostridiaceae family was the most abundant overall, with a decrease in relative abundance for R1 (T0 = 44.8%, T2 = 13.2%) and R3 (T0 = 28.5%, T2 = 15.1%) but, conversely, revealed a different trend for R2, which maintained stable relative abundance (from 28.4% in T0 to 30.6% in T2). Although the bacterial species belonging to the Clostridiaceae family are recognised as playing a key role in the hydrolytic stage of anaerobic digestion, it is possible to attribute their decrease in the acidogenic reactor to the low pH conditions (pH 5.5) held during the test, while, instead, the pH of 7.8 in the methanogenic reactor maintained the stable abundance of this family [35]. Furthermore, the decrease in Clostridiaceae that occurred in R3 (compared to the linear trend present in R2) can be attributed to the single-stage configuration of R3, where all stages of anaerobic digestion occurred within the same reactor [36]. MBA03 represented the second family in the reactors in relative abundance. Significant percentages were reported in R2 (T0 = 7.4%, T2 = 15.5%) and R3 (T0 = 7.4%, T2 = 17.0%) but not in R1, where MBA03 was not present. This can be explained by the ability of species belonging to this family to maintain the stability of methanogenic microbial communities [37], found in R2 and R3, and in their possible syntrophic relationship with Methanosarcina [38], in addition to their capacity to produce VFAs. The results showed that the Dysgonomonadaceae family was present in high relative abundance percentages only in the control reactor (T0 = 5.0%, T2 = 17.2%). Species belonging to this family are involved in the hydrolysis reaction of protein-rich substrates. This could explain their abundance in R3, which was fed high-protein biomasses, such as poultry manure, pig slurry and milling byproducts. On the other hand, in the acidogenic reactor, where biomass hydrolysis is the main reaction, this family was not found, probably due to the acidic pH condition set in R1 [39]. Rikenellaceae, Lachnospiraceae, Prevotellaceae and Defluviitaleaceae were found as the most abundant families in R1, increasing at T2 with percentages of 9.2%, 12.3%, 14.7% and 18.8%, respectively. Rikenellaceae and Lachnospiraceae include bacterial species able to degrade lignocellulosic (Lachnospiraceae) and carbohydrate-rich (Rikenellaceae) matrices through the secretion of hydrolytic enzymes [40,41]. In addition, the ability of Rikenellaceae to ferment carbohydrates may also be correlated with the high production of propionic acid that occurred in R1 [42]. The high abundance of the Prevotellaceae family, instead, could be linked to its ability to hydrolyse the substrates fed into the reactor, consequently leading to the production of VFAs, which are predominant in the acidogenic reactor [43].
To investigate the correlation between the dominant families found in the reactors and the process parameters, canonical correspondence analysis (CCA) was performed. As shown in Figure 3, the first and second canonical axes represented 89.4% and 10.6% of variance, respectively. R2 and R3 were clearly separated, on the second axis, from reactor R1. Triplot analysis suggested that R1 was the most positively correlated with the production of the main VFAs (i.e., acetate, propionate and butyrate) and FOS/TAC. This is in line with our results, as in the acidogenic stage that occurred in R1, bacterial families capable of fermenting carbohydrate-rich substrates were mainly selected, resulting in the production and accumulation of VFAs. R2 and R3, on the other hand, were found to correlate with the pH parameter and the bacterial families MBA03 and Cloacimonadaceae, since it was found that pH could be considered the limiting factor among the process parameters.

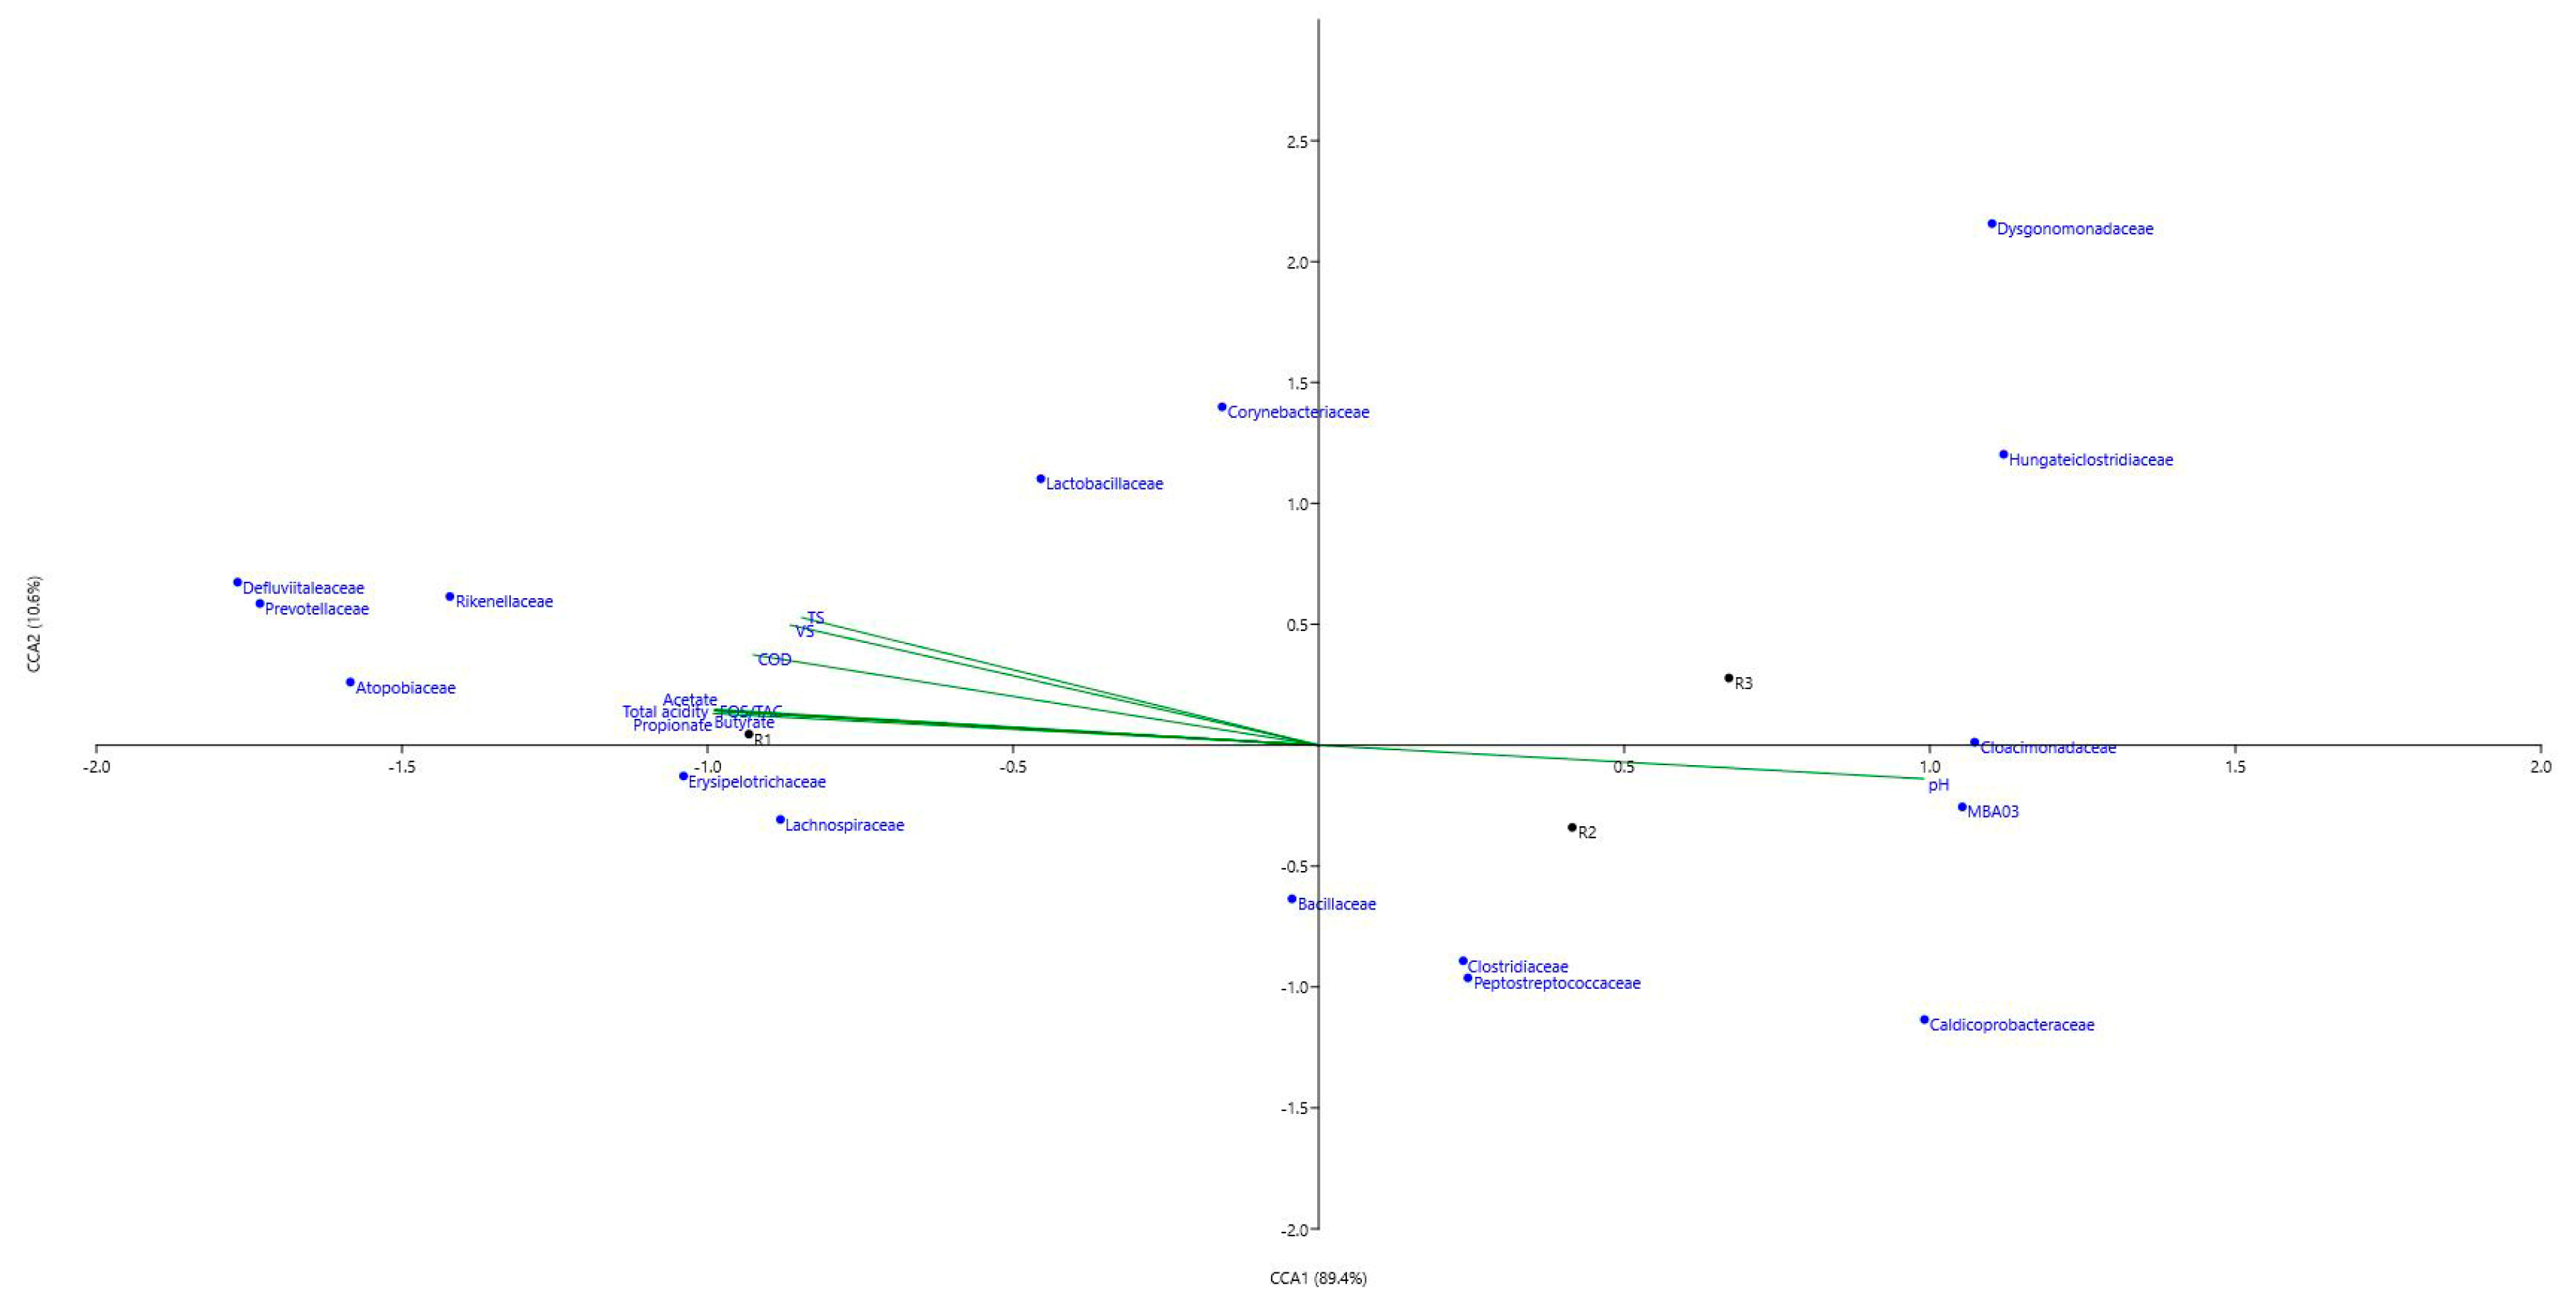
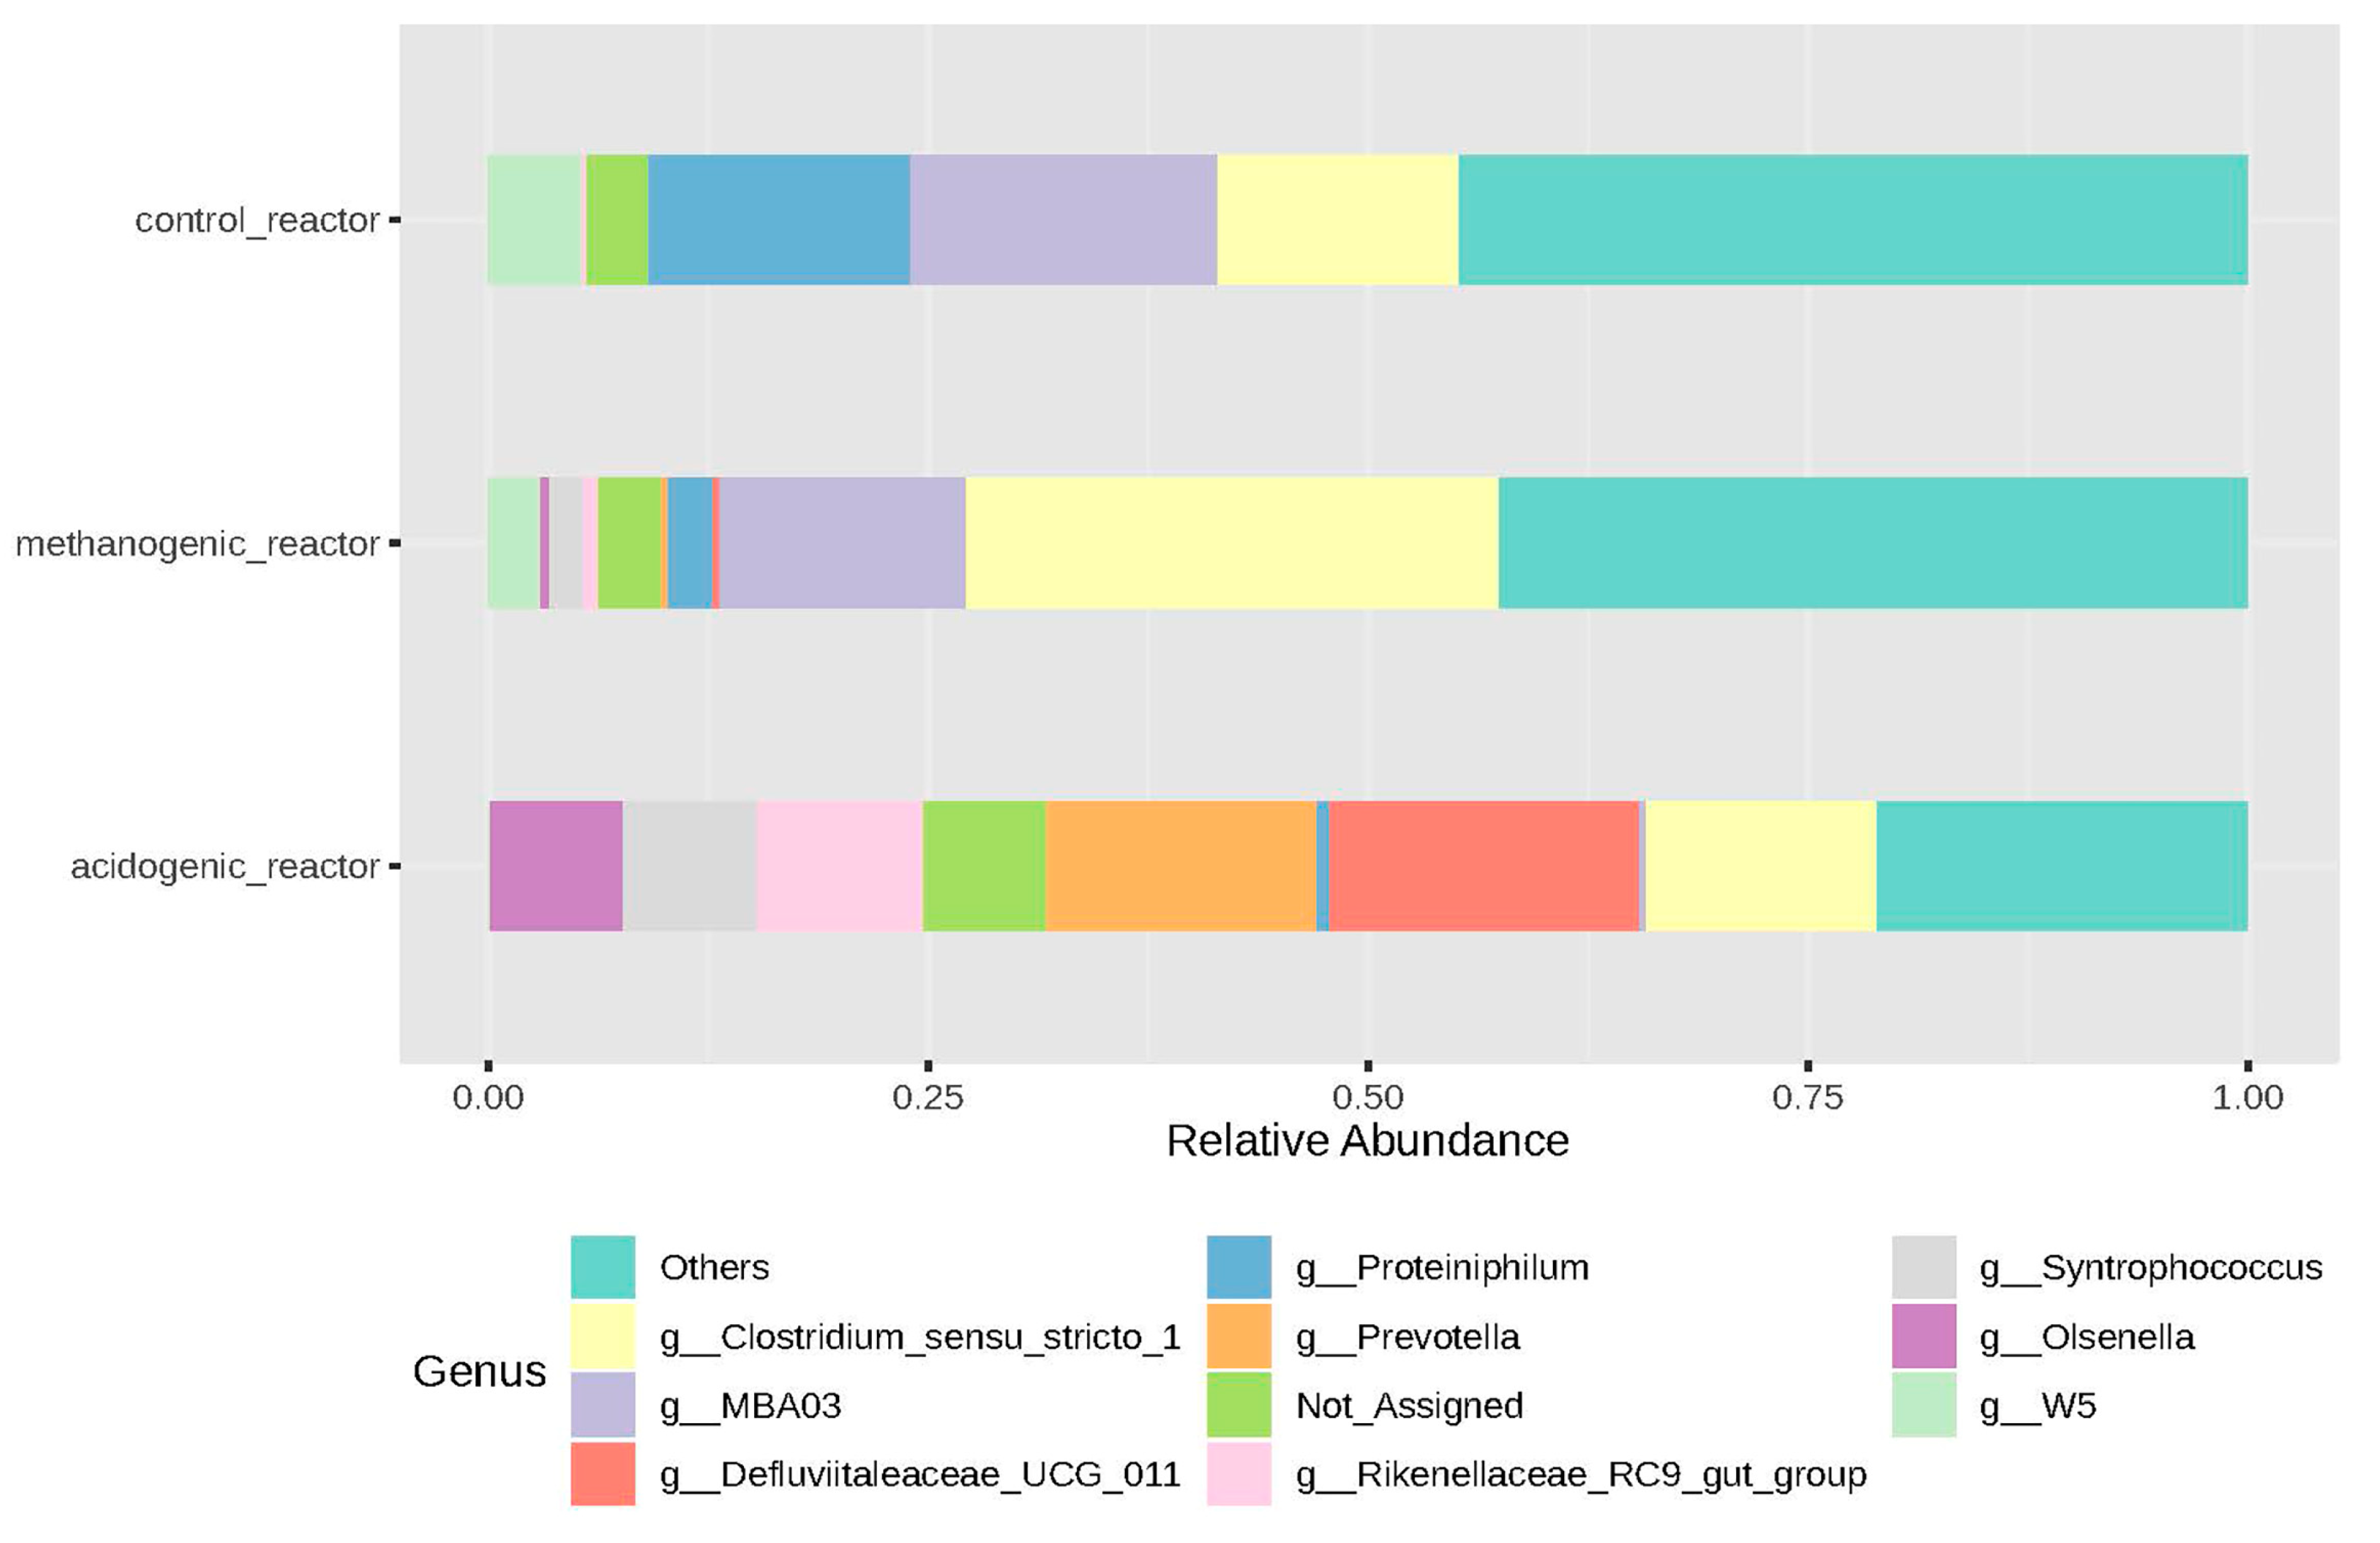
3.2.3. Microbial Genera and LCFAs Production

Regarding LCFA production, digestate samples at the last timepoint of the steady-state condition (T2) were considered. The results showed significant LCFA levels only in R1, while in R2 and R3, they were less appreciable. As shown in Table 2, the most produced acids in descending order were as follows: palmitic, linoleic and stearic. This result is in line with [44], since, during the acidogenic stage, it is well known that LCFA accumulation can occur as a result of the degradation of lipids present in the feedstock fed into the reactors. Since palmitic acid and stearic acid are saturated LCFAs with significantly lower degradation rates than unsaturated acids [45], an accumulation of these in the R1 reactor can be expected.
Considering the microbial communities present in the three reactors in steady state, the most abundant genera are Clostridium sensu stricto 1, MBA03 and Defluviitaleaceae UCG 011 (57.4%, 31.6% and 18.1% relative abundance, respectively; Figure 4). The genus Clostridium sensu stricto 1 had similar relative abundance percentages in R1 (13.2%) and R3 (13.7%) but doubled in R2 (30.4%). This increase can be explained by the fact that the genus Clostridium has been found to be a possible palmitic acid-degrading microorganism, thus also explaining the decrease in palmitic acid production going from R1 to R2, as reported by [46]. Focusing instead on the amounts of stearic acid, which decrease substantially from R1 to R2 and in R3, it can be hypothesised that, as a result of the degradation of stearic acid through the beta-oxidation reaction, Clostridium sensu stricto 1 played a role as a syntrophic acetate oxidiser (SAO), thus acting syntrophically with the methanogenic bacteria that use acetic acid to produce methane [47,48]. In R3, the same reasoning can be applied, despite the lower percentages of Clostridium sensu stricto 1, as the reaction occurs continuously since R3 is the single-stage reactor. Defluviitaleaceae UCG 011 showed significant relative abundance only in the R1 reactor (17.7%), while in R2 and R3, it was almost absent. No evidence was found linking this genus to the presence of LCFAs, but it includes bacterial species with hydrolytic and saccharolytic activity, which are fundamental in the hydrolytic stage of anaerobic digestion, leading to the accumulation of LCFAs in this reactor [49,50]. In contrast, as reported by [11], Syntrophomonas was found in relatively low abundance only in R2 and R3. This genus is recognised as a key player in the beta-oxidation reaction of LCFAs; thus, its presence is to be expected in reactors where the degradation of long-chain fatty acids can be assumed to occur. Nevertheless, its low abundance in the R2 and R3 reactors implies that the beta-oxidation process could have been carried out by other microbial genera. MBA03 belongs to the class Limnochordia and was found to be predominant in R2 (13.9%) and R3 (17.4%), while in R1, it was found in percentages close to zero. Braga Nan et al. [51] confirmed the prevalence of this genus in reactors fed with livestock effluents, such as poultry manure, and this could explain their presence in R3. Its presence in R2 but not in R1, on the other hand, can be attributed to its possible syntrophic activity with methanogens [52], which were obviously absent in the acidogenic R1 reactor. No evidence was found, however, to correlate this genus with the production or degradation of LCFAs.
Subsequently, the supervised OPLS-DA prediction model was performed to understand the actual discrimination of the reactor configurations and the variables that shaped the microbial genera distribution. As seen in the OPLS-DA score plot shown in Figure 5, a separation was found along the orthogonal latent vector between R1 and R2–R3. This is in line with our results, considering the characteristics that differentiate the acidogenic reactor R1 from the methanogenic R2 and the control R3, which, on the other hand, show similarities in both process parameters and microbial composition. The prediction model was characterised by good robustness, considering the goodness of fit (R2Y = 0.996) and the goodness of prediction (Q2 = 0.985). LCFAs were found to be the discriminating factors for R1, where the hydrolysis and accumulation stages of LCFAs occur. Furthermore, the VIP selection method (VIP score > 0.8) was then used to extrapolate the most discriminant variables that justify the separation observed among the three reactors (Table S2). The VIP approach identified 18 variables involved in the two-stage and single-stage anaerobic digestion process, which succeeded in differentiating R1, R2 and R3. Defluviitaleaceae (VIP score = 1.81), Syntrophococcus (VIP score = 1.49) and Olsenella (VIP score = 1.47) are the microbial genera that most discriminate the differences in the R1 reactor from the others due to their active role in the acidogenic stage (Figure S2a). Among the LCFAs, stearic acid was revealed as the one that could specifically differentiate the acidogenic reactor, probably due to its above-mentioned low degradation rate. Overall, the prediction model successfully excluded significant outliers (p < 0.01) by the Hotelling T2 (Figure S2b); in addition, a permutation test was performed to validate the prediction ability of the developed model (number of random permutations = 300; Figure S2c).

4. Conclusions

The objective of this study was to compare two- and a single-stage reactors’ configuration for the anaerobic digestion of agri-based feedstock, considering organic acids (VFAs and LCFAs) and methane production. The two-stage AD process showed its effectiveness from an energetic point of view, making an equal amount to one-stage AD. Defluviitaleaceae UCG 011 and Clostridium sensu stricto 1 were found to be the distinctive genera in the acidogenic and methanogenic reactors, respectively. The main LCFAs significantly produced in the acidogenic reactor were, in decreasing order, palmitic, linoleic and stearic acids. The absence of the Syntrophomonas genus in this reactor, likely due to the acidic conditions, could explain the accumulation of LCFAs, since different species belonging to this genus are generally associated with the degradation of such compounds. Therefore, two-stage anaerobic digestion may be a valuable option for a stable and efficient process, assuring methane production, together with the potential recovery of value-added byproducts, such as LCFAs.

Supplementary Materials

The following supporting information can be downloaded at: https://www.mdpi.com/article/10.3390/fermentation10060293/s1, Figure S1: 3D PCoA of feedstock and reactors microbial diversity; Figure S2: Loading plot, Hotelling’s range and permutation test based on supervised OPLS-DA prediction model; Table S1: Characteristics of vegetable and animal derived biomasses used to feed the reactors; Table S2: VIP-markers from supervised OPLS-DA prediction model.

Author Contributions

Conceptualization and methodology, M.G., E.S. and A.F.; formal analysis, E.F., A.F., M.S. and E.S.; investigation and data curation, E.F., A.F., M.G. and E.S.; writing—original draft preparation, E.F. and E.S.; writing—review and editing, E.F., A.F., M.G. and E.S.; supervision, M.G. and L.M. All authors have read and agreed to the published version of the manuscript.

Funding

This research was partially funded under the National Recovery and Resilience Plan (NRRP), Mission 04 Component 2 Investment 1.5–NextGenerationEU, call for tender n. 3277 dated 30 December 2021. Award Number: 0001052 dated 23 June 2022.

Institutional Review Board Statement

Not applicable.

Informed Consent Statement

Not applicable.

Data Availability Statement

Raw reads were deposited in the Sequence Read Archive (SRA) database (BioProject accession number PRJNA1107171).

Acknowledgments

This study was supported by the Doctoral School on the Agro-Food System (Agrisystem) of the Università Cattolica del Sacro Cuore (Italy), and it is part of the project NODES, which has received funding from the MUR—M4C2 1.5 of PNRR funded by the European Union—NextGenerationEU (Grant agreement no. ECS00000036).

Conflicts of Interest

The authors declare no conflicts of interest.

References

  1. Yaashikaa, P.R.; Senthil Kumar, P.; Varjani, S. Valorization of Agro-Industrial Wastes for Biorefinery Process and Circular Bioeconomy: A Critical Review. Bioresour. Technol. 2022, 343, 126126. [Google Scholar] [CrossRef] [PubMed]
  2. Rajendran, N.; Gurunathan, B.; Han, J.; Krishna, S.; Ananth, A.; Venugopal, K.; Sherly Priyanka, R.B. Recent Advances in Valorization of Organic Municipal Waste into Energy Using Biorefinery Approach, Environment and Economic Analysis. Bioresour. Technol. 2021, 337, 125498. [Google Scholar] [CrossRef] [PubMed]
  3. Adekunle, K.F.; Okolie, J.A. A Review of Biochemical Process of Anaerobic Digestion. Adv. Biosci. Biotechnol. 2015, 6, 205–212. [Google Scholar] [CrossRef]
  4. Cysneiros, D.; Banks, C.J.; Heaven, S.; Karatzas, K.-A.G. The Effect of pH Control and ‘Hydraulic Flush’ on Hydrolysis and Volatile Fatty Acids (VFA) Production and Profile in Anaerobic Leach Bed Reactors Digesting a High Solids Content Substrate. Bioresour. Technol. 2012, 123, 263–271. [Google Scholar] [CrossRef] [PubMed]
  5. Dareioti, M.A.; Kornaros, M. Effect of Hydraulic Retention Time (HRT) on the Anaerobic Co-Digestion of Agro-Industrial Wastes in a Two-Stage CSTR System. Bioresour. Technol. 2014, 167, 407–415. [Google Scholar] [CrossRef] [PubMed]
  6. Schievano, A.; Tenca, A.; Lonati, S.; Manzini, E.; Adani, F. Can Two-Stage Instead of One-Stage Anaerobic Digestion Really Increase Energy Recovery from Biomass? Appl. Energy 2014, 124, 335–342. [Google Scholar] [CrossRef]
  7. Demirel, B.; Yenigün, O. Two-phase Anaerobic Digestion Processes: A Review. J. Chem. Technol. Biotechnol. 2002, 77, 743–755. Available online: https://analyticalsciencejournals.onlinelibrary.wiley.com/doi/full/10.1002/jctb.630 (accessed on 23 April 2024). [CrossRef]
  8. Kumar, G.; Shobana, S.; Nagarajan, D.; Lee, D.-J.; Lee, K.-S.; Lin, C.-Y.; Chen, C.-Y.; Chang, J.-S. Biomass Based Hydrogen Production by Dark Fermentation-Recent Trends and Opportunities for Greener Processes. Curr. Opin. Biotechnol. 2018, 50, 136–145. [Google Scholar] [CrossRef] [PubMed]
  9. Nagarajan, S.; Jones, R.J.; Oram, L.; Massanet-Nicolau, J.; Guwy, A. Intensification of Acidogenic Fermentation for the Production of Biohydrogen and Volatile Fatty Acids—A Perspective. Fermentation 2022, 8, 325. [Google Scholar] [CrossRef]
  10. Elsamadony, M.; Mostafa, A.; Fujii, M.; Tawfik, A.; Pant, D. Advances towards Understanding Long Chain Fatty Acids-Induced Inhibition and Overcoming Strategies for Efficient Anaerobic Digestion Process. Water Res. 2021, 190, 116732. [Google Scholar] [CrossRef]
  11. Ziels, R.M.; Karlsson, A.; Beck, D.A.C.; Ejlertsson, J.; Yekta, S.S.; Bjorn, A.; Stensel, H.D.; Svensson, B.H. Microbial Community Adaptation Influences Long-Chain Fatty Acid Conversion during Anaerobic Codigestion of Fats, Oils, and Grease with Municipal Sludge. Water Res. 2016, 103, 372–382. [Google Scholar] [CrossRef]
  12. Diamantis, V.; Eftaxias, A.; Stamatelatou, K.; Noutsopoulos, C.; Vlachokostas, C.; Aivasidis, A. Bioenergy in the Era of Circular Economy: Anaerobic Digestion Technological Solutions to Produce Biogas from Lipid-Rich Wastes. Renew. Energy 2021, 168, 438–447. [Google Scholar] [CrossRef]
  13. Neves, L.; Pereira, M.A.; Mota, M.; Alves, M.M. Detection and Quantification of Long Chain Fatty Acids in Liquid and Solid Samples and Its Relevance to Understand Anaerobic Digestion of Lipids. Bioresour Technol. 2009, 100, 91–96. [Google Scholar] [CrossRef] [PubMed]
  14. Parra-Orobio, B.A.; Cruz-Bournazou, M.N.; Torres-Lozada, P. Single-Stage and Two-Stage Anaerobic Digestion of Food Waste: Effect of the Organic Loading Rate on the Methane Production and Volatile Fatty Acids. Water Air Soil Pollut. 2021, 232, 105. [Google Scholar] [CrossRef]
  15. Yan, W.; Vadivelu, V.; Maspolim, Y.; Zhou, Y. In-Situ Alkaline Enhanced Two-Stage Anaerobic Digestion System for Waste Cooking Oil and Sewage Sludge Co-Digestion. Waste Manag. 2021, 120, 221–229. [Google Scholar] [CrossRef] [PubMed]
  16. Barros, M.V.; Salvador, R.; de Francisco, A.C.; Piekarski, C.M. Mapping of Research Lines on Circular Economy Practices in Agriculture: From Waste to Energy. Renew. Sustain. Energy Rev. 2020, 131, 109958. [Google Scholar] [CrossRef]
  17. APHA. Standard Methods for the Examination of Water and Wastewater, 21st ed.; American Public Health Association/American Water Works Association/Water Environment Federation: Washington, DC, USA, 2005. [Google Scholar]
  18. Nordmann, W. Die Überwachung Der Schlammfaulung. KA-Informationen Für Das Betriebspersonal. Beil. Zur Korresp. Abwasser 1977, 3, 77. [Google Scholar]
  19. Bolyen, E.; Rideout, J.R.; Dillon, M.R.; Bokulich, N.A.; Abnet, C.C.; Al-Ghalith, G.A.; Alexander, H.; Alm, E.J.; Arumugam, M.; Asnicar, F.; et al. Reproducible, Interactive, Scalable and Extensible Microbiome Data Science Using QIIME 2. Nat. Biotechnol. 2019, 37, 852–857. [Google Scholar] [CrossRef] [PubMed]
  20. Amir, A.; McDonald, D.; Navas-Molina, J.A.; Kopylova, E.; Morton, J.T.; Zech Xu, Z.; Kightley, E.P.; Thompson, L.R.; Hyde, E.R.; Gonzalez, A.; et al. Deblur Rapidly Resolves Single-Nucleotide Community Sequence Patterns. mSystems 2017, 2, e00191-16. [Google Scholar] [CrossRef]
  21. Bokulich, N.A.; Kaehler, B.D.; Rideout, J.R.; Dillon, M.; Bolyen, E.; Knight, R.; Huttley, G.A.; Gregory Caporaso, J. Optimizing Taxonomic Classification of Marker-Gene Amplicon Sequences with QIIME 2’s Q2-Feature-Classifier Plugin. Microbiome 2018, 6, 90. [Google Scholar] [CrossRef]
  22. Quast, C.; Pruesse, E.; Yilmaz, P.; Gerken, J.; Schweer, T.; Yarza, P.; Peplies, J.; Glöckner, F.O. The SILVA Ribosomal RNA Gene Database Project: Improved Data Processing and Web-Based Tools. Nucleic Acids Res. 2013, 41, D590–D596. [Google Scholar] [CrossRef]
  23. Chong, J.; Liu, P.; Zhou, G.; Xia, J. Using MicrobiomeAnalyst for Comprehensive Statistical, Functional, and Meta-Analysis of Microbiome Data. Nat. Protoc. 2020, 15, 799–821. [Google Scholar] [CrossRef]
  24. Hammer, O.; Harper, D.A.T.; Ryan, P.D. PAST: Paleontological Statistics Software Package for Education and Data Analysis. Palaeontol. Electron. 2001, 4, 1. [Google Scholar]
  25. Rocchetti, G.; Ghilardelli, F.; Carboni, E.; Atzori, A.S.; Masoero, F.; Gallo, A. Milk Metabolome Reveals Pyrimidine and Its Degradation Products as the Discriminant Markers of Different Corn Silage-Based Nutritional Strategies. J. Dairy Sci. 2022, 105, 8650–8663. [Google Scholar] [CrossRef] [PubMed]
  26. Baldi, F.; Pecorini, I.; Iannelli, R. Comparison of Single-Stage and Two-Stage Anaerobic Co-Digestion of Food Waste and Activated Sludge for Hydrogen and Methane Production. Renew. Energy 2019, 143, 1755–1765. [Google Scholar] [CrossRef]
  27. Schievano, A.; Tenca, A.; Scaglia, B.; Merlino, G.; Rizzi, A.; Daffonchio, D.; Oberti, R.; Adani, F. Two-Stage vs Single-Stage Thermophilic Anaerobic Digestion: Comparison of Energy Production and Biodegradation Efficiencies. Environ. Sci. Technol. 2012, 46, 8502–8510. [Google Scholar] [CrossRef]
  28. Garuti, M.; Sinisgalli, E.; Soldano, M.; Jimenez Rodriguez, A.; Fermoso, F.G. Biochemical Conditions for Anaerobic Digestion of Agricultural Feedstocks: A Full-Scale Study Linking Elements Concentration and Residual Methane Potential. Biomass Bioenergy 2023, 176, 106899. [Google Scholar] [CrossRef]
  29. Wainaina, S.; Lukitawesa; Kumar Awasthi, M.; Taherzadeh, M.J. Bioengineering of Anaerobic Digestion for Volatile Fatty Acids, Hydrogen or Methane Production: A Critical Review. Bioengineered 2019, 10, 437–458. [Google Scholar] [CrossRef]
  30. Van Ginkel, S.; Logan, B.E. Inhibition of Biohydrogen Production by Undissociated Acetic and Butyric Acids. Environ. Sci. Technol. 2005, 39, 9351–9356. [Google Scholar] [CrossRef] [PubMed]
  31. Valentino, F.; Munarin, G.; Biasiolo, M.; Cavinato, C.; Bolzonella, D.; Pavan, P. Enhancing Volatile Fatty Acids (VFA) Production from Food Waste in a Two-Phases Pilot-Scale Anaerobic Digestion Process. J. Environ. Chem. Eng. 2021, 9, 106062. [Google Scholar] [CrossRef]
  32. Fu, Z.; Sun, L.; Hou, M.; Hao, J.; Lu, Q.; Liu, T.; Ren, X.; Jia, Y.; Wang, Z.; Ge, G. Effects of Different Harvest Frequencies on Microbial Community and Metabolomic Properties of Annual Ryegrass Silage. Front. Microbiol. 2022, 13, 971449. [Google Scholar] [CrossRef]
  33. Vaccalluzzo, A.; Celano, G.; Pino, A.; Calabrese, F.M.; Foti, P.; Caggia, C.; Randazzo, C. Metagenetic and Volatilomic Approaches to Elucidate the Effect of Lactiplantibacillus Plantarum Starter Cultures on Sicilian Table Olives. Front. Microbiol. 2022, 12, 771636. [Google Scholar] [CrossRef] [PubMed]
  34. Fontana, A.; Kougias, P.G.; Treu, L.; Kovalovszki, A.; Valle, G.; Cappa, F.; Morelli, L.; Angelidaki, I.; Campanaro, S. Microbial Activity Response to Hydrogen Injection in Thermophilic Anaerobic Digesters Revealed by Genome-Centric Metatranscriptomics. Microbiome 2018, 6, 194. [Google Scholar] [CrossRef] [PubMed]
  35. Khatami, K.; Atasoy, M.; Ludtke, M.; Baresel, C.; Eyice, Ö.; Cetecioglu, Z. Bioconversion of Food Waste to Volatile Fatty Acids: Impact of Microbial Community, pH and Retention Time. Chemosphere 2021, 275, 129981. [Google Scholar] [CrossRef] [PubMed]
  36. Merlino, G.; Rizzi, A.; Schievano, A.; Tenca, A.; Scaglia, B.; Oberti, R.; Adani, F.; Daffonchio, D. Microbial Community Structure and Dynamics in Two-Stage vs Single-Stage Thermophilic Anaerobic Digestion of Mixed Swine Slurry and Market Bio-Waste. Water Res. 2013, 47, 1983–1995. [Google Scholar] [CrossRef] [PubMed]
  37. Liu, X.; Zhu, X.; Yellezuome, D.; Liu, R.; Liu, X.; Sun, C.; Abd-Alla, M.; Rasmey, A.-H. Effects of Adding Thermoanaerobacterium Thermosaccharolyticum in the Hydrogen Production Stage of a Two-Stage Anaerobic Digestion System on Hydrogen-Methane Production and Microbial Communities. Fuel 2023, 342, 127831. [Google Scholar] [CrossRef]
  38. Perman, E.; Schnürer, A.; Björn, A.; Moestedt, J. Serial Anaerobic Digestion Improves Protein Degradation and Biogas Production from Mixed Food Waste. Biomass Bioenergy 2022, 161, 106478. [Google Scholar] [CrossRef]
  39. Owusu-Agyeman, I.; Plaza, E.; Cetecioglu, Z. Long-Term Alkaline Volatile Fatty Acids Production from Waste Streams: Impact of pH and Dominance of Dysgonomonadaceae. Bioresour. Technol. 2022, 346, 126621. [Google Scholar] [CrossRef]
  40. Suksong, W.; Kongjan, P.; Prasertsan, P.; O-Thong, S. Thermotolerant Cellulolytic Clostridiaceae and Lachnospiraceae Rich Consortium Enhanced Biogas Production from Oil Palm Empty Fruit Bunches by Solid-State Anaerobic Digestion. Bioresour Technol. 2019, 291, 121851. [Google Scholar] [CrossRef]
  41. Li, Y.; Xu, H.; Hua, D.; Zhao, B.; Mu, H.; Jin, F.; Meng, G.; Fang, X. Two-Phase Anaerobic Digestion of Lignocellulosic Hydrolysate: Focusing on the Acidification with Different Inoculum to Substrate Ratios and Inoculum Sources. Sci. Total Environ. 2020, 699, 134226. [Google Scholar] [CrossRef]
  42. Wang, C.; Zuo, J.; Chen, X.; Xing, W.; Xing, L.; Li, P.; Lu, X.; Li, C. Microbial Community Structures in an Integrated Two-Phase Anaerobic Bioreactor Fed by Fruit Vegetable Wastes and Wheat Straw. J. Environ. Sci. 2014, 26, 2484–2492. [Google Scholar] [CrossRef]
  43. Poszytek, K.; Pyzik, A.; Sobczak, A.; Lipinski, L.; Sklodowska, A.; Drewniak, L. The Effect of the Source of Microorganisms on Adaptation of Hydrolytic Consortia Dedicated to Anaerobic Digestion of Maize Silage. Anaerobe 2017, 46, 46–55. [Google Scholar] [CrossRef] [PubMed]
  44. Micolucci, F.; Gottardo, M.; Pavan, P.; Cavinato, C.; Bolzonella, D. Pilot Scale Comparison of Single and Double-Stage Thermophilic Anaerobic Digestion of Food Waste. J. Clean. Prod. 2017, 171, 1376–1385. [Google Scholar] [CrossRef]
  45. Silvestre, G.; Illa, J.; Fernández, B.; Bonmatí, A. Thermophilic Anaerobic Co-Digestion of Sewage Sludge with Grease Waste: Effect of Long Chain Fatty Acids in the Methane Yield and Its Dewatering Properties. Appl. Energy 2014, 117, 87–94. [Google Scholar] [CrossRef]
  46. Usman, M.; Zhao, S.; Jeon, B.-H.; Salama, E.-S.; Li, X. Microbial β-Oxidation of Synthetic Long-Chain Fatty Acids to Improve Lipid Biomethanation. Water Res. 2022, 213, 118164. [Google Scholar] [CrossRef] [PubMed]
  47. Lalman, J.A.; Bagley, D.M. Anaerobic Degradation and Methanogenic Inhibitory Effects of Oleic and Stearic Acids. Water Res. 2001, 35, 2975–2983. [Google Scholar] [CrossRef]
  48. Deng, Z.; Muñoz Sierra, J.; Ferreira, A.L.M.; Cerqueda-Garcia, D.; Spanjers, H.; van Lier, J.B. Effect of Operational Parameters on the Performance of an Anaerobic Sequencing Batch Reactor (AnSBR) Treating Protein-Rich Wastewater. Environ. Sci. Ecotechnol. 2024, 17, 100296. [Google Scholar] [CrossRef] [PubMed]
  49. DeCola, A.C.; Toppen, L.C.; Brown, K.P.; Dadkhah, A.; Rizzo, D.M.; Ziels, R.M.; Scarborough, M.J. Microbiome Assembly and Stability during Start-up of a Full-Scale, Two-Phase Anaerobic Digester Fed Cow Manure and Mixed Organic Feedstocks. Bioresour. Technol. 2024, 394, 130247. [Google Scholar] [CrossRef] [PubMed]
  50. Wang, M.; Wang, J.; Liu, K.; Li, Q.; Li, W.; Fan, J.; Wang, S.; Shi, F.; Zuo, X.; Li, P. Relationship between the Effects of Heat Pre-Treatment on Anaerobic Performance of Pig Manure and the Microbial Variation within Reactors. Chem. Eng. J. 2023, 461, 141991. [Google Scholar] [CrossRef]
  51. Braga Nan, L.; Trably, E.; Santa-Catalina, G.; Bernet, N.; Delgenès, J.-P.; Escudié, R. Biomethanation Processes: New Insights on the Effect of a High H2 Partial Pressure on Microbial Communities. Biotechnol. Biofuels 2020, 13, 141. [Google Scholar] [CrossRef]
  52. Zhuravleva, E.A.; Shekhurdina, S.V.; Kotova, I.B.; Loiko, N.G.; Popova, N.M.; Kryukov, E.; Kovalev, A.A.; Kovalev, D.A.; Litti, Y.V. Effects of Various Materials Used to Promote the Direct Interspecies Electron Transfer on Anaerobic Digestion of Low-Concentration Swine Manure. Sci. Total Environ. 2022, 839, 156073. [Google Scholar] [CrossRef]
Figure 1. (a) α−diversity of feedstock and digestate samples based on Shannon index. (b) PcoA plot representing the β−diversity of sample categories: digestate from acidogenic (R1), methanogenic (R2) and control (R3) reactors, and feedstock (VF: vegetable feedstock = barley residues, ryegrass silage, milling byproducts, olive pomace; PM: poultry manure; PS: pig slurry).
Fermentation 10 00293 g001
Figure 2. Stacked bar plot representing the ten most abundant families in feedstock (a), and in the inocula (T0) and digestate at the two considered timepoints of the reactors’ steady state (T1, T2) (b).
Fermentation 10 00293 g002
Figure 3. CCA triplot explaining the relationships between main bacterial families found in the acidogenic (R1), methanogenic (R2) and control (R3) reactors, and principal process parameters. Straight green lines indicate the direction of increase in each variable, and lengths are proportional to their strength on the abundance of bacterial families.
Fermentation 10 00293 g003
Figure 4. Stacked bar plot representing bacterial genera dominating the acidogenic (R1), methanogenic (R2) and control (R3) reactors in the steady state (T2).
Fermentation 10 00293 g004
Figure 5. Supervised OPLS−DA prediction models considering the most abundant genera found in acidogenic (R1), methanogenic (R2) and control (R3) reactors, and LCFA content in the reactors’ steady state (T2).
Fermentation 10 00293 g005
Table 1. Main physico-chemical parameters of the acidogenic (R1) and methanogenic (R2 and R3) inocula (T0), and of the digestate samples collected in the reactors’ steady state (T1 and T2).
ParameterInoculumSteady State
T0T1T2
R1R2/R3R1R2R3R1R2R3
TS (g/kg)139.8 ± 10.148.1 ± 3.2102.4 ± 9.958.7 ± 4.278.3 ± 4.1127.0 ± 10.261.0 ± 3.679.3 ± 6.2
VS (g/kg)123.1 ± 9.238.0 ± 2.288.6 ± 9.245.5 ± 3.262.7 ± 3.5111.5 ± 10.248.9 ± 2.665.0 ± 5.8
COD (mg/kg)247,513.0 ± 13,336.655,075.0 ± 1423.6105,821.3 ± 19,472.046,872.0 ± 13,186.856,694.3 ± 19,175.5117,311.3 ± 9333.147,288.7 ± 4230.749,235.0 ± 2138.0
FOS/TAC5.6 ± 0.70.3 ± 0.06.1 ± 0.70.2 ± 0.00.3 ± 0.05.0 ± 0.40.3 ± 0.00.3 ± 0.0
pH5.5 ± 0.28.2 ± 0.05.4 ± 0.27.8 ± 0.07.8 ± 0.15.6 ± 0.07.7 ± 0.17.7 ± 0.1
Acetate (mg/kg)5617.0 ± 1492.1413.0 ± 223.65201.7 ± 1199.959.1 ± 51.173.7 ± 69.55080.0 ± 471.1101.3 ± 92.4135.0 ± 123.4
Propionate (mg/kg)3483.0 ± 39.7n.d. 12904.3 ± 68.9n.d.n.d.3140.0 ± 351.6n.d.n.d.
Butyrate (mg/kg)5395.0 ± 447.7n.d.2698.3 ± 552.4n.d.n.d.2463.0 ± 647.1n.d.n.d
1 n.d.: not detected; values < 50 mg/kg.
Table 2. Concentration of the main LCFAs detected in digestate samples of the acidogenic (R1), methanogenic (R2) and control (R3) reactors in the steady state (T2).
LCFAR1
(mg/kg)
R2
(mg/kg)
R3
(mg/kg)
Ottanoic Acid (C8)208.5 ± 27.130.3 ± 1.527.6 ± 1.1
Palmitic Acid (C16)2764.2 ± 420.9445.7 ± 187.5543.4 ± 165.1
Stearic Acid (C18)1751.5 ± 154.1153.1 ± 10.021.9 ± 4.5
Oleic Acid (C18:1)1369.5 ± 258.3252.4 ± 141.3391.0 ± 118.9
Linoleic Acid (C18:2)1794.7 ± 389.4450.6 ± 300.1620.2 ± 201.7
Linolenic Acid (C18:3)545.5 ± 140.1213.7 ± 145.7223.5 ± 86.9
Disclaimer/Publisher’s Note: The statements, opinions and data contained in all publications are solely those of the individual author(s) and contributor(s) and not of MDPI and/or the editor(s). MDPI and/or the editor(s) disclaim responsibility for any injury to people or property resulting from any ideas, methods, instructions or products referred to in the content.

