Article

Optimization of Biodegradation of Common Bean Biomass for Fermentation Using Trichoderma asperellum WNZ-21 and Artificial Neural Networks

by
Salma Saleh Alrdahe
1,*,
Zeiad Moussa
2,
Yasmene F. Alanazi
3,
Haifa Alrdahi
4,
WesamEldin I. A. Saber
2,* and
Doaa Bahaa Eldin Darwish
1,5
1
Department of Biology, Faculty of Science, University of Tabuk, Tabuk 71491, Saudi Arabia
2
Microbial Activity Unit, Microbiology Department, Soils, Water and Environment Research Institute, Agricultural Research Center, Giza 12619, Egypt
3
Department of Biochemistry, Faculty of Science, University of Tabuk, Tabuk 71491, Saudi Arabia
4
School of Computer Science, Faculty of Science and Engineering, University of Manchester, Oxford Road, Manchester M13 9PL, UK
5
Botany Department, Faculty of Science, Mansoura University, Mansoura 35511, Egypt
*
Authors to whom correspondence should be addressed.
Fermentation 2024, 10(7), 354; https://doi.org/10.3390/fermentation10070354
Submission received: 11 June 2024 / Revised: 9 July 2024 / Accepted: 11 July 2024 / Published: 13 July 2024
(This article belongs to the Special Issue New Research on Strains Improvement and Microbial Biosynthesis)

Abstract

:
This study showcases a promising approach to sustainably unlocking plant biomass residues by combining biodegradation with artificial intelligence to optimize the process. Specifically, we utilized the definitive screening design (DSD) and artificial neural networks (ANNs) to optimize the degradation of common bean biomass by the endophytic fungus Trichoderma asperellum WNZ-21. The optimized process yielded a fungal hydrolysate rich in 12 essential and non-essential amino acids, totaling 18,298.14 μg/g biomass. GC-MS analysis revealed four potential novel components not previously reported in microbial filtrates or plants and seven components exclusive to plant sources but not reported in microbial filtrates. The hydrolysate contained phenolic, flavonoid, and tannin compounds, as confirmed by FT-IR analysis. High-resolution transmission electron microscopy depicted structures resembling amino acid micelles and potential protein aggregates. The hydrolysate exhibited antioxidant, antibacterial, and anticancer properties and innovatively induced apoptotic modulation in the MCF7 cancer cell line. These findings underscore the potential of ANN-optimized fermentation for various applications, particularly in anticancer medicine due to its unique composition and bioactivities. The integration of the DSD and ANNs presents a novel technique for biomass biodegradation, warranting the valorization of plant biomass and suggesting a further exploration of the new components in the fungal hydrolysate. This approach represents the basic concept for exploring other biomass sources and in vivo studies.

1. Introduction

Several attempts are being made to optimize the degradation of plant biomass residues to maintain sustainable development. Large quantities of this biomass enter the environment annually [1,2]. Phaseolus vulgaris L. (common bean) is the most widespread legume plant worldwide; it is a member of the Fabaceae family. Residues of common bean biomass (RCBBs) contain high amounts of protein, representing a value-added biomass if it is being well used. Notably, the safe disposal of RCBBs is expected to positively reflect on the environment and human health as well. Unfortunately, the hard-to-degrade feature of RCBBs is a real challenge and further limits their biotechnological applications.
Although various methods could be utilized, microbial degradation can instead facilitate the decomposition process since microbes have an enzymatic system (e.g., protease and cellulase) that can catalyze the biodegradation of biomass components [3]. The degradation of RCBBs leads to the release of biomolecules, e.g., amino acids (AAs). Proteinaceous residuals could be biotechnologically attractive for AA production because of their low cost and high protein content.
AAs play a crucial role in various fields, including agriculture, medicine, and pharmaceuticals [3]. They are derived from protein through acid hydrolysis, a process involving the treatment of proteinaceous material with strong acids, typically hydrochloric or sulfuric acid. This treatment cleaves the peptide bonds between AAs, resulting in the liberation of individual AAs. The reaction necessitates high temperature and pressure and is typically conducted in specialized equipment, such as a hydrolysis reactor. However, this method may lead to the destruction of certain AAs, such as cysteine and cystine [4]. Therefore, the direct bioconversion of proteinaceous residuals into AA-rich hydrolysates in a single-step fermentation is a real challenge. Alternatively, the process could be achieved if a suitable microorganism is used for the bioconversion of proteinaceous residuals, as a substrate, into AA-rich hydrolysates. Therefore, finding an optimum biodegradation method with a suitable microorganism that can convert residual biomass into valuable biomolecules without intermediate processing is of great importance.
Endophytes are microbial communities that grow intra- and/or intercellularly within plant tissues without causing overt symptoms in the host plants [5]. These microorganisms serve as a potential source of novel natural products (like alkaloids, phenolics, steroids, quinones, tannins, and saponins) with broad therapeutic potential including anticancer, antioxidant, and antibacterial properties [6]. Among the endophytes, the fungal microbiome represents a crucial and variable branch that can be significantly influenced by conditions [7]. Despite the considerable contribution of fungal endophytes to the microbiome, the full exploration of this fungal microbiome remains incomplete to date [8,9].
Choosing the right fermentation process is crucial in biofermentation technological studies. In solid-state fermentation (SSF), microbes grow on moist solids, with minimal free water, to create biomolecules [10]. SSF outshines submerged fermentation with easier setup, less energy use, more product per volume, and more stable molecules. It shines in turning cheap leftover materials into valuable products in small areas with low water and contamination risks [3]. Consequently, SSF has garnered attention to produce various microbial biomolecules.
Among the statistical screening designs, the definitive screening design DSD is a powerful new screening design that quickly identifies key factors with even fewer experiments than older methods. Unlike traditional approaches, it delivers unbiased results and can detect non-linear effects, potentially saving time and resources [10]. This study uniquely employs the DSD, a technique seldom used in biology, to optimize the biological degradation of plant biomass residues, paving the way for future explorations in this area.
Many screening designs primarily focus on estimating the main effects, neglecting the assessment of curvature between factors and responses. Consequently, a second step of experiments is often necessary to capture this curvature and assess interactions among variables. Artificial intelligence can effectively handle this step, enabling a more comprehensive analysis of experimental data.
Artificial neural networks (ANNs) play a central role in both artificial intelligence and machine learning. Inspired by the structure and function of the human brain, these computational models leverage interconnected nodes within hidden layers to learn and process information. Notably, ANNs can independently identify patterns and make decisions based on data, without requiring explicit instructions [11,12].
Building an ANN involves choosing its architecture, defining hidden layer neurons, training, validating, and testing. Backpropagation is the learning mechanism that adjusts internal parameters to minimize the gap between predicted and desired outputs. This intelligent process trains the ANN to accurately recreate the target model. Notably, ANNs excel at handling non-linearities, potentially surpassing simpler models in accuracy and offering an efficient alternative [13,14].
Developing efficient methods to directly convert waste biomass into valuable biomolecules using suitable microorganisms holds immense potential. This study breaks new ground by applying a novel approach (DSD) to model the biodegradation of protein-rich residues into AAs, a field lacking prior modeling efforts. Additionally, while ANNs have proven successful in various biotechnological applications, their use in modeling AA production from plant biomass remains unexplored. This research aims to establish a model for this process and assess the biological activities, including antioxidant, antibacterial, and anticancer effects, of the resulting fungal filtrate. This dual approach offers a comprehensive understanding of the process and its potential benefits.

2. Materials and Methods

The current endophytic fungus was previously isolated from common bean plants as a proteolytic fungus that can produce cellulase, xylanase, and protease enzymes. It was identified as Trichoderma asperellum WNZ-21, with the GenBank accession number OR857252.1.

2.1. Preparation of RCBBs

The RCBB was used as a fermentation substrate during SSF. To achieve this objective, the RCBB was dried overnight at 70 °C and subsequently ground until obtaining the powder form, with pieces measuring no longer than 1.0–2.0 mm.

2.2. Cultivation Medium

To produce AAs, the biodegradation process was performed using the SSF technique. A total of 1 gm of the RCBB was mixed with mineral salts (NaH2PO4; 12.8, KH2PO4; 3, NaCl; 0.5, NH4Cl; 1, MgSO4·7H2O; 0.5, and CaCl2·2H2O; 0.01 mg/g RCB) used to support the proteolytic degradation, according to [15] with some modifications, in 250 mL Erlenmeyer flasks and autoclaved for 15 min at 121 °C. Inoculation was performed using 1 mL of 106 spore suspension obtained from the 7-day-old T. asperellum WNZ-21. Throughout the incubation, temperature was kept at 28 ± 2 °C, and the moisture level was maintained at approximately 65% using sterilized tap water as needed. Ultimately, tween 80 (10 mL of 0.01%) was added to each flask, followed by shaking on a shaker (150 rpm, 30 min), then filtered through filter paper, and finally centrifuged at 5000 rpm for 20 min to separate the fungal filtrate including the free AAs. A negative control set was prepared by incubating a non-inoculated flask with the same fermentation medium.

2.3. Modeling of AA Production

2.3.1. Screening the Medium Components Using the DSD

The experimental structure of the DSD was constructed to explore the relative importance and significance of each factor of the previous SSF medium. Ten continuous independent variables, including nutritional and physical conditions, were tested at two corner points, low and high, coded as −1 and +1, respectively, and one midpoint level (0) for each factor. The DSD employs center points where all factors are set at their midpoint values between the low and high settings (Table 1). These coded levels facilitate analysis and avoid confusion with actual factor values. Equation (1) details the conversion between the coded levels and their corresponding actual values for each factor [11]:
x i = ( X i   X 0 ) / Δ X i
where “Xi” represents the coded value of factor “i”, while “ΔXi” signifies the change in its actual value from the center point.
The SSF technique was implemented based on various fermentation design combinations, as outlined in the DSD matrix (Table 2). Its application was aimed at screening and optimizing the fermentation factors that influence the release of AAs from RCBBs. Following the design matrix, 21 experimental runs were generated and subsequently examined in triplicate in the laboratory. The resulting filtrate, also referred to as the hydrolysate, was analyzed for the content of total free AAs (TFAAs).

2.3.2. The Architecture of the ANN

The data of the DSD were used to build an ANN prediction model for the maximization of AA production by the endophytic fungus. The ANN architecture consisted of an input layer, a hidden layer (h), and an output layer. The input layer nodes represented the significant experimental parameters obtained for the previous DSD model. The output layer node represented the predicted optimal AAs.
To create the ANN model, the DSD experimental data were randomly divided into two sets: training (66.67%) and validation (33.33%). This division allows the model to learn from the majority of the data while reserving a portion for assessing its generalizability. The training set was used to optimize the model’s weights and biases through a process known as backpropagation. The validation set was used to assess the model’s performance and prevent overfitting. A third data set provided an external group to test the model performance, assessing predictive robustness and generalizability.
The model’s predictions were compared to the actual experimental results to assess its generalization capabilities and overall accuracy. The trial-and-error search method was used. Accordingly, a fully connected neural network platform was constructed, continuing input, and output layers, the number of hidden layers (h), and the number of neurons in each hidden layer were also investigated and constructed, considering the kind of activation function, the learning rate, and the value of the squared penalty. Machine learning continued until the network achieved the highest precision, enabling it to predict outputs similar or very close to the target value. For this aim, the ANN was evaluated by testing the error values, i.e., root average square error (RASE) and mean absolute deviation (MAD), that maximize the coefficient of determination (R2).

2.3.3. Software and Statistical Procedure

The DSD experiments were replicated three times, and both the experimental design and statistical analysis (including DSD, ANN topology, and model construction) were conducted using JMP Pro.® (Version 17). The software then trained the ANN model using 42 runs and assessed its validity with an additional 21 runs.

2.4. Chemical Tests

2.4.1. AA Detection

During all previous experiments, the AAs in the fungal hydrolysate were used as an indicator for the biodegradation process. The method described by Cupp-Enyard [16] was used to determine the AA content, utilizing the Folin–Ciocalteu reagent with tyrosine as the standard.

2.4.2. Phytochemical Analysis

The tannin contents in the fungal filtrate were measured using the vanillin–hydrochloride method [17,18]. The results were then compared to a standard curve of tannic acid to estimate the total tannin content. The Folin–Ciocalteu test was used to measure the total amount of phenolics in the fungal filtrate, based on Sánchez-Rangel et al. [19]. The results were compared to a standard curve of gallic acid to determine the total phenolic content. An aluminum chloride colorimetric assay was employed to measure the total amount of flavonoids in the fungal filtrate [20]. The results of the total flavonoid content were recorded by comparison to the standard curve of catechin.

2.4.3. High-Performance Liquid Chromatography (HPLC) Analysis

The fungal filtrate sample (0.2 g) was suspended in 5 mL water and 5 mL 6 M HCl. The resulting mixture underwent heating at 120 °C for 24 h and subsequent filtration. Following this, 1 mL of the filtrate was dried and resuspended in 0.1 M HCl, and the prepared solution was injected into an HPLC system for analysis [21]. AA analysis was conducted using an Agilent 1260 series HPLC system featuring an Eclipse Plus C18 column and a dual-wavelength detection scheme. The comprehensive profiling of AAs in biological fluids was accomplished utilizing the same Agilent 1260 series HPLC system, which was equipped with an Eclipse Plus C18 column (4.6 mm × 250 mm i.d., 5 μm), maintaining a constant temperature at 40 °C. The mobile phase buffer comprised sodium phosphate/borate at a pH of 8.2, transitioning linearly to the second mobile phase, consisting of ACN: MeOH:H2O (45:45:10), for 33.4 min at a flow rate of 1.5 mL/min. The separation of diverse AAs based on hydrophobicity was achieved using a linear gradient program, gradually increasing the concentration of the second mobile phase over time. Dual-wavelength detection was employed to capture AAs, with fluorescence switching occurring between 0 and 27 min at 340/450 nm and from 27 to 35 min at 266/306 nm (Excitation/Emission). This method allows for precise and efficient AA analysis in biological samples. The identities of the fungal filtrate were established by comparing their retention times with known standards of AAs under the same HPLC conditions. A calibration curve was generated using this standard mixture containing all proteinogenic AAs for quantification based on peak areas and retention times. The peak areas of the identified AAs were then compared to the curve, allowing for the determination of individual amino acid concentrations in the filtrate.

2.4.4. Gas Chromatography-Mass Spectrometry (GC-MS) Analysis

Metabolites produced by the endophytic fungus were analyzed using GC-MS. A total of 1.0 mL of the fungal filtrate was separated and lyophilized, then resuspended in 50 µL of a methoxyamine hydrochloride solution (20 mg/mL in pyridine). This solution underwent incubation for 90 min to facilitate the oximation reaction. Subsequently, 50 µL of a derivatization reagent (bis(trimethylsilyl)trifluoroacetamide (BSTFA) with 1% trimethylchlorosilane (TMCS)) was added and incubated at 70 °C for 30 min in a Dry Block Heater to convert sample functional groups into trimethylsilyl (TMS) derivatives for optimal GC-MS analysis.
The analysis utilized a Thermo Scientific Trace 1300 gas chromatography system coupled with a Thermo Scientific TSQ 9000 Triple Quadrupole mass spectrometric detector (Waltham, MA, USA). The system featured a capillary column (TG-5MS, 30 × 0.25 mm × 0.25 µm). Helium, maintained at a constant flow rate of approximately 1.2 mL/min, facilitated the sample’s progression through the instrument. Employing a splitless technique ensured the complete introduction of the 1-microliter sample into the hot injector, maximizing sensitivity. Following injection, a 5 min waiting period allowed for the complete evaporation of the solvent before the separation process. Electron impact mode at 50 electron volts induced the removal of electrons from molecules, generating positively charged ions. Ions in the mass-to-charge ratio range of 50 to 500 were sorted and detected. To facilitate efficient ionization, the environment was maintained at 320 °C. Auto-tuning at 1616 V ensured optimal signal amplification.
The gas chromatography oven employed a specific temperature program for component separation based on boiling points. The initial step involved heating to 40 °C and holding for 1.5 min, providing a gentle start for volatile compounds. Subsequently, the temperature was increased at a rate of 5 °C/min to 90 °C for an additional 1.5 min, further separating moderately volatile components. Continuing the temperature ramp, the system was heated at 5 °C/min to 180 °C for 2 min, allowing more complex molecules to elute. A subsequent increase at 4 °C/min to 280 °C for 1 min facilitated the efficient elution of high-boiling point components. Finally, the temperature was raised to 320 °C for 5 min to fully purge the system. Detected peaks were compared with known mass spectra from the Wiley, NIST, and Pest databases, aiding in the identification of separated components.

2.4.5. Fourier Transform Infrared (FT-IR) Spectroscopy

The prepared fungal filtrate consisted of 5 mg mixed with 100 mg of potassium bromide (KBr). To identify the chemical composition and the potential active groups, the spectrum was investigated via an FT-IR Vertex 70 RAM II IR Bruker Spectrometer, Ettlingen, Germany. The FT-IR spectrum was determined in the range between 500 and 4000 cm−1 wavenumbers. The resulting peaks were plotted with wavenumber (cm−1) on the X-axis and transmittance (percent) on the Y-axis.

2.5. High-Resolution Transmission Electron Microscopy (HR-TEM)

For HR-TEM analysis, a drop of the T. asperellum WNZ-21 fungal filtrate was deposited onto a carbon-coated grid and allowed to air-dry. The grid was then loaded into a ThermoScientific Talos F200i instrument (Waltham, MA, USA) and imaged at an accelerating voltage of 200 kV. High-resolution images were captured at various magnifications to visualize the morphology and size distribution of the observed particles. Zeta sizer Nano (Malvern, UK. Model: Zeta sizer Nano series, Nano ZS) was used for measuring the zeta potential analysis of the fungal filtrate.

2.6. Biological Tests

2.6.1. Antioxidant Activity

The antioxidant capacity of the samples was analyzed by the colorimetric 2,2-diphenyl-1-picrylhydrazyl (DPPH) (Sigma Aldrich (St. Louis, MO, USA) method [22], using ascorbic acid as a reference. The sample was prepared in serial dilutions using equal volumes of methanol. A 0.135 mM DPPH solution was mixed with an equal volume of each dilution. After 30 min of incubation in the dark at room temperature, the absorbance of each sample was measured at 517 nm using the spectrophotometer Spekol 11 Spectrophotometer, Analytic Jena AG, Jena, Germany, with a UV lamp (Vilber Lourmat-6.LC, VILBER Smart Imaging, Marne-la-Vallée, France). The remaining DPPH percentage was calculated using Equation (2):
Remaining   DPPH   ( % ) = ( ( DPPH ) T 0   ( DPPH ) T   ) / ( DPPH )   T 0   × 100
The equation calculates the percentage of DPPH remaining after 30 min (T) compared to the initial concentration (T0). Exponential curves were fitted to plots of remaining DPPH versus sample concentration (mg/mL) to determine the IC50 value. IC50 represents the effective concentration required to scavenge 50% of the initial DPPH, with lower values indicating higher antioxidant capacity [23].

2.6.2. Antibacterial Activity

This study investigated two Gram-negative bacterial strains, Escherichia coli (ATCC 10536) and Klebsiella pneumoniae (ATCC 10031), and two Gram-positive strains, Staphylococcus aureus (ATCC 6538) and Bacillus cereus (EMCC 1080). The bacterial strains were supplied by the Microbiological Resources Centre (Mircen, Cairo, Egypt) and the American Type Culture Collection (ATCC, Manassas, VA, USA).
The agar well diffusion technique was applied to measure the antimicrobial activity of the fungal filtrate [24]. Dimethyl sulfoxide (DMSO) was used as a negative control, and amoxicillin, gentamycin, cefotaxime, and ampicillin/sulbactam (A/S) were used as positive controls.
The method involves inoculating the entire agar surface with a standardized microbial suspension. Then, a sterile cork borer was used to create a 6 mm well, into which a specific volume (100 µL) of the test the fungal filtrate at a desired concentration was introduced. Following incubation under optimal conditions for the target microorganism, the antimicrobial agent diffused through the agar, inhibiting the growth of the test strain. The size of the resulting inhibition zone around the well reflects the potency of the tested agent.
The minimum inhibitory concentration (MIC) of the fungal filtrate was assessed on Klebsiella pneumoniae and Bacillus cereus [25], using a serial dilution ranging from 61.43 to 15,725 µg/mL prepared in nutrient broth. Sterile inoculated broth served as the control and was incubated at 37 °C for 24 h. The MIC was described as the lowest concentration at which no visible bacterial growth was observed in the tubes. Both before and after incubation, the visual turbidity of the tubes was assessed to confirm the MIC value. Additionally, optical density measurements at 600 nm were performed to further corroborate the findings.

2.7. Anticancer Activity

2.7.1. MTT Assay

The cell lines of human Caucasian breast adenocarcinoma (MCF7) and normal skin fibroblast (BJ1) were acquired from ATCC through a holding company for biological products and vaccines (VACSERA), Cairo, Egypt. Doxorubicin (chemotherapy drug) was used as a standard chemotherapeutic anticancer drug for evaluation. Reagents including RPMI-1640 medium, MTT (3-(4,5-dimethylthiazol-2-yl)-2,5-diphenyltetrazolium bromide), and DMSO were sourced from Sigma Co. (St. Louis, MO, USA), while fetal bovine serum was acquired from Thermo Fisher Scientific, GIBCO (Waltham, MA, USA).
This study evaluated the cytotoxicity of the fungal filtrate against cancer and normal cell lines using an MTT assay [26]. All processes were conducted in a sterile environment using a Class II biological safety cabinet (Baker, SG403INT, Ettlingen, Germany). Cells were cultured in RPMI 1640 medium supported with a 1% antibiotic–antimycotic mixture and 1% L-glutamine at 37 °C and 5% CO2. After batch culture for 10 days, cells were seeded at 10,000 cells/well in fresh medium onto 96-well plates and incubated for 24 h under the same conditions.
The medium was then replaced with fresh medium (serum-free), and cells were treated with either test samples at various concentrations (100–0.78 μg/mL) or vehicle control (negative control). After 48 h of incubation, 40 μL of MTT solution (2.5 μg/mL) was added to each well, and the plates were incubated for an additional 4 h. To terminate the reaction and dissolve the formazan crystals, 200 μL of 10% sodium dodecyl sulfate solution (for lysing the cells after the viability test is complete) was added to each well and incubated (37 °C) overnight. Doxorubicin (adriamycin), an antitumor antibiotic known to inhibit DNA topoisomerase II, which induced apoptosis in cancer cells, was used as a positive control at 100 μg/mL under the same conditions. The formazan absorbance was measured at 595 nm with a reference wavelength of 620 nm using a microplate reader (Bio-Rad Laboratories Inc., model 3350, Hercules, CA, USA). The final concentration of DMSO, used as the solvent for dissolving the samples, was kept below 0.2% in all treatments. The change in cell viability in relation to the untreated control was calculated, and then the half-maximal inhibitory concentration (IC50) was determined.

2.7.2. Gene Expression in Cancer Cells

The gene expression of BCL2 (B-cell lymphoma 2), BAX (BCL2-associated X protein), and TP53 (tumor protein 53), along with the determination of the BAX/BCL2 ratio, was assessed in the MCF7 cell line treated with the biological fungal filtrate.
For reverse transcription (RT), the total mRNA was isolated using the RNeasy extraction kit, incorporating an extra DNaseI digestion step per the manufacturer’s instructions. One unit of RQ1 RNase-free DNase was applied to eliminate DNA residues. Following treatment, RNA was resuspended in DEPC-treated water, quantified at 260 nm, and checked for purity with a 260/280 nm ratio between 1.8 and 2.1. An ethidium bromide stain analysis of 28S and 18S bands on formaldehyde-containing agarose gels confirmed RNA integrity. Aliquots of RNA were either used immediately for RT or stored at −80 °C. RT was performed on complete Poly(A)+ RNA from the MCF7 cell line, involving a 20 μL reaction mixture containing 5 μg of RevertAid™ First RNA, 50 mM MgCl2, 10× RT buffer (50 mM KCl, 10 mM Tris-HCl, pH 8.3), 10 mM of each dNTP, 50 μM oligo-dT primer, 20 IU ribonuclease inhibitor, and 50 IU MuLV reverse transcriptase. The RT reaction proceeded at 25 °C for 10 min, followed by 1 h at 42 °C, and a final denaturation step at 99 °C for 5 min [27]. The reaction tube was flash-cooled and stored for subsequent cDNA amplification through a real-time polymerase chain reaction, using the StepOne™ Real-Time PCR System from Applied Biosystems (Thermo Fisher Scientific, Waltham, MA USA).
For quantitative real-time PCR (qRT-PCR), 25 μL reaction mixtures were prepared containing the following: 12.5 μL of 1× SYBR® Premix Ex Taq™ II (TaKaRa, Kyoto, Japan), 0.5 μL each of 0.2 μM forward and reverse primers, 6.5 μL nuclease-free water, and 5 μL of cDNA template. The thermal cycling program included initial denaturation at 95 °C for 3 min, followed by 40 cycles of denaturation at 95 °C for 15 s, annealing at 55 °C for 30 s, and extension at 72 °C for 30 s. To verify primer specificity, a melting curve analysis was performed at the end of each run, consisting of 71 cycles starting at 60 °C and increasing by 0.5 °C every 10 s to 95 °C. Each experiment included a no-template control using distilled water. Specific primer sequences (Table S1) for BCL2, BAX, TP53, and the housekeeping gene (β-actin) were custom-designed and prepared based on Brito et al. [28].

2.7.3. Data Analysis

The specific amplification of the desired gene fragments was confirmed by the melting curve analysis, indicating no contamination in the samples. The BAX/BCL2 ratio, serving as an indicator of the balance between pro-apoptotic and anti-apoptotic gene expression, was calculated. To ensure accurate quantification, normalization was performed using the housekeeping gene β-actin. Data analysis was carried out employing the 2ΔΔCT method, providing a reliable measure of relative gene expression [27].

3. Results and Discussion

Within plants, endophytes act as silent guardians, wielding an arsenal of beneficial tools. They forge alliances, crafting molecules like siderophores to secure nutrients and outcompete rivals for space. As natural bodyguards, they synthesize antibiotic shields and protective peptides to ward off pathogens. Endophytes even act as personal trainers, producing growth-promoting hormones to enhance the plant’s immune system and resilience. Remarkably, these services come at no known cost to human consumers or the environment, making endophytes valuable partners in a sustainable and healthy ecosystem [7,8,9].
The current research was undertaken to find out if there is an association between fermentation conditions and the production of total free AAs through the fungal degradation of common bean biomass. Therefore, the research question was to find out if there is an association between the fermentation conditions (input factors) and the degradation of plant biomass and the production of AAs (output response). Accordingly, the null hypothesis (H0) assumes the absence of a relationship, while the alternative hypothesis (H1) posits the presence of a significant association.

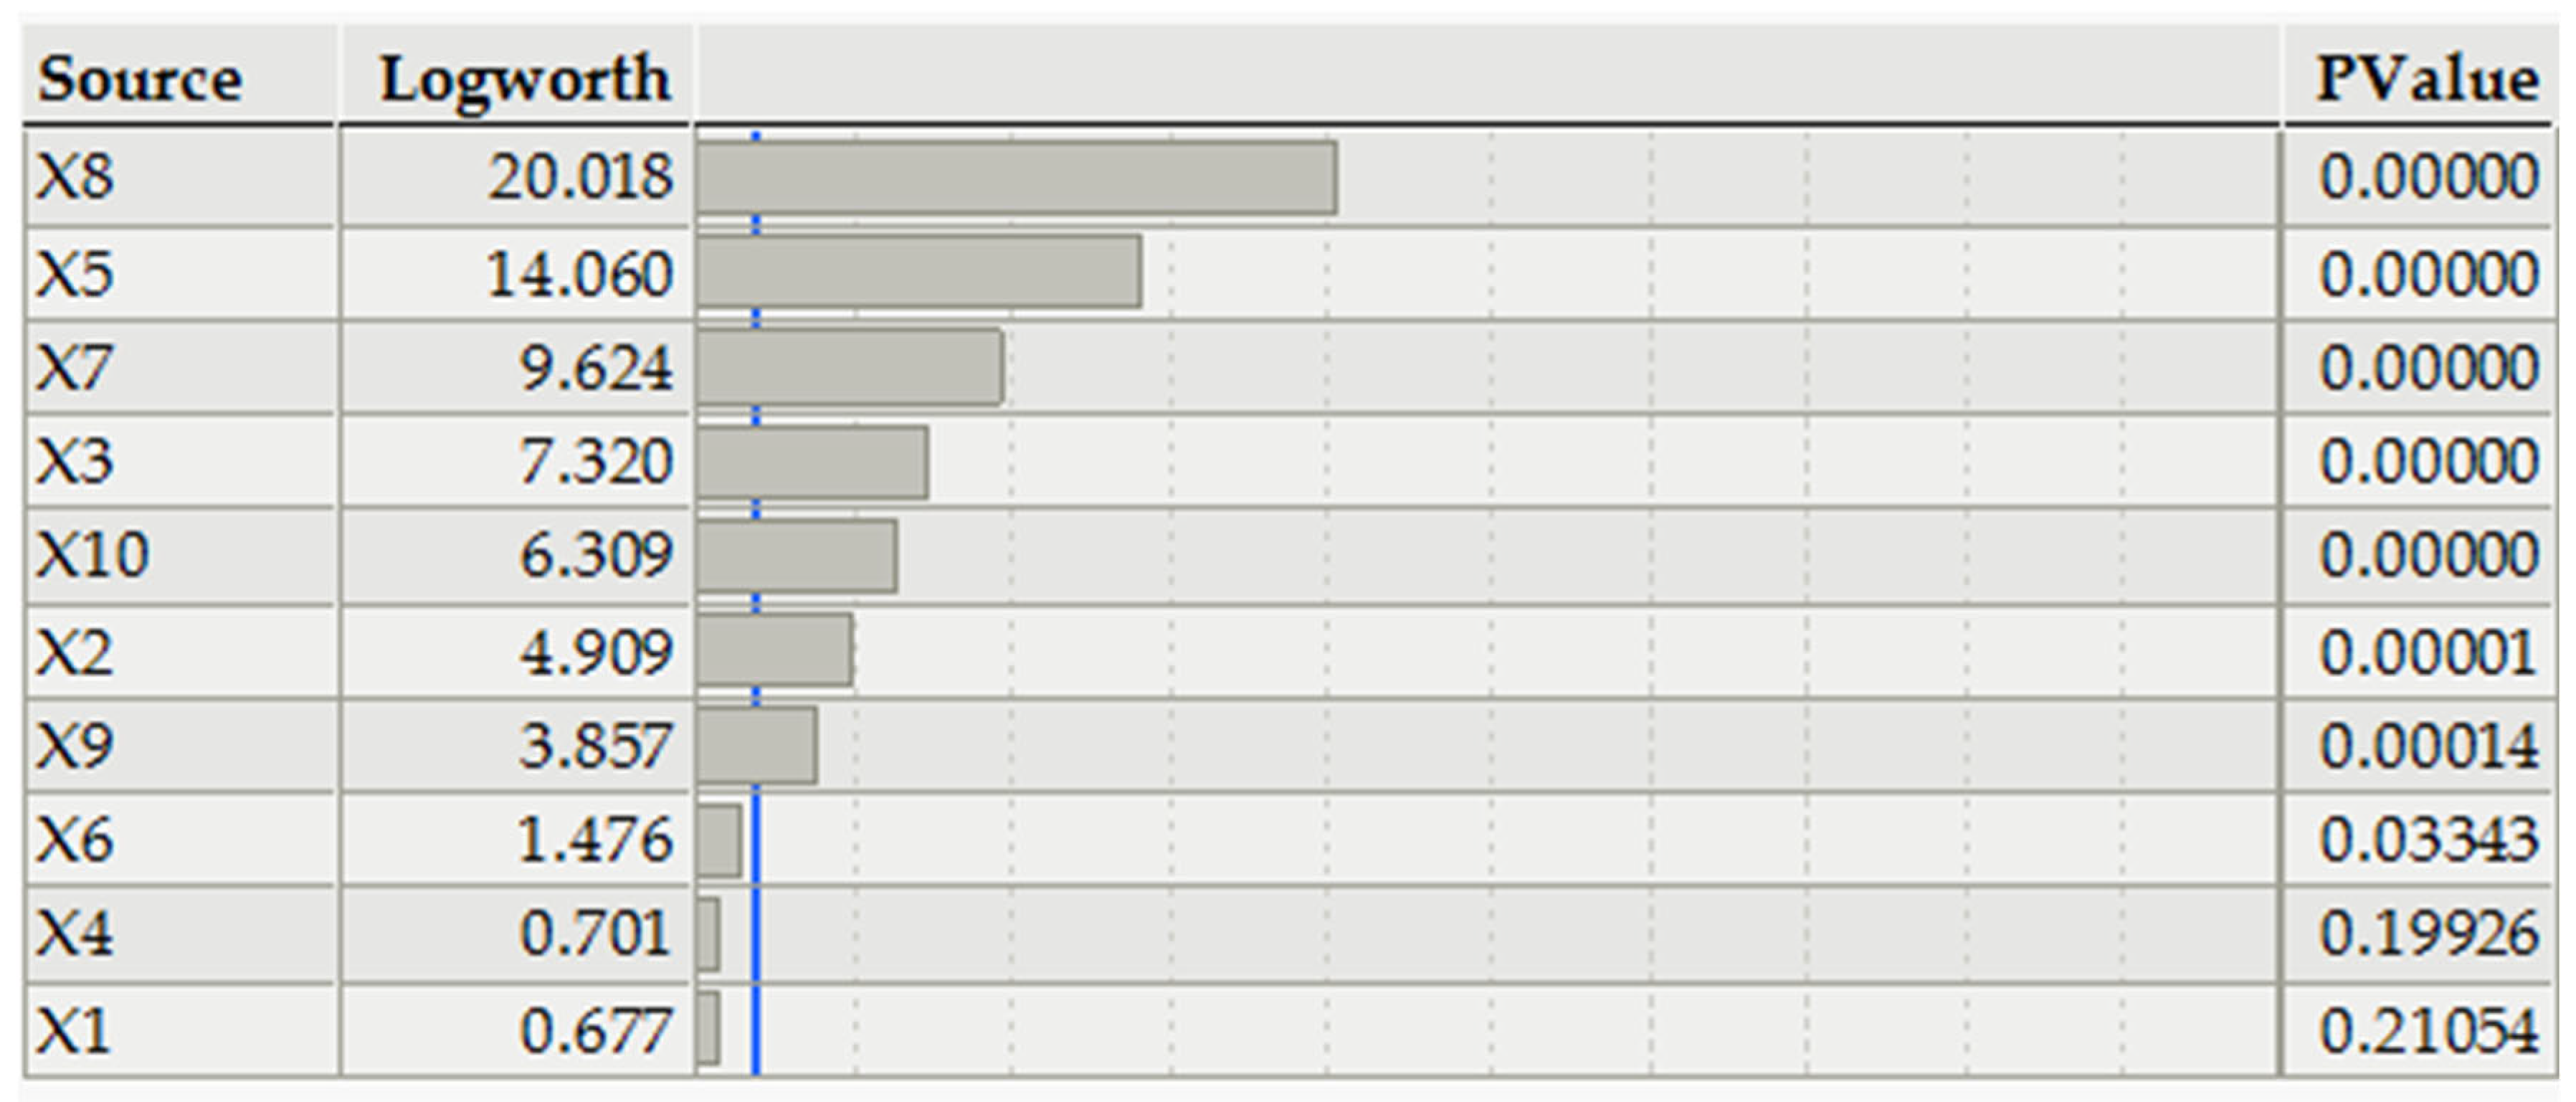
3.1. DSD Paradigm for Screening the Medium Components

Ten independent factors (NaH2PO4, KH2PO4, NaCl, NH4Cl, MgSO4·7H2O, CaCl2·2H2O, pH, incubation time, inoculation, and incubation temperature) were screened for their significant influence on the production of AAs by T. asperellum WNZ-21 using a DSD matrix (Table 2).
Designed under the null hypothesis (H0) of equal effects from all factors with no interaction, the DSD experiment revealed significant variations across the tested parameter combinations. This prompted a statistical analysis of data from various DSD runs to identify factors significantly impacting the biodegradation of RCBBs and subsequent AA production.
Based on the DSD analysis, the model demonstrates good performance, generating predicted values that closely match experimental observations. Notably, the residuals, signifying the differences between predicted and actual values across the design space, remain acceptably small, further supporting the model’s accuracy.
The significance and contribution of the ten independent variables to the AA production were determined. The logworth value and p-values of the ten factors are depicted in Figure 1 in descending order. Most factors surpassed the significance level (p < 0.05), except for two factors (NaH2PO4, and NH4Cl). Incubation time (X8) had a superiority, whereas CaCl2·2H2O was inferior in significance.

3.1.1. Coefficients and ANOVA

The null hypothesis was further evaluated through the estimation of regression coefficients and ANOVA of AA production by T. asperellum WNZ-21 (Table 3). First, for each independent variable in a multiple regression model, the variance inflation factor (VIF) was calculated to be 1.00, indicating the absence of multicollinearity. A high VIF (typically greater than 10) indicates that multicollinearity is a significant issue. The VIF was measured to assess the multicollinearity, which is a condition in which two or more independent variables in a regression analysis are highly correlated with each other, i.e., the VIF measures the degree to which the variability in the estimated regression coefficients is amplified because of multicollinearity. Multicollinearity can lead to unreliable regression coefficients, making it challenging to interpret the effects of the tested variables on the response variable.
The DSD model’s overall significance is confirmed, further supported by good fit metrics. Additionally, the non-significant lack-of-fit of error (p = 0.0590) indicates a good fit between the model and the data, where a variable was considered significantly impactful if its corresponding p-value fell below 0.05. This comes in line with the agreement between predicted and experimental AA values (Table 2), further suggesting the model’s predictive capability.
Furthermore, the model demonstrates a strong fit to the data, as evidenced by the high values of R2 (0.9105), adjusted-R2 (0.8932), and predicted-R2 (0.8720). While R2 measures the overall variance explained by the model, it can increase by adding insignificant factors. Adjusted-R2 addresses this by penalizing the number of terms, providing a more reliable indicator of fit. Its high value here (0.8932) suggests a strong relationship between the included factors and AA production. Finally, predicted-R2 (0.8720) assesses the model’s ability to predict unseen data, further confirming its generalizability. Overall, these metrics indicate that the model explains 87.20% of the variation in AA production, providing a good representation of the underlying process.
The next step was to figure out the association between AA production and each factor in the DSD. An analysis of the regression coefficients revealed that the tested parameters exerted varying influences on the outcome, as indicated by their positive and negative coefficient values. Eight parameters had a statistically significant association with AA production. NaH2PO4 and NH4Cl have insignificant effects. However, as specified by the regression coefficient, and ANOVA, all variables had a positive effect, whereas KH2PO4, NH4Cl, and incubation temperature had a negative impact.

3.1.2. Adequacy of DSD

The data points from the regression analysis are closely aligned with the ideal prediction line, indicating a good fit between the predicted values from the DSD and the actual experimental results (Figure 2). This close alignment validates the accuracy of the DSD model [29].

3.1.3. Residual Analysis

Figure 3 presents the residual analysis of the DSD model, assessing how well it adheres to its underlying assumptions. Examining the plots of residuals versus predicted values and standardized residuals versus raw data points suggests a generally random and even distribution. However, one outlier point (highlighted in red, raw number 63) exhibits a relatively higher residual, indicating a potential weakness in the model for that specific data point.
The design space and the 8 of 10 tested variables showed a significant effect at alpha < 0.05, concluding that H0 was rejected, and H1 was accepted. Since eight of the ten tested parameters showed a significant effect, only these significant parameters were used for model generation using the ANN paradigm.

3.2. Machine Learning for Modeling AA Production

The data acquired from the DSD (Table 2) were subjected to a supervised machine-learning paradigm for modeling AA production. A specific type of machine learning, i.e., an ANN architecture platform, was constructed to model AA production.
Based on the rejection of H0 and the acceptance of H1 of the DSD, eight of the ten parameters showed a significant effect on AA production; hence, to reduce the operation costs, eight significant variables were chosen for the ANN modeling process. In this connection, the DSD matrix data were fed into the ANN, and various combinations of ANN parameters, including the number of hidden layers and neurons, were explored to optimize the model’s performance. This optimization process led to the creation of a specific network architecture with two hidden layers, where each node employed the hyperbolic tangent sigmoid activation function (NTanH).

3.2.1. The Architecture of the ANN

The designed ANN consists of two fixed layers: an input layer and an output layer. The input layer contains eight neurons, each representing a significant independent factor identified through DSD regression analysis. Insignificant variables like X1 (NaH2PO4) and X4 (NH4Cl) were excluded. The output layer has a single neuron representing the predicted AAs. Two hidden layers are positioned between the input and output layers. These hidden layers were optimized by testing different configurations with varying numbers of neurons and learning rates.
To validate the constructed ANN, machine learning was employed with a holdback validation approach, allocating 33.33% of the data for validation (21 data points) and using the remaining 42 data points for training (Table 2). Through an iterative process aiming for the maximum R2, the best ANN configuration was identified after numerous trials of 3000 iterations each, using a learning rate of 0.2 and the squared penalty method. Accordingly, the optimal architecture consists of two hidden layers: the first with six neurons and the second with four neurons (Figure 4). The overall topology of the ANN is 8-6-4-1, where eight neurons in the input layer represent each tested factor, and a single output layer predicts the AA yield. The activation functions for the hidden layers are assigned as NTanH(6) and NTanH2(4), respectively.

3.2.2. Training and Validation Processes

The machine learning process was carried out on the resulting ANN using a trial-and-error procedure. The network was trained until obtaining the highest R2 (Table 4) with the lowest possible error values. The performance of the trained network was assessed based on the ANN’s ability to predict outputs that are comparable to or extremely close to the target response value, which was confirmed by minimizing errors (Table 2) during the training and validation phase. At the optimal point, the R2 values were 0.9138 for training and 0.9433 for validation.
The ANN’s predicted values showed a reasonable agreement with the experimental ones, demonstrating lower residual values for both the training and validation phases. Specifically, the RASE was 816.35 and 720.38, and the MAD was 673.67 and 661.48, respectively. The −log-likelihood value is a measure of the goodness-of-fit of the ANN model. A lower −log-likelihood value indicates a better fit of the model to the data. In this case, the −log-likelihood values are 341.20 for the training phase and 167.97 for the validation phase. This suggests that the model fits the validation data better than the training data, which is a good sign of the model’s performance and its ability to generalize well to unseen data. Under these conditions, the ANN demonstrates its effectiveness by generating predictions closely matching the experimental results (Table 2).
However, the difference between the actual and predicted ANN values is close to each other, which signifies good model fitting [13]. The accurate prediction of AAs by the ANN demonstrates its validity and ability to capture the underlying non-linear relationships in the data [14]. On the other hand, the ANN model cannot deduce the relation between input and output factors [13]. Commonly, ANNs excel at generalizing beyond the training data, likely due to their ability to handle complex non-linear relationships and address multicollinearity challenges [14].

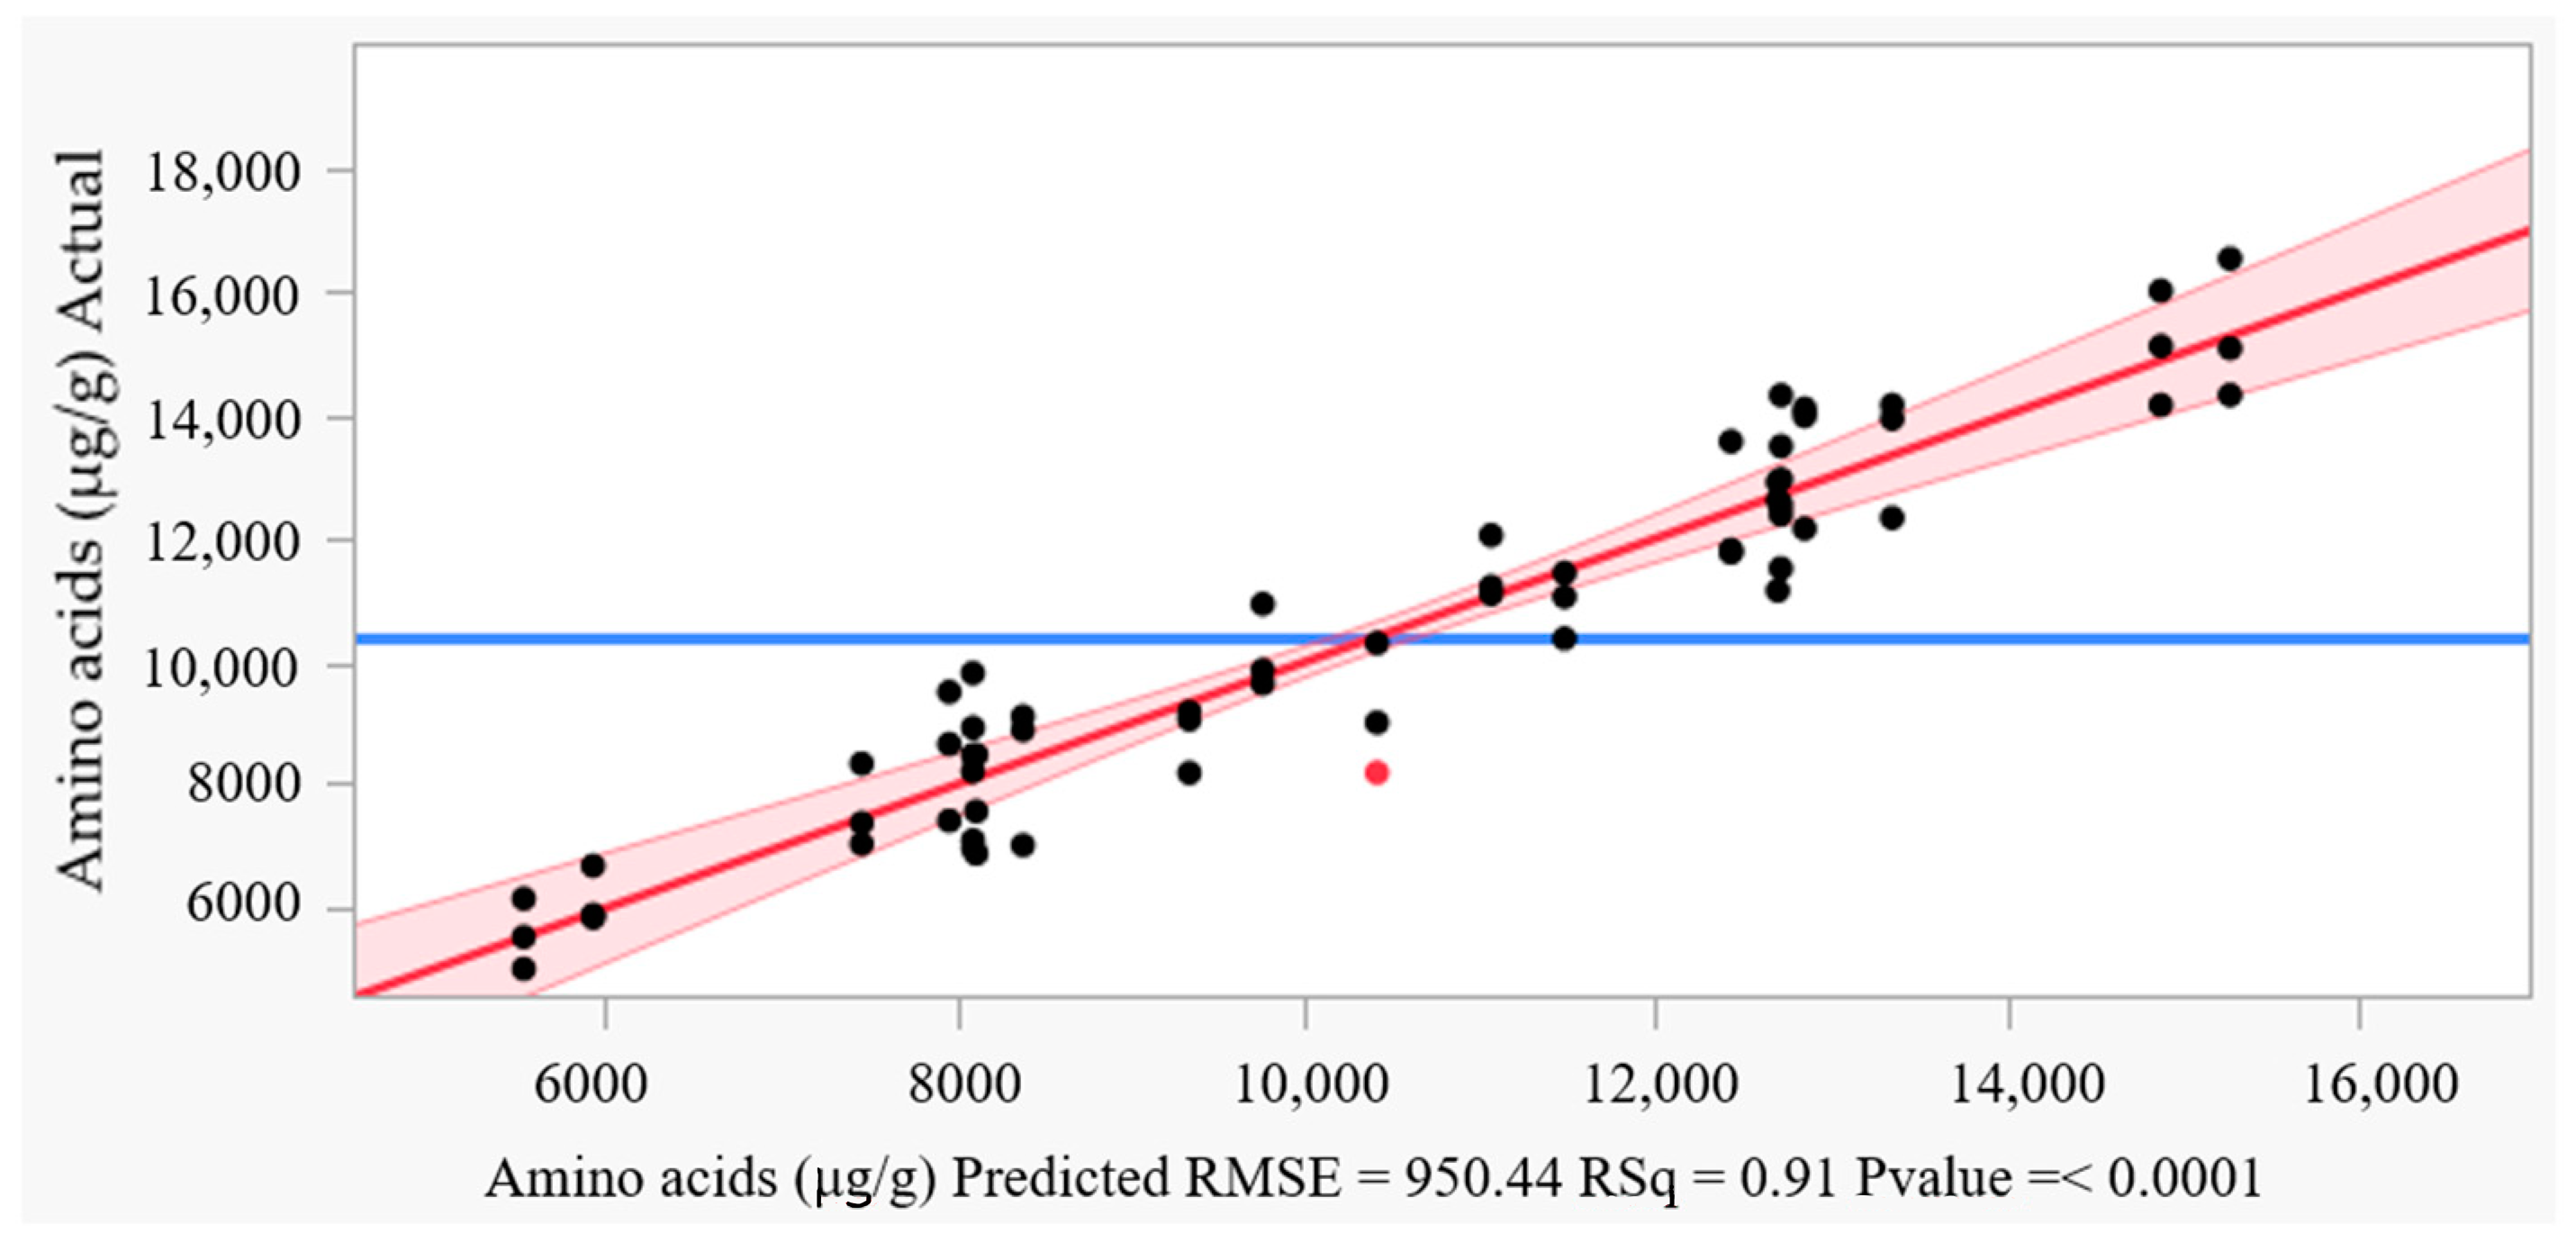
3.2.3. Prediction and Residual Analysis

Figure 5A,B compare the predicted values from the ANN model with the corresponding experimental values for both the training and validation sets. In both sets, the ANN model’s predictions fall significantly closer to the perfect prediction line compared to linear regression. This demonstrates the model’s strong generalization capability, meaning it can accurately predict unseen data beyond the training set.
Likewise, Figure 5C,D depicts the residual analysis for the ANN model, which helps assess its forecasting capability. These plots show the residuals (differences between predicted and actual AA values) plotted against the predicted AA values. Unlike the DSD model where an outlier with a high residual was observed (Figure 3), the residuals here are distributed randomly and evenly around the zero line, indicating no major inconsistencies in the model’s predictions. This point is considered a weak point in the DSD model. All previous measures are indications of the generalization ability and fitness of the model [12].

3.2.4. The Experimental Testing of the ANN Model

The ANN model was experimentally tested to confirm the accuracy of the predicted conditions. The optimum forecast levels of each of the eight tested parameters that maximize AA production were determined using the ANN model. Four additional random points were also investigated to test the generalizability of the ANN model.
The optimum conditions that maximize AA production (optimal) are presented in Table 5. Under such conditions, the expected AA production value was 18,582.52 µg/g RCBB. The experimental laboratory validation was in close agreement, being 18,298.14 ± 97.08 µg/g RCBB. The experimental AA production date was found to be very close to the forecasted one. The good news here is that the experimental and predicted AA production of the four random points were also found to be very close, indicating the fitness of the model. One positive outcome of the current validation is that the ANN accurately predicted the AA values using only eight (excluding the two insignificant factors based on DSD analysis) of the ten tested variables.
Using the ANN model, the optimal settings for the eight tested factors that would maximize AA yield were identified. The highest desirability value (0.9977) was used for model selection. This extremely high score, reaching the predicted peak, confirms the success of the optimization process. Subsequently, the model predicted the AA amount, showing strong agreement with experimental values, demonstrating the effectiveness of the desirability function in pinpointing the most favorable conditions of the eight factors.
The desirability function is usually employed to identify the most promising combinations of a set of factors. This function assigns values ranging from 0 (undesirable) to 1 (highly desirable) based on how closely a predicted outcome aligns with our desired goal. As the predicted AA production approaches the target level, the desirability value increases towards 1. Importantly, this analysis serves as a mathematical guide for optimization, providing valuable insights before conducting experimental validation [29].

3.3. Biochemical Composition of Fungal Filtrate

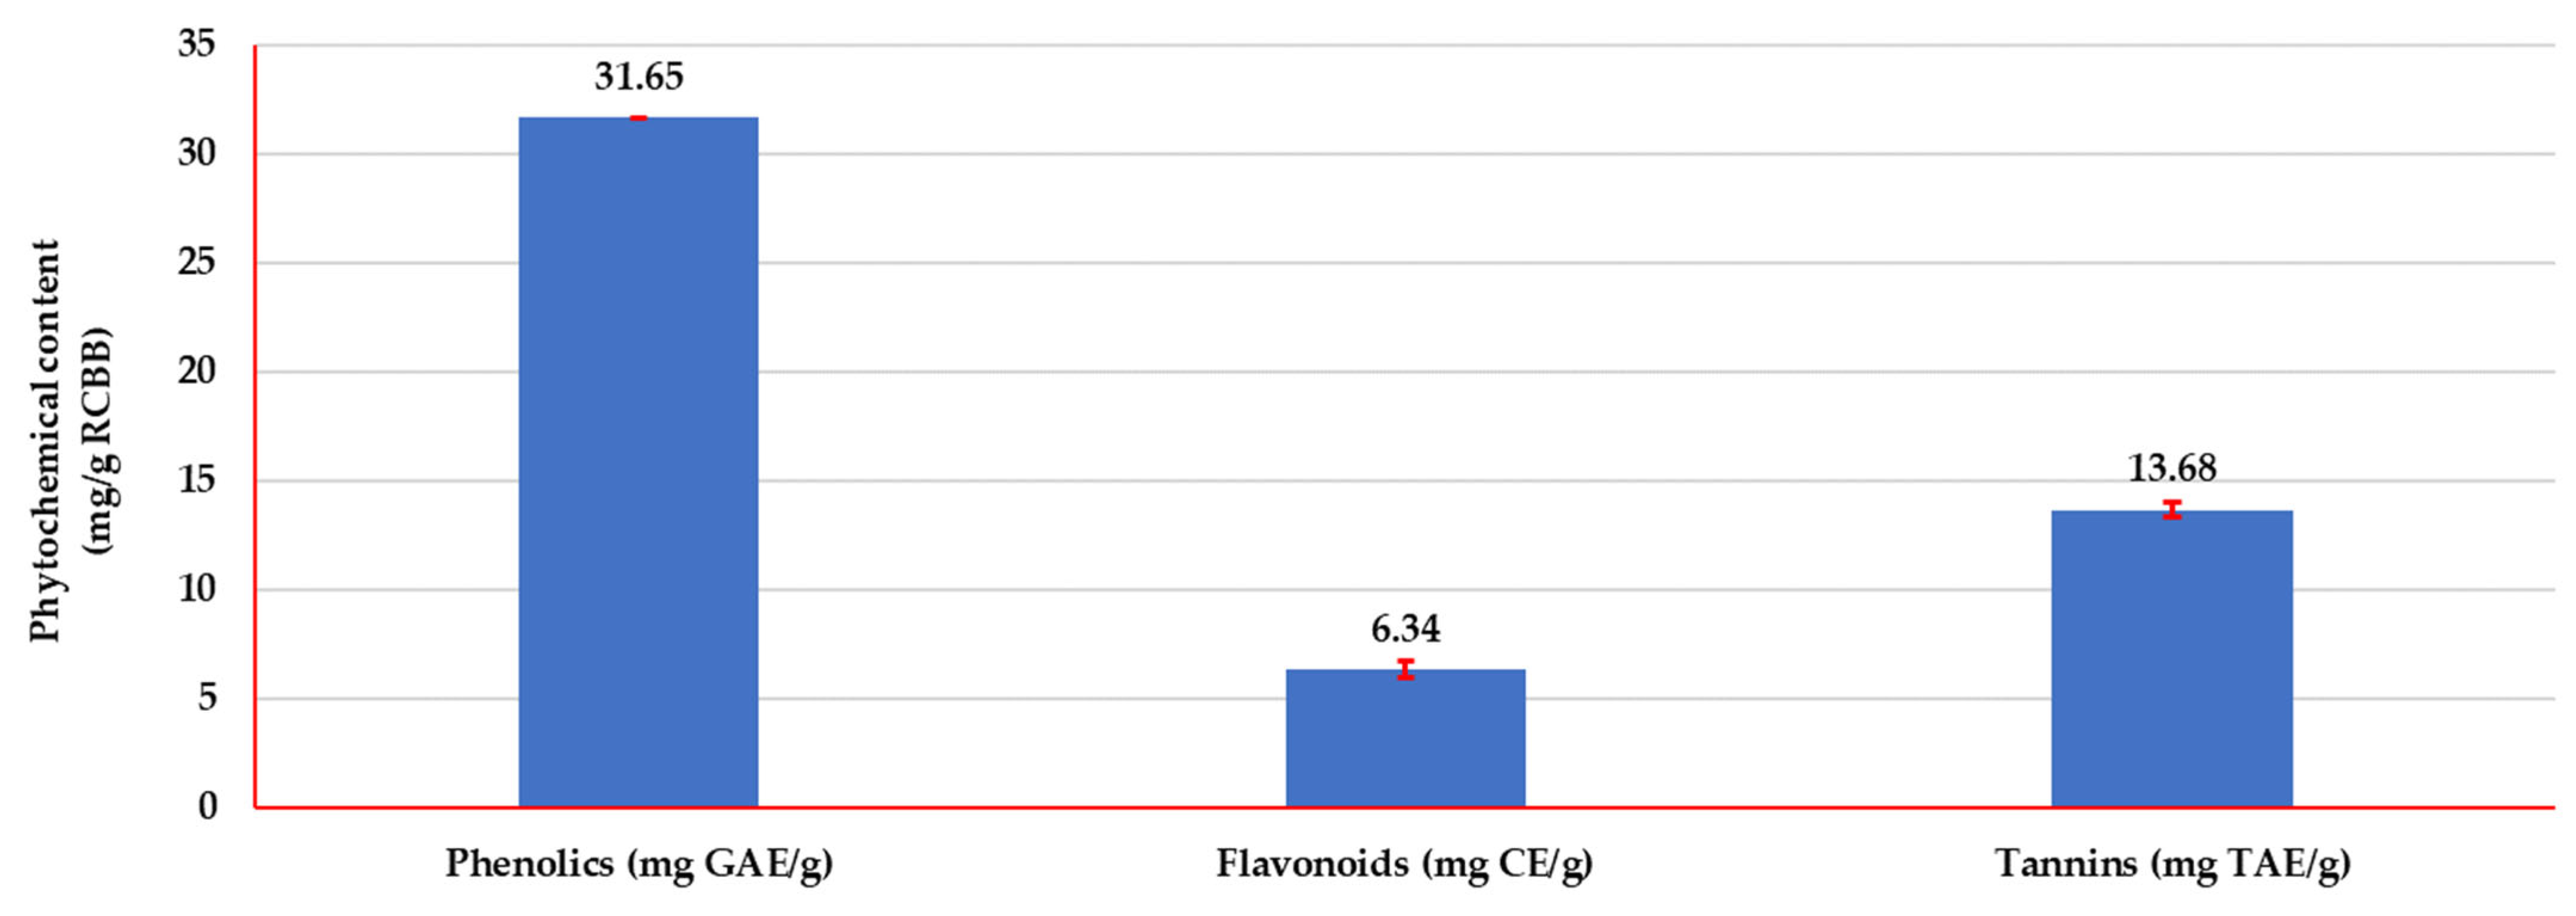
3.3.1. Phytochemical Analysis

Phytochemicals play a crucial role in human health, offering antioxidant, anti-inflammatory, immune-supportive, and detoxifying properties, as well as contributing to cancer prevention, heart health, eye health, brain function, gut health, and skin health.
The phytochemical composition of a fungal filtrate was analyzed based on the provided data in Figure 6, focusing on the quantification of three secondary metabolites: phenolics, flavonoids, and tannins. The filtrate exhibits a moderate phenolic content, averaging 31.65 mg gallic acid equivalent (GAE)/g RCBB. This suggests potential antioxidant and other beneficial properties associated with phenolic compounds. The flavonoid content is lower, averaging 6.34 mg catechin equivalent (CE)/g RCBB. Flavonoids also possess various health-promoting properties and contribute to the overall antioxidant capacity. Tannins were detected at the highest concentration, averaging 13.68 mg tannic acid equivalent (TAE)/g RCBB. Their potential impact depends on their specific types and interaction with other components, but some tannins can bind to nutrients and reduce their bioavailability.
The fungal filtrate contains a moderate amount of phenolics, with 31.65 mg/g RCBB. This falls within the range observed for other fungal species. Compared to Trichoderma harzianum [30], the fungal filtrate shows lower phenolic content. However, Omomowo et al. [31] also demonstrated that another fungus, Glomus versiforme, had significantly lower phenolic levels than T. harzianum. The fungal filtrate has a relatively low flavonoid content compared to the other studies [32]. Only 6.34 mg per gram of extract was detected, while studies on T. harzianum [30] reported barely or undetectable amounts [31]. Interestingly, the fungal filtrate shows a moderate tannin content of 13.68 mg per gram of extract, like the levels found in T. harzianum [30]. Even though slightly higher tannin concentrations in T. harzianum were observed, the fungal filtrate still exhibited higher levels than Glomus versiforme [31]. Overall, compared to the references, the fermented fungal filtrate stands out for its moderate levels of both phenolics and tannins, while its flavonoid content is on the lower end. This suggests that the strain and culture conditions indeed play a crucial role in determining the production of secondary metabolites in Trichoderma species.

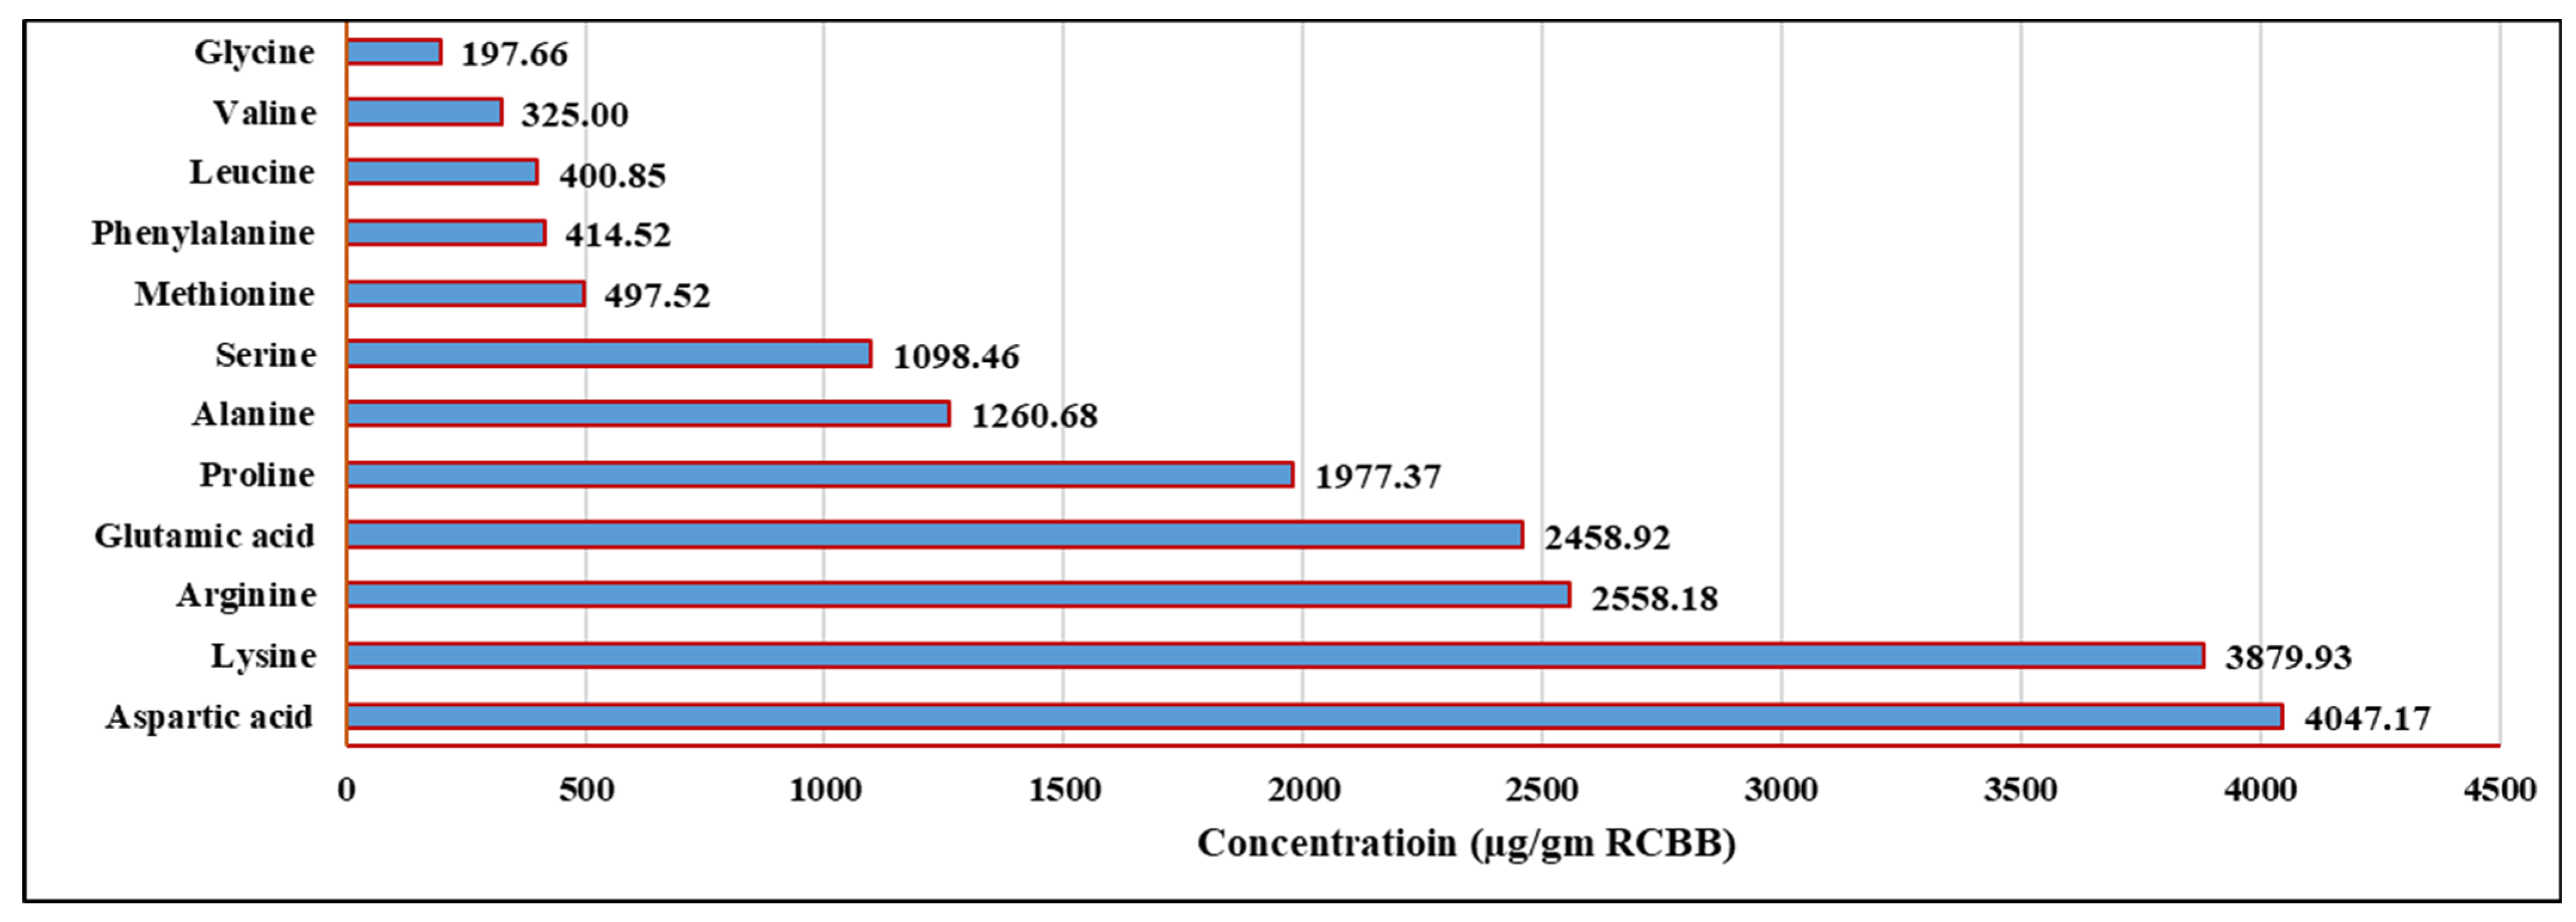
3.3.2. HPLC Profile of AAs

The fungal degradation of RCBBs results in the release of 12 AAs (Figure 7 and Figure S1), with a total concentration of 19,116.27 μg/g RCBB. The highest concentration of AAs was found with aspartic acid (4047.17 μg/g RCBB), lysine (3897.93 μg/g RCBB), arginine (2558.18 μg/g RCBB), and glutamic acid (2458.92 μg/g RCBB). The presence of AAs in the fermented bioproduct demonstrates the effectiveness of the fermentation techniques employed by the newly tested fungus and the modeling system implemented during the fermentation process.
Nevertheless, the specific types and quantities of AAs released depend on the substrate, microorganism, and fermentation conditions. For instance, Bacillus cereus PCM 2849 displayed remarkable versatility, releasing both essential and non-essential AAs during its metabolic processes, where glutamic acid and proline were the most plentiful products [33]. Additionally, B. paramycoides ZW-5 broke down chicken feathers through SSF, producing a total of 14 different AAs, of which proline and aspartic acid were present in the highest concentrations [3].

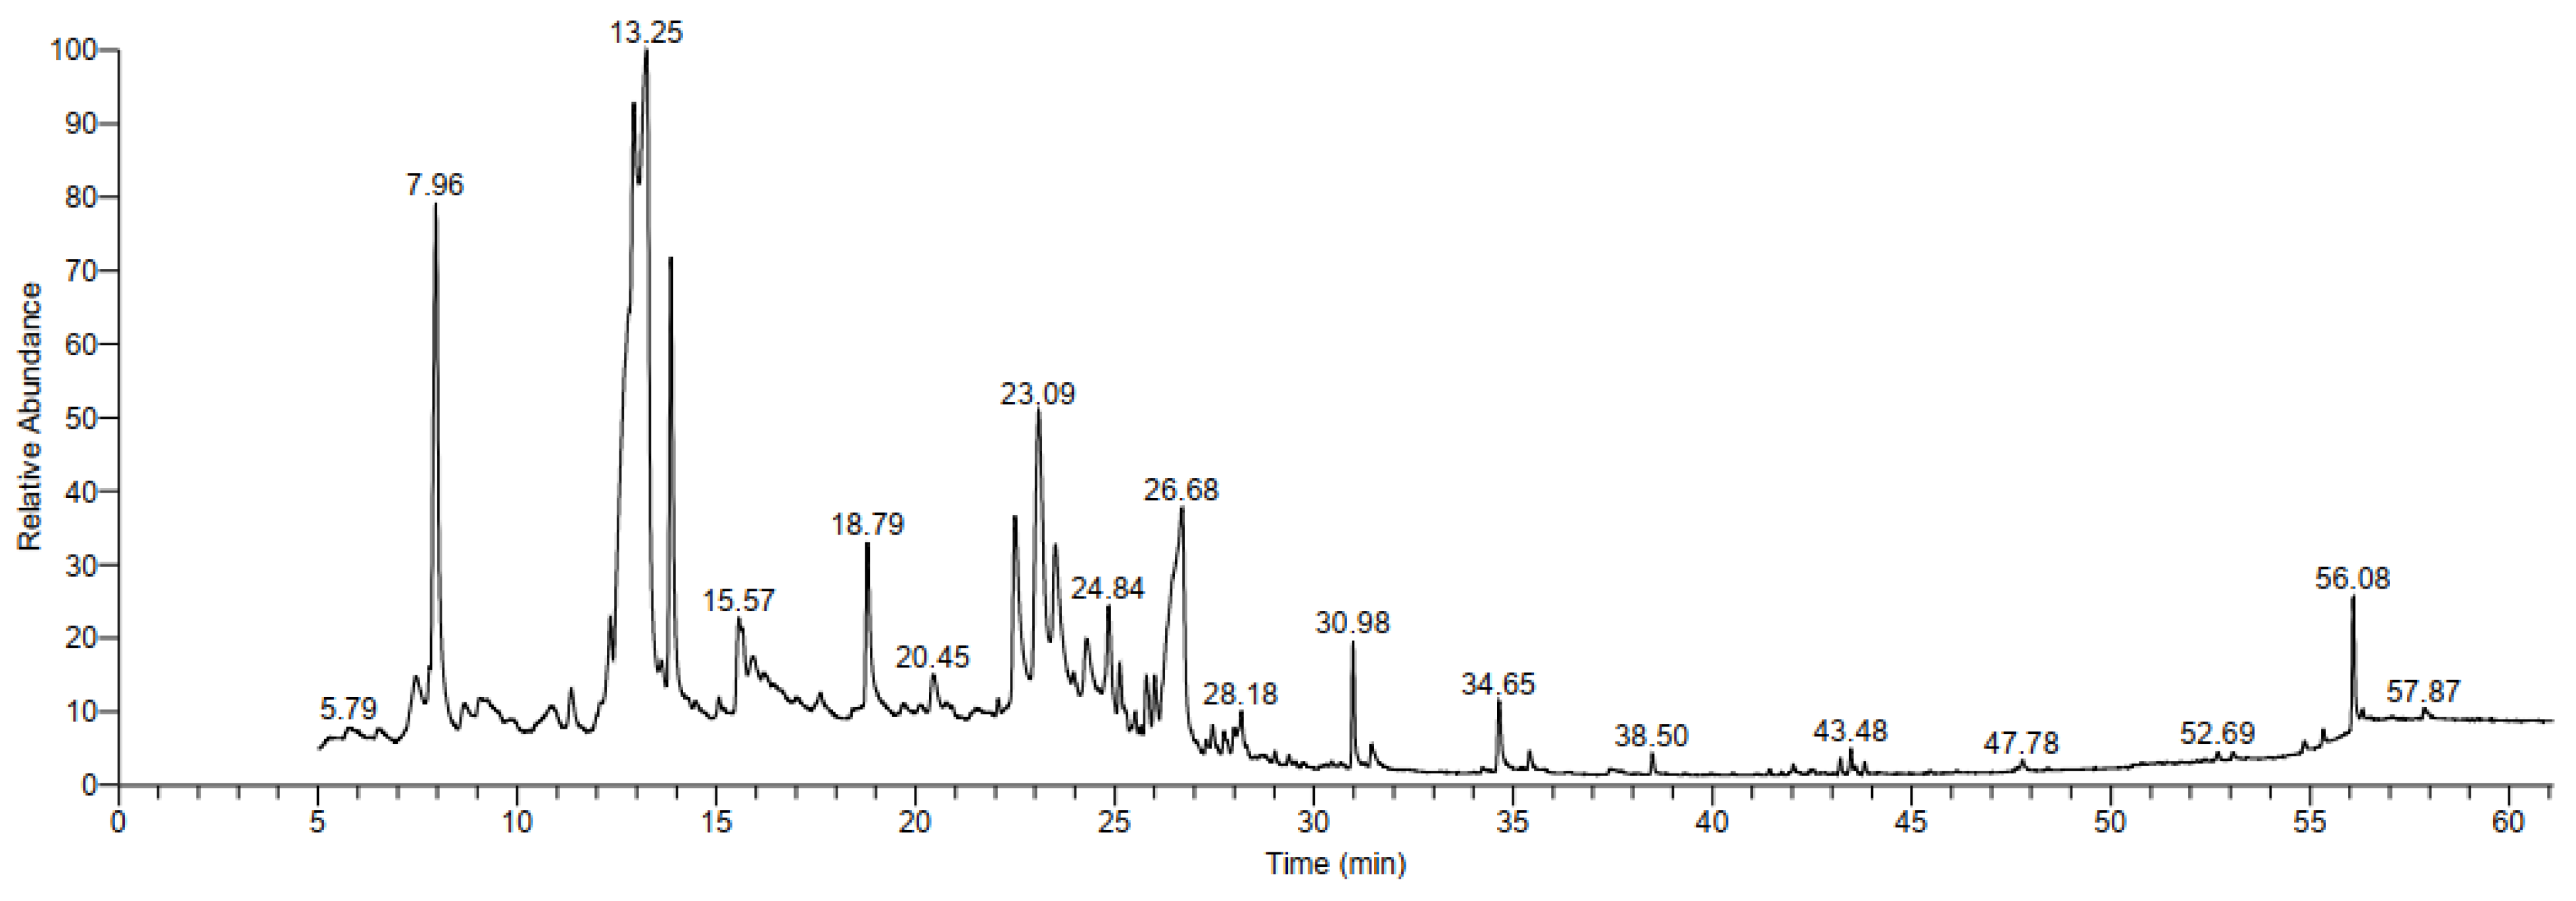
3.3.3. GC-MS Analysis

As indicated in Table 6 and Table S2 and Figure 8, 23 different components with a peak area of more than 1% are presented in the fungal filtrate of the fermentation process of RCBBs by T. asperellum WNZ-21. “1-Butanol, 3-methyl, formate” is the component having the highest concentration with a peak area sum of 12.06%. “Citraconic anhydride”, which has an area sum of 11.99%, came next. Also, “2,3-dihydro-3,5-dihydroxy-6-methyl-4h-pyran-4-one (DDPM)” has an area sum of 8.73%. Moreover, “mome inositol” has a peak area of 7.68%. Meanwhile, “4-C-Methyl-myo-inositol” has a peak area of 4.06%. Both “2-methylmalonic acid (MMA)” and “maltol” have a peak area of 3.91%. Meanwhile, “2-methoxy vinylphenol” has a peak area of 3.25%.
The GC-MS analysis of the filtrate of the current T. asperellum WNZ-21 cultivated on RCBBs diverges from the analysis of T. asperellum ZNW grown on PD broth [34]. This discrepancy could be attributed to the contrasting media each fungus was cultured in. Additionally, the distinct habitats from which these fungi were isolated (endophytic fungi from bean plant residuals versus healthy pea seeds) might also contribute to the observed variation in the filtrate’s metabolite profile.
The GC-MS analysis of the T. asperellum WNZ-21 fungal filtrate unlocked a treasure trove of unique molecular signatures, hinting at the organism’s potential for producing novel bioactive metabolites. Intriguingly, the analysis unearthed both unreported microbial/plant compounds and those previously exclusive to the plant kingdom, painting a fascinating picture of T. asperellum’s metabolic landscape. Four probable components stood out, never documented in microbial or plant sources through GC-MS: Cyclopenta[cd]pentalene; 4-O-alpha-D-Glucopyranosyl-D-glucose, alpha-D-glucopyranose-4-O-á-d-glactopyranosyl, and Hexopyranosyl-(13)hex-2-ulofuranosyl hexopyranoside. These discoveries highlight the exciting potential of T. asperellum as a source of unique secondary metabolites with potentially diverse biological activities. A further exploration awaits to unlock the secrets of these novel molecules and their potential applications.
On the other hand, seven additional probable components, previously exclusive to plant sources, were identified in the fungal filtrate: mome inositol; Geranyl isovalerate; 4-C-Methyl-myo-inositol; Octadecanoic acid 9,10-dichloro, methyl ester; 6,8-Nonadien-2-one, 8-methyl-5-(1-methylethyl)-, (E)-; Spiro [4.5]decan-7-one, 1,8-dimethyl-8,9-epoxy-4-isopropyl-; and Stigmast-5-en-3-ol, (3β,24S). The presence of these plant-associated metabolites in the fungal filtrate raises intriguing questions about their origin and ecological significance. Future research unraveling these mysteries may unlock fascinating insights into fungal–plant interactions.
While GC-MS suggests potential novel compounds, their definitive structural elucidation needs further analysis using techniques like high-resolution mass spectrometry and nuclear magnetic resonance spectroscopy.

3.3.4. FT-IR Spectral Analysis

The absorption bands in the FT-IR spectrum analysis of the T. asperellum WNZ-21 filtrate (Figure 9 and Table S3) revealed a strong band indicative of NH stretching at 3360 cm−1, suggesting the presence of primary and secondary amines, likely associated with AAs and other nitrogenous compounds. A broad band at 2933 cm−1, corresponding to CH stretching, confirmed the presence of alkyl groups found in the chain of AAs and other organic molecules.
The absorption band at 1708 cm−1 points to C=O stretching in carboxylic acid groups and carbonyl groups, commonly found in AAs, peptides, and other metabolites. The frequency of an absorption band recorded at 1580 cm−1 is attributed to N-H bending vibrations in amides or aromatic C=C stretching, suggesting further diversity in organic components beyond just aliphatic AAs. The presence of C-N stretching associated with various amino functional groups in AAs and proteins was established by the recorded absorption bands at 1395, 1314, and 1218 cm−1. The vibrations due to the absorption bands at 1183, 1111, 1066, and 1010 cm−1 might indicate the presence of phosphate groups potentially from nucleotides or phospholipids and sulfates potentially from sulfated polysaccharides or proteins.
The C-O stretching group in carbohydrates or polysaccharides is possibly attributed to the absorption bands recorded at 935 and 889 cm−1. In addition, the absorption band at 788 cm−1 might be due to aromatic C-H bending vibrations, suggesting the potential presence of aromatic rings in some components. The absorption bands at 670, 593, and 509 cm−1 are often associated with fingerprint region vibrations specific to the overall molecular structure and may offer further clues about the types of organic components present.
The spectrum reveals a complex mixture of organic compounds beyond just AAs. It suggests the presence of various components including primary and secondary amines, aliphatic chains, C=O groups, and C-N stretching, which all point to diverse AAs types [35]. Carboxylic acids, carbonyl groups, and potential phosphates, sulfates, and carbohydrates suggest a richer metabolic profile [36]. C-N stretches and fingerprint region bands might indicate the presence of proteins or peptides [37]. Potential aromatic rings from C-H bending vibrations hint at additional components contributing to the overall profile. Current FT-IR data come in line with other investigations, such as AA identification by HPLC and GC-MS.

3.4. Structural Investigation

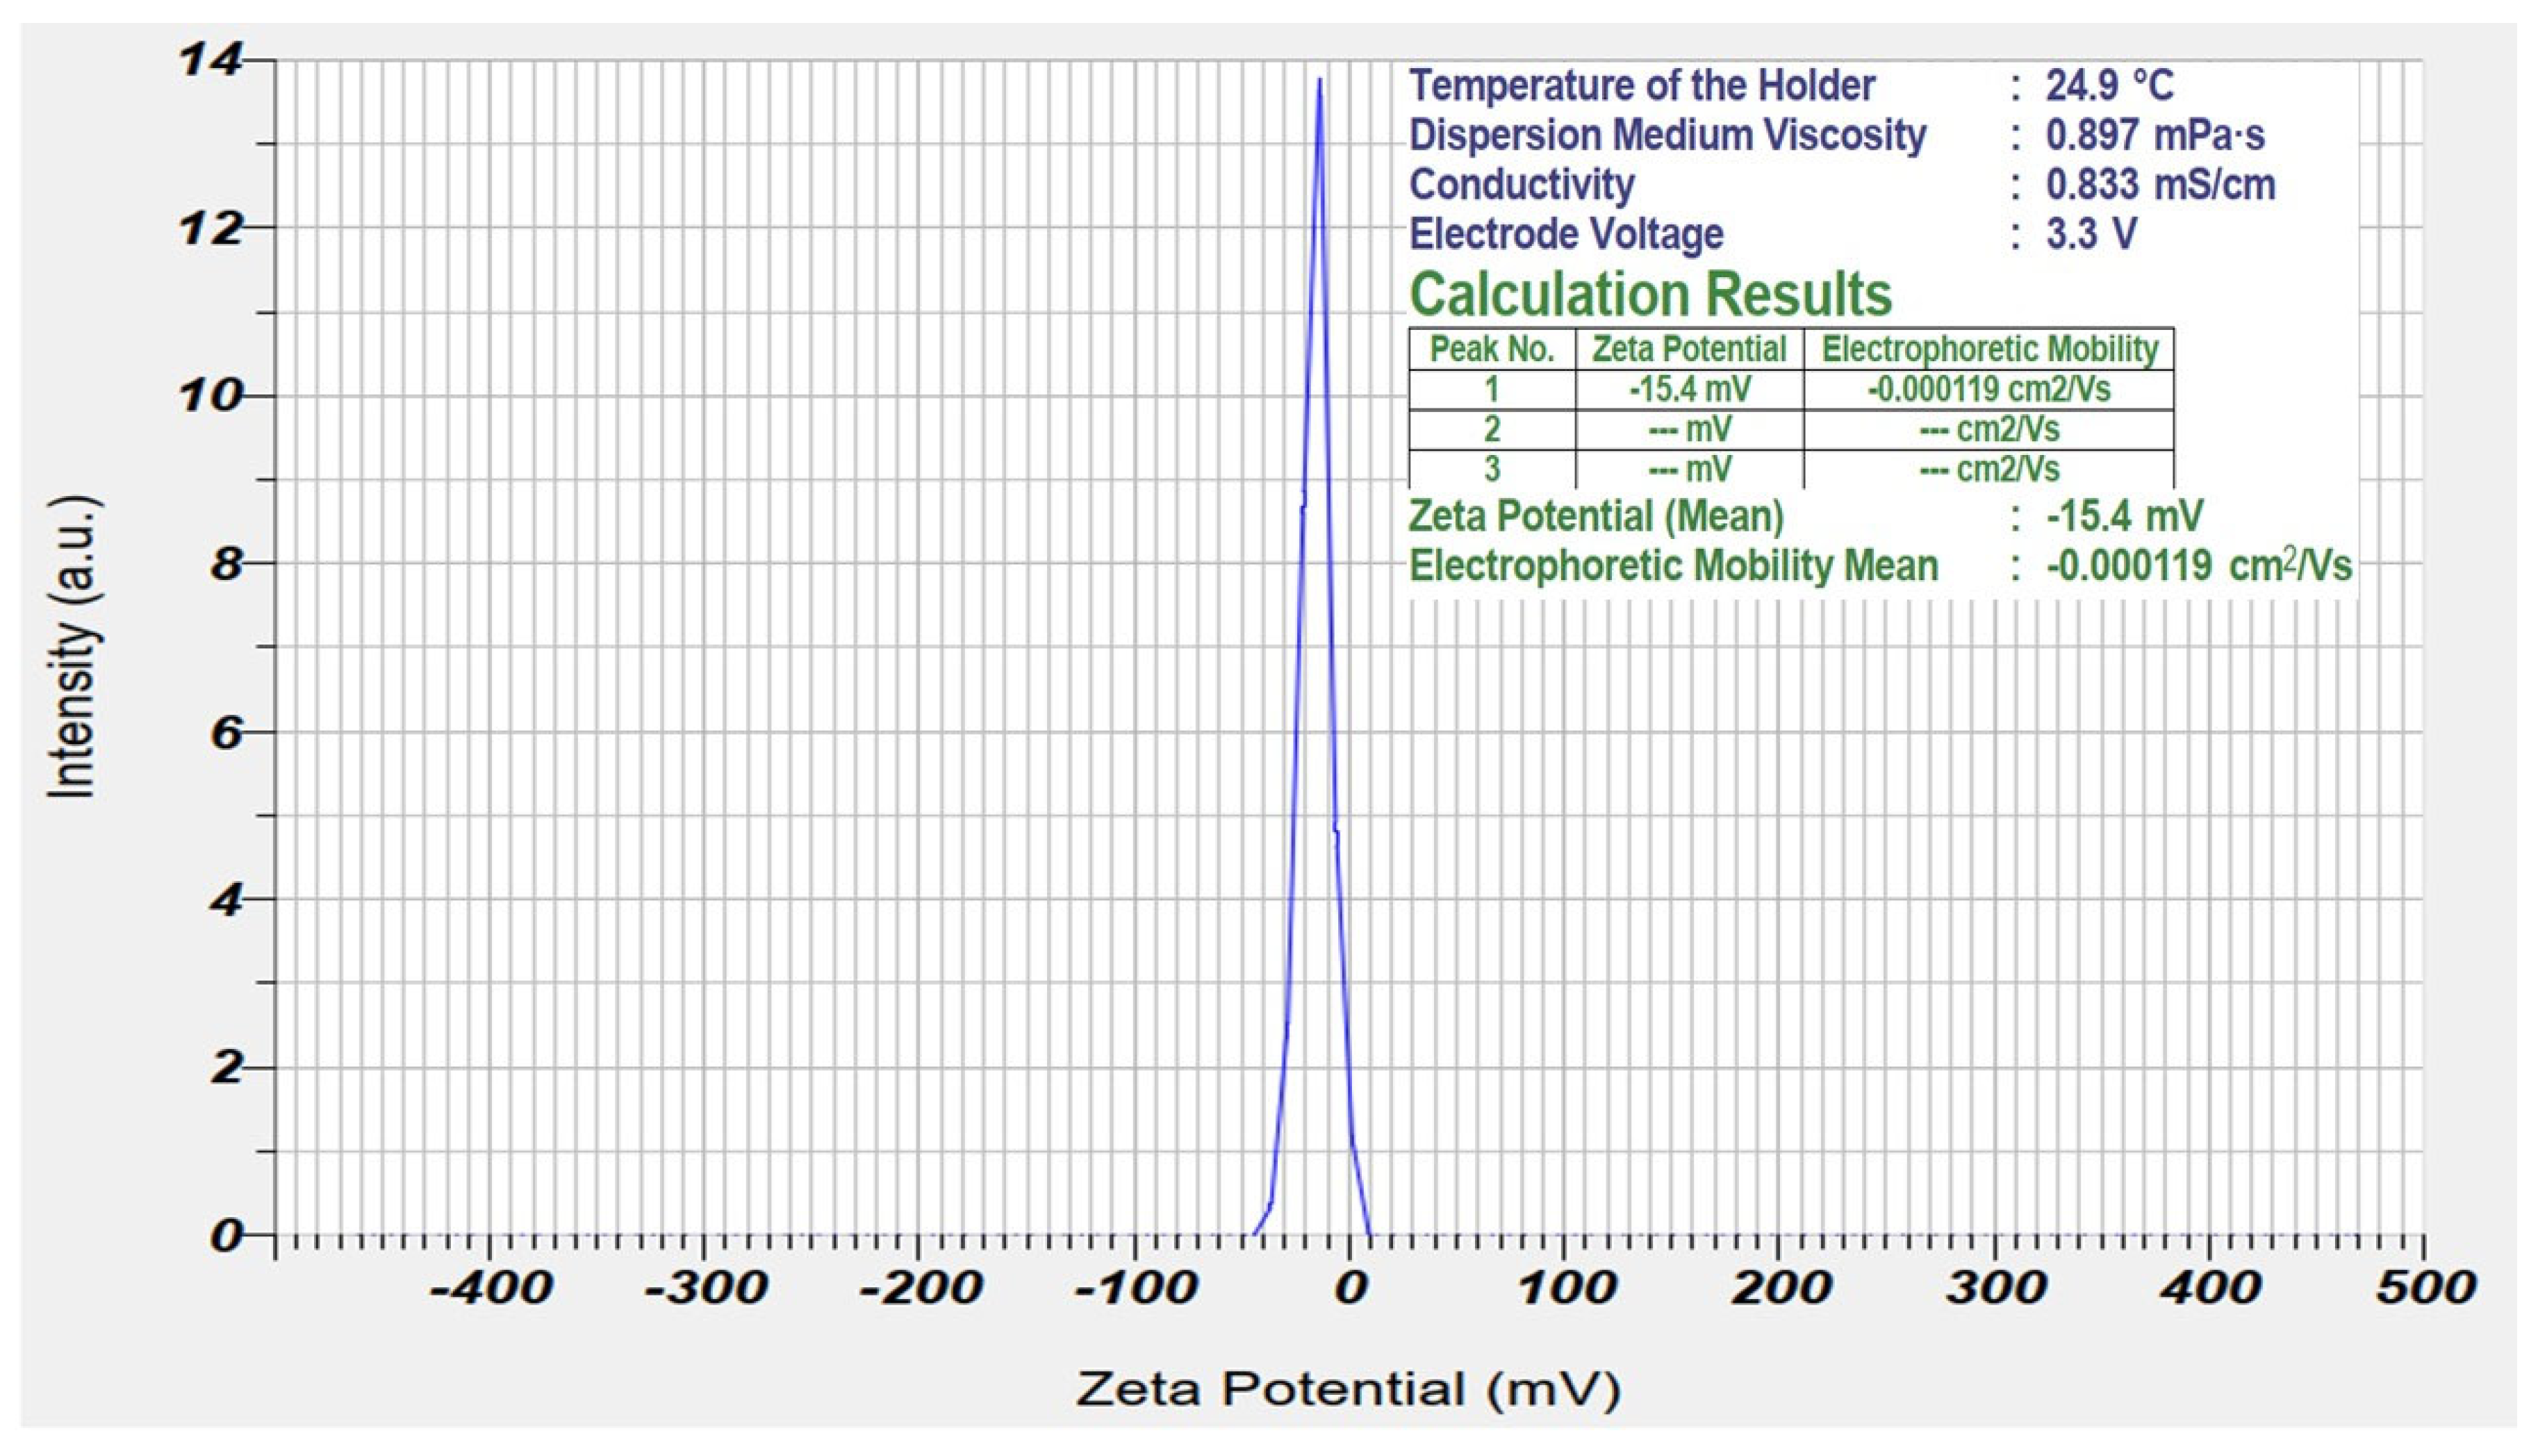
3.4.1. Zeta Potential Analysis

The zeta potential of −15.4 mV indicates a moderately negative surface charge on the particles present in the fungal filtrate (Figure 10). This negative charge suggests stability and a tendency for the particles to repel each other, preventing aggregation [38]. The electrophoretic mobility of −0.000119 cm2/Vs is relatively low, suggesting the slow movement of the particles in an electric field. This could be due to the size and shape of the particles, the viscosity of the solution, or interactions with other components in the filtrate. The conductivity of 0.833 mS/cm indicates a moderate ionic strength in the solution [39]. This could influence the zeta potential and the stability of the particles. The dispersion medium viscosity of 0.897 mPa·s is slightly higher than that of water. This could contribute to the slow electrophoretic mobility of the particles. The moderately negative zeta potential (−15.4 mV) at pH 7 suggests that the AAs and other acidic metabolites in the filtrate contribute to the surface charge of the spheres. This electrostatic repulsion likely helps maintain the stability and prevent the aggregation of the spherical particles. The low electrophoretic mobility (−0.000119 cm2/Vs) could be due to several factors: size and shape. Spherical particles experience less drag than irregular ones, so smooth spheres might move slower in an electric field [40].
The slightly higher viscosity of the filtrate compared to water can also hinder particle movement. Interactions: Specific interactions between the spheres and filtrate components could further reduce their mobility. The slightly negative zeta potential and spherical shape suggest that the filtrate could be suitable for encapsulation technologies or drug delivery systems, where colloidal stability and controlled release are desired. Understanding the factors influencing electrophoretic mobility could guide potential electrophoretic separation or purification strategies for the filtrate components. The zeta potential analysis offers valuable insights into the stability and behavior of the spherical particles in the T. asperellum WNZ-21 filtrate.
The moderately negative zeta potential suggests stability, while the other parameters offer additional insights into the behavior of the particles in the solution. Further investigation and comparison with relevant systems are necessary to fully understand the significance of these results and their potential applications.

3.4.2. HR-TEM Investigation

The HR-TEM investigation revealed two distinct particle morphologies within the T. asperellum WNZ-21 fungal filtrate (Figure 11). The first population consisted of well-defined spheres, approximately 200 nanometers in diameter (based on the scale bar) with a smooth surface and clear boundaries. Their proximity without overlap suggests minimal interaction between these uniform structures. A thin layer of amorphous material surrounds some of these spheres. In contrast, another population displayed diverse shapes, including elongated, triangular, and rounded forms. Several appeared amorphous, lacking a defined shape, and possessed a rough surface texture with protrusions or bumps. These particles exhibited varying degrees of aggregation, with some clustered together and others isolated.
Given the known protease production of Trichoderma spp. during fermentation [41], the irregularly shaped particles could be protein aggregates. Their rough surface might be attributed to protein folding patterns or inter-protein interactions. Alternatively, the elongated particles could be remnants of the chitinous cell wall, while the smaller irregular ones could be fragmentation products [42]. The identified 18 components in the fungal filtrate suggest the presence of various metabolites. Some, such as polysaccharides or lipids, could form nanoparticles with different shapes and textures, potentially explaining the observed diversity. Additionally, the complex mixture of AAs and organic molecules with varying sizes and properties might not form distinct particles but rather amorphous aggregates. These could arise from weak interactions between various molecules, resulting in irregular and loosely defined structures. Furthermore, depending on their structure and the solution conditions, certain AAs can form micelles (unseen in TEM as blurry areas) [43], or some polypeptides/carbohydrates may self-assemble into fibrillar structures (appearing as elongated features).

3.5. Biological Activity of Fungal Filtrate

3.5.1. Antioxidant Activity

The fungal filtrate shows promising antioxidant activity, with scavenging activity increasing and the remaining DPPH decreasing as the concentration increases (Table 7 and Figure S2). The decrease in IC50 values (concentration required for 50% inhibition) indicates higher antioxidant potency. Compared to ascorbic acid (a known antioxidant), the fungal filtrate generally has lower scavenging activity and higher IC50 values. However, at the highest concentration (1.988 mg/mL), the fungal filtrate exhibits slightly lower scavenging activity compared to ascorbic acid (84.73 vis. 44.99%). This suggests that the fungal filtrate may have reasonable antioxidant potential. There is a clear dose-dependent response for both scavenging activity and remaining DPPH, with values progressively increasing/decreasing as the concentration increases. The standard deviations are relatively small, indicating a good reproducibility of the measurements. The results suggest that the active components in the fungal filtrate might be different from those in ascorbic acid, as their activity profiles differ at different concentrations.
The scavenging activity using the DPPH radical scavenging assay notably shows a significant reduction in remaining DPPH, indicating the highest antioxidant activity. Compared to our results, the Trichoderma asperellum WNZ-21 fungal filtrate at the highest concentration (1.988 mg/mL) shows a remaining DPPH of 55.01%, suggesting lower scavenging activity [44].
Konappa et al. [45] used the DPPH assay to evaluate the antioxidant activity of silver nanoparticles synthesized by T. harzianum. They reported IC50 values ranging from 0.038 to 0.241 mg/mL. Compared to the fungal filtrate’s IC50 value of 2.277 mg/mL, the silver nanoparticles exhibit significantly higher potency. This difference highlights the distinct nature of the active antioxidants in the Trichoderma spp. filtrate [46], further emphasizing the diversity of antioxidant profiles within the Trichoderma genus.
Analysis revealed the presence of phenolic compounds in the investigated filtrate, offering potential antioxidant benefits. These compounds combat the harmful effects of oxidative stress by neutralizing reactive oxygen species through electron or hydrogen atom donation. Additionally, they exhibit metal-chelating properties, preventing the pro-oxidant activity of transition metals [47]. By effectively scavenging these damaging molecules, phenolics may contribute to reduced muscle damage and promote faster recovery [48].
In general, based on their ability to fight free radicals, the twenty AAs fall into two distinct camps: seven powerful antioxidants (tryptophan, methionine, histidine, lysine, cysteine, arginine, and tyrosine) and thirteen with a weaker defensive capacity [49]. Methionine, cysteine, and taurine, members of the sulfur-containing AA family, stand out for their potent antioxidant abilities [50].
Based on the antioxidant activity, AAs can be classified into free AAs and coupled with phenolic or catecholic groups [51]. Free AAs like glutamate, aspartate, and glutathione defend against harmful reactive oxygen and nitrogen species (RONS) through the direct scavenging and indirect modulation of cellular antioxidant systems. Pairing AAs with phenolic groups creates potent bioactive molecules with antioxidant, anticancer, antimicrobial, and anti-atherogenic properties, suggesting improved bioactivity compared to their components [52]. Studies suggest that antioxidant AAs may benefit human health by preventing or mitigating oxidative stress-related diseases like cancer, cardiovascular issues, neurodegenerative disorders, and metabolic syndromes [51,52]. Furthermore, mome inositol, D-mannose, and mannose derivatives (which are present in the GC-MS analysis of the current filtrate) exhibited antioxidant activities [53,54,55].
The FT-IR analysis unveiled the presence of polysaccharides within the investigated filtrate, suggesting their potential as potent antioxidant agents. These biomolecules exhibit multifaceted antioxidant mechanisms, acting as free radical scavengers, modulators of endogenous antioxidant enzyme activity, and regulators of cellular signaling pathways, ultimately leading to significant antioxidative effects. This finding underscores the paramount role of structural characteristics in determining their efficacy, reinforcing the significance of exploring structure-activity relationships for optimizing therapeutic potential. Further investigations are warranted to elucidate the precise modes of action employed by these polysaccharides and maximize their efficacy in combating oxidative stress-associated pathologies [56,57].

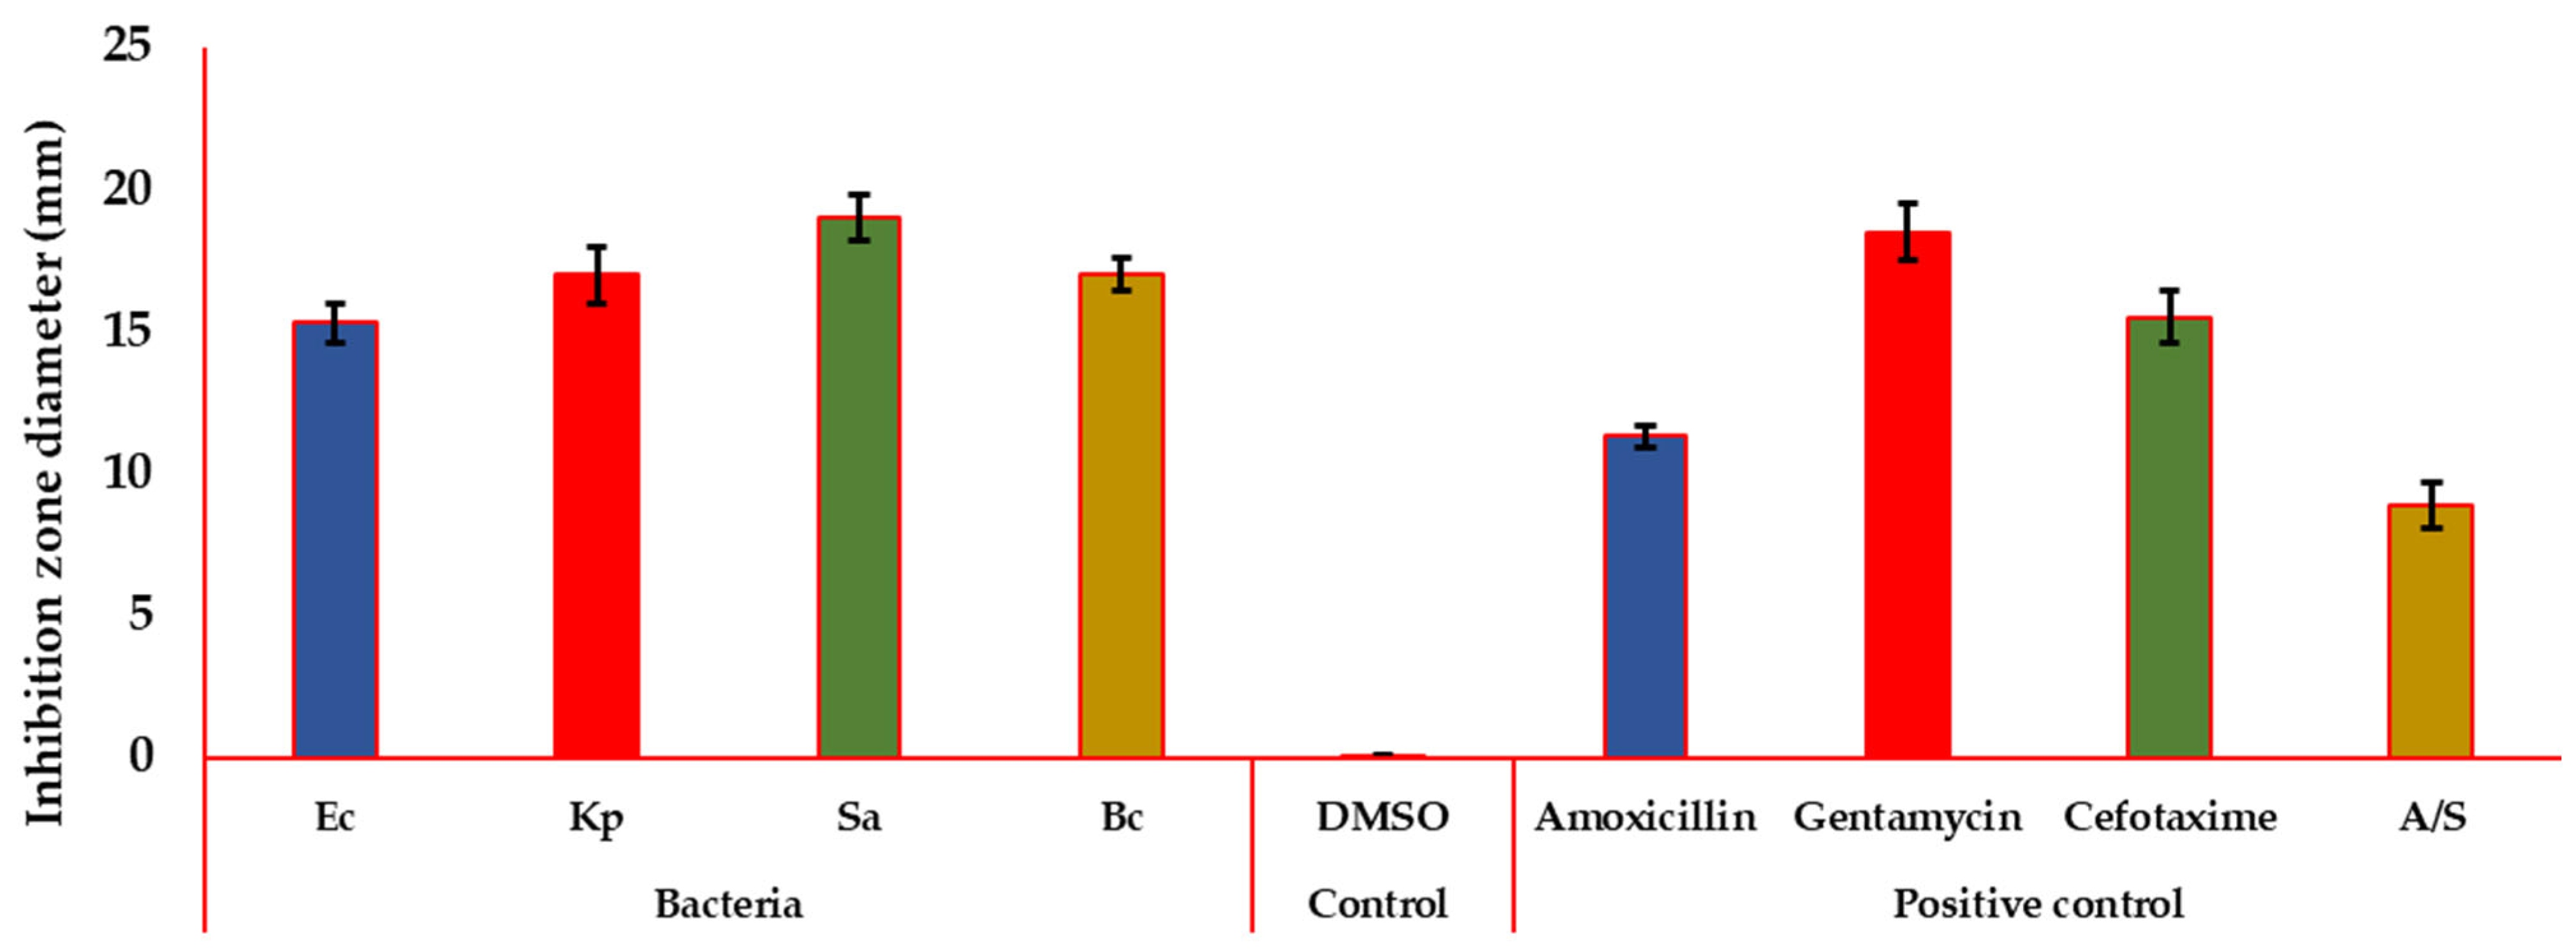
3.5.2. Antibacterial Activity

Inhibition zone diameters ranging from 15.3 to 19 mm suggest moderate antibacterial activity against all four tested Staphylococcus aureus, Bacillus cereus, Escherichia coli, and Klebsiella pneumoniae. The filtrate’s effectiveness against diverse pathogenic bacteria (Figure 12) indicates promising broad-spectrum potential. No inhibition observed in the control (DMSO) confirms the specific antibacterial activity of the filtrate.
Two bacteria (B. cereus and K. pneumoniae) were chosen for studying the MIC. The MIC of 11,950 µg/mL for B. cereus and K. pneumoniae suggests good potency against these pathogenic bacteria. Though the MIC (Table S3) of 11,950 µg/mL for K. pneumoniae is higher, the low O.D.600 value indicates a significant reduction in bacterial growth at this concentration. Despite relatively high MICs, the low O.D.600 values suggest minimal bacterial growth even at these concentrations, highlighting the potential efficacy of the filtrate. These results are encouraging and suggest that the fungal filtrate exhibits broad-spectrum antibacterial activity against various pathogenic bacteria with good potency.
Phenolic compounds emerge as promising broad-spectrum antibacterial agents. Their structural diversity enables them to interact with various bacterial targets, offering a rich repository for novel drug discovery. Unlike conventional antibiotics targeting single pathways, phenolic compounds employ a multi-pronged attack. They can interfere with essential building block synthesis, disrupt vital metabolic pathways, compromise the cell membrane integrity, inhibit key enzymes, and even intercalate with DNA, effectively hampering bacterial growth. This diverse resource not only enhances their efficacy but also hinders the development of bacterial resistance, positioning them as valuable candidates for combating bacterial infections [58,59].
Beyond building proteins, AAs could be considered potent weapons against microbes with reduced resistance. Their versatility extends beyond combat, serving as crucial components of drug carriers, solubility boosters, and immune-activating adjuvants [60]. AAs’ acid motif is ubiquitous in antimicrobial agents. Notably, in some mimics of tetrahedral transition states within enzymatic reactions, the carboxylate group is replaced by phosphonate or boronate moieties. AA-based antibacterials often target specific enzymes involved in incorporating D-AAs into cell wall peptidoglycan [61]. Studies showed that AAs, incorporated with antibiotics in vitro, significantly improve their effectiveness against planktonic bacteria. A prime example is aspartic and glutamic acids; by forming salts with trimethoprim, they successfully increase their effectiveness [62]. Moreover, AA derivatives have antimicrobial effects, such as aspartic acid derivatives [63] and lysine derivatives [64].
Interestingly, the components of the investigated filtrate (which were indicated in GC-MS analysis) have antimicrobial activities. In this connection, “1-butanol, 3-methyl-, formate” wields a double-edged sword against both bacteria (Escherichia coli and Staphylococcus aureus) and fungi (Aspergillus niger) [65]. Mome inositol was reported to inhibit Gram-positive and Gram-negative bacteria [53]. Furthermore, palmitic acid has an antimicrobial effect [66].
The FT-IR analysis revealed the presence of polysaccharides within the sample, unveiling their potential as potent natural antimicrobials. These biomolecules wield a diverse resource of antibacterial mechanisms, extending beyond simple membrane disruption. They can interact with bacterial surfaces through a combination of hydrophobicity, electrostatic forces, and specific sugar receptor recognition, effectively hindering pathogen adherence and nutrient uptake. This multifaceted approach, unlike traditional antibiotics with singular targets, presents a formidable challenge for bacteria to develop resistance. Therefore, polysaccharides offer exciting prospects for combating infections, and further research is crucial to fully unlock their therapeutic potential [67].

3.6. Anticancer Activity

3.6.1. Cell Viability Assay

To assess the cell viability and cytotoxic action of the current fungal filtrate of T. asperellum WNZ-21 on cell lines in vitro, we performed the MTT assay using a normal (BJ1) and a tumor (MCF7) cell line. This might open the way for a new strategy in the protection and prevention of disease and its associated complications. We used doxorubicin as a standard drug for comparison. The data (Table 8) show the IC50 of the two cell lines, BJ1 and MCF7, treated with either the filtrate of T. asperellum WNZ-21 or doxorubicin. The fungal filtrate had a weak inhibitory effect on the BJ1 cell line, as the IC50 was greater than 200 µg/mL, meaning that more than 200 µg/mL of the fungal preparation was needed to kill 50% of the cells. The filtrate had a moderate inhibitory effect on the MCF7 cell line, as the IC50 was 61.40 ± 1.7 µg/mL, meaning that around 61.40 µg/mL of the filtrate of T. asperellum WNZ-21 was needed to kill 50% of the cells. Doxorubicin had a weak inhibitory effect on the BJ1 cell line, as the IC50 was 100 µg/mL, meaning that 100 µg/mL of doxorubicin was needed to kill 50% of the cells. Doxorubicin had a very strong inhibitory effect on the MCF7 cell line, as the IC50 was 4.17 ± 0.2 µg/mL, meaning that around 4.17 µg/mL of doxorubicin was needed to kill 50% of the cells. In general, both agents were non-cytotoxic to the normal cell line, indicating a selective effect on cancer cells. Furthermore, the data suggest that the fungal filtrate and doxorubicin have different mechanisms of action and selectivity for the normal and cancer cell lines. The fungal preparation seems to be more selective for the MCF7 than the BJ1 cell line, while doxorubicin seems to be less selective for the MCF7 than the BJ1 cell line.
The decrease in cell viability observed by the filtrate of T. asperellum WNZ-21 may be due to the induction of human cancer cell arrest and apoptosis as potential cell death mechanisms, which underlie the anti-proliferative effects. The fungal filtrate demonstrated moderate anti-proliferative activity towards MCF7 cancer cells compared to normal BJ1 cells. This effect appears to be mediated by activating transmembrane toll-like receptor 4 (TLR4). TLR4 plays a key role in both clearing pathogens through immune responses and triggering programmed cell death (apoptosis) in tumors; thus, TLR4 activation is crucial for inducing antitumor immune responses and promoting tumor regression in cancer patients [68].

3.6.2. Apoptotic Modulation

The anticancer effect of the fungal filtrate against the proliferation of the MCF7 cell line was investigated by measuring the gene expression during qRT-PCR. BCL2 and BAX are involved in the regulation of apoptosis, with BCL2 inhibiting and BAX promoting programmed cell death. TP53 is a central player in the cell cycle’s regulation and response to DNA damage, acting as a tumor suppressor by preventing the formation of cancerous cells. Dysregulation or mutations in these genes can contribute to various diseases, including cancer.
Figure 13 shows the fold change in the gene expressions of BCL2, BAX, and P53 in the MCF7 cancer cell line in response to the fungal filtrate by qRT-PCR. The fold change is calculated by dividing the expression level of each gene in the treated sample by the expression level of the same gene in the negative control. The positive control is doxorubicin, a chemotherapy drug that induces apoptosis in cancer cells.
The fungal filtrate and doxorubicin both increased the expression of TP53, a tumor suppressor gene that regulates cell cycle arrest and apoptosis. The fold change in TP53 was higher in doxorubicin than in the filtrate of T. asperellum WNZ-21, indicating a stronger effect of doxorubicin on TP53 activation. Similarly, the fungal filtrate and doxorubicin both increased the expression of BAX, a pro-apoptotic gene that promotes cell death. The fold change in BAX was higher in doxorubicin than in the fungal filtrate, indicating a stronger effect of doxorubicin on BAX induction. On the other side, the fungal filtrate and doxorubicin both decreased the expression of BCL2, an anti-apoptotic gene that prevents cell death. The fold change in BCL2 was lower in doxorubicin than in the fungal filtrate, indicating a stronger effect of doxorubicin on BCL2 inhibition.
The ratio of BAX/BCL2 reflects the balance between pro- and anti-apoptotic signals in the cell. A higher ratio indicates a higher tendency for apoptosis. Both the fungal filtrate and doxorubicin increased the ratio of BAX/BCL2, with doxorubicin having a higher ratio than the fungal filtrate. This suggests that both treatments induced apoptosis in the MCF7 cancer cell line, with doxorubicin being more potent than the fungal filtrate.
The filtrate of T. asperellum WNZ-21 demonstrated a cytotoxic effect on the MCF7 cancer cell line, suggesting potential anticancer properties. This finding aligns with the phytochemical components detected in the filtrate through various analyses, including phytochemical, GC-MS, and AA assays.
Phenolic compounds, identified within the filtrate, are renowned for their diverse anticancer mechanisms. They can trigger apoptosis (programmed cell death), induce autophagy (cellular self-digestion), and arrest cell cycle progression at different stages. Furthermore, they can inhibit telomerase activity (essential for uncontrolled cell division) and exert anti-angiogenic effects (suppressing blood vessel formation crucial for tumor growth). These mechanisms have been validated under in vivo studies, and promising results have emerged from clinical trials. Notably, some phenolic compounds, alone or combined with conventional chemotherapy, have yielded positive clinical outcomes, solidifying their potential as valuable tools in the fight against cancer [69]. However, phenolic compounds can impact apoptosis through multiple mechanisms. They can modulate pro- and anti-apoptotic pathways by activating caspases, crucial enzymes in apoptosis, and regulating BCL2 family proteins that control mitochondrial apoptosis [70]. Phenolic compounds with antioxidant properties can scavenge reactive oxygen species (ROS), thereby preventing ROS-mediated apoptosis [71]. Some phenolics can induce cell cycle arrest, leading to apoptosis induction [72]. Certain phenolics can interact with molecules like kinases and transcription factors, influencing apoptotic signaling cascades [73].
AAs within tumors exhibit remarkable versatility. Beyond this role, they provide energy, maintain redox balance, and, through their derivatives, influence gene expression and immune responses, ultimately impacting tumor development and metastasis [74]. AAs reveal themselves as cunning allies of cancer, ensuring robust defenses through biosynthesis, redox balance, and epigenetic control. Even stem cells, the resilient core of the tumor, rely on this support system. This dependence, however, offers a glimmer of hope by controlling AAs through diet or drugs, holding the key to breaching even drug-resistant tumors [75]. AA derivatives are used in the manufacture of anticancer drugs such as aspartic acid derivatives [76] and lysine derivatives [77].
Other constituents of the investigated filtrate (present in GC-MS analysis) have anticancer activities. Mome inositol exhibits anticancer activities [53]. Maltol combats cancer in B16F10 cells by turning down the volume on PD-L1, a protein that shields tumors from immune attack [78]. Palmitic acid, a simple fatty acid, has potent antitumor activity, tackling a diverse range of cancers like gastric, liver, cervical, breast, and colorectal cancers [79].
Polysaccharides exert their anticancer effects through diverse molecular mechanisms, targeting multiple hallmarks of cancer. These include suppressing tumor proliferation and inducing apoptosis, activating autophagy for cellular self-destruction, modulating cell cycle progression, hindering tumor blood vessel formation (angiogenesis), regulating the conversion of epithelial cells to motile mesenchymal cells (epithelial-mesenchymal transition), mitigating oxidative stress, and enhancing immune system responses against cancer cells [80].
Ultimately, the results also suggest that the hydrolysate of T. asperellum WNZ-21 and doxorubicin have different mechanisms of action and selectivity for the MCF7 cancer cell line. The fungal filtrate seems to be more selective for the MCF7 cell line than the normal cell line. This may be due to the different targets and pathways that the fungal filtrate and doxorubicin affect in the cell.

4. Conclusions

This study effectively optimized the biodegradation of common bean biomass using a novel approach (DSD combined with ANN) using the endophytic fungus T. asperellum WNZ-21, resulting in a fungal hydrolysate rich in AAs and bioactive compounds with potential medical applications. GC-MS revealed the potentiality of four novel components not previously reported in microbial filtrates or plants, in addition to seven components only reported in plant sources but not reported in microbial filtrates. These potential new components highlight the innovation of the research. Moving forward, efforts should focus on developing cost-effective production methods and exploring the hydrolysate’s applicability to other biomass sources. Further characterization of novel components and in vivo studies are recommended to assess safety, efficacy, and potential applications. Additionally, exploring the effectiveness of the fungal filtrate against various types of cancer cells and researching its other potential properties are suggested for future studies.

Supplementary Materials

The following supporting information can be downloaded at https://www.mdpi.com/article/10.3390/fermentation10070354/s1. Figure S1. Profile of HPLC chromatogram showing the standard chart of amino acids (A), and the detected amino acids of filtrate of Trichoderma asperellum WNZ-21 (B) grown on the residue of common bean biomass. Figure S2. A relation between the filtrate of T. asperellum WNZ-21 concentration versus scavenging activity. Table S1. The primer sequences of the genes used for quantitative real-time PCR (qRT-PCR) analysis. Table S2. Chemical structure of metabolites present in the fungal filtrate of Trichoderma asperellum WNZ-21 grown on the residue of common bean biomass as indicated by GC-MS analysis. Table S3. FT-IR spectrum of Trichoderma asperellum WNZ-21 filtrate. Table S4. MIC after 24 h of filtrate of Trichoderma asperellum WNZ-21 incubation at 37 °C, turbidity was noticed in the test tubes 4 (Bacillus cereus), and 3 (Klebsiella pneumoniae).

Author Contributions

Conceptualization, Y.F.A., Z.M., S.S.A. and W.I.A.S.; methodology, Y.F.A., Z.M., S.S.A., W.I.A.S. and D.B.E.D.; software, H.A. and W.I.A.S.; validation, Z.M., H.A. and W.I.A.S.; formal analysis, S.S.A., Z.M., HA, W.I.A.S. and D.B.E.D.; investigation, all authors; resources, Y.F.A., S.S.A. and D.B.E.D.; data curation, Z.M., H.A. and W.I.A.S.; writing, original draft preparation, all authors; writing, review and editing, Z.M., S.S.A., H.A. and W.I.A.S.; supervision, Y.F.A. and W.I.A.S.; project administration, Y.F.A. All authors have read and agreed to the published version of the manuscript.

Funding

The authors extend their appreciation to the Deputyship for Research and Innovation, Ministry of Education in Saudi Arabia, for funding this research work through the project number (0202-1443-S).

Institutional Review Board Statement

Not applicable.

Informed Consent Statement

Not applicable.

Data Availability Statement

The original contributions presented in the study are included in the article/Supplementary Materials, further inquiries can be directed to the corresponding authors.

Conflicts of Interest

The authors declare no conflicts of interest.

References

  1. Gimenes, N.C.; Silveira, E.; Tambourgi, E.B. An overview of proteases: Production, downstream processes and industrial applications. Sep. Purif. Rev. 2021, 50, 223–243. [Google Scholar] [CrossRef]
  2. Verma, N.; Kumar, V.; Bansal, M. Valorization of waste biomass in fermentative production of cellulases: A review. Waste Biomass Valorization 2021, 12, 613–640. [Google Scholar] [CrossRef]
  3. Moussa, Z.; Darwish, D.B.; Alrdahe, S.S.; Saber, W.I.A. Innovative Artificial-Intelligence-Based Approach for the Biodegradation of Feather Keratin by Bacillus paramycoides, and Cytotoxicity of the Resulting Amino Acids. Front. Microbiol. 2021, 12, 731262. [Google Scholar] [CrossRef] [PubMed]
  4. Hellwig, M. The Chemistry of Protein Oxidation in Food. Angew. Chem. Int. Ed. Engl. 2019, 58, 16742–16763. [Google Scholar] [CrossRef] [PubMed]
  5. Vandana, U.K.; Rajkumari, J.; Singha, L.P.; Satish, L.; Alavilli, H.; Sudheer, P.D.; Chauhan, S.; Ratnala, R.; Satturu, V.; Mazumder, P.B. The endophytic microbiome as a hotspot of synergistic interactions, with prospects of plant growth promotion. Biology 2021, 10, 101. [Google Scholar] [CrossRef] [PubMed]
  6. Shah, S.K.; Dey, Y.N.; Madhavan, Y.; Maity, A. Fungal Endophytes: A Storehouse of Bioactive Compounds. Mini Rev. Med. Chem. 2023, 23, 978–991. [Google Scholar] [CrossRef] [PubMed]
  7. Gupta, A.; Meshram, V.; Gupta, M.; Goyal, S.; Qureshi, K.A.; Jaremko, M.; Shukla, K.K. Fungal Endophytes: Microfactories of Novel Bioactive Compounds with Therapeutic Interventions; A Comprehensive Review on the Biotechnological Developments in the Field of Fungal Endophytic Biology over the Last Decade. Biomolecules 2023, 13, 1038. [Google Scholar] [CrossRef] [PubMed]
  8. Hashem, A.H.; Attia, M.S.; Kandil, E.K.; Fawzi, M.M.; Abdelrahman, A.S.; Khader, M.S.; Khodaira, M.A.; Emam, A.E.; Goma, M.A.; Abdelaziz, A.M. Bioactive compounds and biomedical applications of endophytic fungi: A recent review. Microb. Cell Factories 2023, 22, 107. [Google Scholar] [CrossRef] [PubMed]
  9. Omomowo, I.O.; Amao, J.A.; Abubakar, A.; Ogundola, A.F.; Ezediuno, L.O.; Bamigboye, C.O. A review on the trends of endophytic fungi bioactivities. Sci. Afr. 2023, 20, e01594. [Google Scholar] [CrossRef]
  10. Elsayed, M.S.; Eldadamony, N.M.; Alrdahe, S.S.T.; Saber, W.I.A. Definitive Screening Design and Artificial Neural Network for Modeling a Rapid Biodegradation of Date Palm Fronds by a New Trichoderma sp. PWN6 into Citric Acid. Molecules 2021, 26, 5048. [Google Scholar] [CrossRef] [PubMed]
  11. Elsayed, A.; Moussa, Z.; Alrdahe, S.S.; Alharbi, M.M.; Ghoniem, A.A.; El-Khateeb, A.Y.; Saber, W.I.A. Optimization of Heavy Metals Biosorption via Artificial Neural Network: A Case Study of Cobalt (II) Sorption by Pseudomonas alcaliphila NEWG-2. Front. Microbiol. 2022, 13, 893603. [Google Scholar] [CrossRef] [PubMed]
  12. Fakhry, H.; Ghoniem, A.A.; Al-Otibi, F.O.; Helmy, Y.A.; El Hersh, M.S.; Elattar, K.M.; Saber, W.I.A.; Elsayed, A. A Comparative Study of Cr(VI) Sorption by Aureobasidium pullulans AKW Biomass and Its Extracellular Melanin: Complementary Modeling with Equilibrium Isotherms, Kinetic Studies, and Decision Tree Modeling. Polymers 2023, 15, 3754. [Google Scholar] [CrossRef] [PubMed]
  13. El-Metwally, M.M.; Abdel-Fattah, G.M.; Al-Otibi, F.O.; Khatieb, D.; Helmy, Y.A.; Mohammed, Y.M.M.; Saber, W.I.A. Application of artificial neural networks for enhancing Aspergillus flavipes lipase synthesis for green biodiesel production. Heliyon 2023, 9, e20063. [Google Scholar] [CrossRef] [PubMed]
  14. Saber, W.I.A.; Al-Askar, A.A.; Ghoneem, K.M. Exclusive Biosynthesis of Pullulan Using Taguchi’s Approach and Decision Tree Learning Algorithm by a Novel Endophytic Aureobasidium pullulans Strain. Polymers 2023, 15, 1419. [Google Scholar] [CrossRef] [PubMed]
  15. Tunga, R.; Banerjee, R.; Bhattacharyya, B. Optimizing some factors affecting protease production under solid state fermentation. Bioprocess Eng. 1998, 19, 187–190. [Google Scholar] [CrossRef]
  16. Cupp-Enyard, C. Sigma’s Non-specific Protease Activity Assay—Casein as a Substrate. J. Vis. Exp. 2008, e899. [Google Scholar] [CrossRef]
  17. Aberoumand, A. Nutritional evaluation of edible Portulaca oleracia as plant food. Food Anal. Methods 2009, 2, 204–207. [Google Scholar] [CrossRef]
  18. Burlingame, B. Wild nutrition. J. Food Compos. Anal. 2000, 2, 99–100. [Google Scholar] [CrossRef]
  19. Sánchez-Rangel, J.C.; Benavides, J.; Heredia, J.B.; Cisneros-Zevallos, L.; Jacobo-Velázquez, D.A. The Folin–Ciocalteu assay revisited: Improvement of its specificity for total phenolic content determination. Anal. Methods 2013, 5, 5990–5999. [Google Scholar] [CrossRef]
  20. Zhishen, J.; Mengcheng, T.; Jianming, W. The determination of flavonoid contents in mulberry and their scavenging effects on superoxide radicals. Food Chem. 1999, 64, 555–559. [Google Scholar] [CrossRef]
  21. Jajić, I.; Krstović, S.; Glamočić, D.; Jakšić, S.; Abramović, B. Validation of an HPLC method for the determination of amino acids in feed. J. Serbian Chem. Soc. 2013, 78, 839–850. [Google Scholar] [CrossRef]
  22. Kitts, D.D.; Wijewickreme, A.N.; Hu, C. Antioxidant properties of a North American ginseng extract. Mol. Cell. Biochem. 2000, 203, 1–10. [Google Scholar] [CrossRef] [PubMed]
  23. Parejo, I.; Codina, C.; Petrakis, C.; Kefalas, P. Evaluation of scavenging activity assessed by Co(II)/EDTA-induced luminol chemiluminescence and DPPH·(2,2-diphenyl-1-picrylhydrazyl) free radical assay. J. Pharmacol. Toxicol. Methods 2000, 44, 507–512. [Google Scholar] [CrossRef] [PubMed]
  24. Boyanova, L.; Gergova, G.; Nikolov, R.; Derejian, S.; Lazarova, E.; Katsarov, N.; Mitov, I.; Krastev, Z. Activity of Bulgarian propolis against 94 Helicobacter pylori strains in vitro by agar-well diffusion, agar dilution and disc diffusion methods. J. Med. Microbiol. 2005, 54, 481–483. [Google Scholar] [CrossRef] [PubMed]
  25. Owuama, C.I. Determination of minimum inhibitory concentration (MIC) and minimum bactericidal concentration (MBC) using a novel dilution tube method. Afr. J. Microbiol. Res. 2017, 11, 977–980. [Google Scholar]
  26. Thabrew, M.I.; Hughes, R.D.; McFarlane, I.G. Screening of hepatoprotective plant components using a HepG2 cell cytotoxicity assay. J. Pharm. Pharmacol. 1997, 49, 1132–1135. [Google Scholar] [CrossRef] [PubMed]
  27. Ramadan, M.A.; Shawkey, A.E.; Rabeh, M.A.; Abdellatif, A.O. Expression of P53, BAX, and BCL-2 in human malignant melanoma and squamous cell carcinoma cells after tea tree oil treatment in vitro. Cytotechnology 2019, 71, 461–473. [Google Scholar] [CrossRef] [PubMed]
  28. Brito, J.P.; Morris, J.C.; Montori, V.M. Thyroid cancer: Zealous imaging has increased detection and treatment of low risk tumours. BMJ 2013, 347, f4706. [Google Scholar] [CrossRef] [PubMed]
  29. El-Naggar, N.E.-A.; Saber, W.I.; Zweil, A.M.; Bashir, S.I. An innovative green synthesis approach of chitosan nanoparticles and their inhibitory activity against phytopathogenic Botrytis cinerea on strawberry leaves. Sci. Rep. 2022, 12, 3515. [Google Scholar] [CrossRef] [PubMed]
  30. Lakhdari, W.; Benyahia, I.; Bouhenna, M.M.; Bendif, H.; Khelafi, H.; Bachir, H.; Ladjal, A.; Hammi, H.; Mouhoubi, D.; Khelil, H.; et al. Exploration and Evaluation of Secondary Metabolites from Trichoderma harzianum: GC-MS Analysis, Phytochemical Profiling, Antifungal and Antioxidant Activity Assessment. Molecules 2023, 28, 5025. [Google Scholar] [CrossRef]
  31. Omomowo, I.; Fadiji, A.; Omomowo, O. Antifungal evaluation and phytochemical profile of Trichoderma harzianum and Glomus versiforme secondary metabolites on cowpea pathogens. Asian J. Microbiol. Biotechnol. Environ. Sci. 2020, 22, 265–272. [Google Scholar]
  32. Sumilat, D.A.; Lintang, R.A.J.; Undap, S.L.; Adam, A.A.; Tallei, T.E. Phytochemical, antioxidant, and antimicrobial analysis of Trichoderma asperellum isolated from ascidian Eudistoma sp. J. Appl. Pharm. Sci. 2022, 12, 090–095. [Google Scholar] [CrossRef]
  33. Ciurko, D.P.; Łaba, W.; Piegza, M.; Juszczyk, P.; Choińska-Pulit, A.; Sobolczyk-Bednarek, J. Enzymatic bioconversion of feather waste with keratinases of PCM 2849. Pol. J. Chem. Technol. 2019, 21, 53–59. [Google Scholar] [CrossRef]
  34. Moussa, Z.; Alanazi, Y.F.; Khateb, A.M.; Eldadamony, N.M.; Ismail, M.M.; Saber, W.I.A.; Darwish, D.B.E. Domiciliation of Trichoderma asperellum Suppresses Globiosporangium ultimum and Promotes Pea Growth, Ultrastructure, and Metabolic Features. Microorganisms 2023, 11, 198. [Google Scholar] [CrossRef] [PubMed]
  35. Damodaran, S.; Parkin, K.L. Amino acids, peptides, and proteins. In Fennema’s Food Chemistry; CRC Press: Boca Raton, FL, USA, 2017; pp. 235–356. [Google Scholar]
  36. Murdock, J.N.; Wetzel, D.L. FT-IR microspectroscopy enhances biological and ecological analysis of algae. Appl. Spectrosc. Rev. 2009, 44, 335–361. [Google Scholar] [CrossRef]
  37. Adochitei, A.; Drochioiu, G. Rapid characterization of peptide secondary structure by FT-IR spectroscopy. Rev. Roum. Chim. 2011, 56, 783–791. [Google Scholar]
  38. Honary, S.; Zahir, F. Effect of zeta potential on the properties of nano-drug delivery systems-a review (Part 1). Trop. J. Pharm. Res. 2013, 12, 255–264. [Google Scholar]
  39. Tao, B.; Ren, C.; Li, H.; Liu, B.; Jia, X.; Dong, X.; Zhang, S.; Chang, H. Thio-/LISICON and LGPS-Type Solid Electrolytes for All-Solid-State Lithium-Ion Batteries. Adv. Funct. Mater. 2022, 32, 2203551. [Google Scholar] [CrossRef]
  40. Loget, G.; Kuhn, A. Electric field-induced chemical locomotion of conducting objects. Nat. Commun. 2011, 2, 535. [Google Scholar] [CrossRef] [PubMed]
  41. Qian, Y.; Zhong, L.; Sun, Y.; Sun, N.; Zhang, L.; Liu, W.; Qu, Y.; Zhong, Y. Enhancement of Cellulase Production in Trichoderma reesei via Disruption of Multiple Protease Genes Identified by Comparative Secretomics. Front. Microbiol. 2019, 10, 2784. [Google Scholar] [CrossRef]
  42. Cherif, M.; Benhamou, N. Cytochemical aspects of chitin breakdown during the parasitic action of a Trichoderma sp. on Fusarium oxysporum f. sp. radicis-lycopersici. Phytopathology 1990, 80, 1406–1414. [Google Scholar] [CrossRef]
  43. Cardoso, M.M.; Barradas, M.J.; Kroner, K.H.; Crespo, J.G. Amino acid solubilization in cationic reversed micelles: Factors affecting amino acid and water transfer. J. Chem. Technol. Biotechnol. Int. Res. Process Environ. Clean. Technol. 1999, 74, 801–811. [Google Scholar] [CrossRef]
  44. Mohamed, S.A.; Saleh, R.M.; Kabli, S.A.; Al-Garni, S.M. Influence of solid state fermentation by Trichoderma spp. on solubility, phenolic content, antioxidant, and antimicrobial activities of commercial turmeric. Biosci. Biotechnol. Biochem. 2016, 80, 920–928. [Google Scholar] [CrossRef]
  45. Konappa, N.; Udayashankar, A.C.; Dhamodaran, N.; Krishnamurthy, S.; Jagannath, S.; Uzma, F.; Pradeep, C.K.; De Britto, S.; Chowdappa, S.; Jogaiah, S. Ameliorated antibacterial and antioxidant properties by Trichoderma harzianum mediated green synthesis of silver nanoparticles. Biomolecules 2021, 11, 535. [Google Scholar] [CrossRef] [PubMed]
  46. Kim, K.; Heo, Y.M.; Jang, S.; Lee, H.; Kwon, S.-L.; Park, M.S.; Lim, Y.W.; Kim, J.-J. Diversity of Trichoderma spp. in marine environments and their biological potential for sustainable industrial applications. Sustainability 2020, 12, 4327. [Google Scholar] [CrossRef]
  47. Nagarajan, S.; Nagarajan, R.; Kumar, J.; Salemme, A.; Togna, A.R.; Saso, L.; Bruno, F. Antioxidant Activity of Synthetic Polymers of Phenolic Compounds. Polymers 2020, 12, 1646. [Google Scholar] [CrossRef] [PubMed]
  48. Kruk, J.; Aboul-Enein, B.H.; Duchnik, E.; Marchlewicz, M. Antioxidative properties of phenolic compounds and their effect on oxidative stress induced by severe physical exercise. J. Physiol. Sci. 2022, 72, 19. [Google Scholar] [CrossRef] [PubMed]
  49. Xu, N.; Chen, G.; Liu, H. Antioxidative Categorization of Twenty Amino Acids Based on Experimental Evaluation. Molecules 2017, 22, 2066. [Google Scholar] [CrossRef] [PubMed]
  50. Kim, J.-H.; Jang, H.-J.; Cho, W.-Y.; Yeon, S.-J.; Lee, C.-H. In Vitro antioxidant actions of sulfur-containing amino acids. Arab. J. Chem. 2020, 13, 1678–1684. [Google Scholar] [CrossRef]
  51. Matemu, A.; Nakamura, S.; Katayama, S. Health Benefits of Antioxidative Peptides Derived from Legume Proteins with a High Amino Acid Score. Antioxidants 2021, 10, 316. [Google Scholar] [CrossRef] [PubMed]
  52. Monteiro, L.S.; Paiva-Martins, F. Amino Acids, Amino Acid Derivatives and Peptides as Antioxidants. In Lipid Oxidation in Food and Biological Systems: A Physical Chemistry Perspective; Springer: Berlin/Heidelberg, Germany, 2022; pp. 381–404. [Google Scholar]
  53. Kavaz, D.; Faraj, R.E. Investigation of composition, antioxidant, antimicrobial and cytotoxic characteristics from Juniperus sabina and Ferula communis extracts. Sci. Rep. 2023, 13, 7193. [Google Scholar] [CrossRef] [PubMed]
  54. Zhao, S.; Zeng, W.; Li, Z.; Peng, Y. Mannose regulates water balance, leaf senescence, and genes related to stress tolerance in white clover under osmotic stress. Biol. Plant. 2020, 64, 406–416. [Google Scholar] [CrossRef]
  55. Tian, D.; Qiao, Y.; Peng, Q.; Zhang, Y.; Gong, Y.; Shi, L.; Xiong, X.; He, M.; Xu, X.; Shi, B. A Poly-D-Mannose Synthesized by a One-Pot Method Exhibits Anti-Biofilm, Antioxidant, and Anti-Inflammatory Properties In Vitro. Antioxidants 2023, 12, 1579. [Google Scholar] [CrossRef]
  56. Fernandes, P.A.R.; Coimbra, M.A. The antioxidant activity of polysaccharides: A structure-function relationship overview. Carbohydr. Polym. 2023, 314, 120965. [Google Scholar] [CrossRef] [PubMed]
  57. Mu, S.; Yang, W.; Huang, G. Antioxidant activities and mechanisms of polysaccharides. Chem. Biol. Drug Des. 2021, 97, 628–632. [Google Scholar] [CrossRef] [PubMed]
  58. Ecevit, K.; Barros, A.A.; Silva, J.M.; Reis, R.L. Preventing microbial infections with natural phenolic compounds. Future Pharmacol. 2022, 2, 460–498. [Google Scholar] [CrossRef]
  59. Lobiuc, A.; Paval, N.E.; Mangalagiu, I.I.; Gheorghita, R.; Teliban, G.C.; Amariucai-Mantu, D.; Stoleru, V. Future Antimicrobials: Natural and Functionalized Phenolics. Molecules 2023, 28, 1114. [Google Scholar] [CrossRef] [PubMed]
  60. Idrees, M.; Mohammad, A.R.; Karodia, N.; Rahman, A. Multimodal Role of Amino Acids in Microbial Control and Drug Development. Antibiotics 2020, 9, 330. [Google Scholar] [CrossRef] [PubMed]
  61. Nowak, M.G.; Skwarecki, A.S.; Milewska, M.J. Amino Acid Based Antimicrobial Agents—Synthesis and Properties. ChemMedChem 2021, 16, 3513–3544. [Google Scholar] [CrossRef] [PubMed]
  62. Elshaer, A.; Hanson, P.; Worthington, T.; Lambert, P.; Mohammed, A.R. Preparation and characterization of amino acids-based trimethoprim salts. Pharmaceutics 2012, 4, 179–196. [Google Scholar] [CrossRef] [PubMed]
  63. Patyal, M.; Kaur, K.; Gupta, N.; Kaur, R.; Malik, A.K. Optical and Antimicrobial Activity of Nanostructured Mn (II) and Cu (II) Macrocyclic Complexes Derived from Aspartic Acid. Prot. Met. Phys. Chem. Surf. 2023, 59, 169–178. [Google Scholar] [CrossRef]
  64. Wu, Y.; He, Q.; Che, X.; Liu, F.; Lu, J.; Kong, X. Effect of number of lysine motifs on the bactericidal and hemolytic activity of short cationic antimicrobial peptides. Biochem. Biophys. Res. Commun. 2023, 648, 66–71. [Google Scholar] [CrossRef] [PubMed]
  65. Rakhmawatie, M.D.; Marfu’ati, N.; Barsaliputri, B.; FikrIyah, A.Z.; Ethica, S.N. Antibacterial activity and GC-MS profile of secondary metabolites of Bacillus subtilis subsp. subtilis HSFI-9 associated with Holothuria scabra. Biodiversitas J. Biol. Divers. 2023, 24, 2843–2849. [Google Scholar] [CrossRef]
  66. Hamad, G.M.; Abd El-Baky, N.; Sharaf, M.M.; Amara, A.A. Volatile Compounds, Fatty Acids Constituents, and Antimicrobial Activity of Cultured Spirulina (Arthrospira fusiformis) Isolated from Lake Mariout in Egypt. Sci. World J. 2023, 2023, 9919814. [Google Scholar] [CrossRef] [PubMed]
  67. Zhou, Y.; Chen, X.; Chen, T.; Chen, X. A review of the antibacterial activity and mechanisms of plant polysaccharides. Trends Food Sci. Technol. 2022, 123, 264–280. [Google Scholar] [CrossRef]
  68. Bhatia, S.; Miller, N.J.; Lu, H.; Longino, N.V.; Ibrani, D.; Shinohara, M.M.; Byrd, D.R.; Parvathaneni, U.; Kulikauskas, R.; Ter Meulen, J.; et al. Intratumoral G100, a TLR4 Agonist, Induces Antitumor Immune Responses and Tumor Regression in Patients with Merkel Cell Carcinoma. Clin. Cancer Res. 2019, 25, 1185–1195. [Google Scholar] [CrossRef] [PubMed]
  69. Bakrim, S.; El Omari, N.; El Hachlafi, N.; Bakri, Y.; Lee, L.-H.; Bouyahya, A. Dietary Phenolic Compounds as Anticancer Natural Drugs: Recent Update on Molecular Mechanisms and Clinical Trials. Foods 2022, 11, 3323. [Google Scholar] [CrossRef]
  70. Endo, H.; Inoue, I.; Masunaka, K.; Tanaka, M.; Yano, M. Curcumin induces apoptosis in lung cancer cells by 14-3-3 protein-mediated activation of Bad. Biosci. Biotechnol. Biochem. 2020, 84, 2440–2447. [Google Scholar] [CrossRef]
  71. Li, J.; Fan, Y.; Zhang, Y.; Liu, Y.; Yu, Y.; Ma, M. Resveratrol Induces Autophagy and Apoptosis in Non-Small-Cell Lung Cancer Cells by Activating the NGFR-AMPK-mTOR Pathway. Nutrients 2022, 14, 2413. [Google Scholar] [CrossRef] [PubMed]
  72. Wu, D.; Liu, Z.; Wang, Y.; Zhang, Q.; Li, J.; Zhong, P.; Xie, Z.; Ji, A.; Li, Y. Epigallocatechin-3-gallate alleviates high-fat diet-induced nonalcoholic fatty liver disease via inhibition of apoptosis and promotion of autophagy through the ROS/MAPK signaling pathway. Oxid. Med. Cell. Longev. 2021, 2021, 5599997. [Google Scholar] [CrossRef] [PubMed]
  73. Sair, A.T.; Liu, R.H. Molecular regulation of phenolic compounds on IGF-1 signaling cascade in breast cancer. Food Funct. 2022, 13, 3170–3184. [Google Scholar] [CrossRef] [PubMed]
  74. Lieu, E.L.; Nguyen, T.; Rhyne, S.; Kim, J. Amino acids in cancer. Exp. Mol. Med. 2020, 52, 15–30. [Google Scholar] [CrossRef] [PubMed]
  75. Pranzini, E.; Pardella, E.; Paoli, P.; Fendt, S.M.; Taddei, M.L. Metabolic Reprogramming in Anticancer Drug Resistance: A Focus on Amino Acids. Trends Cancer 2021, 7, 682–699. [Google Scholar] [CrossRef] [PubMed]
  76. Khalil, M.; Haq, E.A.; Dwiranti, A.; Prasedya, E.S.; Kitamoto, Y. Bifunctional folic-conjugated aspartic-modified Fe3O4 nanocarriers for efficient targeted anticancer drug delivery. RSC Adv. 2022, 12, 4961–4971. [Google Scholar] [CrossRef] [PubMed]
  77. Aslani, R.; Namazi, H. Simple fabrication of multifunctional hyperbranched copolymer based on l-lysine and citric acid for co-delivery of anticancer drugs to breast cancer cells. React. Funct. Polym. 2022, 170, 105101. [Google Scholar] [CrossRef]
  78. Han, N.-R.; Park, H.-J.; Ko, S.-G.; Moon, P.-D. Maltol has anti-cancer effects via modulating PD-L1 signaling pathway in B16F10 cells. Front. Pharmacol. 2023, 14, 1255586. [Google Scholar] [CrossRef]
  79. Wang, X.; Zhang, C.; Bao, N. Molecular mechanism of palmitic acid and its derivatives in tumor progression. Front. Oncol. 2023, 13, 1224125. [Google Scholar] [CrossRef] [PubMed]
  80. Ju, H.; Yu, C.; Zhang, X.-D.; Liu, W.; Wu, Y.-C.; Gong, P.-X.; Li, H.-H.; Liu, Y.; Li, H.-J. Recent trends in anti-cancer activities of terrestrial plants-based polysaccharides: A review. Carbohydr. Polym. Technol. Appl. 2023, 6, 100341. [Google Scholar] [CrossRef]
Figure 1. The significant threshold (blue line) and relative importance of the ten tested independent variables on amino acid production by Trichoderma asperellum WNZ-21 as recovered by the DSD. X1; NaH2PO4 (mg/g), X2; KH2PO4 (mg/g), X3; NaCl (mg/g), X4; NH4Cl (mg/g), X5; MgSO4·7H2O (mg/g), X6; CaCl2·2H2O (mg/g), X7; pH, X8; incubation time (day), X9; inoculation, X10; incubation temperature (°C).
Fermentation 10 00354 g001
Figure 2. The predicted versus actual values of total free amino acid biosynthesis by Trichoderma asperellum WNZ-21.
Fermentation 10 00354 g002
Figure 3. A residual analysis of amino acid production data by Trichoderma asperellum WNZ-21 using the DSD model. Panel (A) shows residuals versus predicted values, and panel (B) displays standardized residuals with confidence intervals.
Fermentation 10 00354 g003
Figure 4. Artificial neural network architecture with one input layer (eight neurons), two hidden layers, and one output neuron. X2; KH2PO4 (mg/g), X3; NaCl (mg/g), X5; MgSO4·7H2O (mg/g), X6; CaCl2·2H2O (mg/g), X7; pH, X8; incubation time (day), X9; inoculation, X10; incubation temperature (°C).
Fermentation 10 00354 g004
Figure 5. Performance of ANN, in terms of actual vs. predicted (A,B) and residual vs. predicted (C,D) AA production values for training and validation process.
Fermentation 10 00354 g005
Figure 6. The phytochemical content of the Trichoderma asperellum WNZ-21 filtrate. GAE; gallic acid equivalent, CE; catechin equivalent, TAE; tannic acid equivalent.
Fermentation 10 00354 g006
Figure 7. This HPLC chromatogram shows the profile of the detected amino acids in the filtrate of Trichoderma asperellum WNZ-21 grown on the residue of common bean biomass.
Fermentation 10 00354 g007
Figure 8. The GC-MS analysis of the fungal filtrate of Trichoderma asperellum WNZ-21 grown on the residue of common bean biomass.
Fermentation 10 00354 g008
Figure 9. FT-IR spectrum of Trichoderma asperellum WNZ-21 fungal filtrate.
Fermentation 10 00354 g009
Figure 10. Zeta potential analysis of Trichoderma asperellum WNZ-21 filtrate.
Fermentation 10 00354 g010
Figure 11. HR-TEM images of Trichoderma asperellum WNZ-21 filtrate.
Fermentation 10 00354 g011
Figure 12. The antibacterial results of the fungal filtrate of the Trichoderma asperellum WNZ-21 solution against various pathogenic bacteria. The MIC of Bacillus cereus was 5975 µg/mL, and the MIC of Klebsiella pneumoniae was 11,950 µg/mL. DMSO was used as a negative control and the antibiotics amoxicillin, gentamycin, cefotaxime, and ampicillin/sublactam (A/S) were used as a positive control for E. coli (Ec), K. pneumoniae (Kp), S. aureus (SA), and B. cereus (Bc), respectively.
Fermentation 10 00354 g012
Figure 13. Gene expression analysis of BCL2, BAX, and TP53 in MCF7 cancer cell line by real-time PCR in response to filtrate of Trichoderma asperellum WNZ-21.
Fermentation 10 00354 g013
Table 1. The levels of the independent variables used for the production of free amino acids during the solid-state fermentation of the residue of common bean biomass.
VariableLevel
NameSymbolUnitLow (−1)Center (0)High (+1)
NaH2PO4X1mg/g RCBB10.8012.8014.80
KH2PO4X22.003.004.00
NaClX30.300.500.70
NH4ClX40.501.001.50
MgSO4·7H2OX50.300.500.70
CaCl2·2H2OX60.0050.0100.015
pHX7 5.506.006.50
TimeX8Day7.09.011.0
InoculationX9Spore/g RCBB1 × 1062 × 1063 × 106
TemperatureX10°C253035
Table 2. The DSD matrix includes nutritional and physical variables, the experimental data of amino acid (AA) production by Trichoderma asperellum WNZ-21, and the corresponding predicted and error values obtained from both models.
RunBlockThe Coded Level of the Independent VariableAmino Acids (µg/g)
ActualDSDANN
X1X2X3X4X5X6X7X8X9X10PredictedErrorPredictedError
1 *1011111111114,151.5814,872.12−720.5415,113.26−241.14
210−1−1−1−1−1−1−1−1−15856.415938.34−81.936549.77−611.43
3110−1−11−1111−114,313.5715,266.91−953.3415,368.87−101.96
41−1011−11−1−1−115027.505543.55−516.055588.06−44.51
5 *11−10−111−11−1114,310.5712,707.831602.7413,498.79−790.96
61−1101−1−11−11−18222.188102.63119.558039.9062.73
711−1−10−111−1118932.118103.29828.827250.51852.78
81−11101−1−11−1−111,509.8512,707.16−1197.3111,727.83979.33
9 *1111−10−1−1−1117051.297469.19−417.907743.02−273.83
10 *1−1−1−110111−1−114,151.5813,341.27810.3113,442.04−100.77
11 *11−111−10−111−112,609.7412,689.00−79.2612,096.10592.90
12 *1−11−1−1101−1−117577.248121.46−544.228016.38105.08
13 *111−11−1−101−119510.057968.641541.418555.07−586.43
141−1−11−1110−11−112,151.7812,841.82−690.0413,376.95−535.13
15 *1111−1−1110−1−112,043.8011,056.00987.8011,216.67−160.67
161−1−1−111−1−10119864.019754.46109.559718.0736.39
17111−1111−1−10−17030.308387.93−1357.638094.15293.78
181−1−11−1−1−1110111,764.8212,422.53−657.7112,809.30−386.77
1911−1111−11−1−1011,050.8911,473.96−423.0710,541.29932.67
201−11−1−1−11−11109062.099336.50−274.418506.97829.53
211000000000010,299.9710,405.23−105.269512.85892.38
222011111111115,103.4914,872.12231.3715,113.26−241.14
2320−1−1−1−1−1−1−1−1−16696.335938.34757.996549.77−611.43
24210−1−11−1111−116,520.3515,266.911253.4415,368.87−101.96
252−1011−11−1−1−116164.385543.55620.835588.06−44.51
2621−10−111−11−1113,485.6512,707.83777.8213,498.79−790.96
272−1101−1−11−11−18490.158102.63387.528039.9062.73
28 *21−1−10−111−1117109.298103.29−994.007250.51852.78
29 *2−11101−1−11−1−112,380.7612,707.16−326.4011,727.83979.33
302111−10−1−1−1117388.267469.19−80.937743.02−273.83
312−1−1−110111−1−113,928.6113,341.27587.3413,442.04−100.77
3221−111−10−111−111,148.8912,689.00−1540.1112,096.10592.90
332−11−1−1101−1−116891.318121.46−1230.158016.38105.08
34211−11−1−101−118666.137968.64697.498555.07−586.43
352−1−11−1110−11−113975.612,841.821133.7813,376.95−535.13
362111−1−1110−1−111,091.8911,056.0035.8911,216.67−160.67
372−1−1−111−1−101110,932.919754.461178.459718.0736.39
38 *211−1111−1−10−18892.118387.93504.188094.15293.78
392−1−11−1−1−1110111,809.8212,422.53−612.7112,809.30−386.77
40 *21−1111−11−1−1011,435.8611,473.96−38.1010,541.29932.67
412−11−1−1−11−11108200.189336.50−1136.328506.97829.53
42200000000009014.1010,405.23−1391.139512.85892.38
43 *3011111111116,001.4014,872.121129.2815,113.26−241.14
44 *30−1−1−1−1−1−1−1−1−15902.415938.34−35.936549.77−611.43
45 *310−1−11−1111−115,071.4915,266.91−195.4215,368.87−101.96
463−1011−11−1−1−115543.455543.55−0.105588.06−44.51
4731−10−111−11−1112,544.7512,707.83−163.0813,498.79−790.96
483−1101−1−11−11−19813.028102.631710.398039.9062.73
49 *31−1−10−111−1116990.308103.29−1112.997250.51852.78
503−11101−1−11−1−112,952.7012,707.16245.5411,727.83979.33
513111−10−1−1−1118349.177469.19879.987743.02−273.83
52 *3−1−1−110111−1−112,324.7713,341.27−1016.5013,442.04−100.77
5331−111−10−111−112,905.7112,689.00216.7112,096.10592.90
54 *3−11−1−1101−1−118493.158121.46371.698016.38105.08
55311−11−1−101−117426.267968.64−542.388555.07−586.43
56 *3−1−11−1110−11−114,094.5912,841.821252.7713,376.95−535.13
573111−1−1110−1−111,211.8811,056155.8811,216.67−160.67
58 *3−1−1−111−1−10119646.049754.46−108.429718.0736.39
59 *311−1111−1−10−19112.098387.93724.168094.15293.78
603−1−11−1−1−1110113,563.6412,422.531141.1112,809.30−386.77
6131−1111−11−1−1010,374.9611,473.96−1099.0010,541.29932.67
623−11−1−1−11−11109187.089336.50−149.428506.97829.53
63300000000008203.1810,405.23−2202.059512.85892.38
* Runs that were randomly chosen for the validation process. X1; NaH2PO4 (mg/g), X2; KH2PO4 (mg/g), X3; NaCl (mg/g), X4; NH4Cl (mg/g), X5; MgSO4·7H2O (mg/g), X6; CaCl2·2H2O (mg/g), X7; pH, X8; incubation time (day), X9; inoculation, X10; incubation temperature (°C).
Table 3. Regression coefficients and ANOVA for total free amino acids by Trichoderma asperellum WNZ-21.
SourceCoefficientFreedom DegreeSum of SquaresMean of SquaresF RatioProb > F *VIF
Model10,40510477,587,90247,758,79052.870.0000-
X116411,451,7661,451,7661.610.21101.00
X2−625121,097,03121,097,03123.350.00001.00
X3825136,786,00236,786,00240.720.00001.00
X4−16811,527,1521,527,1521.690.19901.00
X513871103,943,196103,943,196115.070.00001.00
X628314,312,0664,312,0664.770.03301.00
X71013155,365,58955,365,58961.290.00001.00
X819631208,032,461208,032,461230.290.00001.00
X9532115,288,75115,288,75116.920.00001.00
X10−743129,783,88829,783,88832.970.00001.00
Error-5246,973,828903,343---
Lack-of-Fit-1015,095,9951,509,5991.990.0590-
Pure error-4231,877,833758,996---
Total-62524,561,730----
The goodness-of-fit statistics
Coefficient of determination (R2)0.9105
Adjusted-R20.8932
Predicted-R20.8720
X1; NaH2PO4 (mg/g), X2; KH2PO4 (mg/g), X3; NaCl (mg/g), X4; NH4Cl (mg/g), X5; MgSO4·7H2O (mg/g), X6; CaCl2·2H2O (mg/g), X7; pH, X8; incubation time (day), X9; inoculation, X10; incubation temperature (°C), VIF: variance inflation factor. *: F-statistic value at 5% significant level.
Table 4. The ANN model’s measurements during the training and validation process.
MeasureTrainingValidation
R20.91380.9433
Root average square error816.35720.38
Mean absolute deviation673.67661.48
−Log-likelihood341.20167.97
Sum frequency4221
Table 5. The anticipated optimal conditions, as forecasted by the ANN model, and the comparative values of expected and actual AA production by Trichoderma asperellum WNZ-21.
Test PointInvestigated ParameterAmino Acids (µg/g RCBB)Desirability
X2X3X5X6X7X8X9X10PredictedExperimental
Optimal2.420.70.70.0156.3113,000,0002518,582.5218,298.14 ± 97.080.9977
One1.500.50.60.0055.071,500,000309583.939805.02 ± 103.96
Two2.000.40.30.0105.582,500,000355873.055905.71 ± 59.70
Three1.000.60.40.0057.0101,000,0003010,216.6810,999.12 ± 150.00
Four3.000.50.50.0106.092,000,000259760.889700.25 ± 11.03
X2; KH2PO4 (mg/g), X3; NaCl (mg/g), X5; MgSO4·7H2O (mg/g), X6; CaCl2·2H2O (mg/g), X7; pH, X8; incubation time (day), X9; inoculation, X10; incubation temperature (°C).
Table 6. Metabolites present in the fungal filtrate of Trichoderma asperellum WNZ-21 grown on the residue of common bean biomass as indicated by GC-MS analysis.
PeakRTNameFormulaMolecular WeightArea Sum %
17.45Palmitic acidC16H32O22561.88
2796Citraconic anhydrideC5H4O311211.99
312.33UndecanalC11H22O1701.24
412.682-methylmalonic acid (MMA)C6H12O21163.91
512.92MaltolC6H6O31263.91
613.271-Butanol, 3-methyl, formateC6H12O211612.06
713.862,3-dihydro-3,5-dihydroxy-6-methyl-4h-pyran-4-one (DDPM)C6H8O41448.73
815.56Cyclopenta[cd]pentaleneC10H61262.10
918.792-methoxy vinylphenolC9H10O21503.25
1020.444-O-alpha-D-Glucopyranosyl-D-glucoseC12H22O113421.03
1122.492,2,3,3,4,4 Hexadeutero octadecanalC18H30D6O2744.04
1223.09Mome inositolC7H14O61947.68
1323.51alpha-D-glucopyranose-4-O-alpha-d-glactopyranosylC12H22O113422.61
1424.29Generyl isovalerateC15H26O22381.51
1524.84Hexopyranosyl-(1->3)hex-2-ulofuranosyl hexopyranosideC18H32O165042.28
1625.121,3-CyclohexanedioneC11H16O21801.25
1725.79D-MannoseC6H12O61801.31
1826.00alpha-D-Glucopyranoside, O-à-D-glucopyranosyl-(1.fwdarw.3)-alpha-D-fructofuranosylC18H32O165041.05
1926.704-C-Methyl-myo-inositolC7H14O61944.06
2028.18Octadecanoic acid 9,10-dichloro-,methyl esterC19H36Cl2O23661.07
2130.986,8-Nonadien-2-one, 8-methyl-5-(1-methylethyl)-, (E)-C13H22O1942.06
2234.65Spiro [4.5]decan-7-one, 1,8-dimethyl-8,9-epoxy-4-isopropyl-C15H24O22361.35
2356.08Stigmast-5-en-3-ol, (3.beta.,24S)C29H50O4142.18
Table 7. The antioxidant mechanisms (remaining DPPH, scavenging activities, and IC50 (mg/mL)) of the filtrate of Trichoderma asperellum WNZ-21 (n = 3 ± SD).
SampleConcentration (mg/mL)Remaining DPPH (%)Scavenging Activity (%)IC50 (mg/mL)
Fungal filtrate1.98855.01 ± 1.5544.99 ± 1.802.277 ± 0.129
0.99469.23 ± 1.7330.77 ± 1.70
0.49780.17 ± 2.0519.83 ± 2.08
0.24890.49 ± 1.678.83 ± 2.05
Ascorbic acid0.06215.27 ± 1.0884.73 ± 1.050.022 ± 0.250
0.03139.08 ± 1.4460.92 ± 1.45
0.01661.07 ± 1.1938.93 ± 1.28
0.00874.81 ± 1.0525.19 ± 1.08
Table 8. The IC50 values of the Trichoderma asperellum WNZ-21 filtrate against normal and cancer cell lines (n = 3 ± SD).
Cell Line TypeThe Fungal Filtrate (µg/mL)Doxorubicin (Control; µg/mL)
Normal skin fibroblast>200100 ± 1.1
Caucasian breast adenocarcinoma61.40 ± 1.74.17 ± 0.2
IC50: The lethal concentration needed to inhibit cell growth by 50% after 48 h. Lower IC50 values indicate stronger activity, categorized as follows: very strong (1–10 µg/mL), strong (11–20 µg/mL), moderate (21–50 µg/mL), weak (51–100 µg/mL), and non-cytotoxic (>100 µg/mL).
Disclaimer/Publisher’s Note: The statements, opinions and data contained in all publications are solely those of the individual author(s) and contributor(s) and not of MDPI and/or the editor(s). MDPI and/or the editor(s) disclaim responsibility for any injury to people or property resulting from any ideas, methods, instructions or products referred to in the content.

