Abstract
Plant protein ingredients are gaining attention for human nutrition, yet they differ significantly from animal proteins in functionality and nutrition. Fungal solid-state fermentation (SSF) can modulate the composition and functionality, increasing their applicability in foods. Quinoa flour (QF) served as a substrate for Aspergillus oryzae and Rhizopus oligosporus, resulting in two fermented ingredients (QFA and QFR) with different nutritional, functional, and aroma characteristics. A higher increase in protein (+35%) and nitrogen (+24%) was observed in the QFA, while fat was predominantly increased in the QFR (+78%). Fermentable oligo-, di-, monosaccharides and polyols (FODMAPs) decreased in the QFR but increased in the QFA due to polyol production. Metabolomic analysis revealed higher lactic acid concentrations in the QFA, and higher citric, malic, and fumaric acid contents in the QFR. The SSF reduced most antinutrients, while R. oligosporus produced saponins. Olfactometry showed the development of fruity ester compounds and a decrease in metallic and cardboard aromas. Both ingredients showed an enhanced water-holding capacity, with the QFA also demonstrating an increased oil-holding capacity. Complex formation increased the particle size, reduced the solubility, and decreased the foaming properties. Mycelium production darkened the ingredients, with the QFR having a higher differential colour index. This study highlights the potential of SSF to produce ingredients with improved nutritional, sensory, and functional properties.
1. Introduction
Quinoa (Chenopodium quinoa Willd.) is a pseudocereal originating from the Andean region of South America, which is of great interest for human nutrition. It has gained global popularity due to its exceptional nutritional profile. Quinoa has been reported to contain all nine essential amino acids, with protein levels ranging from 12 to 18%, making it particularly beneficial for vegetarians and vegans [,,]. Lipids in quinoa account for 2–10%, which is higher than the average for pseudocereals and cereals, and the starch content is in the range of 48–69% [,]. Additionally, quinoa is rich in dietary fibre (7–11%), vitamins, including B complex, E, and C, and minerals such as calcium, iron, magnesium, manganese, phosphorus, potassium, and zinc [,]. Besides its nutrient content, quinoa contains notable amounts of nutraceutical compounds like flavonoids, which have antioxidant properties and contribute to overall health benefits [].
Despite these positive attributes, quinoa also contains certain antinutrients such as phytic acid, saponins, condensed tannins, trypsin, and chymotrypsin inhibitors, which could be responsible for reducing the bioavailability and bioaccessibility of essential nutrients. Various treatments such as cooking, soaking, germination, or fermentation can reduce these antinutrients and improve the nutritional quality of pseudocereals [].
Solid-state fermentation (SSF) is a method involving the growth of microorganisms on a damp solid substrate without free-flowing water. However, the substrate must contain enough moisture to allow the microorganisms to grow. This type of fermentation is predominantly used with fungi because the water activity required for their growth (0.5–0.6) is lower than that of bacteria (0.8–0.9) []. SSF is an attractive option for recycling agro-food waste, e.g., to transform waste into value-added products such as biofuels, bioplastics, and bioactive compounds []. It is an environmentally friendly technology, as it requires low energy and produces less wastewater than other fermentations [].
Aspergillus oryzae and Rhizopus oligosporus are filamentous fungi known for their remarkable ability to secrete large amounts of enzymes such as proteases, amylases, cellulase, and esterases, which hydrolyse proteins, polysaccharides, and lipids [,,]. A. oryzae plays a crucial role in food production, particularly in Asia to produce traditional fermented foods such as miso, soy sauce, and sake []. In Europe, these species have been used in enzyme production for brewing and baking. Additionally, A. oryzae has a Generally Recognised As Safe (GRAS) status for the production of food-grade enzymes [,]. R. oligosporus is a zygomycete that has been traditionally used in Indonesia since ancient times to produce tempeh by the SSF of soybeans [,]. This species is also a food-grade fungus and has been widely used in SSF for its ability to produce phytase enzymes responsible for the reduction in phytic acid [,]. SSF with A. oryzae and R. oligosporus offers a technological alternative for enhancing the nutritional value of legumes and cereals as well as modifying functional and sensory properties []. Zhang et al. (2022) used SSF on soybeans with Rhizopus oligosporus and observed an improvement in the nutritional value and prebiotic potential of the ingredient []. Another study by Kumitch et al. (2020) showed changes in the functional properties of pea protein-enriched flour fermented with Aspergillus oryzae, including improved water- and oil-holding properties [].
The aim of the present study is to evaluate how SSF with A. oryzae and R. oligosporus affects the nutritional composition of quinoa flour. In addition, modifications of the techno-functional properties, such as the foaming properties and water- and oil-holding capacities, were investigated, and an in-depth aroma analysis was performed.
2. Materials and Methods
2.1. Raw Materials and Starter Cultures
Quinoa flour was supplied by Quinoa Marche (Jesi, Italy) and was fermented by Mogu (Inarzo, Italy) using Aspergillus oryzae or Rhizopus oligosporus. A. oryzae and R. oligosporus inoculums (both obtained from commercial starters produced by Starter Cultures and Top Cultures, respectively) consisted of a koji starter and a tempeh starter, respectively. These starters were comprised of powdered spores of the respective strains, prepared according to the method outlined in Chutrtong and Bussabun (2014) [] and modified as follows: a Petri dish culture of each strain, demonstrating clear sporulation on MYA medium, was lyophilised using an Alpha 1-2 LDplus lyophiliser (230 V, CHRIST). The lyophilised cultures were then mixed with sterilised rice flour (Oryza sativa, Riseria d’Italia S.r.l., Piedmont, Italy), previously autoclaved (121 °C, 15 min) in a 9:1 weight ratio (rice flour/lyophilised culture), using a laboratory mill. The resulting starter was stored at 25 °C for up to 60 days.
Unless stated otherwise, all chemicals were sourced from Sigma-Aldrich (St. Louis, MO, USA).
2.2. Solid-State Fermentation
The substrate (quinoa flour, initial relative humidity of 35–40%) was washed under water before being immersed in water for rehydration for 15 min with a substrate-to-water volume ratio of 1:2. The substrate was then drained and autoclaved (121 °C, 15 min) before being allowed to cool to 30 °C.
In the tempeh-like fermentation involving R. oligosporus, the process was carried out according to the method outlined in Erkan et al. (2020) [] with some modifications. The pH of the substrate was adjusted during the cooling phase by adding 25 mL of wine vinegar per 500 g of dry substrate. For the inoculation, 1.5 g of tempeh starter per 500 g of dry substrate was introduced and thoroughly mixed to ensure an even spore distribution. The substrate was then tightly packed onto stainless steel trays of a total volume of 3.8 L and fitted with a polycarbonate lid.
The koji-like fermentation with A. oryzae followed the procedure of Kim et al. (2012) []. Here, the substrate was directly inoculated with 1.5 g of koji starter per 500 g of dry substrate, ensuring thorough mixing for even spore distribution. The substrate was then compacted onto stainless steel trays of a total volume of 3.8 L with a polycarbonate lid.
In both cases, the inoculated substrate was incubated on heating mats (24 cm × 52 cm, 220 V, Lerway) at 28 and 30 °C for the tempeh and koji, respectively, each controlled by a thermostat (ITC-308, 220 V, Inkbird, Shenzhen, China) inserted in the centre of the substrate bed. In the case of A. oryzae, 24 h after inoculation, the substrate was mixed to aid in complete colonisation by the fungal strain through the further distribution of the spores, as well as to dissipate the heat and promote aeration. After 48 and 72 h of incubation for R. oligosporus and A. oryzae, respectively, the mycelium covered, in all cases, the surface of the substrate, creating a compact cake where all the particles were held together. The fermented substrate was collected and freeze-dried. Finally, the dried biomass was ground to obtain flour (particle size ≤ 100–200 μm).
2.3. Compositional Analysis
2.3.1. Moisture
Moisture was determined using the air-oven method (AACC Method 44-17.01) [].
2.3.2. Total Nitrogen and Protein Content
Nitrogen content was determined by the Kjeldahl method and carried out externally by CHELAB S.r.l. (Resana, Italy) using an internal method based on ISO 8968-1:2014/IDF 20-1, RAPPORTI ISTISAN 1996/34, DM 23/07/1994, DM 21/04/1986, and REG CE 152/2009 [,,,].
Protein content was calculated as the sum of individual anhydrous amino acid residues.
Based on these results, the nitrogen-to-protein conversion factors were calculated as follows []:
2.3.3. Fat
Total fat and the fatty acid profile were analysed externally by CHELAB S.r.l. (Resana, Italy). Fat content was measured using an internal method based on the Soxhlet method. Fatty acid composition was determined using a method based on ISO 16958:2015 [].
2.3.4. Carbohydrates
Resistant, digestible, and total starch were determined using the Megazyme kit K-RAPRS (Megazyme, Bray, Ireland); sugars and FODMAPs were extracted as reported by Ispiryan et al. (2019) [], and separated and quantified via high-performance anion-exchange chromatography coupled with pulsed amperometric detection (HPAEC-PAD), performed on a DionexTM ICS-5000+ system (Thermo Scientific, Sunnyvale, CA, USA) []; dietary fibre was determined using the K-RINTDF method (Megazyme, Bray, Ireland). All carbohydrates were quantified using authentic reference standards.
2.3.5. Ash Content
Ash analysis was carried out externally by CHELAB S.r.l. (Resana, Italy) using an internal method based on AOAC 923.03 [].
2.4. Protein Characteristics
2.4.1. Total Amino Acid Profile and Free Amino Acids
Amino acid profiles were determined after hydrolysis under acidic, oxidative–acidic (Cys and Met), or alkaline (Trp) conditions with a Sykam (Fürstenfeldbruck, Germany) S433 amino acid analyser via external calibration, as described previously by Ahlborn et al. (2019) []. True protein contents were calculated as the sum of the amino acid residuals, taking into account the added amount of water for peptide bond hydrolysis.
Free amino acid concentrations were determined by MS-Omics Aps (Vedbæk, Danemark). Samples were derivatised with methyl chloroformate using a slightly modified version of the protocol described by Smart et al. (2010) []. All samples were analysed in a randomised order. Analysis was performed using gas chromatography (7890B, Agilent, Santa Clara, CA, USA) coupled with a quadrupole detector (5977B, Agilent, Santa Clara, CA, USA) []. The system was controlled by ChemStation (Agilent, Santa Clara, CA, USA). Raw data were converted to netCDF format using Chemstation (Agilent, Santa Clara, CA, USA) before the data were imported and processed in Matlab R2021b (Mathworks, Inc., Natick, MA, USA) using the PARADISe software (PARAFAC2 model), as described by Johnsen et al. (2017) [].
2.4.2. Sulfhydryl Groups
Exposed, free, and total sulfhydryl (SH) groups were determined using Ellman’s method. An amount of 75 mg of the protein sample was diluted in 10 mL Tris-Glycine buffer at a pH of 8 and extracted overnight at 4 °C. The buffer for the exposed SH groups consisted of 0.1 M Tris, 0.1 M glycine, and 4 mM EDTA with an addition of 8 M urea for the free and total SH groups. For the exposed and free SH groups, 80 μL of Ellman’s reagent [5,5′-dithiobis-(2-nitrobenzoic acid)] was added to 2.5 mL of diluted sample, including a reagent blank in which the protein sample was replaced by the respective Tris-Glycine buffer. In addition, sample blanks were prepared by replacing the reagent with the respective buffer. Samples were left for 15 min at room temperature to let the reagent act and centrifuged for 15 min at 3112 rcf at 4 °C before being measured at 412 nm on a UV–Vis spectrophotometer (Genesys 50, Thermo Fisher Scientific, Madison, WI, USA). For the total SH groups, 4 mL of the Tris-Glycine buffer containing 8 M urea and 0.05 mL of 2-Mercaptoethanol (2-ME) were added to 1 mL of diluted sample and incubated on a shaking plate for 1 h at room temperature, followed by the addition of 10 mL of 12% trichloroacetic acid (TCA) and a further 1 h incubation at room temperature. Samples were centrifuged at 3112 rcf for 15 min at 22 °C and the supernatant was discarded. The pellet was resuspended twice in 5 mL of TCA, followed by the same centrifugation step. The pellet was redissolved in 10 mL of Tris-Glycine buffer with 8 M urea, followed by the same procedure as the exposed and free SH groups, except that 40 µL of Ellman’s reagent was added to 5 mL of the diluted sample with no centrifugation step before reading the absorbance. The SH groups were quantified as follows:
where Abs412 is the absorbance at 412 nm, Abs412a is the absorbance value for the blank, A412b is the absorbance value for the reagent blank, ε is the extinction coefficient, which was taken as 13,600 M−1cm−1, and C is the protein concentration in mg/mL of the diluted sample.
2.4.3. Protein Solubility
The protein solubility was measured at a native pH and a pH of 7. The 1% (w/v) protein dispersions were prepared in distilled water and adjusted to a pH of 7, if required, using 2 M NaOH and 0.1 M NaOH. The dispersions were hydrated at 4 °C overnight on a shaking plate. After the temperatures returned to room temperature, the pH was readjusted if necessary. The samples were centrifuged at 4893 rcf for 30 min before the protein content in the supernatant was determined using the Kjeldahl method, AACC Method 46-12.01 [], and calculated based on nitrogen-to-protein conversion factors for each individual ingredient.
Protein solubility results were expressed as the percentage of protein remaining in the supernatant.
2.4.4. Protein Profile
The protein profile of the flours was determined by SDS-PAGE using the NuPAGE 4 to 12%, Bis-Tris, 1.0–1.5 mm, and mini protein gels (Invitrogen, Thermo Fisher Scientific, Waltham, MA, USA). An extraction buffer consisting of 2 M urea, 100 mM DTT, and 100 mM Tris base, adjusted to a pH of 8.8 with 0.1 M HCl, was used to extract protein from 1% (w/v) solutions of defatted, milled, and sieved samples. Samples were shaken at 500 rpm for 2 h at room temperature, followed by centrifugation at 20,000 rcf for 30 min. The protein concentration of the supernatants was determined using the PierceTM BCA Protein Assay Kit (Thermo Fisher Scientific, Waltham, MA, USA). An aliquot was mixed with the NuPAGETM LDS Sample Buffer (4X) (Invitrogen by Thermo Fisher Scientific, Waltham, MA, USA) and the NuPAGETM Sample Reducing Agent (10X) (Invitrogen by Thermo Fisher Scientific, Waltham, MA, USA) and heated at 70 °C for 10 min, followed by an additional centrifugation step at 14,000 rcf for 10 min. The Precision Plus ProteinTM Dual Xtra Prestained Protein Standard (BioRad, Hercules, CA, USA) ladder with a size range of 2–250 kDa was prepared. An amount of 20 μL of the diluted ladder and sample volumes based on a protein content of 10 μg protein/lane were loaded onto the gel and ran in the diluted NuPAGETM MES SDS Running Buffer (20X) (Invitrogen by Thermo Fisher Scientific, Waltham, MA, USA) at a 160 V constant until the completion of the electrophoresis (approx. 40 min). The gel was rinsed and fixed on a shaking plate with the Instant Blue Coomassie Protein Stain solution (Abcam, Cambridge, UK) for around 30 min. Afterwards, the gel was rinsed with distilled water until the stain solution was removed.
2.5. Techno-Functional Properties of the Ingredients
2.5.1. pH and Total Titratable Acidity (TTA)
The pH and TTA of the raw and fermented ingredients were determined as described by Jaeger et al. (2023) []. Briefly, 95 mL of distilled water and 5 mL of acetone were added to 10 g of sample. The pH was measured using a calibrated pH meter (Mettler-Toledo, OH, USA). The TTA was determined by titration with 0.1 M NaOH to a pH of 8.5, followed by readjustment after 3 min. The TTA results are expressed as mL of 0.1 M NaOH/10 g of sample.
2.5.2. Water- and Oil-Holding Capacity
The water-holding capacity (WHC) and oil-holding capacity (OHC) were determined by weighing 1 g of sample and 6 g of water or sunflower oil in a 15 mL tube. The dispersion was then vortexed for 3 min at the highest speed using a vortex mixer (Scientific Industries Inc., Bohemia, New York, NY, USA), followed by centrifugation at 4000 rcf for 30 min at 20 °C. The tubes containing the pellet were re-weighed after discarding the supernatant. The WHC or OHC were determined using the following equation:
2.5.3. Foaming Properties
To determine foaming capacity and foam stability, a 2% (w/w) dispersion in distilled water was prepared, and the pH was adjusted to 7 using 0.1 M NaOH before being hydrated overnight at 4 °C. After returning them to room temperature and a pH readjustment, the initial sample height was measured. The samples were then frothed for 30 s at 30,000 rpm using an Ultra-Turrax T10 (IKA Labortechnik, Staufen, Germany) equipped with a S10N-10G dispersing element and the foam height was measured immediately, and then a second time after 60 min. The foaming properties were determined using the following equations:
2.5.4. Minimum Gelling Concentration
The minimum gelling concentration was determined according to Vogelsang et al. (2020) by dispersing each protein ingredient in distilled water in various concentrations (%w/w ingredient, total 15 g dispersion) and adjusting the pH to 7 using 2 M NaOH and 0.1 M NaOH []. Samples were hydrated overnight at 4 °C before being heated at 90 °C for 45 min in a water bath and cooled on ice for 5 min. The tubes were incubated overnight at 4 °C and inverted to observe the lowest concentration at which the dispersion did not flow within 30 s, referred to as the minimum gelling concentration.
2.5.5. Emulsifying Capacity
Emulsion stability was determined using the method described by Jaeger et al. (2023), with some adjustments []. A 1% (w/v) aqueous protein solution was prepared and adjusted to a pH of 7 using 2 M NaOH and 0.1 M NaOH before being shaken overnight at 4 °C. Emulsions were prepared by mixing the protein dispersions with sunflower oil in a 90:10 ratio. An Ultra-Turrax equipped with an S10N-10G dispersing element (IKA Labortechnik, Staufen, Germany) was used to shear the samples for 2 min at 25,600 rpm. The emulsion stability was measured using an analytical centrifuge (LUMiSizer, LUM GmbH, Berlin, Germany) with parameters of 100 rcf for 15 min at 15 °C. The results are expressed as the separation rate (%/s).
2.5.6. Particle Size
The Mastersizer 3000 (Malvern Instruments Ltd., Worcestershire, UK) with the AERO-S attachment was used to measure the particle size distribution of the dry ingredients by laser diffraction. The particle refractive index was set to 1.45, and the particle absorption index was set to 0.001.
2.5.7. Colour
The colour of the samples was measured with a ChromaMeter CR-400 (Konica Minolta, Osaka, Japan) using the CIE L*a*b* reference colour space system. The three different parameters of this system are the L*-value, which represents the lightness and includes values between 0 (black) and 100 (white); the a*-value, which represents the colour scheme from green to red; the b*-value, which represents the colour from blue to yellow. The differential colour index value was calculated using the following equation:
where .
2.6. Antinutritional Factors
Antinutritional factors, specifically phytic acid, saponins, and condensed tannin concentrations, were determined as follows. All results are expressed as dry matter and were analysed in duplicate.
2.6.1. Phytic Acid
Phytic acid concentrations in the raw and fermented ingredients were determined using a phytic acid (phytate)/total phosphorus kit (Megazyme International, Ireland), which quantifies the phosphorus concentrations released by the enzymatic action of phytases. Briefly, 1 g of sample was treated with 20 mL of 0.66 M HCl overnight at 25–28 °C. The treated samples were subjected to high-speed centrifugation (18,516 rcf, 10 min) to collect the supernatant, then the pH was adjusted to a pH of 7 using 0.75 M NaOH. The extracts were processed to estimate the free and total phosphorus concentrations using the phosphorus calibration curve according to the manufacturer’s instructions. The phosphorus content was quantified to estimate the phytic acid concentrations using a mathematical formula provided in the instruction manual.
2.6.2. Total Saponins
The total saponin content was quantified based on the method of Lai et al. (2013) with modifications to the extraction process, as detailed by Krause et al. (2023) [,]. Briefly, 0.5 g of the sample was defatted with petroleum ether (10 mL) with continuous shaking for 4 h. The solvent was evaporated, and 20 mg of the residues were used for extraction by mixing with 5 mL of methanol (80% v/v) for 4 h. The mixture was centrifuged (7916 rcf, 10 min, 4 °C), and the supernatants were incubated (4 °C) in the dark until use. Amounts of 0.1 mL of the sample extract, 0.4 mL of methanol (80% v/v), 0.5 mL of freshly prepared 8% ethanolic vanillin solution, and 5.0 mL of 72% sulphuric acid were mixed in an ice-water bath. The mixture was heat-treated at 60 °C for 10 min and then cooled in ice water. The absorbance values were measured at 544 nm (against reagent blank), and the results were expressed as mg saponin/g extract based on the standard curve of saponins in 80% aqueous methanol.
2.6.3. Condensed Tannins
Condensed tannins were determined using the vanillin assay, as described by Krause et al. (2023) []. The extracts were prepared by mixing 200 mg of raw ingredient with 10 mL of absolute methanol for 20 min in rotating screw-cap culture tubes. The supernatant was collected by centrifugation (2740 rcf, 10 min). An amount of 1 mL of samples and standards (catechin) were transferred in duplicate to glass tubes and heated to 30 °C in a water bath. Simultaneously, the vanillin reagent was prepared by mixing one part vanillin (1% w/v) in absolute methanol with one part concentrated HCl (8% v/v) in absolute methanol. Then, 5 mL of the preheated vanillin reagent was added to one sample set and standard tubes. At the same time, 5 mL of preheated 4% aqueous HCl solution was added to the second set of tubes, maintaining 1-min intervals between additions. The samples were incubated for 20 min at 30 °C, and the absorbance values were collected at 500 nm within 1-min intervals. Condensed tannins were expressed as catechin equivalents (CEs), mg/g, calculated based on the standard curve obtained from the absorbance at 500 nm against the reagent blanks.
2.6.4. Trypsin Inhibitor Activity (TIA)
Trypsin inhibitor activity (TIA) was determined by a spectrophotometric assay based on the AOCS Method Ba 12a-2020, with each sample measured in duplicate []. One trypsin unit is defined as an increase in absorbance by 0.02 units measured at 410 nm under the 5-mL assay condition, as per the assay protocol. TIA was expressed as trypsin inhibitor units per mg sample of dry matter.
2.6.5. Chymotrypsin Inhibitor Activity (CIA)
Chymotrypsin inhibition activity (CIA) was measured based on the spectrophotometric method of Alonso et al. (2000) []. Sample extraction was performed by mixing the sample and 0.05 M Tris-HCl buffer (pH of 7.6) overnight at a sample-to-buffer ratio of 1:10 (w/v). The extracts (50 µL) were mixed with a 0.005% chymotrypsin solution prepared in 0.05 M Tris-HCl buffer (pH of 7.6) (100 μL), followed by dilution to 1 mL. Then, 0.001 M benzoyl-L-tyrosine ethyl ester (BTEE) (heated to 30 °C) was added to the samples (2.5 mL), and the absorbance values were recorded at 256 nm immediately. Here, 1 chymotrypsin unit was defined as the increase in absorbance by 0.01 units of the reaction mixture.
2.7. Olfactometry
Olfactometry analyses were carried out externally by AromaLAB GmbH (Martinsried, Germany). An amount of 50 g of samples was extracted with 100 mL distilled diethyl ether and 150 mL tap water. The volatile compounds from the organic layer separated from the residue were isolated via solvent-assisted flavour evaporation (SAFE) distillation. Sodium sulphate was used to dry the solution and the samples were finally concentrated to 100 μL using a Vigreux column.
The aroma of the samples was determined using high-resolution gas chromatography/olfactometry (HRGC/O) by the injection of 1 μL on a capillary column (FFAP, 30 m × 0.25 mm inner diameter (ID), 0.25 μm film thickness), carried by helium gas, and detected by a flame ionisation detector (FID) [].
Compounds were identified based on their linear retention indices, odour qualities, and odour as perceived at the sniffing port.
2.8. Fungal Metabolites
Sample analysis was carried out by MS-Omics Aps (Vedbæk, Danemark) according to the method described in Section 2.3.1.
Ergosterol concentrations were measured as follows: Freeze-dried mycelia (−60 °C, 0.1 mbar) were ground in a mortar and analysed for ergosterol contents according to the method of Bickel-Haase et al. (2024) []. Briefly, mycelia were saponified in methanolic NaOH (5% (m/v) in 95% (v/v) methanol) and afterwards extracted three times with 5 mL of n-hexane. After drying over anhydrous Na2SO4, a 6 mL aliquot of the combined hexane phases was evaporated under nitrogen. The residue was solved and silylated with 1 mL of N-methyl-N-(trimethylsilyl)trifluoroacetamide (50% (v/v) in THF) for 2 min at 70 °C and incubated overnight in the dark at room temperature. By applying 7-dehydrocholesterol as an internal standard, ergosterol was quantified with an external calibration by GC-FID analysis.
The latter was performed using an Agilent (Santa Clara, CA, USA) 7890 gas chromatograph equipped with an Agilent 7683B autosampler and an Agilent DB5ms column (30 m × 0.32 mm × 0.25 µm). A sample volume of 1 µL was injected by means of a split/splitless injector (250 °C) in splitless mode. H2 was used as carrier gas (constant flow, 2.2 mL/min). The oven was heated from 100 °C (3 min) to 280 °C (12 min) and finally to 320 °C (5 min), both with a heating rate of 30 °C/min. Hydrogen (40 mL/min), air (400 mL/min), and nitrogen makeup gas (25 mL/min) were used for the FID (250 °C).
2.9. Statistical Analysis
All analyses were conducted in triplicate unless otherwise specified. The results were tested for normality, followed by a one-way ANOVA with a post hoc Tukey test (p < 0.05), using IBM SPSS Statistics software, version 28 (Armonk, NY, USA). A correction using the Welch test and Games Howell post hoc test (p < 0.05) was performed in cases where equal variances were not assumed. Non-parametric Kruskal–Wallis tests (p < 0.05) were performed when the data were not normally distributed.
Correlation analysis and regressions were performed using Microsoft Excel (Microsoft Corporation, Redmond, WA, USA).
3. Results
3.1. Compositional Analysis
Compositional analysis of the control quinoa flour (QF), the quinoa flour fermented with A. oryzae (QFA), and the quinoa flour fermented with R. oligosporus (QFR) are shown in Table 1. The moisture of the QF was 12.48 g/100 g. A drying process during the solid-state fermentation gave the QFA and QFR lower moisture values. Regarding the protein content of the quinoa flour, A. oryzae allowed for a higher increase (34.8%) than R. oligosporus (19.4%) after the end of the SSF. The same tendency was observed in the total nitrogen. The resulting nitrogen-to-protein conversion factors were determined as 4.74 for the QF, 5.16 for the QFA, and 4.59 for the QFR (Table 2). The total fat content was 7.13 g/100 g in the QF, which also rose post-fermentation. That increase particularly affected the saturated fatty acids, stearic acid, and palmitic acid, as well as the oleic acid (monounsaturated fatty acid) and the two essential polyunsaturated fatty acids, linoleic acid and linolenic acid (cf. Appendix A to see the total fatty acid profile). The predominant fatty acid in the quinoa flour was linoleic acid, comprising 50.6% of the total fat, and the least abundant was stearic acid, with a content of only 0.7%. In the QFA and QFR, the values changed to 44.2% and 36.6% for linoleic acid, and 1.8% and 6.7% for stearic acid, respectively. Fermentation with R. oligosporus led to a significant increase in glucose, while maltose concentrations were higher in the QFA. A. oryzae utilised raffinose/stachyose and sucrose for its metabolism, sharply reducing their concentrations by 88.4% (QFA) and 48.8% (QFR). Conversely, a production of 0.51 g of nystose was also observed in the QFA. Digestible starch decreased significantly by 34.5% and 25.7% in the QFA and QFR, respectively, accompanied by a slight increase in resistant starch. Total dietary fibre (TDF) increased notably by 53.6% in the QFR. Insoluble fibres (IDFs) were increased in both fermented products compared to the QF, while high-molecular-weight soluble fibres (SDFPs) were eliminated. Low-molecular-weight soluble fibres (SDFSs) increased, with more pronounced differences observed in the QFA (242.3%). The ash content almost doubled in both the QFA and QFR compared to the QF.

Table 1.
Composition of the control quinoa flour (QF) and the fermented quinoa flour by Aspergillus oryzae (QFA) and by Rhizopus oligosporus (QFR), expressed as g/100 g ± standard deviation on a dry matter basis; n.d. indicates ’not detected’.
Table 2.
Nitrogen-to-protein conversion factor used for the protein solubility calculations.
The nitrogen-to-protein conversion factors for the three ingredients were calculated and are given in Table 2.
3.2. FODMAP Analysis
The total content of FODMAPs is given in Table 3. The analysis showed a significant increase in total FODMAPs when the quinoa flour was fermented with A. oryzae (+680%). This increase is mainly due to the higher amounts of polyols, such as mannitol and arabitol (cf. Appendix B for detailed numbers). The total FODMAPs determined in the QFR were 43% lower compared to the QF, mainly due to a reduction in oligosaccharides (raffinose/stachyose).
Table 3.
FODMAP contents of the control quinoa flour (QF) and fermented quinoa flour by Aspergillus oryzae (QFA) and by Rhizopus oligosporus (QFR), expressed as g/100 g ± standard deviation on a dry matter basis. * EF, excess fructose = glucose–fructose.
3.3. Amino Acid Profile
The profile of total amino acids, the free amino acids, and the percentage based on the 2007 recommendation of the WHO/FAO for adults > 3 yrs [] are presented in Table 4. The total amino acid composition showed that the fermentation with both species increased the levels of most amino acids, with only a loss of isoleucine, tryptophan, arginine, serine, and glycine observed. Histidine and tyrosine were also decreased in the QFA. In terms of essential amino acids, the control flour QF already contained levels well above those recommended by the World Health Organisation [] for optimal nutrition. Therefore, while fermentation reduced the content of some essential amino acids, they were still present in amounts higher than the required quantities. The concentrations of free amino acids are presented in Table 4. The concentrations of all free amino acids increased, except for aspartic acid and glutamic acid in the QFR. In addition, the QFA contained more free amino acids than the QFR.
Table 4.
Complete amino acid profile of the quinoa flour (QF), and the quinoa flour fermented by Aspergillus oryzae (QFA) and by Rhizopus oligosporus (QFR), including the quantification of the total amino acids expressed as g/100 g protein, and free amino acids expressed as g/100 g ingredient (on a dry matter basis) ± standard deviation. In addition, the determination of the daily requirement of each essential amino acid requirements in g/100 g protein as outlined by the WHO (2007).
3.4. Techno-Functional Properties
Techno-functional properties of the control quinoa flour, the quinoa flour fermented with A. oryzae, and the quinoa flour fermented with R. oligosporus are displayed in Table 5.
Table 5.
Techno-functional properties of the control quinoa flour (QF), and the quinoa flour fermented by Aspergillus oryzae (QFA) and by Rhizopus oligosporus (QFR). Values are presented as mean ± standard deviation.
3.4.1. pH and Total Titratable Acids
The pH and TTAs are presented in Table 5. Although the pH of 6.38 for the QF decreased with the fermentation, only the pH of the QFR significantly differed from the QF. However, the TTAs of the ingredients increased significantly by 83.9% (QFA) and 240% (QFR) due to the fermentation.
3.4.2. Sulfhydryl Groups
Exposed, free, and total SH groups are shown in Table 5. The QF showed the highest concentration of exposed, free, and total SH groups, with 11.78 μmol SH/g protein, 12.05 μmol SH/g protein, and 78.56 μmol SH/g protein, respectively. Although there were no significant variations among the three ingredients regarding the total SH groups, the exposed SH groups in the fermented flours displayed similar lower values, ranging from 4.60 to 5.55 μmol SH/g protein. Notably, the concentration of free SH groups was significantly lower in the QFR compared to the QFA.
3.4.3. Water- and Oil-Holding Capacity
Water- and oil-holding capacity values are shown in Table 5. The QF displayed a water-holding capacity (WHC) of 80.79% and an oil-holding capacity (OHC) of 91.90%. Fermentation significantly increased the WHC. The QFA had the highest value with an increase of 24.5%, followed by the QFR, which increased it by 16.3%. The QFA showed an increase of 5.3% in the OHC, while the QFR resulted in a significant reduction of 4.1%.
3.4.4. Foaming Properties
The foaming capacity (FC) and foam stability (FS) are presented in Table 5. The QF showed a FC of 16.33% and a FS of 84.13%. The QFA and QFR displayed lower foaming capacities, with a decrease of 58.4% with A. oryzae and 52.8% with R. oligosporus. The foam stability values showed a reduction of 63.7% (QFA) and 40.6% (QFR) after fermentation.
3.4.5. Minimum Gelling Concentration
The minimum gelling concentration (Table 5) did not show any difference between the QF, QFA, and QFR, with a value of 18 g/100 g determined for all ingredients.
3.4.6. Emulsifying Capacity
The separation rates for the emulsions are given in Table 5. The QF emulsion showed a separation rate of 0.005%/s, while the QFA and QFR emulsions separated faster with a separation rate of 0.019%/s and 0.018%/s, respectively. Transmission profiles are displayed in Figure 1. The higher separation rate is also visible on the graphs, with a more significant increase in light transmission alongside the sample cuvettes for the QFA and QFR and the formation of a cream layer, which is visible on the left side. Significant evidence of sedimentation was visible on the right-hand side of the profiles.
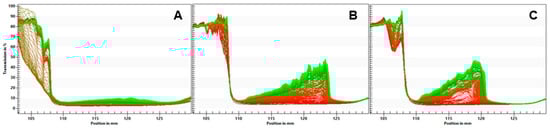
Figure 1.
Light transmission profiles of the QF (A), QFA (B), and QFR (C) emulsions.
3.4.7. Particle Size
The values for D [4,3], D [3,2], Dv (10), Dv (50), and Dv (90) are displayed in Table 5. The QF had the smallest particle size, while the fermented samples showed higher values. The three percentiles (Dv (10), Dv (50), and Dv (90)) also presented higher values for the fermented flours, with no significant difference between the QFA and QFR for the Dv (50) and Dv (90). The Dv (10) values for the QF and QFA were significantly lower than the QFR, suggesting a slightly higher prevalence of smaller particles. Furthermore, the particle size distributions of the QF, QFA, and QFR showed monomodal behaviour (cf. Appendix C).
3.4.8. Colour
L*, a*, and b* results are reported in Table 5. The QF showed values of 84.37 for the L*-value, 1.09 for the a*-value, and 15.93 for the b*-value. Fermentation resulted in a decrease in lightness, especially in the QFR (15.6%) compared to the QFA (8.7%). The QFR also stands out for the a*-value, since the result obtained was 4.37 compared to 2.60 (QFA). As for the b*-value, the fermented samples showed significant differences, with an increase of 64.0% for the QFR and 36.8% for the QFA. Based on these L*a*b* results, the differential colour indexes between the fermented samples and the QF were calculated and can be found in Table 5. The QFR sample showed a more significant colour difference than the QFA sample.
3.4.9. Protein Solubility
Protein solubility at native pH and a pH of 7 is represented in Table 5. The QF showed a protein solubility of 55.68% at a pH of 7 and 48.97% at a native pH. At a native pH, fermentation significantly decreased the protein solubility by reducing the value by 12.8% in the QFA and by 5.8% in the QFR. Adjustment of the pH to 7 resulted in no differences in the protein solubility between the QF and QFA, but a significant reduction between the QF and QFR (30.8%).
3.4.10. Protein Profile
The protein profiles of the raw and fermented quinoa ingredients are shown in Figure 2. Peptides in the QF appear to be predominantly of a low molecular weight, with a prevalence of around ~20 kDa. The QF also displayed some bands at ~25 kDa and ~10 kDa. After the fermentation, those bands representing the main proteins in the QF were still visible, but less pronounced. However, most of the other bands faded with fermentation, particularly for the QFR.
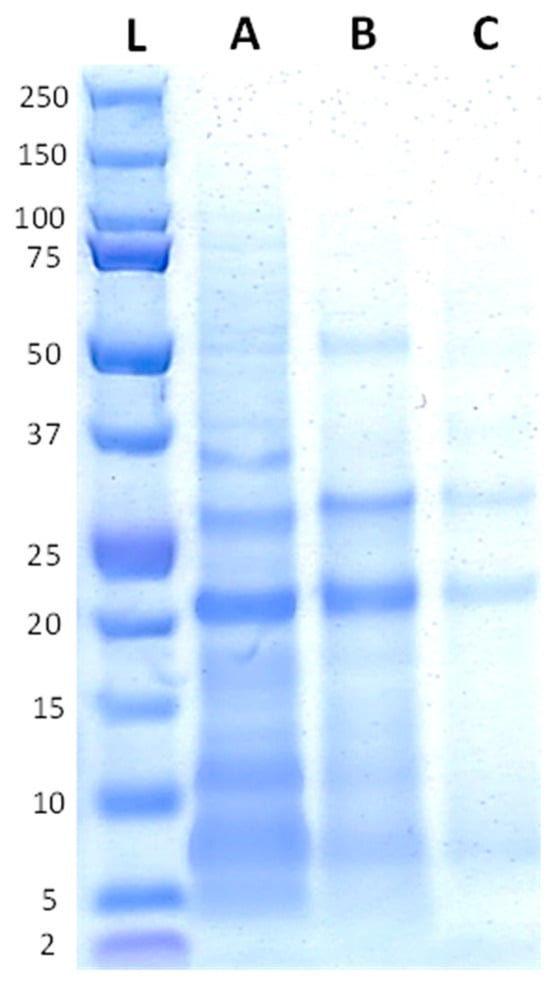
Figure 2.
Protein profiles of the quinoa ingredients with the reference ladder on the first position (L), followed by the QF (A), QFA (B), and QFR (C).
3.5. Antinutrients
The levels of phytic acid, saponins, trypsin inhibitors, chymotrypsin inhibitors, and condensed tannins detected in the raw and fermented ingredients are presented in Table 6. The QF showed a phytic acid content of 0.181 g/100 g. The QFA contained a higher phytic acid concentration with an increase of 13.8%, while the QFR contained less, with a decrease of 8.8%. Saponins in the QF were 0.29 GAE mg/ g, which was higher than in the QFA, where A. oryzae was able to eliminate them, while R. oligosporus increased saponins by 879.3%. The QF contained the highest amounts of trypsin inhibitors and chymotrypsin inhibitors. Trypsin inhibitors in the QFA and QFR were lowered by 33.5% and 31.7%, respectively. However, the QFR was lower in chymotrypsin inhibitors than the QFA. The QF contained 2.29 catechin-equivalent mg/g condensed tannins. Fermentation with A. oryzae eliminated the condensed tannins, and a reduction of 89.1% was detected in the QFR.
Table 6.
Content of the antinutritional compounds in the quinoa flour (QF) and the quinoa flour fermented with Aspergillus oryzae (QFA) and Rhizopus oligosporus (QFR) on a dry matter basis. Values are presented as mean ± standard deviation.
3.6. Olfactometry
The olfactometry analysis detected 104 odour-active compounds (cf. Appendix D, Table A2). Only the significant differences in intensity between the QF and QFA and between the QF and QFR were retained. These significant differences are reflected in Figure 3. Five additional relevant unknown compounds were also detected (cf. Appendix D, Figure A4). All compounds detected by the high-resolution gas chromatography/olfactometry (HRGC/O) were associated with an aroma, some of which were identical. These are displayed in the WordClouds in the appendix section (cf. Appendix D, Figure A3).
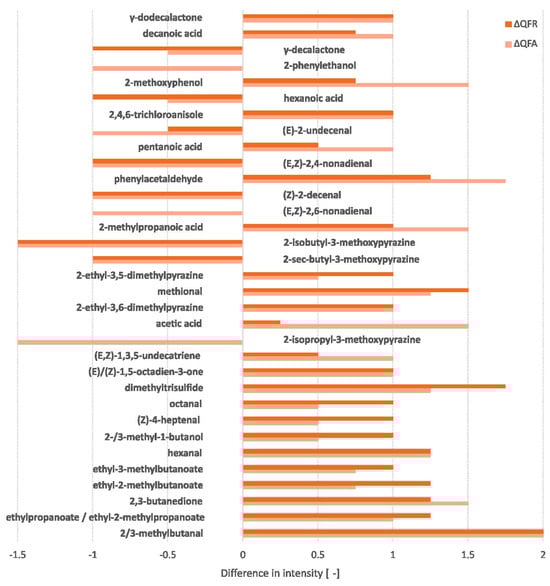
Figure 3.
Differences in aroma intensity during fermentation compared to the quinoa flour based on GC-FID peak area (ΔQFA = QFA − QF and ΔQFR = QFR − QF) of compounds showing a significant difference (minimum of one for at least one of the fermented ingredients).
The QF predominantly contained metoxypyrazine compounds, associated with bell pepper aroma, and 2-phenylethanol, characterised by a honey-like odour. Certain acids, such as hexanoic acid (goat) and acetic acid (vinegar), also showed a strong intensity in the flour. Other aroma-active compounds were also present in this ingredient with a slightly lower intensity, such as γ-decalactone (peach), (E)-2-undecenal (metallic), (E,Z)-2,4-nonadienal (cardboard), (Z)-2-decenal (fatty), (E,Z)-2,6-nonadienal (cucumber), 2-ethyl-3,5-dimethylpyrazine (earthy), 2-methoxyphenol (smoky), 2/3-methylbutanal (malty), methional (boiled potato), and 2-methylpropanoic acid (cheese). The SSF increased the previous compounds associated with vinegar, earthy, smoky, malty, boiled potato, and cheese aromas. In addition, new aroma-active compounds displaying other odours, such as 2,3-butanedione (butter), hexanal (grassy), dimethyltrisulfide (cabbage), and phenylacetaldehyde (honey), were developed at a high intensity. The QFA and QFR evolved towards a predominance of fruity aromas, facilitated by the formation of ester compounds like ethylpropanoate, ethyl-2-methylpropanoate, ethyl-2-methylbutanoate, and ethyl-3-methylbutanoate. Fungal fermentation resulted in a noticeable loss of bell pepper, fatty, and cardboard aromas. The goat-like aroma was also reduced, particularly in the QFR, while the QFA reduced the metallic and cucumber notes to a higher degree.
3.7. Fungal Metabolites
Metabolomic analysis was used to determine of the changes in organic acids during fungal fermentation, which can be seen in Figure 4. Fermentation increased the concentration of all organic acids, except for 4-aminobenzoic acid, which is indicated as a negative value in the bar chart. The QFA showed a greater concentration of lactic acid, 2-oxoglutaric acid, and succinic acid than the QFR. However, the QFR contained more malic acid, citric acid, fumaric acid, and cis-aconitic acid. The total increase in organic acid content in the QFA and QFR compared to the QF was 0.510 g/100 g and 0.637 g/100 g, respectively.
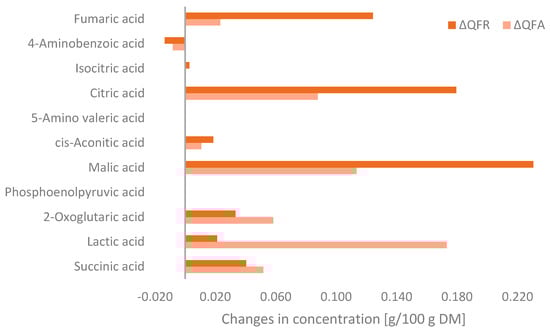
Figure 4.
Changes in organic acid concentrations of the quinoa flour fermented with Aspergillus oryzae (QFA) or Rhizopus oligosporus (QFR) compared to the quinoa flour (QF) (ΔQFA = QFA − QF and ΔQFR= QFR − QF) as detected by MS-Omics and expressed as g/100 g on a dry matter basis.
The ergosterol concentrations of the QFA and QFR were measured after the SSF process and are shown in Table 7. This measurement is used as an indicator of fungal biomass. Based on these values, the QFA showed higher fungal growth compared to the QFR.
Table 7.
Ergosterol concentrations of the quinoa flour fermented with Aspergillus oryzae (QFA) and Rhizopus oligosporus (QFR).
4. Discussion
Quinoa is a pseudocereal known for its appealing nutritional properties, although it also contains many antinutritional substances [,]. Aspergillus oryzae and Rhizopus oligosporus, recognised as food-grade fungi capable of secreting large quantities of enzymes, are promising applications in processes such as solid-state fermentation [,,]. SSF has been shown to improve legumes’ and cereals’ compositional, techno-functional, and sensory characteristics [,,]. For this reason, a characterisation was carried out to investigate the changes in the composition, techno-functionality, aroma profile, and antinutritional factors during the solid-state fermentation of quinoa flour using A. oryzae or R. oligosporus.
Fermentation involves changes in composition due to substrate consumption by the fungi for their growth. The composition of the ingredients showed significant differences between the QF and the two fermented flours, the QFA and QFR. Moisture (Table 1) decreased with fermentation, possibly due to an additional drying step after the fermentation.
The increase in the fat content (Table 1) after the fermentation most likely occurred due to the biosynthesis and bioconversion of fatty acids by the lipogenic capacity of the fungi []. Dietary fats have been the subject of numerous studies to determine the effects on various risk indicators for cardiovascular disease. One widely recognised risk factor is low-density lipoprotein (LDL) cholesterol, which tends to increase with diets rich in saturated and trans-fat []. Although an increase in stearic and palmitic acids (Table 1) (saturated fatty acids) was observed during fermentation, other fatty acids with beneficial effects on health also increased. Oleic acid and polyunsaturated fatty acids (PUFAs) have been reported to reduce cardiovascular risk by lowering blood lipid levels, particularly cholesterol []. In addition, linoleic and linolenic acids (PUFAs) are essential fatty acids that must be provided in the diet []. The results in this study are in agreement with Abu et al. (2000), where the SSF of sweet potato with A. oryzae resulted in linoleic acid being the most abundant fatty acid and palmitic acid the most abundant saturated acid. Moreover, it was also reported that the levels of oleic acid increased with the fermentation []. According to the current results, R. oligosporus showed a better capacity to produce fatty acids than A. oryzae when grown on quinoa flour. However, when comparing these values based on the total fat content, this higher production rate could be detrimental to the QFR by increasing the unsaturated stearic acid content by 6% and decreasing the essential linoleic acid by 14%.
FODMAPs (Table 3) constitute a group of small dietary carbohydrates that cannot be digested in the human intestine, leading to fermentation in the gut. This fermentation process can cause higher fluid and gas production, often resulting in discomfort, such as bloating and abdominal pain. Therefore, a low FODMAP diet might be advised for individuals suffering from irritable bowel syndrome (IBS) []. According to Ispiryan et al. (2020), quinoa is a low-FODMAP ingredient which does not contain fructan, but has low levels of the polyol sorbitol and the oligosaccharides raffinose/stachyose [], corresponding to the results obtained in the current study. Fermentation with A. oryzae significantly increased the total FODMAPs content, and this higher value may characterise this ingredient as high in FODMAPs. The increase is mainly due to the mannitol, which is present at a high intracellular concentration in A. oryzae []. An increase in arabitol also causes the high FODMAP content. Arabitol may have been accumulated in the cells due to the low water activity during the solid-state fermentation []. However, while the QFA contained higher levels of FODMAPs, the products in which it is applied may still be below the low-FODMAP clinical cutoff values per serving of food, depending on the ingredient inclusion level and the other components of the recipe. Besides the undesirable gastrointestinal effects polyols can cause, they play an essential role in the food industry, particularly as sweeteners, flavour enhancers, cooling agents, humectants, and thickeners [].
During their metabolism, filamentous fungi secrete large quantities of enzymes responsible for hydrolysing oligosaccharides and polysaccharides into single sugars []. A significant decrease in digestible starch (Table 1) could indicate degradation by amylolytic enzymes such as α-amylase, β-amylase, or glucoamylase into glucose and maltose [], as the maltose content was found to be negatively correlated with digestible starch (p-value: 0.03, r-value: 0.999). Total starch (Table 1) was degraded to a higher degree in the QFA than in the QFR, but the glucose content was lower. The high glucose content (Table 1) in the QFR is likely due to starch hydrolysis, since R. oligosporus has previously shown high amylase activity []. Once starch and maltose are broken down into glucose, the monosaccharide can be metabolised to pyruvate through the glycolysis pathway and followed by the citrate cycle to provide further energy or conversion to lactic acid [,]. Lactic acid production (Figure 4) was determined to be higher in the QFA than in the QFR, with Thitiprasert et al. (2014) reporting that R. oligosporus generally yields less lactic acid and instead produces ethanol as a by-product []. However, in the current study, R. oligosporus appears to be a higher producer of citric acid, malic acid, and fumaric acid (Figure 4), all of which are intermediates in the TCA cycle. According to Abe et al. (2007), different Rhizopus strains could be divided into the following two groups: lactic acid producers and fumaric–malic acid producers []. As a result of acid production during fungal growth, the pH (Table 5) of the ingredients decreased, and the TTA values (Table 5) increased, significantly more so for the QFR, which can be explained by the higher total acid production.
The nitrogen content and protein content (Table 1) correlated positively (p-value: 0.27, r-value: 0.91) and increased with fermentation. The increase in protein has been observed in several studies involving fungal fermentation [,,], as fungi use the substrate as carbon and energy sources to grow, resulting in the production of fungal protein []. In terms of amino acids (Table 4), arginine significantly decreased during fermentation, probably due to its utilisation by the fungi as a precursor for the synthesis of other amino acids []. Conversely, proline and glutamic acid increased during fermentation. These two amino acids showed a strong negative correlation with arginine (proline: p-value= 0.17, r-value= 0.96; glutamic acid: p-value= 0.34, r-value= 0.86), and, according to Flynn et al. (2002), arginine is an essential precursor of these []. Serine concentrations diminished during fermentation, most likely since it is a precursor of the sulphur amino acids methionine and cysteine [], with the correlation analysis showing a significant negative correlation between serine and methionine/cysteine (methionine; p-value: 0.53, r-value: 0.67; cysteine; p-value: 0.32, r-value: 0.88). Pyruvate from serine may also be responsible for valine biosynthesis via an intermediate compound called 2-oxo isovalerate, which is also a leucine precursor [].
The proteolytic activity caused by fungal fermentation altered the structure of the proteins. The number of polar amino acid side-chains increased following the hydrolysis of peptide bonds by proteases, resulting in a higher water-holding capacity (Table 5) [,]. Proteolytic enzymes also play a role in exposing hydrophobic sites, which results in protein cleavage. These sites allow for the aggregation of proteins into clusters with microcapillaries between them, effectively trapping oil, which increases the oil-holding capacity [,]. Fermentation with A. oryzae has been reported by Kumitch et al. (2020) to increase the OHC [], as was also observed in this study. However, fermentation with R. oligosporus decreased the OHC (Table 5), which could be attributed to fewer exposed hydrophobic groups than hydrophilic groups through proteolytic activity []. Aggregates formed by the exposure of hydrophobic sites are thought to reduce protein solubility []. Moreover, other factors can influence the solubility; notably, during fermentation, different fungi produce different types of components and metabolites that can affect the protein solubility by forming complexes []. These aggregates in the QFA and QFR can be recognised by the particle size, which are approximately twice the size of the QF particles (Table 5). Also, fungal enzymes can break down proteins into smaller peptides and amino acids containing different solubilities []. This can be seen on the SDS page gel (Figure 2), with a higher density of small peptides observed and a lack of visible bands in the higher-molecular-weight range. Solubility is also an essential factor that can affect foaming properties and emulsification. Soluble globular proteins move by diffusion towards the air–water interface, lowering surface tension. However, if these proteins are insoluble, their diffusion at the interface diminishes, leading to increased surface tension and, as demonstrated by Elkhalifa et al. (2005), the absence of foam formation [,]. This explains the reduced foaming capacity (Table 5) of the QFA and QFR. In addition to low solubility, larger particle sizes and a more compact ingredient structure may limit the foaming properties []. The higher fat content (Table 1) of the ingredients can also interfere with the formation and stability of the foam by coating the air bubbles and inhibiting their expansion. The poor foaming stability (Table 5) observed in the QFA and QFR may be attributed to weak protein–protein interactions, which do not allow for the stabilisation of incorporated air by the unfolded protein [,]. The higher emulsion separation rate (Table 5) obtained by the fermentation is likely linked to the lower solubility (Table 5) and larger particle size (Table 5).
Colour changes (Table 5) caused by the fermentation were observed. According to Abdul Manan et al. (2018), these changes could be related to biomass []. The production of spores and mycelium while fungi are consuming nutrients can produce colour, which may darken with progressive fungal growth [,]. The differential colour index (ΔE) (Table 5) displayed a higher value for the QFR, and the ingredient was darker. This is explained by the fact that the spores and mycelium of different species have different colours [,].
During fermentation, the breakdown of antinutrients and macromolecular proteins into smaller proteins, peptides, or free amino acids can improve the bioavailability and quality of nutrients []. It is well known that fermentation reduces antinutritional components, as several studies have shown [,,,]. Although most antinutrient components (Table 6) were reduced by the SSF, phytic acid (Table 6) increased in the QFA. This observation is in contradiction with the study by Sapna and Singh (2014), which demonstrated that A. oryzae is a filamentous fungus capable of secreting a large amount of phytase during solid-state fermentation []. Gull et al. (2013) further demonstrated that different fungi may exhibit distinct preferences for solid substrates to achieve optimal levels of phytase production []. It is therefore possible that quinoa flour is not the most suitable substrate for A. oryzae to secrete phytase enzymes. R. oligosporus appeared to display greater affinity for the substrate regarding phytase production, while saponins (Table 6) were also significantly increased in the QFR. According to Xiao et al. (2014), the rise in saponin levels could result from increased synthesis during fermentation, potentially as a defence mechanism. Indeed, saponin may be correlated with antioxidant properties []. However, due to its distinctive bitter flavour, this substance is generally decreased or eliminated from the outside of the grain in order to enhance the sensory quality and consumer acceptance []. Considering the differences in the antinutrient levels in the QFA and QFR, the use of A. oryzae and R. oligosporus in symbiosis may be an effective way of reducing these compounds, an area which future research could explore.
The analysis of the aroma-active compounds (Figure 3) primarily showed an enhancement in substances contributing to the “fruity” characteristics of the product, attributes which are generally associated with esters, especially acetate esters, formed during fermentation. Valine, leucine, and isoleucine are the free amino acids contributing to the malty and fruity flavours. They are transaminated to α-keto acids, decarboxylated into an aldehyde, and reduced to the fusel alcohols isobutanol, isoamyl acetate, and 2-methylbutanol via the Ehrlich pathway [,]. These compounds then react with acetyl-CoA through the catalysis of alcohol acetyltransferases to form the acetate esters []. Although these free amino acids have an increased concentration after fermentation compared to the QF, hypothetically, even more could be released during the process and used to form aroma compounds. By looking closer at the chemical compounds related to the fruity odours (cf. Appendix D), the intensities seem to be higher in the quinoa flour fermented by R. oligosporus. A study involving the R. oligosporus fermentation of soybean and barley tempeh revealed a similar volatile compound profile. Two of the most abundant volatile compounds produced during the soybean fermentation were 2-methyl-1-butanol and 3-methyl-1-butanol, which are among those that give the QFR and QFA their malty odour, in addition to 2/3-methylbutanal []. Moreover, 2-methyl butanoic acid, 3-methyl butanoic acid, and 2-methyl propanoic acid, which are all attributed to a cheese-like flavour, are also related to the catabolism pathway of isoleucine, leucine, or valine []. Fatty acids are also known to be precursors of flavour formation. Medium-chain fatty acids may be primarily responsible for forming methylketones, which give cheese-associated flavours. Grassy notes can also be obtained via lipoxygenases, which break down polyunsaturated fatty acids such as linolenic acid []. Fermentation seems to be advantageous for the aroma profile of the products, as the aldehydic compounds that give the quinoa metallic or cardboard-like characteristics were (partially) eliminated from the flour. The same applies to methoxypyrazine compounds, which produce a bell pepper-like aroma.
5. Conclusions
Fungal solid-state fermentation can improve plant-based raw ingredients’ nutritional value, aroma profile, and techno-functional properties. This study examined the effect of the solid-state fermentation of quinoa flour using Aspergillus oryzae and Rhizopus oligosporus. Fermentation modified the composition of the quinoa flour through substrate consumption by the fungi, with enzymatic activity resulting in the breakdown of macromolecules (proteins, carbohydrates, and fats) into smaller molecules, including small peptides, free amino acids, simple sugars, and medium-chain fatty acids. Notably, A. oryzae produced elevated levels of lactic acid, while R. oligosporus synthesised higher concentrations of citric, malic, and fumaric acids. Overall, the QFA appeared to have a superior nutritional profile compared to the QFR, demonstrating a higher protein content, increased dietary fibre content, lower fat and sugar levels, and the absence of tannins and saponins, while also showing increased water- and oil-holding capacities, a less pronounced colour change, and a higher protein solubility at a pH of 7. However, the QFR also showed nutritional benefits such as higher levels of essential fatty acids, less phytic acid and chymotrypsin inhibitors, and a significantly lower FODMAP content than the QFA, and could potentially be a promising ingredient in the development of low-FODMAP foods targeted at consumers with IBS or gastrointestinal problems. In summary, the SSF of quinoa flour with A. oryzae or R. oligosporus resulted in the production of ingredients with different nutritional, techno-functional, and aroma characteristics, presenting an opportunity for the application of such ingredients in various food systems, an area which future research should focus on.
Author Contributions
Conceptualisation, A.W.S., E.K.A. and E.Z.; data curation, O.G.; methodology, O.G., A.Z.A.T., C.C., A.K.H. and M.G.T.; visualisation O.G.; writing—original draft preparation, O.G.; writing—review and editing, A.W.S., L.N., E.K.A., A.R., M.G.T., A.Z.A.T., C.C., M.G., A.K.H. and E.Z.; supervision, A.W.S. and E.K.A.; project administration, L.N. and A.R.; resources M.G.; funding acquisition, E.Z. and E.K.A. All authors have read and agreed to the published version of the manuscript.
Funding
This project was funded by the SMART PROTEIN Project, European Union’s Horizon 2020 Research and Innovation Program (No. 862957).
Data Availability Statement
Data are contained within the article.
Acknowledgments
The authors would like to take this opportunity to thank Celia Segura Godoy for her help with the dietary fibre analysis.
Conflicts of Interest
Author Maria Garcia Torreiro was employed by the company Mogu srl. The remaining authors declare that the research was conducted in the absence of any commercial or financial relationships that could be construed as a potential conflict of interest.
Appendix A. Total Fatty Acid Profile
Table A1.
Total fatty acid profile of quinoa flour (QF) and quinoa flour fermented with Aspergillus oryzae (QFA) and Rhizopus oligosporus (QFR), expressed in g/100 g ± standard deviation on a dry matter basis.
Table A1.
Total fatty acid profile of quinoa flour (QF) and quinoa flour fermented with Aspergillus oryzae (QFA) and Rhizopus oligosporus (QFR), expressed in g/100 g ± standard deviation on a dry matter basis.
| Fatty Acid Profile | [g/100 g DM] | ||
|---|---|---|---|
| QF | QFA | QFR | |
| Lauric acid | 0.02 ± 0.00 | 0.00 ± 0.00 | 0.00 ± 0.00 |
| Myristic acid | 0.01 ± 0.00 | 0.03 ± 0.01 | 0.04 ± 0.01 |
| Pentadecanoic acid | 0.00 ± 0.00 | 0.02 ± 0.01 | 0.01 ± 0.00 |
| Palmitic acid | 0.71 ± 0.09 | 1.41 ± 0.18 | 1.58 ± 0.19 |
| Hexadecenoic acid | 0.01 ± 0.00 | 0.06 ± 0.01 | 0.05 ± 0.01 |
| Isoeptadecanoic acid | 0.00 ± 0.00 | 0.01 ± 0.00 | 0.01 ± 0.00 |
| 14-methyl hexadecanoic acid | 0.00 ± 0.00 | 0.01 ± 0.00 | 0.03 ± 0.01 |
| Margaric acid | 0.00 ± 0.00 | 0.02 ± 0.00 | 0.01 ± 0.00 |
| Heptadecenoic acid | 0.00 ± 0.00 | 0.00 ± 0.00 | 0.00 ± 0.00 |
| Stearic acid | 0.05 ± 0.01 | 0.21 ± 0.04 | 0.85 ± 0.11 |
| Oleic acid | 1.44 ± 0.17 | 2.70 ± 0.28 | 3.17 ± 0.32 |
| Linoleic acid | 3.61 ± 0.37 | 5.04 ± 0.47 | 4.65 ± 0.43 |
| Conjugated linoleic acid | 0.00 ± 0.00 | 0.02 ± 0.00 | 0.01 ± 0.00 |
| Linolenic acid | 0.35 ± 0.06 | 0.50 ± 0.07 | 0.56 ± 0.07 |
| Arachidic acid | 0.03 ± 0.01 | 0.04 ± 0.01 | 0.08 ± 0.02 |
| Eicosenoic acid | 0.09 ± 0.02 | 0.10 ± 0.02 | 0.09 ± 0.02 |
| Heneicosylic acid | 0.00 ± 0.00 | 0.01 ± 0.00 | 0.00 ± 0.00 |
| Behenic acid | 0.04 ± 0.01 | 0.05 ± 0.01 | 0.06 ± 0.01 |
| Docosanoic acid | 0.00 ± 0.00 | 0.09 ± 0.02 | 0.06 ± 0.01 |
| Lignoceric acid | 0.00 ± 0.00 | 0.03 ± 0.01 | 0.06 ± 0.01 |
Appendix B. FODMAPs

Figure A1.
Detailed FODMAP contents of quinoa flour (QF) and quinoa flour fermented with Aspergillus oryzae (QFA) and Rhizopus oligosporus (QFR), expressed as g/100 g ± standard deviation on a dry matter basis. Values within a row, followed by different letters, are significantly different (p < 0.05).
Appendix C. Particle Size Distribution

Figure A2.
Particle size distribution for the QF, QFA, and QFR, expressed as volume density [%] as a function of size [μm].
Appendix D. Aroma Profile
Table A2.
Complete aroma profile of quinoa flour (QF) and quinoa flour fermented with Aspergillus oryzae (QFA) and Rhizopus oligosporus (QFR), comprising the compound names, odour quality, and intensities.
Table A2.
Complete aroma profile of quinoa flour (QF) and quinoa flour fermented with Aspergillus oryzae (QFA) and Rhizopus oligosporus (QFR), comprising the compound names, odour quality, and intensities.
| Compound 1 | Odour Quality 2 | RI | Intensity 3,4 | ||
|---|---|---|---|---|---|
| QF | QFA | QFR | |||
| methylpropanal | malty | <900 | n.d. | n.d. | 0.5 |
| 2/3-methylbutanal | malty | 917 | 0.75 | 2.75 | 2.75 |
| ethylpropanoate/ethyl-2-methylpropanoate | fruity | 956 | n.d. | 1 | 1.25 |
| 2,3-butanedione | butter | 983 | n.d. | 1.5 | 1.25 |
| unknown | garlic, onion | 1011 | n.d. | n.d. | 0.5 |
| unknown | fishy, amine, gas | 1029 | 1.25 | n.d. | n.d. |
| ethyl-2-methylbutanoate | fruity | 1043 | n.d. | 0.75 | 1.25 |
| ethyl-3-methylbutanoate | fruity | 1057 | n.d. | 0.75 | 1 |
| hexanal | grassy | 1071 | n.d. | 1.25 | 1.25 |
| 3-methyl-2-buten-1-thiol | beer | 1100 | n.d. | 0.5 | 0.5 |
| ethylpentanoate | fruity | 1129 | n.d. | 0.5 | 0.5 |
| 2-heptanone | fruity | 1171 | n.d. | n.d. | 0.5 |
| methylhexanoate | fruity | 1186 | n.d. | 0.5 | 0.75 |
| 4-methoxy-2-methyl-2-butanethiol | catty | 1197 | n.d. | 0.75 | n.d. |
| 2-/3-methyl-1-butanol | malty | 1208 | n.d. | 0.5 | 1 |
| ethylhexanoate | fruity | 1225 | n.d. | 0.5 | 0.5 |
| (Z)-4-heptenal | fishy | 1235 | n.d. | 0.5 | 1 |
| unknown | citrus, rhubarb | 1268 | n.d. | 0.5 | 1 |
| 3-hydroxy-2-butanone | butter | 1278 | n.d. | n.d. | 0.5 |
| octanal | citrus | 1283 | n.d. | 0.5 | 1 |
| 1-octen-3-one | mushroom | 1295 | 2 | 1.5 | 1.5 |
| 2-acetyl-1-pyrroline | roasty | 1327 | 2 | 2.25 | 2.75 |
| dimethyltrisulfide | cabbage | 1363 | n.d. | 1.25 | 1.75 |
| (E)/(Z)-1,5-octadien-3-one | geranium | 1368 | n.d. | 1 | 1 |
| 4-mercapto-4-methyl-2-pentanone | blackcurrant | 1373 | n.d. | 0.75 | n.d. |
| (E,Z)-1,3,5-undecatriene | fresh | 1388 | n.d. | 1 | 0.5 |
| 2,3,5-trimethylpyrazine | earthy | 1398 | n.d. | n.d. | 0.5 |
| 2-propionyl-1-pyrroline | roasty | 1415 | n.d. | n.d. | 0.75 |
| 2-isopropyl-3-methoxypyrazine | bell pepper | 1423 | 1.5 | n.d. | 1.5 |
| acetic acid | vinegar | 1428 | 1.5 | 3 | 1.75 |
| 2-ethyl-3,6-dimethylpyrazine | earthy | 1435 | n.d. | 1 | 1 |
| methional | boiled potato | 1445 | 0.5 | 1.75 | 2 |
| 2-ethyl-3,5-dimethylpyrazine | earthy | 1453 | 1 | 1.5 | 2 |
| unknown | paint, glue | 1460 | n.d. | 1 | 1 |
| 2,3-diethyl-5-methylpyrazine | earthy | 1480 | 0.75 | n.d. | 1.5 |
| 2-sec-butyl-3-methoxypyrazine | bell pepper | 1490 | 1 | n.d. | n.d. |
| (Z)-2-nonenal | fatty | 1498 | 0.5 | n.d. | 1 |
| 2-isobutyl-3-methoxypyrazine | bell pepper | 1515 | 1.5 | n.d. | n.d. |
| (E)-2-nonenal | cardboard | 1523 | 1 | 0.75 | 1.25 |
| linalool | floral | 1538 | 0.5 | n.d. | n.d. |
| 2-methylpropanoic acid | cheese | 1556 | 0.5 | 2 | 1.5 |
| (E,Z)-2,6-nonadienal | cucumber | 1572 | 1 | n.d. | 1 |
| 2-acetylpyridine | roasty | 1574 | 0.5 | 0.5 | 0.5 |
| (Z)-2-decenal | fatty | 1603 | 1 | n.d. | n.d. |
| benzylmercaptane | cress | 1614 | n.d. | 0.75 | 0.75 |
| butanoic acid | cheese | 1616 | 1.5 | 0.75 | 2 |
| unknown | metallic | 1630 | 1.5 | n.d. | n.d. |
| phenylacetaldehyde | honey | 1632 | n.d. | 1.75 | 1.25 |
| (E,Z)-2,4-nonadienal | cardboard | 1646 | 1 | n.d. | n.d. |
| 2-methyl-3-(methyldithio)furan | meaty | 1654 | 1 | 0.75 | 1 |
| 2-/3-methylbutanoic acid | cheese | 1657 | 1.25 | 1.75 | 2 |
| (E,E)-2,4-nonadienal | fatty | 1695 | 1.25 | 1.25 | 1.25 |
| 3-methyl-2,4-nonandione | floral | 1708 | 0.5 | 0.5 | n.d. |
| dimethyltetrasulfide | cabbage | 1722 | 1.5 | 1 | 1 |
| unknown | onion, gravy, meaty | 1733 | 0.5 | 0.5 | 0.5 |
| pentanoic acid | cheese | 1736 | n.d. | 1 | 0.5 |
| (E)-2-undecenal | metallic | 1739 | 1 | n.d. | 0.5 |
| 2-acetyl-2-thiazoline | roasty | 1747 | 0.5 | 0.75 | 1 |
| ethyl-2-phenylacetate | honey, floral | 1756 | 0.5 | n.d. | 0.5 |
| (E,Z)-2,6-nonadienol | cucumber | 1761 | 0.75 | n.d. | n.d. |
| unknown | mouldy | 1764 | n.d. | n.d. | 1.5 |
| 2,4,6-trichloroanisole | mouldy | 1794 | n.d. | 1 | 1 |
| (E,E)-2,4-decadienal | fatty | 1797 | 1 | 1.5 | 1 |
| (E)-β-damascenone/(E)-β-damascone | apple | 1806 | n.d. | n.d. | 0.5 |
| geosmin | earthy | 1809 | 0.5 | 0.5 | 1 |
| 2-hydroxy-3-methyl-2-cyclopenten-1-one | seasoning | 1824 | n.d. | n.d. | 0.5 |
| 3-mercapto-1-hexanol | rhubarb | 1835 | 1 | 0.5 | 0.5 |
| hexanoic acid | goat | 1838 | 2 | 1.5 | 1 |
| geraniol | rose | 1841 | n.d. | n.d. | 0.5 |
| 2-methoxyphenol | smoky | 1850 | 0.75 | 2.25 | 1.5 |
| (E,E,Z)-2,4,6-nonatrienal | oatflakes | 1868 | 1 | 1 | 1 |
| 2-phenylethanol | honey | 1903 | 1.5 | 0.5 | 1.5 |
| β-ionone | violet | 1918 | 0.5 | 0.5 | n.d. |
| 3-/5-methyl-2-methoxyphenol | smoky | 1930 | 0.5 | n.d. | n.d. |
| heptanoic acid | goat | 1942 | 0.5 | 0.5 | n.d. |
| maltol | caramel | 1961 | 0.5 | 0.5 | 0.5 |
| unknown | citrus, rhubarb | 1988 | n.d. | n.d. | 0.5 |
| trans-4,5-epoxy-(E)-2-decenal | metallic | 1997 | 2 | 2.25 | 1.75 |
| γ-nonalactone | peach | 2016 | 1 | 1 | 1 |
| 4-ethyl-2-methoxyphenol | smoky | 2019 | 0.5 | n.d. | n.d. |
| furaneol | caramel | 2023 | 1 | 1.25 | 1 |
| octanoic acid | sour | 2039 | 0.75 | 1 | n.d. |
| γ-(Z)-2-nonenolactone | coconut | 2065 | n.d. | 0.5 | 0.5 |
| unknown | cardboard | 2068 | 1 | n.d. | n.d. |
| 4-methylphenol | phenolic | 2071 | 1 | 1 | 1 |
| 3-methylphenol | phenolic | 2084 | 0.5 | 0.5 | 0.5 |
| γ-decalactone | peach | 2133 | 1 | 0.5 | n.d. |
| unknown | perfume | 2140 | 0.5 | 0.5 | 0.5 |
| eugenol | clove | 2153 | 1.25 | 1 | 0.75 |
| 3-/4-ethylphenol | phenolic | 2173 | 0.5 | n.d. | 0.5 |
| 2-methoxy-4-vinylphenol | clove | 2183 | 1 | 1 | 0.75 |
| sotolon | seasoning | 2190 | 1.75 | 1.5 | 1.5 |
| 2-aminoacetophenone | foxy | 2214 | 1.5 | 1.5 | 1.5 |
| decanoic acid | soapy | 2241 | n.d. | 1 | 0.75 |
| 3-/4-propylphenol | phenolic, smoky | 2259 | n.d. | 0.5 | n.d. |
| anise alcohol | hay | 2290 | 0.5 | n.d. | n.d. |
| unknown | wax | 2332 | 0.5 | n.d. | n.d. |
| isoeugenol | ham | 2339 | n.d. | 0.5 | n.d. |
| γ-dodecalactone | peach | 2379 | n.d. | 1 | 1 |
| coumarine | woodruff | 2444 | 0.5 | 0.75 | 0.5 |
| 3-methylindole | faecal | 2481 | 0.5 | 0.5 | 0.5 |
| phenylacetic acid | honey | 2546 | 1.5 | 1.75 | 1.5 |
| vanillin | vanilla | 2558 | 1.25 | 1 | 1 |
| phenylpropanoic acid | goat | >2600 | 0.5 | 0.5 | 0.5 |
1 Compounds were identified based on their linear retention indices, odour qualities, and odour thresholds, as perceived at the sniffing port; 2 Linear retention index; 3 Intensity: 0 = not detectable, 1 = weakly detectable, 2 = unequivocally detectable, 3 = intensely detectable; steps of 0.5 are possible; 4 n.d. = not determined.

Figure A3.
WordClouds for the QF (A), QFA (B), and QFR (C) based on the aroma detected by olfactometry. Larger font sizes indicate the predominance of aromas associated with the compounds.

Figure A4.
Differences in aroma intensity during fermentation compared to the quinoa flour (ΔQFA = QFA − QF and ΔQFR = QFR − QF) for the unknown compounds having a significant difference (minimum of one for at least one of the fermented ingredients).
References
- Ogungbenle, H.N. Nutritional evaluation and functional properties of quinoa (Chenopodium quinoa) flour. Int. J. Food Sci. Nutr. 2003, 54, 153–158. [Google Scholar] [CrossRef]
- Abugoch, L.; Castro, E.; Tapia, C.; Añón, M.C.; Gajardo, P.; Villarroel, A. Stability of quinoa flour proteins (Chenopodium quinoa Willd.) during storage. Int. J. Food Sci. Technol. 2009, 44, 2013–2020. [Google Scholar] [CrossRef]
- Mota, C.; Santos, M.; Mauro, R.; Samman, N.; Matos, A.S.; Torres, D.; Castanheira, I. Protein content and amino acids profile of pseudocereals. Food Chem. 2016, 193, 55–61. [Google Scholar] [CrossRef]
- Wang, S.; Zhu, F. Formulation and Quality Attributes of Quinoa Food Products. Food Bioprocess Technol. 2016, 9, 49–68. [Google Scholar] [CrossRef]
- Kaur, H.; Shams, R.; Dash, K.K.; Dar, A.H. A comprehensive review of pseudo-cereals: Nutritional profile, phytochemicals constituents and potential health promoting benefits. Appl. Food Res. 2023, 3, 100351. [Google Scholar] [CrossRef]
- Contreras-Jiménez, B.; Torres-Vargas, O.L.; Rodríguez-García, M.E. Physicochemical characterization of quinoa (Chenopodium quinoa) flour and isolated starch. Food Chem. 2019, 298, 124982. [Google Scholar] [CrossRef]
- Abugoch James, L.E. Chapter 1 Quinoa (Chenopodium quinoa Willd.). In Advances in Food and Nutrition Research; Elsevier: Amsterdam, The Netherlands, 2009; Volume 58, pp. 1–31. [Google Scholar] [CrossRef]
- Agregán, R.; Guzel, N.; Guzel, M.; Bangar, S.P.; Zengin, G.; Kumar, M.; Lorenzo, J.M. The Effects of Processing Technologies on Nutritional and Anti-nutritional Properties of Pseudocereals and Minor Cereal. Food Bioprocess Technol. 2023, 16, 961–986. [Google Scholar] [CrossRef]
- Wang, J.; Huang, Z.; Jiang, Q.; Roubík, H.; Xu, Q.; Gharsallaoui, A.; Cai, M.; Yang, K.; Sun, P. Fungal solid-state fermentation of crops and their by-products to obtain protein resources: The next frontier of food industry. Trends Food Sci. Technol. 2023, 138, 628–644. [Google Scholar] [CrossRef]
- Chilakamarry, C.R.; Mimi Sakinah, A.M.; Zularisam, A.W.; Sirohi, R.; Khilji, I.A.; Ahmad, N.; Pandey, A. Advances in solid-state fermentation for bioconversion of agricultural wastes to value-added products: Opportunities and challenges. Bioresour. Technol. 2022, 343, 126065. [Google Scholar] [CrossRef]
- Pandey, A. Solid-state fermentation. Biochem. Eng. J. 2003, 13, 81–84. [Google Scholar] [CrossRef]
- Dutta, R.; Ghosal, S.; Bhattacharyya, D.K.; Bhowal, J. Effect of Fungal Fermentation on Enhancement of Nutritional Value and Antioxidant Activity of Defatted Oilseed Meals. Appl. Biochem. Biotechnol. 2023, 195, 2172–2195. [Google Scholar] [CrossRef]
- Kumitch, H.M.; Stone, A.K.; Nickerson, M.T.; Korber, D.R.; Tanaka, T. Effect of fermentation time on the physicochemical and functional properties of pea protein-enriched flour fermented by Aspergillus oryzae and Aspergillus niger. Cereal Chem. 2020, 97, 416–428. [Google Scholar] [CrossRef]
- Zhang, Y.; Wei, R.; Azi, F.; Jiao, L.; Wang, H.; He, T.; Liu, X.; Wang, R.; Lu, B. Solid-state fermentation with Rhizopus oligosporus RT-3 enhanced the nutritional properties of soybeans. Front. Nutr. 2022, 9, 972860. [Google Scholar] [CrossRef]
- Daba, G.M.; Mostafa, F.A.; Elkhateeb, W.A. The ancient koji mold (Aspergillus oryzae) as a modern biotechnological tool. Bioresour. Bioprocess. 2021, 8, 52. [Google Scholar] [CrossRef]
- Chancharoonpong, C.; Hsieh, P.-C.; Sheu, S.-C. Enzyme Production and Growth of Aspergillus oryzae S. on Soybean Koji Fermentation. APCBEE Procedia 2012, 2, 57–61. [Google Scholar] [CrossRef]
- Mei Feng, X.; Ostenfeld Larsen, T.; Schnürer, J. Production of volatile compounds by Rhizopus oligosporus during soybean and barley tempeh fermentation. Int. J. Food Microbiol. 2007, 113, 133–141. [Google Scholar] [CrossRef]
- Erkan, S.B.; Gürler, H.N.; Bilgin, D.G.; Germec, M.; Turhan, I. Production and characterization of tempehs from different sources of legume by Rhizopus oligosporus. LWT 2020, 119, 108880. [Google Scholar] [CrossRef]
- Sabu, A.; Sarita, S.; Pandey, A.; Bogar, B.; Szakacs, G.; Soccol, C.R. Solid-state fermentation for production of phytase by Rhizopus oligosporus. Appl. Biochem. Biotechnol. 2002, 102, 251–260. [Google Scholar] [CrossRef]
- Xiao, Y.; Xing, G.; Rui, X.; Li, W.; Chen, X.; Jiang, M.; Dong, M. Effect of solid-state fermentation with Cordyceps militaris SN-18 on physicochemical and functional properties of chickpea (Cicer arietinum L.) flour. LWT—Food Sci. Technol. 2015, 63, 1317–1324. [Google Scholar] [CrossRef]
- Chutrtong, J.; Bussabun, T. Preparation of Tempeh Spore Powder by Freeze Drying. 2014. Available online: https://www.semanticscholar.org/paper/Preparation-of-Tempeh-Spore-Powder-by-Freeze-Drying-Chutrtong-Bussabun/d005eb602656d8e9859575d488fb2322c3f7cedc (accessed on 12 March 2024).
- Kim, A.-J.; Choi, J.-N.; Kim, J.; Kim, H.Y.; Park, S.-B.; Yeo, S.-H.; Choi, J.-H.; Liu, K.-H.; Lee, C.H. Metabolite profiling and bioactivity of rice koji fermented by Aspergillus strains. J. Microbiol. Biotechnol. 2012, 22, 100–106. [Google Scholar] [CrossRef] [PubMed]
- AACC International. AACC 44-16.01 Moisture—Air-Oven (Aluminum-Plate) Method; AACC International: St Paul, MN, USA, 1999. [Google Scholar]
- ISO 8968-1:2014/IDF 20-1; Milk, Determination of Nitrogen Content—Part 1: Kjeldahl Method. International Organization for Standardization: Geneva, Switzerland, 2001.
- Istituto Superiore di Sanità. RAPPORTI ISTISAN 1996/34 PAG 13—Determination by Titrimetry of the Total Nitrogen Content in foods for Human Consumption; Istituto Superiore di Sanità: Rome, Italy, 1996. [Google Scholar]
- Ministry of Agriculture and Forests. DM 21/04/1986—Determination by Titrimetry of the Total Nitrogen Content in Cheese, Melted Cheese and Ricotta Cheese; Ministry of Agriculture and Forests: Rome, Italy, 1986.
- Commission Regulation. REG CE 152/2009—Determination by Titrimetry of Raw Proteins in Feedstuff; Commission Regulation: 2009. Available online: https://eur-lex.europa.eu/legal-content/EN/ALL/?uri=CELEX%3A32009R0152 (accessed on 11 July 2024).
- Mosse, J. Nitrogen-to-protein conversion factor for ten cereals and six legumes or oilseeds. A reappraisal of its definition and determination. Variation according to species and to seed protein content. J. Agric. Food Chem. 1990, 38, 18–24. [Google Scholar] [CrossRef]
- ISO 16958:2015/IDF 231:2015; Milk, Milk Products, Infant Formula and Adult Nutritionals—Determination of Fatty Acids Composition—Capillary Gas Chromatographic Method. International Organization for Standardization: Geneva, Switzerland, 2015.
- Ispiryan, L.; Heitmann, M.; Hoehnel, A.; Zannini, E.; Arendt, E.K. Optimization and Validation of an HPAEC-PAD Method for the Quantification of FODMAPs in Cereals and Cereal-Based Products. J. Agric. Food Chem. 2019, 67, 4384–4392. [Google Scholar] [CrossRef] [PubMed]
- AOAC International Publisher. AOAC Method 923.03—Determination of Ash in Flour by Gravimetry; AOAC International Publisher: Rockville, MD, USA, 2005. [Google Scholar]
- Ahlborn, J.; Stephan, A.; Meckel, T.; Maheshwari, G.; Rühl, M.; Zorn, H. Upcycling of food industry side streams by basidiomycetes for production of a vegan protein source. Int. J. Recycl. Org. Waste Agric. 2019, 8, 447–455. [Google Scholar] [CrossRef]
- Smart, K.F.; Aggio, R.B.M.; Van Houtte, J.R.; Villas-Bôas, S.G. Analytical platform for metabolome analysis of microbial cells using methyl chloroformate derivatization followed by gas chromatography–mass spectrometry. Nat. Protoc. 2010, 5, 1709–1729. [Google Scholar] [CrossRef] [PubMed]
- Johnsen, L.G.; Skou, P.B.; Khakimov, B.; Bro, R. Gas chromatography—Mass spectrometry data processing made easy. J. Chromatogr. A 2017, 1503, 57–64. [Google Scholar] [CrossRef] [PubMed]
- AACC International. AACC 46-12.01 Crude Protein—Kjeldahl Method, Boric Acid Modification; AACC International: St Paul, MN, USA, 2011. [Google Scholar]
- Jaeger, A.; Sahin, A.W.; Nyhan, L.; Zannini, E.; Arendt, E.K. Functional Properties of Brewer’s Spent Grain Protein Isolate: The Missing Piece in the Plant Protein Portfolio. Foods 2023, 12, 798. [Google Scholar] [CrossRef]
- Vogelsang-O’Dwyer, M.; Bez, J.; Petersen, I.L.; Joehnke, M.S.; Detzel, A.; Busch, M.; Krueger, M.; Ispiryan, L.; O’Mahony, J.A.; Arendt, E.K.; et al. Techno-Functional, Nutritional and Environmental Performance of Protein Isolates from Blue Lupin and White Lupin. Foods 2020, 9, 230. [Google Scholar] [CrossRef] [PubMed]
- Lai, L.-R.; Hsieh, S.-C.; Huang, H.-Y.; Chou, C.-C. Effect of lactic fermentation on the total phenolic, saponin and phytic acid contents as well as anti-colon cancer cell proliferation activity of soymilk. J. Biosci. Bioeng. 2013, 115, 552–556. [Google Scholar] [CrossRef]
- Krause, M.; Sørensen, J.; Petersen, I.; Duque-Estrada, P.; Cappello, C.; Tlais, A.Z.A.; Di Cagno, R.; Ispiryan, L.; Sahin, A.; Arendt, E.; et al. Associating Compositional, Nutritional and Techno-Functional Characteristics of Faba Bean (Vicia faba L.) Protein Isolates and Their Production Side-Streams with Potential Food Applications. Foods 2023, 12, 919. [Google Scholar] [CrossRef]
- Liu, K.; Seegers, S.; Cao, W.; Wanasundara, J.; Chen, J.; Da Silva, A.E.; Ross, K.; Franco, A.L.; Vrijenhoek, T.; Bhowmik, P.; et al. An International Collaborative Study on Trypsin Inhibitor Assay for Legumes, Cereals, and Related Products. J. Am. Oil Chem. Soc. 2021, 98, 375–390. [Google Scholar] [CrossRef]
- Alonso, R.; Aguirre, A.; Marzo, F. Effects of extrusion and traditional processing methods on antinutrients and in vitro digestibility of protein and starch in faba and kidney beans. Food Chem. 2000, 68, 159–165. [Google Scholar] [CrossRef]
- Schmitt, R.; Cappi, M.; Pollner, G.; Greger, V. Key Aroma Compounds in Lippia dulcis (Dushi Button). J. Agric. Food Chem. 2018, 66, 2410–2413. [Google Scholar] [CrossRef]
- Bickel Haase, T.; Klis, V.; Hammer, A.K.; Pinto Lopez, C.; Verheyen, C.; Naumann-Gola, S.; Zorn, H. Fermentation of cocoa pod husks with Pleurotus salmoneo-stramineus for food applications. Food Sci. Nutr. 2024, 12, 2551–2566. [Google Scholar] [CrossRef] [PubMed]
- Joint WHO/FAO/UNU Expert Consultation. Protein and Amino Acid Requirements in Human Nutrition; World Health Organanisation Technical Report Series; Joint WHO/FAO/UNU Expert Consultation: Rome, Italy, 2007; pp. 1–265. [Google Scholar]
- Wang, R.; Chau Sing Law, R.; Webb, C. Protease production and conidiation by Aspergillus oryzae in flour fermentation. Process Biochem. 2005, 40, 217–227. [Google Scholar] [CrossRef]
- Abu, O.A.; Tewe, O.O.; Losel, D.M.; Onifade, A.A. Changes in lipid, fatty acids and protein composition of sweet potato (Ipomoea batatas) after solid-state fungal fermentation. Bioresour. Technol. 2000, 72, 189–192. [Google Scholar] [CrossRef]
- van Rooijen, M.A.; Mensink, R.P. Palmitic Acid Versus Stearic Acid: Effects of Interesterification and Intakes on Cardiometabolic Risk Markers—A Systematic Review. Nutrients 2020, 12, 615. [Google Scholar] [CrossRef]
- Lopez-Huertas, E. Health effects of oleic acid and long chain omega-3 fatty acids (EPA and DHA) enriched milks. A review of intervention studies. Pharmacol. Res. 2010, 61, 200–207. [Google Scholar] [CrossRef]
- Das, U. Essential Fatty Acids—A Review. Curr. Pharm. Biotechnol. 2006, 7, 467–482. [Google Scholar] [CrossRef]
- Ispiryan, L.; Zannini, E.; Arendt, E.K. Characterization of the FODMAP-profile in cereal-product ingredients. J. Cereal Sci. 2020, 92, 102916. [Google Scholar] [CrossRef]
- Ruijter, G.J.G.; Visser, J.; Rinzema, A. Polyol accumulation by Aspergillus oryzae at low water activity in solid-state fermentation. Microbiology 2004, 150, 1095–1101. [Google Scholar] [CrossRef]
- Rice, T.; Zannini, E.; Arendt, E.K.; Coffey, A. A review of polyols—Biotechnological production, food applications, regulation, labeling and health effects. Crit. Rev. Food Sci. Nutr. 2020, 60, 2034–2051. [Google Scholar] [CrossRef]
- Wang, B.-T.; Hu, S.; Yu, X.-Y.; Jin, L.; Zhu, Y.-J.; Jin, F.-J. Studies of Cellulose and Starch Utilization and the Regulatory Mechanisms of Related Enzymes in Fungi. Polymers 2020, 12, 530. [Google Scholar] [CrossRef] [PubMed]
- Ning, Y.-N.; Tian, D.; Tan, M.-L.; Luo, X.-M.; Zhao, S.; Feng, J.-X. Regulation of fungal raw-starch-degrading enzyme production depends on transcription factor phosphorylation and recruitment of the Mediator complex. Commun. Biol. 2023, 6, 1032. [Google Scholar] [CrossRef]
- Anigboro, A.; Aganbi, E.; Tonukari, N. Solid State Fermentation of Maize (Zea mays) Offal by Rhizopus oligosporus under Acidic and Basic Conditions. J. Sci. Res. 2020, 12, 751–756. [Google Scholar] [CrossRef]
- Wakai, S.; Yoshie, T.; Asai-Nakashima, N.; Yamada, R.; Ogino, C.; Tsutsumi, H.; Hata, Y.; Kondo, A. l-lactic acid production from starch by simultaneous saccharification and fermentation in a genetically engineered Aspergillus oryzae pure culture. Bioresour. Technol. 2014, 173, 376–383. [Google Scholar] [CrossRef]
- Thitiprasert, S.; Songserm, P.; Boonkong, W.; Sooksai, S.; Kodama, K.; Thongchul, N. Manipulating Pyruvate Decarboxylase by Addition of Enzyme Regulators during Fermentation of Rhizopus oryzae to Enhance Lactic Acid Production. Appl. Biochem. Biotechnol. 2014, 174, 1795–1809. [Google Scholar] [CrossRef] [PubMed]
- Abe, A.; Oda, Y.; Asano, K.; Sone, T. Rhizopus delemar is the proper name for Rhizopus oryzae fumaric-malic acid producers. Mycologia 2007, 99, 714–722. [Google Scholar] [CrossRef] [PubMed]
- Stodolak, B.; Starzyńska-Janiszewska, A.; Wywrocka-Gurgul, A.; Wikiera, A. Solid-State Fermented Flaxseed Oil Cake of Improved Antioxidant Capacity as Potential Food Additive: Solid-State Fermented Flaxseed Oil Cake. J. Food Process. Preserv. 2017, 41, e12855. [Google Scholar] [CrossRef]
- Wang, H.L.; Ruttle, D.I.; Hesseltine, C.W. Protein Quality of Wheat and Soybeans after Rhizopus oligosporus Fermentation. J. Nutr. 1968, 96, 109–114. [Google Scholar] [CrossRef]
- Olukomaiya, O.O.; Adiamo, O.Q.; Fernando, W.C.; Mereddy, R.; Li, X.; Sultanbawa, Y. Effect of solid-state fermentation on proximate composition, anti-nutritional factor, microbiological and functional properties of lupin flour. Food Chem. 2020, 315, 126238. [Google Scholar] [CrossRef]
- Kasprowicz-Potocka, M.; Borowczyk, P.; Zaworska, A.; Nowak, W.; Frankiewicz, A.; Gulewicz, P. The Effect of Dry Yeast Fermentation on Chemical Composition and Protein Value of Blue Lupin Seeds. Food Technol. Biotechnol. 2016, 54, 360–366. [Google Scholar] [CrossRef]
- Flynn, N.E.; Meininger, C.J.; Haynes, T.E.; Wu, G. The metabolic basis of arginine nutrition and pharmacotherapy. Biomed. Pharmacother. 2002, 56, 427–438. [Google Scholar] [CrossRef] [PubMed]
- KEGG PATHWAY: Biosynthesis of Amino Acids—Reference Pathway. Available online: https://www.genome.jp/kegg-bin/show_pathway?category=Fungi&mapno=01230 (accessed on 6 March 2024).
- Yang, K.; Wang, L.; Guo, J.; Wu, D.; Wang, X.; Wu, M.; Feng, X.; Ma, J.; Zhang, Y.; Sun, W. Structural changes induced by direct current magnetic field improve water holding capacity of pork myofibrillar protein gels. Food Chem. 2021, 345, 128849. [Google Scholar] [CrossRef] [PubMed]
- Oloyede, O.O.; James, S.; Ocheme, O.B.; Chinma, C.E.; Akpa, V.E. Effects of fermentation time on the functional and pasting properties of defatted Moringa oleifera seed flour. Food Sci. Nutr. 2016, 4, 89–95. [Google Scholar] [CrossRef]
- Zayas, J.F. Solubility of Proteins. In Functionality of Proteins in Food; Springer: Berlin/Heidelberg, Germany, 1997; pp. 6–75. [Google Scholar] [CrossRef]
- Grossmann, L.; McClements, D.J. Current insights into protein solubility: A review of its importance for alternative proteins. Food Hydrocoll. 2023, 137, 108416. [Google Scholar] [CrossRef]
- Elkhalifa, A.E.O.; Schiffler, B.; Bernhardt, R. Effect of fermentation on the functional properties of sorghum flour. Food Chem. 2005, 92, 1–5. [Google Scholar] [CrossRef]
- Zayas, J.F. Foaming Properties of Proteins. In Functionality of Proteins in Food; Springer: Berlin/Heidelberg, Germany, 1997; pp. 260–309. [Google Scholar] [CrossRef]
- Abdul Manan, M.; Webb, C. Estimating fungal growth in submerged fermentation in the presence of solid particles based on colour development. Biotechnol. Biotechnol. Equip. 2018, 32, 618–627. [Google Scholar] [CrossRef]
- Manan, M.A.; Webb, C. Estimation of growth in solid state fermentation: A review. Malays. J. Microbiol. 2018, 14, 61–69. [Google Scholar]
- Jørgensen, T.R.; Park, J.; Arentshorst, M.; van Welzen, A.M.; Lamers, G.; vanKuyk, P.A.; Damveld, R.A.; van den Hondel, C.A.M.; Nielsen, K.F.; Frisvad, J.C.; et al. The molecular and genetic basis of conidial pigmentation in Aspergillus niger. Fungal Genet. Biol. 2011, 48, 544–553. [Google Scholar] [CrossRef]
- Cartabia, M.; Girometta, C.E.; Milanese, C.; Baiguera, R.M.; Buratti, S.; Branciforti, D.S.; Vadivel, D.; Girella, A.; Babbini, S.; Savino, E.; et al. Collection and Characterization of Wood Decay Fungal Strains for Developing Pure Mycelium Mats. J. Fungi 2021, 7, 1008. [Google Scholar] [CrossRef]
- Sharath, B.S.; Mohankumar, B.V.; Somashekar, D. Bio-detoxification of Phorbol Esters and Other Anti-nutrients of Jatropha curcas Seed Cake by Fungal Cultures Using Solid-State Fermentation. Appl. Biochem. Biotechnol. 2014, 172, 2747–2757. [Google Scholar] [CrossRef]
- Arbab Sakandar, H.; Chen, Y.; Peng, C.; Chen, X.; Imran, M.; Zhang, H. Impact of Fermentation on Antinutritional Factors and Protein Degradation of Legume Seeds: A Review. Food Rev. Int. 2023, 39, 1227–1249. [Google Scholar] [CrossRef]
- Rai, A.K.; Anu Appaiah, K.A. Bioactive Compounds in Fermented Foods: Health Aspects; CRC Press: Boca Raton, FL, USA, 2021. [Google Scholar]
- Sapna; Singh, B. Phytase Production by Aspergillus oryzae in Solid-State Fermentation and its Applicability in Dephytinization of Wheat Ban. Appl. Biochem. Biotechnol. 2014, 173, 1885–1895. [Google Scholar] [CrossRef]
- Gull, I.; Hameed, A.; Aslam, M.; Athar, M. Optimization of phytase production in solid state fermentation by different fungi. Afr. J. Microbiol. Res. 2013, 7, 5207–5212. [Google Scholar] [CrossRef]
- Xiao, Y.; Xing, G.; Rui, X.; Li, W.; Chen, X.; Jiang, M.; Dong, M. Enhancement of the antioxidant capacity of chickpeas by solid state fermentation with Cordyceps militaris SN-18. J. Funct. Foods 2014, 10, 210–222. [Google Scholar] [CrossRef]
- Procopio, S.; Krause, D.; Hofmann, T.; Becker, T. Significant amino acids in aroma compound profiling during yeast fermentation analyzed by PLS regression. LWT—Food Sci. Technol. 2013, 51, 423–432. [Google Scholar] [CrossRef]
- Hazelwood, L.A.; Daran, J.-M.; van Maris, A.J.A.; Pronk, J.T.; Dickinson, J.R. The Ehrlich Pathway for Fusel Alcohol Production: A Century of Research on Saccharomyces cerevisiae Metabolism. Appl. Environ. Microbiol. 2008, 74, 2259–2266. [Google Scholar] [CrossRef] [PubMed]
- Vandamme, E.J. Bioflavours and fragrances via fungi and their enzymes. Fungal Divers. 2003, 13, 153–166. [Google Scholar]
- Zhang, Y.; Fraatz, M.A.; Müller, J.; Schmitz, H.-J.; Birk, F.; Schrenk, D.; Zorn, H. Aroma Characterization and Safety Assessment of a Beverage Fermented by Trametes versicolor. J. Agric. Food Chem. 2015, 63, 6915–6921. [Google Scholar] [CrossRef]
Disclaimer/Publisher’s Note: The statements, opinions and data contained in all publications are solely those of the individual author(s) and contributor(s) and not of MDPI and/or the editor(s). MDPI and/or the editor(s) disclaim responsibility for any injury to people or property resulting from any ideas, methods, instructions or products referred to in the content. |
© 2024 by the authors. Licensee MDPI, Basel, Switzerland. This article is an open access article distributed under the terms and conditions of the Creative Commons Attribution (CC BY) license (https://creativecommons.org/licenses/by/4.0/).