Article

Primary Metabolites and Microbial Diversity in Commercial Kombucha Products

Department of Food Science, College of Agriculture and Life Sciences, Cornell University, Ithaca, NY 14853, USA
*
Author to whom correspondence should be addressed.
Fermentation 2024, 10(8), 385; https://doi.org/10.3390/fermentation10080385
Submission received: 29 April 2024 / Revised: 1 July 2024 / Accepted: 22 July 2024 / Published: 26 July 2024
(This article belongs to the Special Issue Safety and Quality in Fermented Beverages)

Abstract

:
Kombucha brewers selling non-alcoholic beverages in the United States must ensure that the ethanol content of their products remains below 0.5% (v/v) throughout all stages of production and shelf life. Producers struggle to comply with this regulation in the absence of expensive dealcoholizing equipment if they wish to sell the unpasteurized or minimally pasteurized products that consumers typically expect. To identify which bacterial and/or fungal species contribute to the high ethanol content of commercial kombucha, we analyzed 47 commercial kombucha samples purchased at supermarkets near Cornell University in Ithaca, NY, USA. We analyzed samples for ethanol content via HPLC, microbial load determination, and next-generation amplicon sequencing of the bacterial and fungal populations of those samples. Two brands were found to contain significantly more than 0.5% ethanol (v/v) in the tested samples (t-test, p < 0.05, greater), and three brands were found to contain significantly different amounts of sugar in the tested samples compared to what was reported on the nutrition label (one higher and two lower, t-test, p < 0.05, two-sided). The microbial communities of the samples most significantly varied due to brand (PERMANOVA, p < 0.05). The main bacterial genera observed in the samples were Komagataeibacter, Acetobacter, Gluconobacter, Oenococcus, Lactobacillus, and Bifidobacterium. The main fungal genera observed in the samples were Saccharomyces, Dekkera, Cyberlindnera, Lachancea, Schizosaccharomyces, and Pichia. We did not identify any bacterial or fungal species associated with differences in ethanol content between samples within brands, suggesting significant strain variation in the bacteria and fungi involved in commercial kombucha fermentation. However, we did find that the relative abundance of Lactobacillales and the lactic acid content of the samples were significantly correlated (Kendall correlation test, p < 0.05). These results build upon recent research elucidating the role of lactic acid bacteria in the commercial fermentation of kombucha.

1. Introduction

Kombucha is a fermented beverage originating from present-day northeast China [1]. It is made by brewing sugar-sweetened tea and inoculating it with a mixed culture of bacteria and fungi contained within a cellulose pellicle [2], colloquially called a ‘symbiotic culture of bacteria and yeasts’ (SCOBY). Seventy percent of kombucha products sold in United States (US/USA) retail settings contain adjuncts, including fruit juices, spices, herbs, and spirulina [3]. In some cases, it is difficult to discern which product variants do not contain adjuncts, especially for brands that label products with abstract names. Between 2012 and 2020 in the US, the number of commercial domestic kombucha producers increased by 122% (241 to 534 producers), generating $1.1 billion in revenue in 2020; by 2027, there will be an estimated 810 producers generating $1.2 billion in revenue [3]. The rapid growth of this industry corresponds to growing consumer interest in fermented foods and the gut microbiome’s association with overall well-being [4,5]. However, as of July 2018, no controlled studies on the health implications of kombucha consumption in humans had been conducted [6]. Regardless of purchase motivation, many consumers purchase these products, and therefore, the safe production and distribution of kombucha within the US and globally is pertinent.
Since kombucha’s widespread market penetration, several lawsuits have been filed against kombucha producers for a variety of reasons, mainly related to the ethanol, sugar, and live organism contents of products [7,8,9,10,11]. Many of these lawsuits occurred after the publication of a 2017 study, which found that a selection of 18 commercial kombucha products sold as non-alcoholic beverages contained between 1.12 and 2.00% ethanol (v/v) [12]. These products, therefore, contain approximately 100–300% more ethanol than the legally allowed limit, 0.5% ethanol (v/v), for a product to be produced and sold as a non-alcoholic in the United States (27 C.F.R. §§ 25.11, 25.15) [13,14]. If, at any point in production, a product exceeds 0.5% ethanol (v/v), the operations of the producer are regulated by the Alcohol and Tobacco Tax and Trade Bureau (TTB) [15].
These lawsuits present valid concerns consumers have about the nutritional contents of commercially available products. Although there is minimal research on the long-term consumption of low-alcohol beverages [16], consumers who are pregnant, taking certain medications, or have underlying health conditions often wish to abstain from alcohol consumption. Furthermore, the US population consumes approximately 200% more sugar than the recommended daily intake (92.5 g sugar intake/day in 2016, versus the average of male and female recommended daily sugar intake by the American Heart Association—37.5 and 25 g/day, respectively) [17], and sugar-sweetened beverages have previously been identified as the primary source of added sugars [18]. Therefore, accurately reporting the sugar content of kombucha products is critical for consumers wishing to reduce their sugar consumption, as consumers use food labels to compare products during purchasing [19]. Finally, consumers purchasing kombucha products for purported microbial contents (and the implied nutritional benefits suggested by such statements) deserve to receive products that contain those contents, as regulated by the Food and Drug Administration (FDA) (21 C.F.R. § 101) [20] as ‘food additives’ or ingredients ‘generally recognized as safe’ (GRAS) [21]. As an aside, kombucha producers are advised not to market their products as ‘probiotic’ unless specific probiotic strains are added; the authors refer interested readers to the International Scientific Association for Probiotics and Prebiotics definitions for ‘probiotics’ and ‘fermented foods’ [22,23].
Therefore, the purpose of this study was to better understand which organisms are associated with the high ethanol and sugar contents of commercial kombucha products. We attempted this using chemical characterization of major metabolites, microbial load determination, and amplicon-based next-generation sequencing. Several studies have investigated commercially produced kombucha using similar techniques [24,25,26]. Although one of these studies utilized untargeted metabolomics, targeted chemical assays, shotgun metagenomic sequencing, and next-generation amplicon sequencing to investigate commercially produced products available in the market, the study did not note the primary metabolites resulting from kombucha fermentation, including lactic and acetic acids, except for ethanol, nor the amount of sugar in those products [26]. This same study noted there are few studies that analyze the microbial communities of kombucha products commercially available to consumers in their finished (bottled) forms [26]. We, therefore, expand on this study’s work by analyzing 47 samples from six kombucha brands purchased in retail markets near Cornell University in Ithaca, NY, USA.

2. Materials and Methods

2.1. Sample Acquisition

Commercial kombucha products were purchased from local supermarkets in Ithaca, NY, USA, in 2019 over the course of two months. Only commercially bottled kombucha, not fresh or keg-dispensed kombucha, was purchased. A variety of flavors, hereafter referred to as product types, were purchased from each brand, with some product types ultimately being sampled only once, while other product types were sampled up to three times. Some brands added probiotics to their products, so some samples contained added probiotics. Sample metadata are available in Supplementary Data 1. Samples were transported to Cornell University and kept at refrigeration temperature (2 °C) to await further analyses. All samples were processed within one week of acquisition. A total of six brands and 24 product types (flavors) were sampled; 47 samples were ultimately collected and analyzed. The brand name and product name were blinded, as we did not want the results from this study to be used to implicate any of the producers. The brands we sampled collectively represented more than 51.8% of the US kombucha market by revenue in 2021 [3].

2.2. Physiochemical Characterization

The pH of kombucha samples was measured at the time of sample/bottle opening on a 25 mL aliquot using a Hanna Instruments edge Dedicated pH Meter (Hanna Instruments, Woonsocket, RI, USA). Prior to measuring pH, Kombucha samples were degassed by shaking the aliquot in a 50 mL falcon tube until no additional CO2 bubbles formed (~30 s).
For other chemical analyses, kombucha samples were submitted to the Cornell AgriTech Craft Beverage Analytical Lab (Geneva, NY, USA), where they were analyzed using high-performance liquid chromatography (HPLC). First, the analytical lab treated samples with invertase to hydrolyze sucrose into glucose and fructose for the assay, as per the standard protocol in the lab; an aliquot of the sample was mixed with an equal volume of 4% invertase (w/v) solution and incubated at 30–35 °C for 35 min. Then, the treated samples were filtered through a 0.22 µm polyethersulfone filter and run through a Phenomenex Rezex ROA-Organic Acid H+ column (Phenomenex, Torrance, CA, USA) on a Shimadzu Prominence HPLC machine (Shimadzu Scientific Instruments, Columbia, MD, USA). 20 µL injections were run at 0.5 mL/min over 35 min in a 0.005 N H2SO4 mobile phase at 45 °C. Effluents were detected with a Shimadzu Diode Array detector SPD-M20A and Refractive Index detector model RID-10A (Shimadzu Scientific Instruments, Columbia, MD, USA). % Ethanol (v/v), acetic acid (g/L), lactic acid (g/L), glucose (g/L), and fructose (g/L) were reported. Sugars other than glucose and fructose may have been present in the kombucha samples at low concentrations due to the addition of fruit adjuncts, and sucrose was likely present because it is the primary source of sugar in commercial kombucha products. Due to invertase treatment as described, ‘total sugar’ referred to throughout the results was calculated as the combined amount of glucose and fructose derived from the hydrolysis of sucrose and other adjuncts measured via HPLC. The amounts of glucose and fructose before invertase treatment were not measured. In addition to ‘total sugar’, the relative sugar difference between what was listed on the nutrition label versus what was actually present in the product was calculated as
r e l _ d i f f s u g a r = g l u c o s e + f r u c t o s e l a b e l l a b e l

2.3. Culture-Based Microbiological Analyses

Each sample was aseptically opened, serially diluted in phosphate-buffered saline (PBS), and plated onto three media types across multiple dilutions. The three media types (Becton Dickinson, Franklin Lakes, NJ, USA) were glucose yeast extract calcium carbonate agar (GYC) [27] to enumerate acetic acid bacteria; de Man, Rogosa, and Sharpe agar (MRS) [28] to enumerate lactic acid bacteria, and acidified potato dextrose agar (APDA, pH 3.5 w/tartaric acid) to enumerate yeasts. To prevent the growth of yeasts on GYC and MRS, 200 ppm natamycin was added to each medium after autoclaving (as 400 ppm Natamax, DuPont Danisco, Wilmington, DE, USA). Samples plated on MRS were incubated anaerobically using the GasPak EZ Container System (Becton Dickinson, Franklin Lake, NJ, USA). Samples plated on GYC and MRS were incubated at 30 °C for approximately 24–48 h and 96 h, respectively. Samples plated from kombucha containing added Bacillus probiotic cultures grew quickly, and over-incubation caused the spreading of the colonies; hence, the range of incubation times for GYC. Samples plated on APDA were incubated at 25 °C for approximately 48 h. Dilutions were plated such that the lower limit of detection was 1 log10 CFU/mL, and the upper limit of detection was approximately 7 log10 CFU/mL.

2.4. 16S and ITS Next-Generation Amplicon Sequencing

2.4.1. DNA Extraction

10–12 mL of each kombucha sample was centrifuged at ~12,000 rcf for 10 min at 4 °C, and DNA was extracted from the resulting pellet with the Qiagen PowerSoil DNA extraction kit (QIAGEN, Germantown, MD, USA). DNA extracts were frozen at −20 °C until sequencing. An ‘extraction negative control’ was subject to the same procedure using 10 mL PBS instead.

2.4.2. Next-Generation Sequencing

A two-step amplicon sequencing protocol was followed to amplify the V3–V4 16S region of bacteria and the ITS2 region of fungi. The locus-specific portions of the 16S primers were F-5′-CCTACGGGNGGCWGCAG-3′ and R-5′-GACTACHVGGGTATCTAATCC-3′, colloquially known as Bakt_341F and Bakt_805R [29,30]; the locus-specific portion of the ITS primers were F-5′-GTGARTCATCRARTYTTTG-3′ and R-5′-TCCTSCGCTTATTGATATGC-3′, colloquially known as ITS7ngs and ITS4ngs [31,32,33]. Both 16S and ITS primers included the required Illumina indexing overhangs [34].
Samples were amplified using Promega GoTaq DNA Polymerase in 25 µL reactions (Promega, Madison, WI, USA). Each reaction contained 14.85 µL dH2O, 0.2 µM forward primer (Integrated DNA Technologies, Coralville, IA, USA), 0.2 µM reverse primer, 2 mM magnesium chloride (Promega, Madison, WI, USA), 200 µM dNTPs (New England Biolabs, Ipswich, MA, USA), 0.75 U DNA polymerase, and 1.5 µL DNA template. PCR conditions for both 16S and ITS amplifications were the same: 1 cycle at 95 °C for 3 min; 35 cycles at 95 °C for 30 s, 55 °C for 30 s, 72 °C for 30 s; and 1 cycle at 72 °C for 10 min. Successful amplification was verified by gel electrophoresis and EtBr staining.
‘PCR negative controls’ using nuclease-free water instead of a DNA template were subject to the same procedure for each 16S and ITS sequencing run. Additionally, the ‘extraction negative control’ was subjected to the same procedure for each 16S and ITS sequencing run. A ‘PCR negative control’ and ‘extraction negative control’ were included for each 16S and ITS sequencing run.
The amplified samples were submitted to the Cornell Biotechnology Resource Center for quantification, indexing, multiplexing, cleanup, quality control, and Illumina MiSeq sequencing (Illumina, San Diego, CA, USA). Sequencing was performed according to manufacturer specifications using a MiSeq 2 × 250 bp V2 sequencing kit.

2.5. Data Processing and Analysis

Data analysis was conducted using R (version 4.2.3) [35] within RStudio (2023.12.1) [36] using renv (0.16.0) [37].
Chemical and microbial load data were analyzed using the multcomp (1.4.26) [38] R package.
Next-generation amplicon sequencing data were processed in QIIME 2 (2022.2) [39] using Cutadapt (2022.2.0) [40] to trim adapter sequences and DADA2 (2022.2.0) [41] to merge, denoise, and bin reads into amplicon sequence variants (ASVs). Sequences were taxonomically classified using the Qiime2 naïve-bayes feature classifier (2022.2.0) [42] trained on amplicon-specific regions of 16S sequences from the SILVA 138 99% OTU data release [43,44] processed with RESCRIPt (2022.2.0) [45], and on full-length ITS sequences from the expert-curated OTU thresholds UNITE 9.0 database [46]. Processed data were then transferred to R using Phyloseq (1.41.1) [47], decontaminated using Decontam (1.18.0) [48], ‘denoised’ (rare sequence removal) with PERFect (1.12.0) [49], and analyzed with vegan (2.6-6.1) [50], microbiome (1.20.0) [51], SPIEC-EASI (1.1.3) [52], and GUniFrac (1.8) [53] R packages; GUniFrac was used for differential abundance testing with ZicoSeq [54]. When data were agglomerated to higher taxonomic levels, taxonomically unresolved OTUs at the desired agglomeration level were kept separate.
Other packages used for data analysis include ggpubr (0.5.0) [55], ggtext (0.1.2) [56], ggnewscale (0.4.8) [57], igraph (1.6.0) [58], and ggnetwork (0.5.13) [59]. The full code used to process raw reads and analyze data is deposited and accessible at https://github.com/jsogin574/Sogin_and_Worobo_Kombucha_2024, accessed on 30 June 2024.

3. Results

3.1. Physiochemical and Microbiological Characterizations

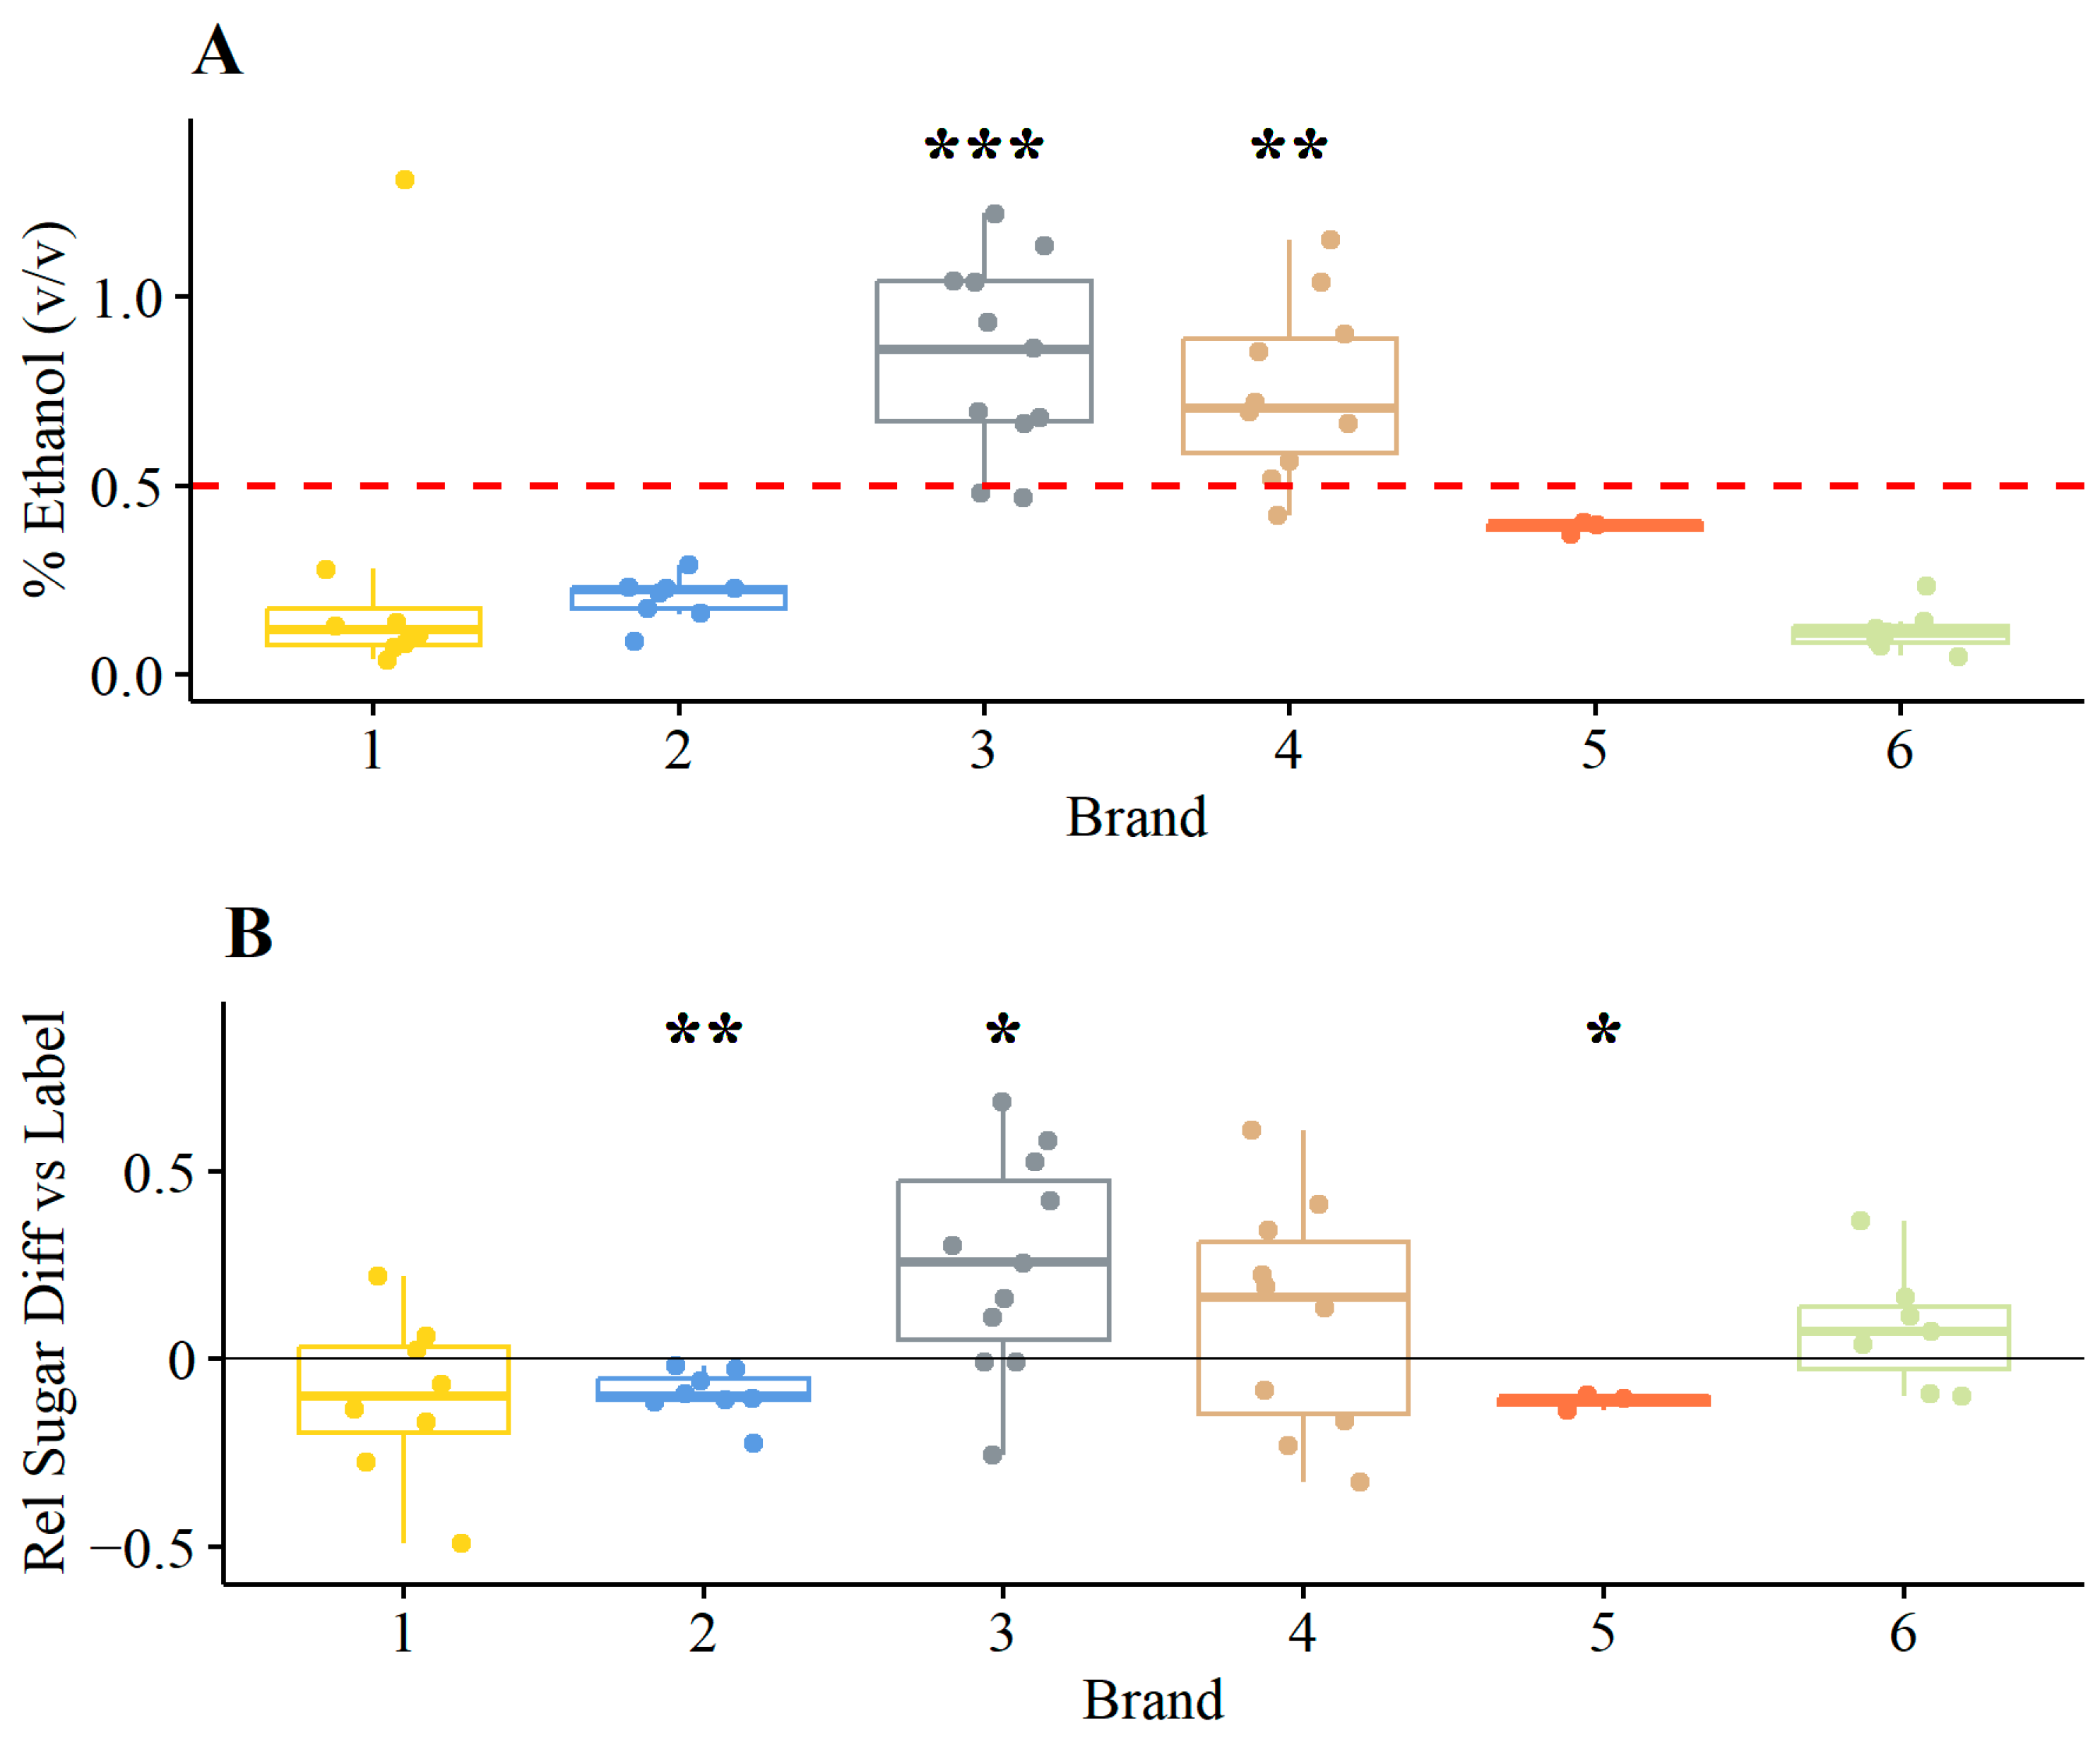
3.1.1. Ethanol and Relative Sugar Contents

Kombucha was chemically analyzed by HPLC for ethanol, acetic acid, lactic acid, glucose, and fructose content. Gluconic acid could not be measured at the time of the Craft Beverage Analytical Lab. The sample numbers and average values of % ethanol (v/v), pH, lactic acid (g/L), acetic acid (g/L), and total sugar (g/L) for the brands are listed in Table 1.
Ethanol and sugar contents are directly related to regulatory product requirements: ethanol is to be below 0.5% v/v, and sugar must match what is stated on the nutrition label. Therefore, ethanol and the relative difference in sugar content versus the label were explicitly analyzed (Figure 1). Ethanol content across all samples ranged from 0.040 to 1.3%, and the average ethanol content of two brands was found to be significantly higher than 0.5% (v/v) (t-test, greater, p < 0.05). Relative sugar difference across all samples ranged from 49 to 68%, and the average relative sugar difference of three brands was found to be significantly different, one higher and two lower (t-test, two-sided, p < 0.05). Brand 3 contained significantly higher ethanol and relative sugar contents. Among all samples, the total sugar in samples, calculated as the combined amount of glucose and fructose, as measured by HPLC, was 15.08–48.41 g/L (µ = 31.29); pH ranged from 2.8 to 3.8 (µ = 3.1); acetic acid ranged from 0.2500 to 11.71 g/L, which included one sample with a very high amount of acetic acid (µ = 1.845, median = 1.550); and lactic acid ranged from 0.0000 to 2.440 g/L (µ = 0.4051).

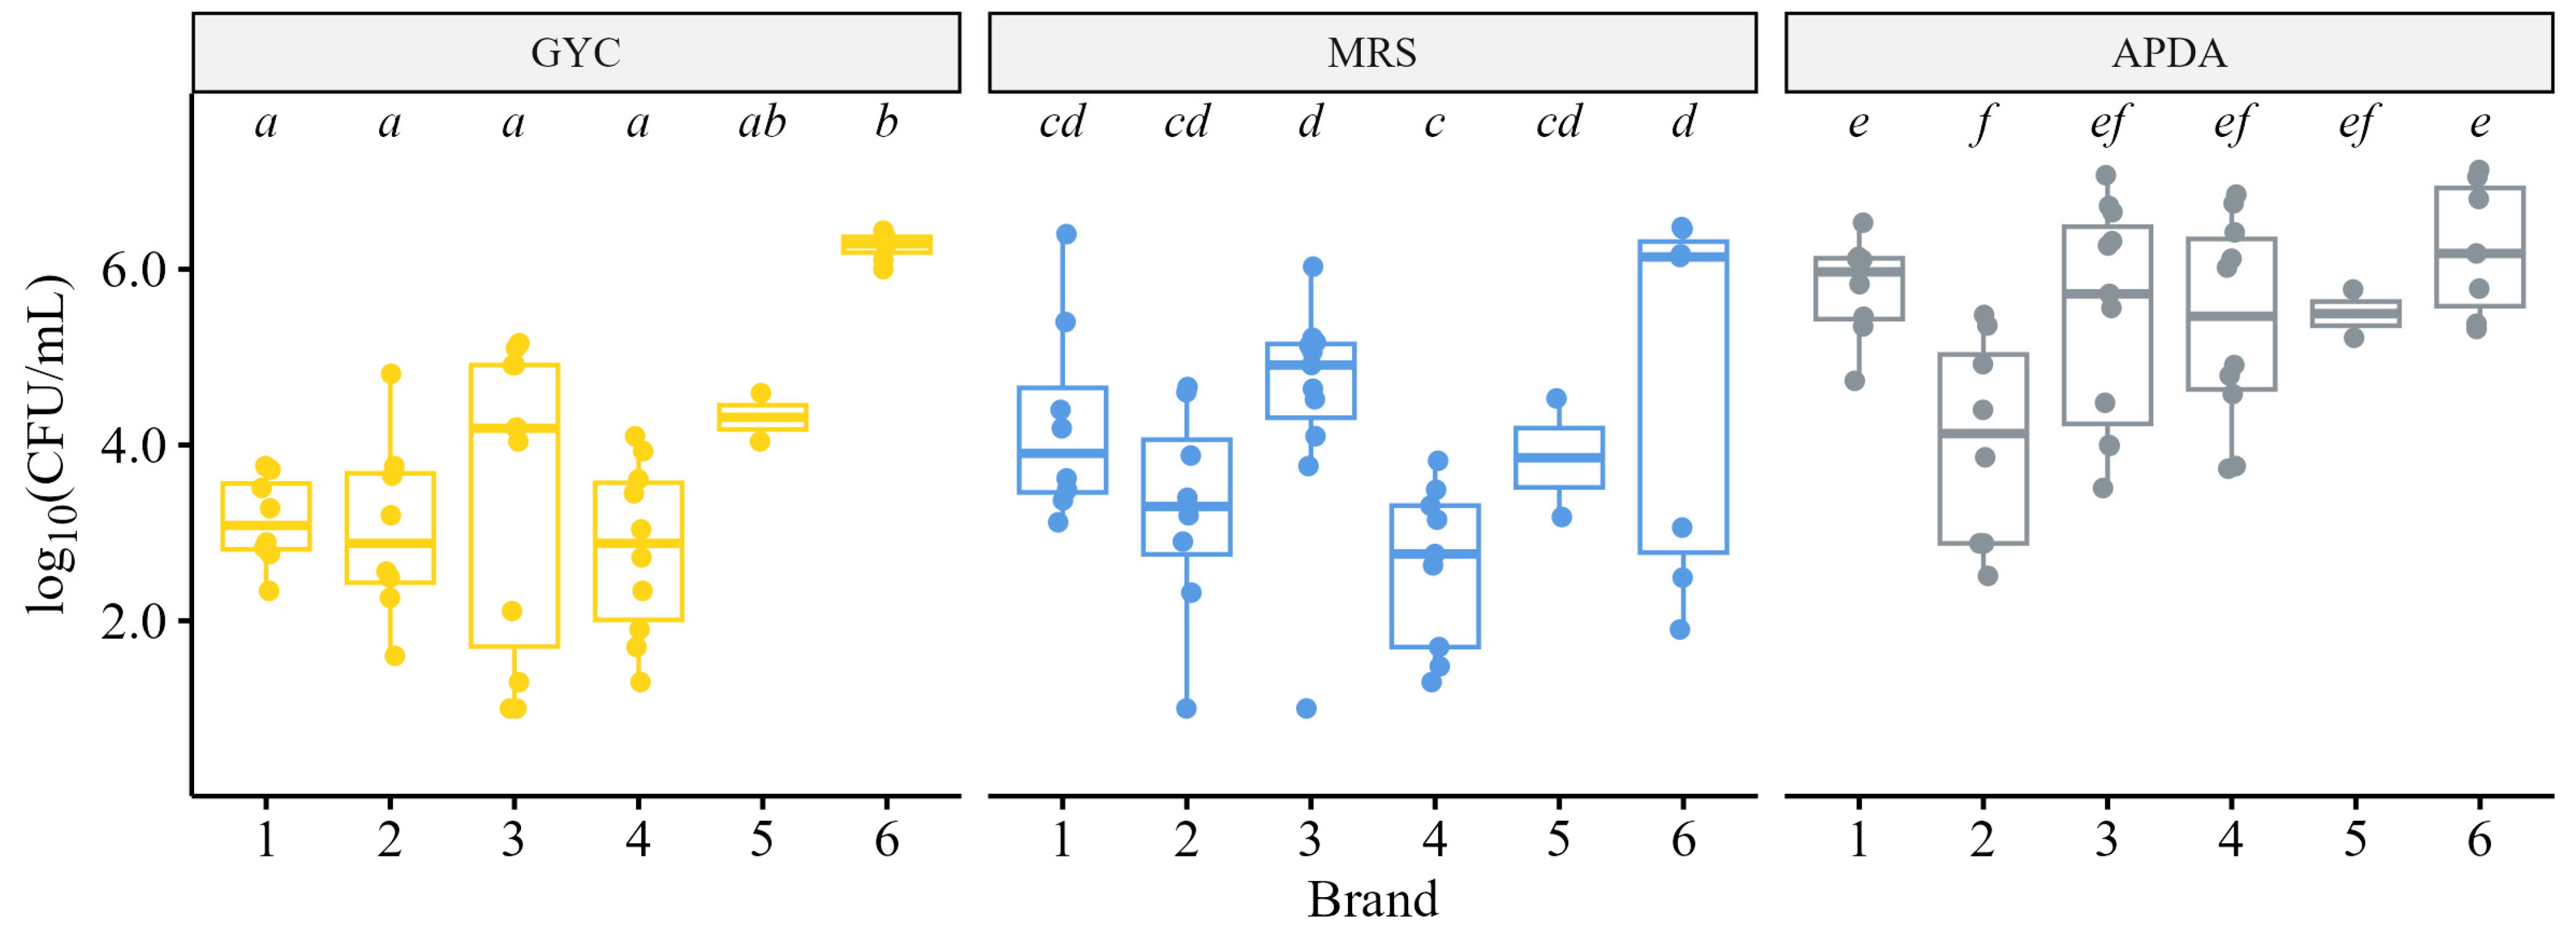
3.1.2. Culture-Based Microbiological Analyses

Samples were plated on GYC, MRS, and APDA media to determine whether differences in microbial loads were observed between brands. Most samples contained live microorganisms that grew on the three media types: GYC, 1.0–6.4 log10 CFU/mL (µ = 3.7); MRS, 1.0–6.5 log10 CFU/mL (µ = 3.9); APDA, 2.5–7.1 log10 CFU/mL (µ = 5.4). For each medium, significantly different microbial loads were observed across brands (ANOVA, p < 0.05) (Figure 2); pairwise comparisons confirmed that significant differences were also observed between brands (Tukey’s HSD, p < 0.05) within each media type. Probiotics added to the commercial products by producers—Bacillus subtilis to brand six and Bacillus coagulans to brand three—caused skewed counts in those samples that could not be adjusted by colony morphology; the counts on these plates showed that the probiotic strains survived the bottling process, transportation, and storage until purchase.

3.1.3. Physiochemical and Microbiological Multiple Linear Regressions

To further investigate the relationship between ethanol content and chemical composition/microbial load, three multiple linear regressions (MLRs) were calculated. The first MLR considered the explanatory factors of brand and product type (flavor) [ethanol ~ brand + product]. This first MLR indicated that brand was highly significantly associated with differences in ethanol content (p < 0.0001) and that some, but not all, product types (flavors) were. The second MLR considered the association between ethanol content and other chemical parameters [ethanol ~ pH + lactic + acetic + total sugar + relative sugar difference]. The second MLR showed that among the other chemical parameters, the relative sugar difference was the only factor significantly associated with differences in ethanol content. In a direct comparison of relative sugar content to % ethanol, there was a close but non-significant correlation found between the two (Kendall correlation test, p = 0.062) (Supplementary Figure S1). Finally, the association between ethanol content and microbial loads [ethanol ~ brand + GYC + MRS + APDA] was investigated in the third MLR. The third MLR showed that none of the microbial loads on any of the media types were significantly associated with differences in ethanol content.

3.2. Next-Generation Amplicon Sequencing

3.2.1. Sequencing and Sequence Processing

Samples were sequenced on an Illumina MiSeq with a 2 × 250 bp V2 sequencing kit across two sequencing runs (Illumina, San Diego, CA, USA). 22 M raw reads were obtained from Illumina sequencing (11 M 16S, 11 M ITS). ITS data were first processed using both forward and reverse reads, but many sequences were lost during merging with Dada2 (28–95% retained). ITS sequences were thus processed using only forward reads to prevent sequence loss at the merge step.
16 M reads were retained (7.0 M 16S, 9.2 M ITS) after raw sequence processing. 15 M reads were retained (5.9 M 16S, 9.0 M ITS) after filtering taxa unidentified at the phylum level, those identified as chloroplast or mitochondria, and contaminants identified by Decontam. 16S data contained a substantial number of reads from added probiotic cultures or ‘greens’ (e.g., Bacillus and Arthrospira) (Figure 3), so these taxa were removed for all statistical analyses, as we had an interest in the underlying kombucha microorganisms—not the adjuncts; after added culture sequence removal 4.7 M 16S sequences remained. Ultimately, ‘greens’ samples were removed for 16S and ITS statistical analyses, as the proportion of kombucha reads to added culture reads was so low (2–4% of the raw sequences 16S samples). Two other samples that contained an added Bacillus probiotic were removed from the 16S analysis because few reads were retained (<1000 reads). Finally, after removal of negative control samples and ‘denoising’ with PERFect to remove rare and uninformative OTUs, 13 M sequences remained (4.6 M 16S, 8.6 M ITS).

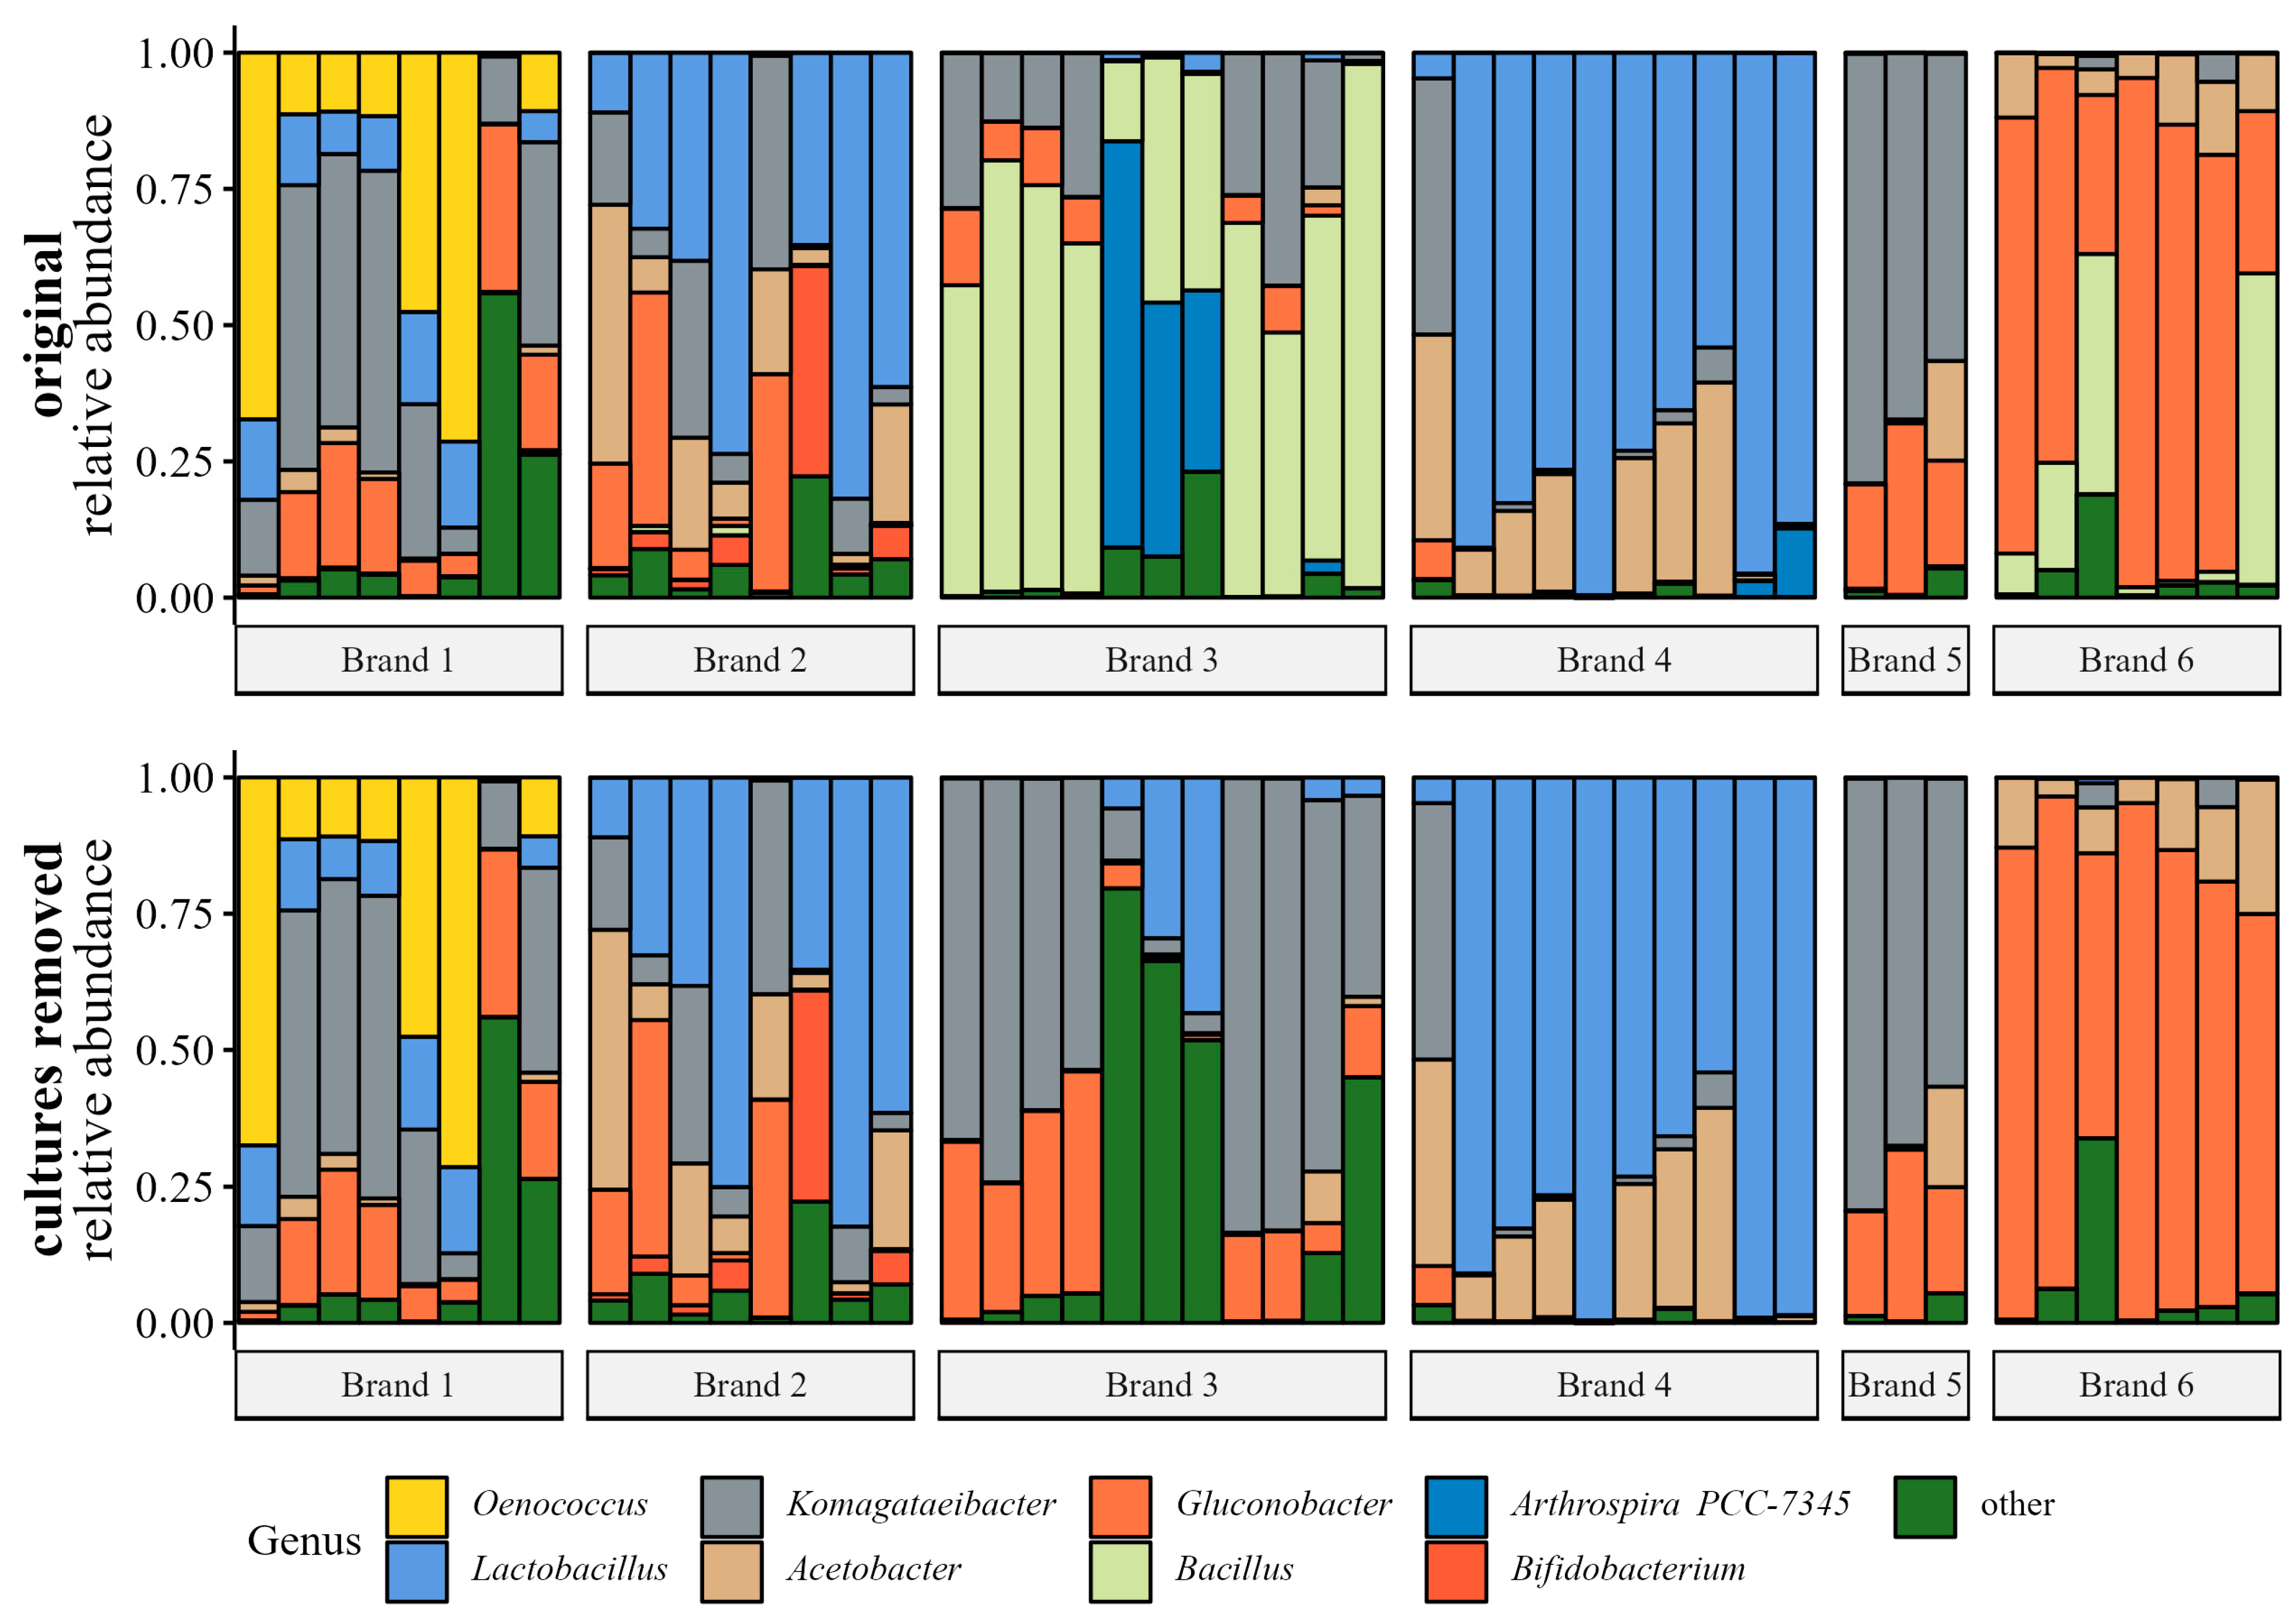
3.2.2. Bacterial Community Analyses

Bacterial Genera Relative Abundance

Filtered (i.e., sequences unidentified at the phylum level or identified as chloroplast or mitochondria removed) and decontaminated (i.e., sequences identified as contaminants using Decontam removed) data were agglomerated to the genus taxonomic level, converted to proportions, and plotted in Figure 3. Relative abundance plots show the samples before and after the added culture sequence removal. Before added culture removal, Bacillus and Arthrospira comprised a large proportion of reads in samples from brand three and some reads in samples from brands four and six. After the added cultures were ‘removed’, the six most abundant genera were Oenococcus, Lactobacillus, Komagataeibacter, Acetobacter, Gluconobacter, and Bifidobacterium.

Bacterial Community Sample Ordination

A distance matrix was computed using the Bray–Curtis [60] (Bray and Curtis, 1957) method between samples on denoised species-agglomerated proportion data. Nonmetric multidimensional scaling (NMDS) was used to ordinate the samples and species (mean abundance > 1.0%), as shown in Figure 4. The clusters for brands three, five, and six were relatively small, indicating that the microbial communities were similar between products. Except for one outlying sample, the cluster for brand four would have been relatively small and tight, suggesting that the microbial communities for those products were similar too. Samples with high or low ethanol content did not group together, except within brands. Two Komagataeibacter spp. (one unresolved, and the other K. saccharivorans) were ordinated near high ethanol samples from brand three; one unresolved Acetobacter sp. and Lactobacillus nagelii were ordinated near high ethanol samples from brand four.

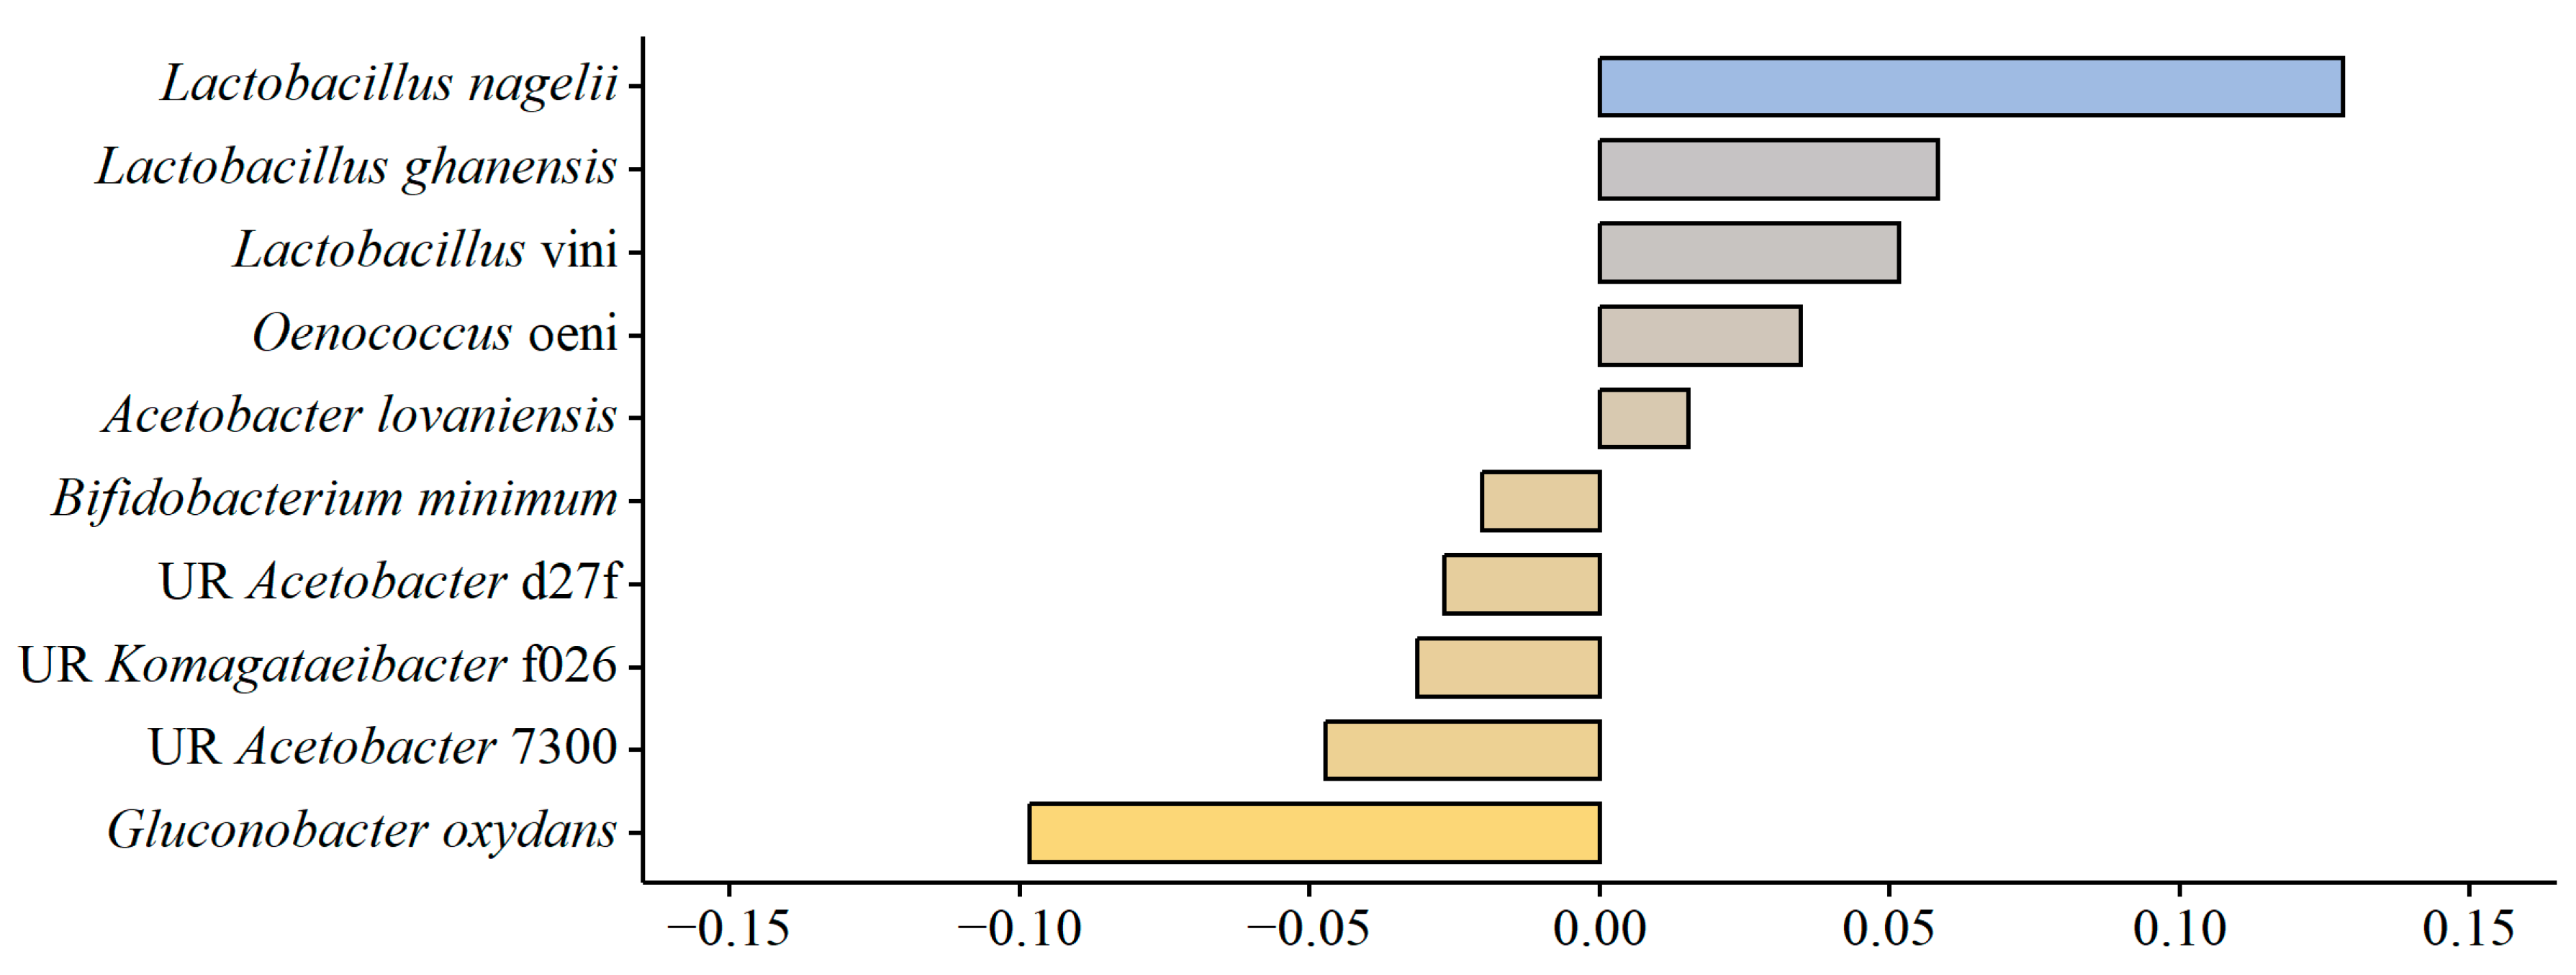
Association between Variables and the Observed Bacterial Community Differences

A permutational multivariate analysis of variance was conducted (PERMANOVA) [61] using the computed Bray–Curtis distance matrix to determine whether there was an association between the observed bacterial community differences and the explanatory variables brand and product type (flavor) [bacterial dist. matrix ~ sequencing run + brand + product type, stratified within sequencing run]. Brand was highly significantly associated with the observed community differences (p < 0.0001), but product type (flavor) was not (p = 0.062). ZicoSeq was used to conduct a differential abundance analysis of species between brands, which is depicted in Supplementary Figure S2. The top 11 differentially abundant species were from the genera Gluconobacter, Komagataeibacter, Lactobacillus, Acetobacter, Oenococcus, and Bifidobacterium, which are the same as those plotted in Figure 3.
To determine the marginal association between the observed bacterial community differences and the chemical variables, a distance-based redundancy analysis was conducted (dbRDA) using the computed Bray–Curtis distance matrix [bacterial dist. matrix ~ sequencing run + brand + pH + ethanol + lactic acid + acetic acid + total sugar + relative sugar difference]. The only chemical variable significantly associated with the observed community differences was lactic acid content (p = 0.024).
PERMANOVA was conducted [bacterial dist. matrix ~ sequencing run + brand + lactic acid] to calculate the top 10 bacterial species positively or negatively associated with lactic acid content (Figure 5). Four of the five positively correlated species are members of the Lactobacillales order: Lactobacillus nagelii, Lactobacillus ghanensis, Lactobacillus vini, and Oenococcus oeni; four of the five negatively correlated species are members of the Acetobacteraceae order: Gluconobacter oxydans, two unresolved Acetobacter spp., and one unresolved Komagataeibacter sp. This result indicated an association between Lactobacillales and lactic acid content. Therefore, the relative abundance of Lactobacillales was plotted against lactic acid content for all samples (Figure 6), and a Kendall correlation test was conducted. There was a highly significant correlation between the relative abundance of Lactobacillales and lactic acid in kombucha samples (Kendall correlation test, p < 0.0001).
There was no significant association between the observed bacterial community differences and any of the microbial loads [bacterial dist. matrix ~ sequencing run + brand + GYC + MRS + and APDA] (dbRDA, p > 0.05).

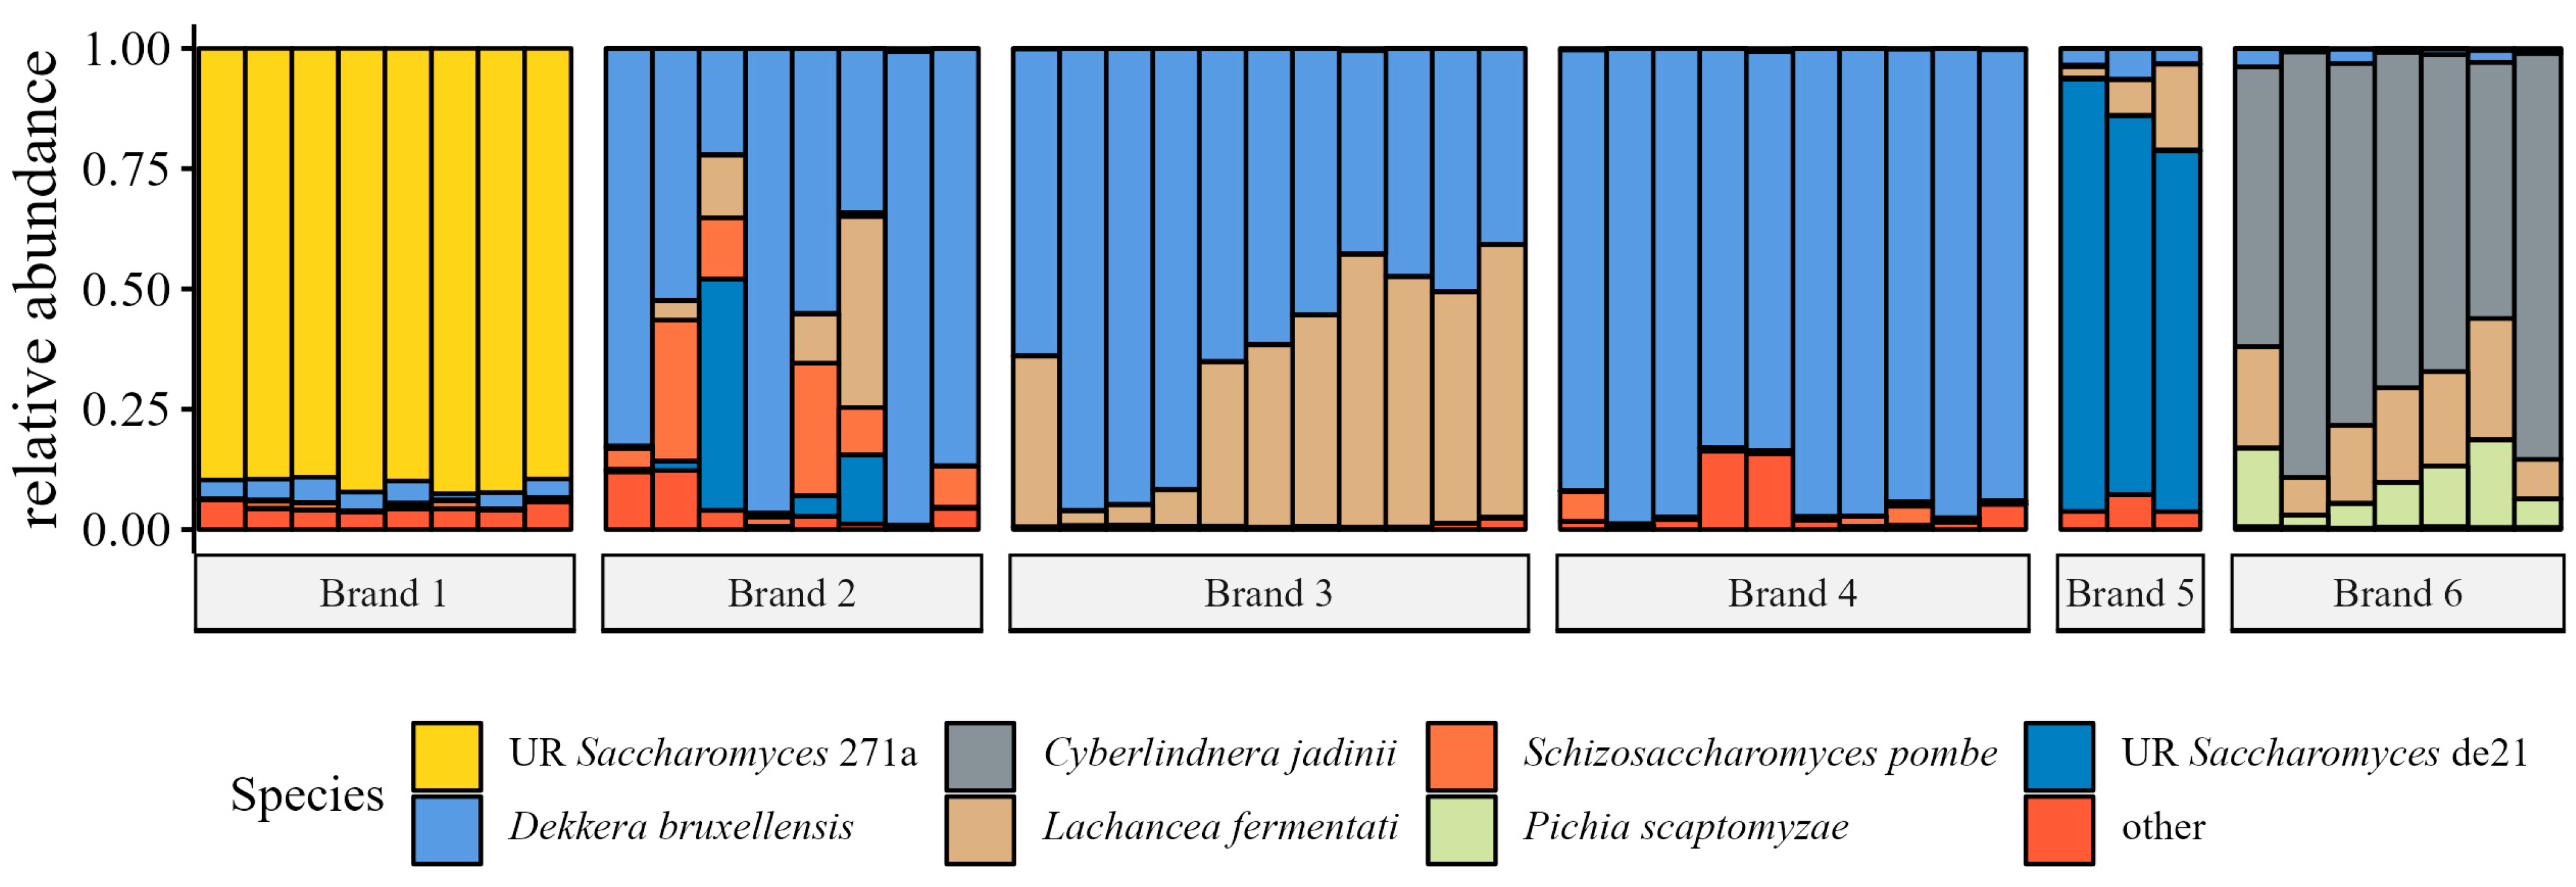
3.2.3. Fungal Community Analyses

Fungal community analyses were conducted in parallel with bacterial community analyses using forward-read processed data. Refer to the equivalent bacterial community analyses section for details of the analysis.

Fungal Species Relative Abundance

Filtered and decontaminated data were agglomerated to the species taxonomic level, converted to proportions, and plotted in Figure 7. The seven most abundant species were two unresolved Saccharomyces spp., Dekkera bruxellensis, Cyberlindnera jadinii, Lachancea fermentati, Schizosaccharomyces pombe, and Pichia scaptomyzae. Except for brands two and three, the microbial communities were dominated by a single species.

Fungal Community Sample Ordination

A Bray–Curtis distance matrix was computed between samples on denoised species-agglomerated proportion data. An NMDS ordination of samples and species (mean abundance > 0.01) is shown in Figure 8. The products from most brands, excluding brand two, were clustered into small distinct groups, indicating that the microbial communities were similar between products of the same brand. Unlike the bacterial community ordination, most high ethanol samples were grouped together. The species that were most closely associated with high ethanol samples were Dekkera bruxellensis, Lachancea fermentati, and Schizosaccharomyces pombe.

Association between Variables and the Observed Fungal Community Differences

A PERMANOVA was conducted using the computed Bray–Curtis distance matrix to determine whether there was an association between the observed fungal community differences and the explanatory variables brand and product type (flavor) [fungal dist. matrix ~ brand + product type, stratified within sequencing run]. Brand was highly significantly associated with the observed fungal community differences (p < 0.0001), but product type (flavor) was not (p = 0.060). ZicoSeq was used to conduct a differential abundance analysis of species between brands, which is depicted in Supplementary Figure S3. The top seven differentially abundant species are the same as those plotted in Figure 7.
No chemical variables were significantly associated (p > 0.05) with differences in the observed fungal communities when marginally analyzed via dbRDA [fungal dist. matrix ~ sequencing run+ brand + pH + ethanol + lactic acid + acetic acid + total sugar + relative sugar difference]. Total sugar was the most strongly associated with any observed fungal community differences (p = 0.070). There was no significant association between the observed fungal community differences and any of the microbial loads [bacterial dist. matrix ~ sequencing run + brand + GYC + MRS + and APDA] (dbRDA, p > 0.05).

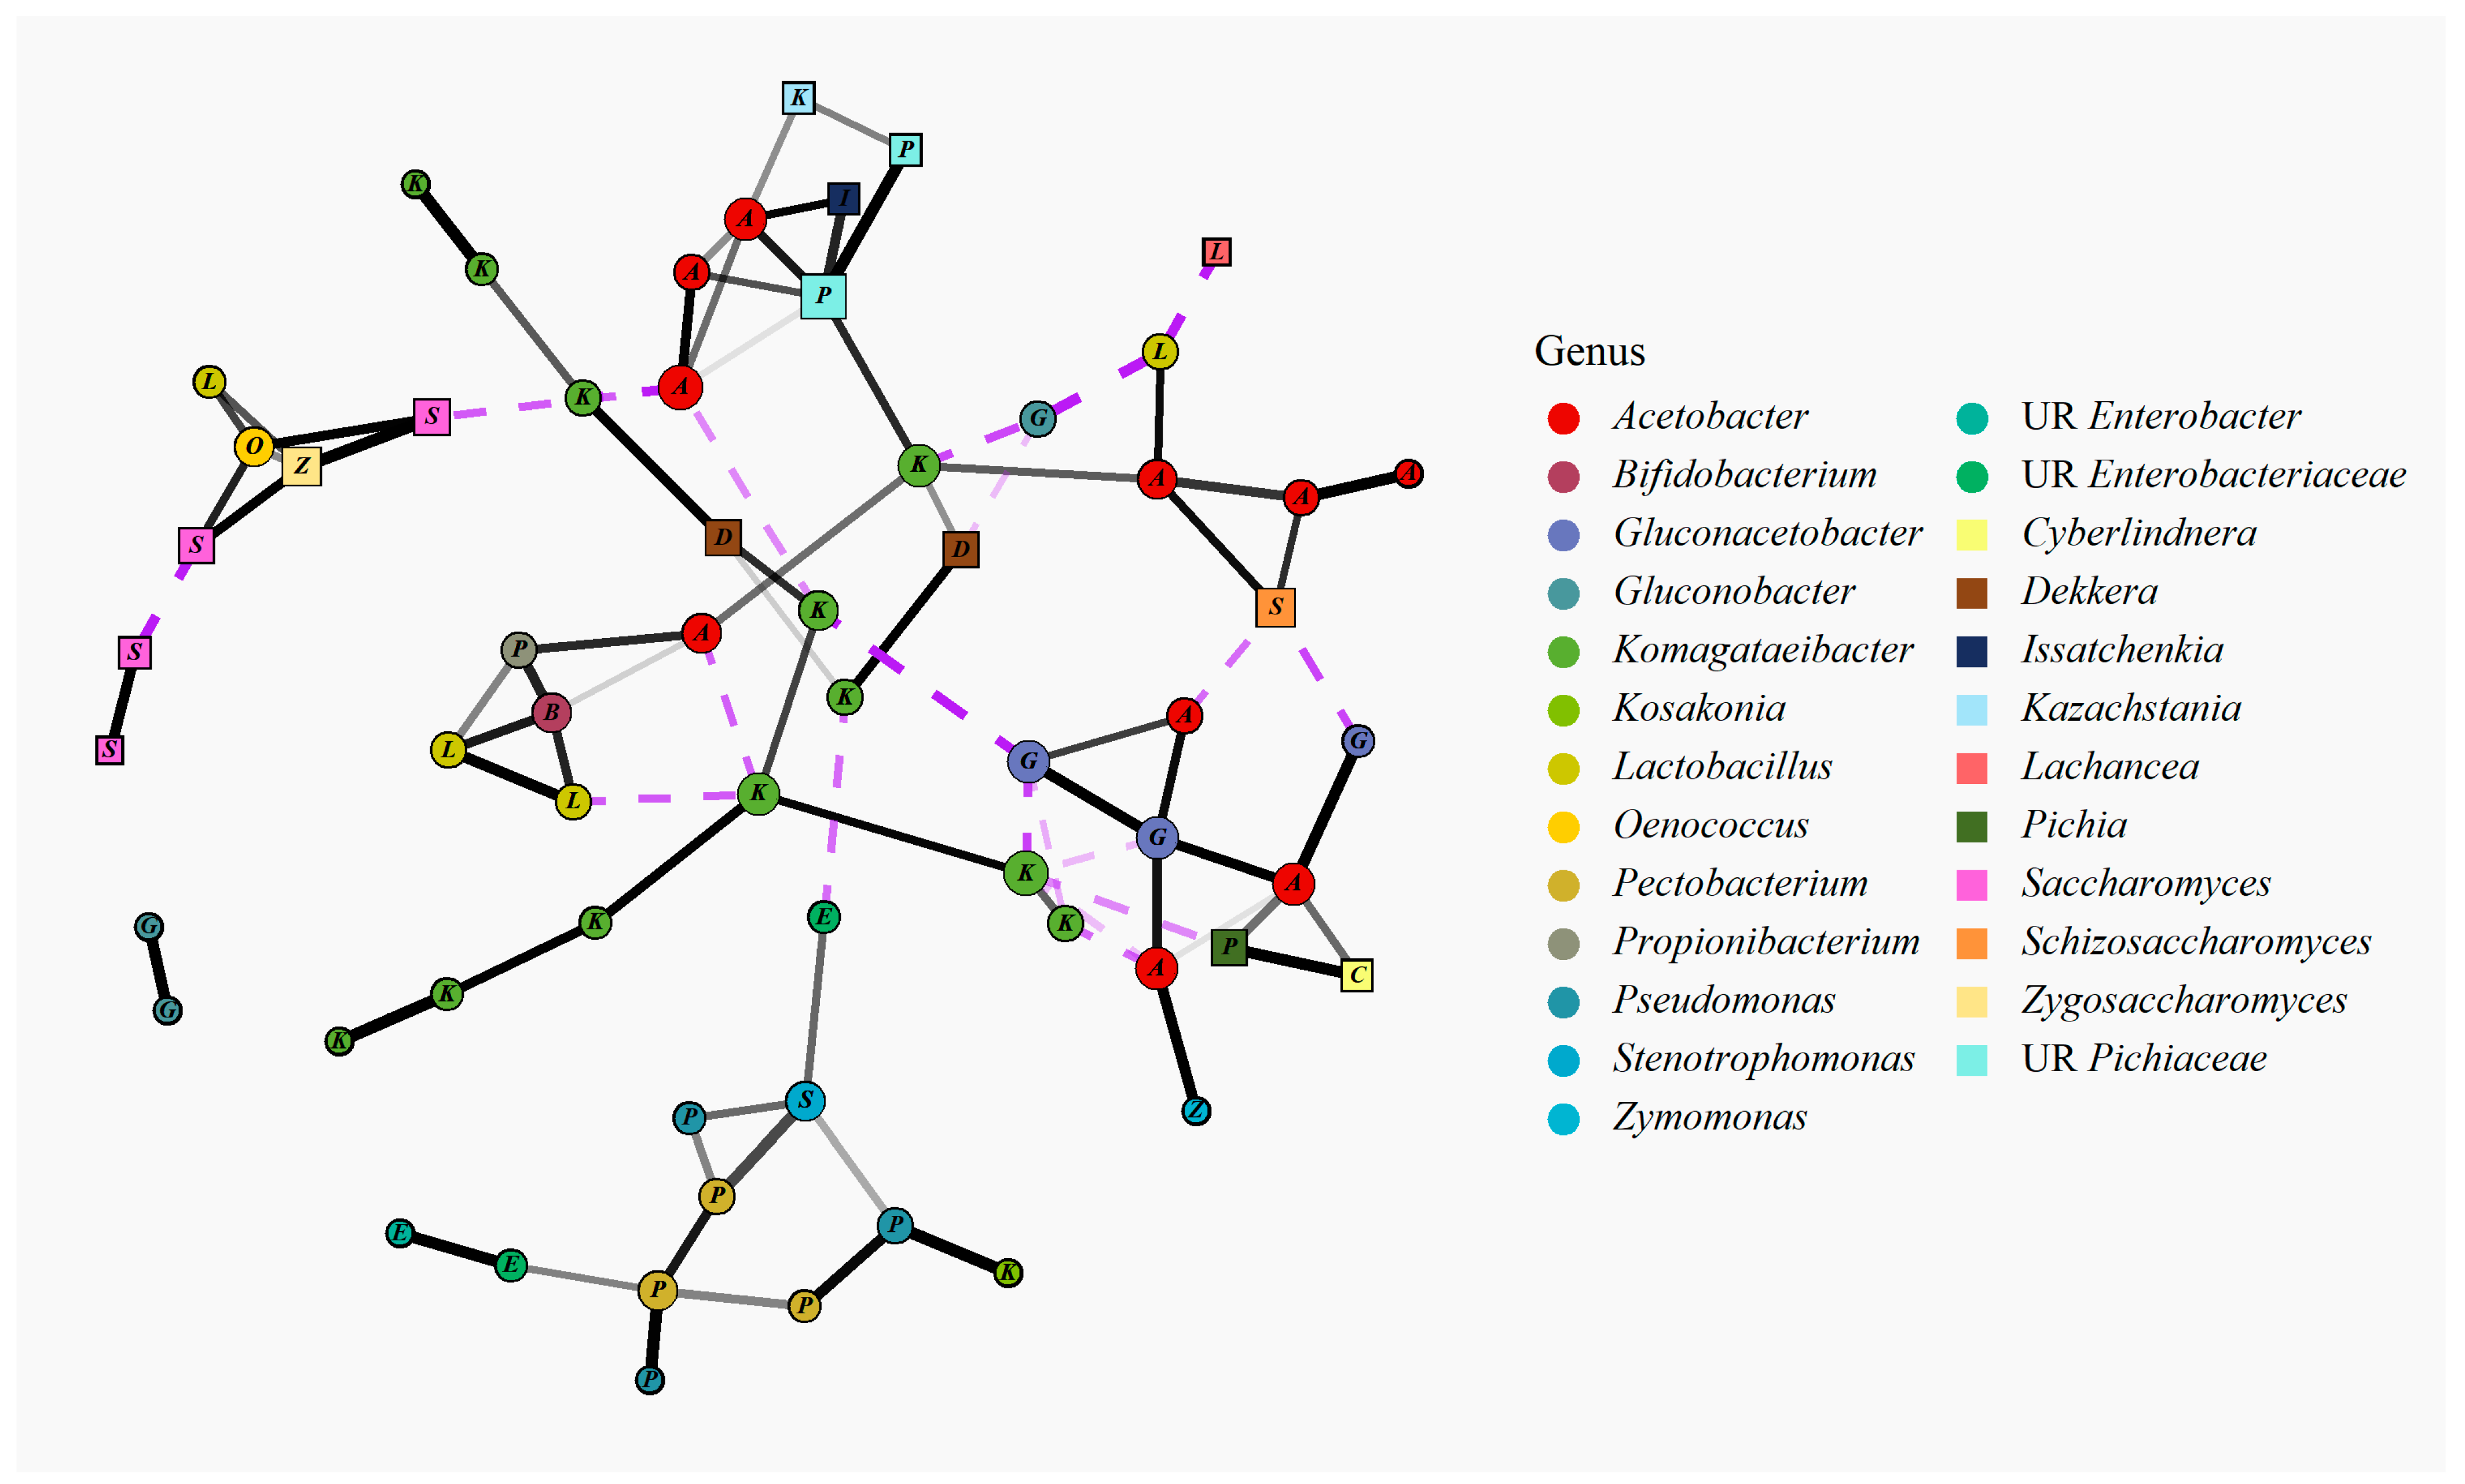
3.2.4. Bacterial and Fungal Species Co-Occurrence Analysis

A co-occurrence analysis between bacterial and fungal species was conducted using SPIEC-EASI (Sparse InversE Covariance Estimation for Ecological Association Inference) [52] to investigate species associations between bacteria and bacteria, bacteria and fungi, and fungi and fungi. Only species with a mean relative abundance > 0.05% were considered for analysis; no prevalence threshold was set. Analysis was conducted on species-agglomerated count data. The resulting co-occurrence network is plotted in Figure 9.
One cluster resembling the microbial communities of brands three and five contained several unresolved Komagataeibacter spp. and one Dekkera sp.; the Komagataeibacter spp. in this cluster were often negatively cooccurring with Acetobacter or Gluconobacter spp. Another cluster resembling the microbial community of brand one contained two unresolved Saccharomyces spp.: Zygosaccharomyces balii, Oenococcus oeni, and Lactobacillus mali. A larger cluster resembling brands two and four contained several Acetobacter spp., two Komagataeibacter spp., Lactobacillus ghanensis, Lactobacillus vini, Bifidobacterium minimum, Dekkera bruxellensis, three unresolved Pichiaceae spp., Issatchenkia orientalis, and Kazachstania exigua. The last cluster representing a brand, brand six, contained three Acetobacter spp., two Gluconacetobacter spp., Zymomonas mobilis, Cyberlindnera jadinii, and Pichia scaptomyzae.
One cluster remained, which contained three Pectobacterium spp., three Pseudomonas spp., two unresolved Enterobacteriaceae spp., one unresolved Enterobacter sp., one Stenotrophomonas sp., and one Kosakonia sp. These species were all associated with samples containing ginger. ZicoSeq was used to determine whether the species were differentially abundant in samples containing ginger; the model considered separately bacterial and fungal species with mean relative abundance > 0.050% and prevalence > 10% while controlling for brand and sequencing run. The same bacterial species that were present in this cluster were significantly more abundant in kombucha samples containing ginger (p.adj < 0.05), which included 11 samples across four brands; there were no fungal species that were significantly differentially abundant due to the addition of ginger (p.adj > 0.05). A depiction of the bacterial differential abundance results from this ZicoSeq analysis is plotted in Supplementary Figure S4.

4. Discussion

The main goal of this study was to determine whether certain bacterial and/or fungal species were correlated with high ethanol content in commercial kombucha products. In total, 47 samples representing 24 product types (flavors) produced by six brands in 2019 were acquired and subjected to chemical and microbiological analyses. Chemical analysis was performed using HPLC. Microbiological analyses included microbial load determination on GYC, MRS, and APDA media and next-generation amplicon sequencing of 16S and ITS genes to identify the bacterial and fungal communities within the kombucha samples.

4.1. High Ethanol Content of Commercial Kombucha Products

Chemical analysis showed that the ethanol content of the samples ranged between 0.040–1.3% ethanol (v/v), and that the two brands contained significantly higher than 0.5% ethanol (v/v) (Figure 1). The samples we tested contained lower levels of ethanol than the 2017 study of ethanol contents in commercial products, which ranged from 1.12–2.00% (v/v) [12], and align more closely with the 2022 study of commercial kombucha products, which measured ethanol contents ranging from 0.00–1.29% (v/v) [26]. These results highlight the challenge commercial kombucha producers face in keeping the ethanol content of products below 0.5% ethanol (v/v).
We were unable to identify specific species from the sequencing data that were significantly correlated with the high ethanol content of the products. However, from the ordination diagrams in Figure 4 and Figure 8, strains of Komagataeibacter, Lactobacillus nagelii, Acetobacter, Dekkera bruxellensis, Lachancea fermentati, and Schizosaccharomyces pombe were associated with products containing high ethanol contents. One factor this study did not account for was post-fermentation processes implemented by producers to remove ethanol from the products or prevent metabolic activity after bottling. At the time samples were collected, ethanol removal practices were less common in the industry, but still it was not possible to determine specific production practices (or lack thereof) from the product labels alone. Nonetheless, from a product testing standpoint, the presence or absence of certain species should not alone be used to determine whether products will have low or high ethanol content.

4.2. High Sugar Contents Can Cause High Ethanol Contents

The total sugar in samples ranged from 15.08 to 48.41 g/L (µ = 31.29), which is in stark contrast to a study of a commercial Australian brand’s products, which contained 3.03 g/L sugar (glucose + fructose + sucrose) [62]. The total sugar in the tested kombucha samples is also very high when considering the AHA recommended sugar intake of 25 g for females and 37.5 g for males per day [17]. The relative difference in the amount of sugar in the samples tested in this study ranged from 49% less to 68% more than what was listed on the nutrition label (Figure 1). When ethanol content was compared to the relative sugar difference of the samples, a close but non-significant correlation was found between the two variables (Kendall correlation test, p = 0.062) (Supplementary Figure S1).
A high relative sugar content may be caused by incomplete fermentation at the facility, the addition of too much sugar at the time of batching, or simply too much sugar required in the formulation. Kombucha producers may wish to stop fermentation at a specific point to achieve certain sensory characteristics at the risk of shipping a product that has not reached equilibrium, contains fermentable sugars, and may continue to ferment in the bottle, even at refrigeration temperatures. Producers must also keep in mind that any fruit added either at the start of fermentation or the end of fermentation will contain fermentable sugars that need to be accounted for. Relying on refrigeration alone is a risky way to manage ethanol content, as some of the bacteria and yeasts in products will likely be able to ferment the sugars at refrigeration temperature; the risk of exceeding 0.5% ethanol (v/v) increases with extended shelf life.
The composition of sugars and other adjuncts likely influences the organisms that are favored to grow in kombucha products and, thus, the resulting metabolites (acids, ethanol, etc.). Future studies investigating how different ‘wild’ kombucha cultures or defined bacteria/yeast mixtures respond to differing sugar and/or adjunct compositions (type and amount) will enhance the understanding between fermenting culture, substrate, and resulting ethanol generation. However, even with an enhanced understanding of these factors, producers’ use of ‘wild’ cultures versus predefined strain mixtures will limit their control.
At present, the main factor kombucha producers should focus on to control ethanol content is the amount of sugar in their products. Samples used in this study all contained living bacteria and/or yeasts, which would likely metabolize the remaining sugars had they remained on the shelf and potentially increase the ethanol content of those products above 0.5% ethanol (v/v). A simple (to write but hard to implement) solution to prevent the additional accumulation of ethanol in finished products without pasteurizing them is to eliminate any remaining sugar in them; this can be achieved by adding a small amount of sugar during batching, fermenting the kombucha until very little sugar remains, and sweetening beverages with non-nutritive sweeteners.

4.3. Brand Influences the Microbial Communities of Products

Microbial community analyses showed that different brands contained significantly different bacterial and fungal communities (PERMANOVA, p < 0.05). Some of the main bacterial genera observed were Oenococcus, Lactobacillus, Komagataeibacter, Acetobacter, Gluconobacter, and Bifidobacterium and some of the main fungal genera observed were Saccharomyces, Dekkera, Cyberlindnera, Lachancea, Schizosaccharomyces, and Pichia. These results agree with several other previous studies [2,24,25,26,62,63,64]. The bacteria-fungi relationships mentioned in the cluster analysis and depicted in Figure 9 may be used as a starting point for creating industrially produced predefined kombucha cultures in the future. This result may also be important to consumers seeking products with specific organisms in them.

4.4. Lactic Acid Bacteria in Kombucha Fermentation

The bacterial communities were either dominated by Lactobacillales and Acetobacterales or a more equal mix of the two. The role of Acetobacterales in kombucha fermentation has been better documented and characterized [65,66], whereas the importance of lactic acid bacteria in kombucha fermentation is evolving. A 2014 study was the first to highlight the potential importance of lactic acid bacteria in kombucha fermentation, which comprised up to 30% relative abundance in some lab-scale kombucha trials, especially in the later stages of fermentation [63]. Since then, other next-generation sequencing studies have detected large relative abundances of lactic acid bacteria in kombucha during commercial fermentation, specifically Oenococcus oeni, Lactobacillus nagelii, and a Leuconostoc sp. [24]; commercial kombucha cultures used as inoculum for unfermented tea, specifically Lactobacillus spp. [25]; and most recently, in commercially available finished kombucha products, specifically Lactobacillus mali [26].
Our study further reiterates the point that lactic acid bacteria may play a significant role in commercial kombucha fermentation, as we found greater than 50% relative abundance of Lactobacillus in several samples from brand four and some of the samples from brand two, namely Lactobacillus nagelii and Lactobacillus vini, and greater than 50% relative abundance of Oenococcus oeni in brand one. These species were also identified from PERMANOVA analysis as most positively correlated with the lactic acid content of the samples (Figure 5). Additionally, our study found a significant correlation between the relative abundance of Lactobacillales and the amount of lactic acid in the samples (Figure 6) (Kendall correlation test, p < 0.05).
These results suggest that lactic acid bacteria in kombucha fermentation may have an impact on the resulting sensory characteristics of those products. Acetic acid and lactic acid have different tastes, which presents the possibility for consumer preferences and brand choice based on these tastes. Future studies could utilize trained sensory panelists and consumer preference testing to aid in determining the sensory impacts of lactic acid bacteria inclusion during kombucha brewing. In the future, it may be possible for kombucha brewers to purchase commercially available cultures, some of which result in more lactic acid forward brews and others that result in more acetic acid forward brews. This evolving story of lactic acid bacteria in kombucha fermentation is a good example of how next-generation sequencing can inform the food industry of complex microbial systems.

4.5. Fungal Community Analyses

Dekkera bruxellensis was the most abundant (mean abundance) fungal species across all samples. Although we did not identify specific taxa associated with high ethanol content when controlling for the brand, Dekkera bruxellensis was present in relatively high abundance in both brands, which exceeded 0.5% ethanol (v/v). Some Dekkera strains were found to produce ethanol at a rate comparable to that of Saccharomyces cerevisiae using a wide range of substrates under oxygen-limiting and low pH conditions in a study investigating the production of industrial ethanol from lignocellulosic hydrolases [67]. Furthermore, Dekkera bruxellensis and Lactobacillus vini were found to co-dominate industrial Swedish ethanol fermentation [68], which may extend to other Lactobacilli, as we observed for brand four. Unfortunately, the factors that make Brettanomyces (anamorph form of Dekkera) yeasts favorable for industrial ethanol fermentation also make them favorable for producing ethanol in kombucha.
An important feature of Brettanomyces, like Saccharomyces cerevisiae, is that it is Crabtree positive, thereby repressing aerobic respiration in the presence of a sufficient fermentable carbon source [69], much like the addition of sweetened tea to a kombucha culture. In addition to ethanol, Brettanomyces bruxellensis produces acetic acid, and the amount of acetic acid versus ethanol produced depends on aeration [70]. There is likely significant strain variation in fungal and bacterial species present in the commercial kombucha industry, drastically affecting the outcome of such biochemical processes and the resulting ethanol content of the products. Alas, Dekkera bruxellensis was observed in a high proportion in the samples acquired from brand two, which did not have a high ethanol content. In one study, overexpression of ADH3 in genetically engineered Brettanomyces yielded 1.2–1.5 times the amount of ethanol and reduced the inhibition of fermentation that occurs in some strains of Brettanomyces under anaerobic conditions [71]. With such a low tolerable ethanol allowance in commercial kombucha products (0.5% v/v), such strain variations would have a significant impact on determining whether kombucha producers comply with TTB regulations.

5. Conclusions

We were unable to identify specific species correlated with high ethanol content samples but did observe a significant correlation between Lactobacillales relative abundance and lactic acid content. It is unlikely that the mere presence or absence of certain microbial species can be used to diagnose whether kombucha will contain a high or low amount of ethanol. Rather, the use and management of specific strains used under controlled fermentation is the best long-term option for controlling the ethanol content of kombucha products. We predict that within the next decade, culture houses will sell industrial microbiologically defined kombucha cultures producing specific sensory attributes much the same as beer brewers, and winemakers use specific yeast strains to yield specific characteristics in their products. In the short term, the use of proven food processing technologies such as high-pressure processing, pasteurization, or filtration will allow producers to use the cultures they presently have without registering with the TTB or investing in expensive dealcoholizing equipment.

Supplementary Materials

The following supporting information can be downloaded at: https://www.mdpi.com/article/10.3390/fermentation10080385/s1, Supplementary Material 1: Word document containing Supplementary Figures S1–S4. Supplementary Data 1: CSV file containing sample metadata, including sample descriptors, chemical data, and microbiological data. Supplementary Data 2.1: FASTA file containing finished 16S V3-V4 sequences assembled with Dada2 from Illumina MiSeq V2 kit paired-end read data. Supplementary Data 2.2: FASTA file containing finished ITS2 sequences assembled with Dada2 from the Illumina MiSeq V2 kit forward-read data. Supplementary Data 2.3: FASTA file containing finished ITS2 sequences assembled with Dada2 from Illumina MiSeq V2 kit paired-end read data.

Author Contributions

Contributor Roles Taxonomy (CRediT). J.H.S.: Conceptualization, Methodology, Software, Validation, Formal analysis, Investigation, Data Curation, Writing—Original Draft, Writing—Review and Editing, Visualization, Project administration, Funding acquisition. R.W.W.: Conceptualization, Resources, Writing—Review and Editing, Supervision, Funding acquisition. All authors have read and agreed to the published version of the manuscript.

Funding

This study was supported by the United States Department of Agriculture, National Institute of Food and Agriculture, AFRI-EWD predoctoral fellowship 2022-67011-36459, and Multistate Research Fund S-1077; and the New York State College of Agriculture and Life Sciences at Cornell University. The funding sources did not influence the design of the study or the collection, analysis, or interpretation of data, nor did they influence the writing of the manuscript or the decision to submit the manuscript for publication.

Institutional Review Board Statement

Not applicable.

Informed Consent Statement

Not applicable.

Data Availability Statement

Sample metadata and raw sequencing data were deposited in the US National Center for Biotechnology Information (NCBI) under BioProject number PRJNA951001 and Sequence Read Archives SRR24037360-460. Sample metadata are also included in this manuscript as Supplementary Data 1. The processed DNA sequences from 16S, ITS single-end, and ITS paired-end data analyses are included in Supplementary Data 2.1–2.3. Codes used to analyze the data are available at https://github.com/jsogin574/Sogin_and_Worobo_Kombucha_2024, accessed on 30 June 2024.

Acknowledgments

Sequencing was performed by the Biotechnology Resource Center (BRC) Genomics Facility (RRID:SCR_021727) at the Cornell Institute of Biotechnology (http://www.biotech.cornell.edu/brc/genomics-facility).

Conflicts of Interest

The authors declare that the research was conducted in the absence of any commercial or financial relationships that could be construed as potential conflicts of interest.

References

  1. Greenwalt, C.J.; Steinkraus, K.H.; Ledford, R.A. Kombucha, the Fermented Tea: Microbiology, Composition, and Claimed Health Effects. J. Food Prot. 2000, 63, 976–981. [Google Scholar] [CrossRef] [PubMed]
  2. Sievers, M.; Lanini, C.; Weber, A.; Schuler-Schmid, U.; Teuber, M. Microbiology and Fermentation Balance in a Kombucha Beverage Obtained from a Tea Fungus Fermentation. Syst. Appl. Microbiol. 1995, 18, 590–594. [Google Scholar] [CrossRef]
  3. Le, T. Kombucha Production in the US; IBISWorld: New York, NY, USA, 2021. [Google Scholar]
  4. Srivastava, N. Patent Insights: Fermented Ingredients in Food & Drink; Mintel: London, UK, 2021. [Google Scholar]
  5. Srivastava, N. Patent Insights: Gut Health For Holistic Wellbeing; Mintel: London, UK, 2023. [Google Scholar]
  6. Kapp, J.M.; Sumner, W. Kombucha: A Systematic Review of the Empirical Evidence of Human Health Benefit. Ann. Epidemiol. 2019, 30, 66–70. [Google Scholar] [CrossRef] [PubMed]
  7. Steinberg, J. Whole Foods, Millennium Sued Over Kombucha Drinks. Bloomberg Law News, 18 November 2015. [Google Scholar]
  8. Steinberg, J. Brew Dr. Kombucha Overstated Probiotic Content, Suit Says. Bloomberg Law News, 17 October 2019. [Google Scholar]
  9. Steinberg, J. O Organics Kombucha Deceptively Sold as Non-Alcoholic, Suit Says. Bloomberg Law News, 11 April 2019. [Google Scholar]
  10. Steinberg, J. Health-Ade Kombucha Suit Alleges Sugar Belies Healthful Name. Bloomberg Law News, 8 October 2021. [Google Scholar]
  11. Steinberg, J. Tribucha ‘Non-Alcoholic’ Kombucha Over the Limit, Suit Says (1). Bloomberg Law News, 7 October 2022. [Google Scholar]
  12. Talebi, M.; Frink, L.A.; Patil, R.A.; Armstrong, D.W. Examination of the Varied and Changing Ethanol Content of Commercial Kombucha Products. Food Anal. Methods 2017, 10, 4062–4067. [Google Scholar] [CrossRef]
  13. DOT TTB Beer: Meaning of Terms, 27 CFR § 25.11. Code of Federal Regulations. Alcohol 2021. Available online: https://www.ecfr.gov/current/title-27/chapter-I/subchapter-A/part-25/subpart-B/section-25.11 (accessed on 30 June 2024).
  14. DOT TTB Beer: Materials for the Production of Beer, 27 CFR § 25.15. Code of Federal Regulations. Alcohol 2021. Available online: https://www.ecfr.gov/current/title-27/chapter-I/subchapter-A/part-25/subpart-B/section-25.15 (accessed on 30 June 2024).
  15. Alcohol and Tobacco Tax and Trade Bureau. Kombucha. Available online: https://www.ttb.gov/kombucha (accessed on 3 April 2023).
  16. Anderson, P.; Kokole, D.; Llopis, E.J. Production, Consumption, and Potential Public Health Impact of Low- and No-Alcohol Products: Results of a Scoping Review. Nutrients 2021, 13, 3153. [Google Scholar] [CrossRef] [PubMed]
  17. Faruque, S.; Tong, J.; Lacmanovic, V.; Agbonghae, C.; Minaya, D.; Czaja, K. The Dose Makes the Poison: Sugar and Obesity in the United States—A Review. Pol. J. Food Nutr. Sci. 2019, 69, 219–233. [Google Scholar] [CrossRef] [PubMed]
  18. Malik, V.S.; Popkin, B.M.; Bray, G.A.; Després, J.-P.; Hu, F.B. Sugar-Sweetened Beverages, Obesity, Type 2 Diabetes Mellitus, and Cardiovascular Disease Risk. Circulation 2010, 121, 1356–1364. [Google Scholar] [CrossRef]
  19. Laquatra, I.; Sollid, K.; Smith Edge, M.; Pelzel, J.; Turner, J. Including “Added Sugars” on the Nutrition Facts Panel: How Consumers Perceive the Proposed Change. J. Acad. Nutr. Diet. 2015, 115, 1758–1763. [Google Scholar] [CrossRef]
  20. DHHS FDA Food Labeling, 21 CFR § 101. Code of Federal Regulations. In Food for Human Consumption; 2022. Available online: https://www.ecfr.gov/current/title-21/chapter-I/subchapter-B/part-101 (accessed on 30 June 2024).
  21. Degnan, F.H. The US Food and Drug Administration and Probiotics: Regulatory Categorization. Clin. Infect. Dis. 2008, 46, S133–S136. [Google Scholar] [CrossRef]
  22. Hill, C.; Guarner, F.; Reid, G.; Gibson, G.R.; Merenstein, D.J.; Pot, B.; Morelli, L.; Canani, R.B.; Flint, H.J.; Salminen, S.; et al. The International Scientific Association for Probiotics and Prebiotics Consensus Statement on the Scope and Appropriate Use of the Term Probiotic. Nat. Rev. Gastroenterol. Hepatol. 2014, 11, 506–514. [Google Scholar] [CrossRef] [PubMed]
  23. Marco, M.L.; Sanders, M.E.; Gänzle, M.; Arrieta, M.C.; Cotter, P.D.; De Vuyst, L.; Hill, C.; Holzapfel, W.; Lebeer, S.; Merenstein, D.; et al. The International Scientific Association for Probiotics and Prebiotics (ISAPP) Consensus Statement on Fermented Foods. Nat. Rev. Gastroenterol. Hepatol. 2021, 18, 196–208. [Google Scholar] [CrossRef] [PubMed]
  24. Coton, M.; Pawtowski, A.; Taminiau, B.; Burgaud, G.; Deniel, F.; Coulloumme-Labarthe, L.; Fall, A.; Daube, G.; Coton, E. Unraveling Microbial Ecology of Industrial-Scale Kombucha Fermentations by Metabarcoding and Culture-Based Methods. FEMS Microbiol. Ecol. 2017, 93, fix048. [Google Scholar] [CrossRef]
  25. Harrison, K.; Curtin, C. Microbial Composition of SCOBY Starter Cultures Used by Commercial Kombucha Brewers in North America. Microorganisms 2021, 9, 1060. [Google Scholar] [CrossRef]
  26. Yang, J.; Lagishetty, V.; Kurnia, P.; Henning, S.M.; Ahdoot, A.I.; Jacobs, J.P. Microbial and Chemical Profiles of Commercial Kombucha Products. Nutrients 2022, 14, 670. [Google Scholar] [CrossRef]
  27. Drysdale, G.S.; Fleet, G.H. Acetic Acid Bacteria in Winemaking: A Review. Am. J. Enol. Vitic. 1988, 39, 143–154. [Google Scholar] [CrossRef]
  28. De Man, J.C.; Rogosa, M.; Sharpe, M.E. A Medium for the Cultivation of Lactobacilli. J. Appl. Bacteriol. 1960, 23, 130–135. [Google Scholar] [CrossRef]
  29. Herlemann, D.P.R.; Labrenz, M.; Jürgens, K.; Bertilsson, S.; Waniek, J.J.; Andersson, A.F. Transitions in Bacterial Communities along the 2000 Km Salinity Gradient of the Baltic Sea. ISME J. 2011, 5, 1571–1579. [Google Scholar] [CrossRef]
  30. Klindworth, A.; Pruesse, E.; Schweer, T.; Peplies, J.; Quast, C.; Horn, M.; Glöckner, F.O. Evaluation of General 16S Ribosomal RNA Gene PCR Primers for Classical and Next-Generation Sequencing-Based Diversity Studies. Nucleic Acids Res. 2013, 41, e1. [Google Scholar] [CrossRef]
  31. White, T.J.; Bruns, T.; Lee, S.; Taylor, J. Amplification and Direct Sequencing of Fungal Ribosomal RNA Genes for Phylogenetics. In PCR Protocols; Elsevier: Amsterdam, Netherlands, 1990; pp. 315–322. [Google Scholar]
  32. Tedersoo, L.; Lindahl, B. Fungal Identification Biases in Microbiome Projects. Environ. Microbiol. Rep. 2016, 8, 774–779. [Google Scholar] [CrossRef]
  33. Nilsson, R.H.; Anslan, S.; Bahram, M.; Wurzbacher, C.; Baldrian, P.; Tedersoo, L. Mycobiome Diversity: High-Throughput Sequencing and Identification of Fungi. Nat. Rev. Microbiol. 2019, 17, 95–109. [Google Scholar] [CrossRef]
  34. Kozich, J.J.; Westcott, S.L.; Baxter, N.T.; Highlander, S.K.; Schloss, P.D. Development of a Dual-Index Sequencing Strategy and Curation Pipeline for Analyzing Amplicon Sequence Data on the MiSeq Illumina Sequencing Platform. Appl. Environ. Microbiol. 2013, 79, 5112–5120. [Google Scholar] [CrossRef] [PubMed]
  35. R Core Team. R: A Language and Environment for Statistical Computing; R Foundation for Statistical Computing: Vienna, Austria, 2022. [Google Scholar]
  36. Posit team RStudio: Integrated Development Environment for R 2023. Available online: https://support.posit.co/hc/en-us/articles/206212048-Citing-RStudio (accessed on 30 June 2024).
  37. Ushey, K. Renv: Project Environments 2022. Available online: https://rstudio.github.io/renv/authors.html#citation (accessed on 30 June 2024).
  38. Hothorn, T.; Bretz, F.; Westfall, P. Simultaneous Inference in General Parametric Models. Biom. J. 2008, 50, 346–363. [Google Scholar] [CrossRef] [PubMed]
  39. Bolyen, E.; Rideout, J.R.; Dillon, M.R.; Bokulich, N.A.; Abnet, C.C.; Al-Ghalith, G.A.; Alexander, H.; Alm, E.J.; Arumugam, M.; Asnicar, F.; et al. Reproducible, Interactive, Scalable and Extensible Microbiome Data Science Using QIIME 2. Nat. Biotechnol. 2019, 37, 852–857. [Google Scholar] [CrossRef] [PubMed]
  40. Martin, M. Cutadapt Removes Adapter Sequences from High-Throughput Sequencing Reads. EMBnet J. 2011, 17, 10. [Google Scholar] [CrossRef]
  41. Callahan, B.J.; McMurdie, P.J.; Rosen, M.J.; Han, A.W.; Johnson, A.J.A.; Holmes, S.P. DADA2: High-Resolution Sample Inference from Illumina Amplicon Data. Nat. Methods 2016, 13, 581–583. [Google Scholar] [CrossRef] [PubMed]
  42. Bokulich, N.A.; Kaehler, B.D.; Rideout, J.R.; Dillon, M.; Bolyen, E.; Knight, R.; Huttley, G.A.; Gregory Caporaso, J. Optimizing Taxonomic Classification of Marker-Gene Amplicon Sequences with QIIME 2’s Q2-Feature-Classifier Plugin. Microbiome 2018, 6, 90. [Google Scholar] [CrossRef] [PubMed]
  43. Quast, C.; Pruesse, E.; Yilmaz, P.; Gerken, J.; Schweer, T.; Yarza, P.; Peplies, J.; Glöckner, F.O. The SILVA Ribosomal RNA Gene Database Project: Improved Data Processing and Web-Based Tools. Nucleic Acids Res. 2012, 41, D590–D596. [Google Scholar] [CrossRef] [PubMed]
  44. Yilmaz, P.; Parfrey, L.W.; Yarza, P.; Gerken, J.; Pruesse, E.; Quast, C.; Schweer, T.; Peplies, J.; Ludwig, W.; Glöckner, F.O. The SILVA and “All-Species Living Tree Project (LTP)” Taxonomic Frameworks. Nucleic Acids Res. 2014, 42, D643–D648. [Google Scholar] [CrossRef]
  45. Robeson, M.S.; O’Rourke, D.R.; Kaehler, B.D.; Ziemski, M.; Dillon, M.R.; Foster, J.T.; Bokulich, N.A. RESCRIPt: Reproducible Sequence Taxonomy Reference Database Management. PLoS Comput. Biol. 2021, 17, e1009581. [Google Scholar] [CrossRef]
  46. Nilsson, R.H.; Larsson, K.H.; Taylor, A.F.S.; Bengtsson-Palme, J.; Jeppesen, T.S.; Schigel, D.; Kennedy, P.; Picard, K.; Glöckner, F.O.; Tedersoo, L.; et al. The UNITE Database for Molecular Identification of Fungi: Handling Dark Taxa and Parallel Taxonomic Classifications. Nucleic Acids Res. 2019, 47, D259–D264. [Google Scholar] [CrossRef]
  47. McMurdie, P.J.; Holmes, S. Phyloseq: An R Package for Reproducible Interactive Analysis and Graphics of Microbiome Census Data. PLoS ONE 2013, 8, e61217. [Google Scholar] [CrossRef] [PubMed]
  48. Davis, N.M.; Proctor, D.M.; Holmes, S.P.; Relman, D.A.; Callahan, B.J. Simple Statistical Identification and Removal of Contaminant Sequences in Marker-Gene and Metagenomics Data. Microbiome 2018, 6, 226. [Google Scholar] [CrossRef] [PubMed]
  49. Smirnova, E.; Huzurbazar, S.; Jafari, F. PERFect: PERmutation Filtering Test for Microbiome Data. Biostatistics 2019, 20, 615–631. [Google Scholar] [CrossRef]
  50. Oksanen, J.; Simpson, G.L.; Blanchet, F.G.; Kindt, R.; Legendre, P.; Minchin, P.R.; O’Hara, R.B.; Solymos, P.; Stevens, M.H.H.; Szoecs, E.; et al. Package ‘vegan’. Community Ecology Package, Version 2.6-6.1. 2022. Available online: https://cran.r-project.org/web/packages/vegan/index.html (accessed on 30 June 2024).
  51. Lahti, L.; Shetty, S. Microbiome R Package. Bioconductor 2019, 10, B9. [Google Scholar] [CrossRef]
  52. Kurtz, Z.D.; Müller, C.L.; Miraldi, E.R.; Littman, D.R.; Blaser, M.J.; Bonneau, R.A. Sparse and Compositionally Robust Inference of Microbial Ecological Networks. PLoS Comput. Biol. 2015, 11, 1004226. [Google Scholar] [CrossRef]
  53. Chen, J.; Bittinger, K.; Charlson, E.S.; Hoffmann, C.; Lewis, J.; Wu, G.D.; Collman, R.G.; Bushman, F.D.; Li, H. Associating Microbiome Composition with Environmental Covariates Using Generalized UniFrac Distances. Bioinformatics 2012, 28, 2106–2113. [Google Scholar] [CrossRef]
  54. Yang, L.; Chen, J. A Comprehensive Evaluation of Microbial Differential Abundance Analysis Methods: Current Status and Potential Solutions. Microbiome 2022, 10, 130. [Google Scholar] [CrossRef]
  55. Kassambara, A. Ggpubr: “ggplot2” Based Publication Ready Plots 2023. Available online: https://rpkgs.datanovia.com/ggpubr/authors.html#citation (accessed on 30 June 2024).
  56. Wilke, C.O.; Wiernik, B.M. Ggtext: Improved Text Rendering Support for “Ggplot2” 2022. Available online: https://cran.r-project.org/web/packages/ggtext/index.html (accessed on 30 June 2024).
  57. Campitelli, E. Ggnewscale: Multiple Fill and Colour Scales in “Ggplot2” 2022. Available online: https://cran.r-project.org/web/packages/ggnewscale/index.html (accessed on 30 June 2024).
  58. Csárdi, G.; Nepusz, T. The Igraph Software Package for Complex Network Research. Inter. J. Complex Syst. 2006, 1695, 1–9. [Google Scholar]
  59. Briatte, F. Ggnetwork: Geometries to Plot Networks with “Ggplot2” 2023. Available online: https://cran.r-project.org/web/packages/ggnetwork/index.html (accessed on 30 June 2024).
  60. Bray, J.R.; Curtis, J.T. An Ordination of the Upland Forest Communities of Southern Wisconsin. Ecol. Monogr. 1957, 27, 325–349. [Google Scholar] [CrossRef]
  61. Anderson, M.J. Permutational Multivariate Analysis of Variance (PERMANOVA). In Wiley StatsRef: Statistics Reference Online; Wiley: New York, NY, USA, 2017; pp. 1–15. [Google Scholar] [CrossRef]
  62. Kaashyap, M.; Cohen, M.; Mantri, N. Microbial Diversity and Characteristics of Kombucha as Revealed by Metagenomic and Physicochemical Analysis. Nutrients 2021, 13, 4446. [Google Scholar] [CrossRef]
  63. Marsh, A.J.; O’Sullivan, O.; Hill, C.; Ross, R.P.; Cotter, P.D. Sequence-Based Analysis of the Bacterial and Fungal Compositions of Multiple Kombucha (Tea Fungus) Samples. Food Microbiol. 2014, 38, 171–178. [Google Scholar] [CrossRef] [PubMed]
  64. Arıkan, M.; Mitchell, A.L.; Finn, R.D.; Gürel, F. Microbial Composition of Kombucha Determined Using Amplicon Sequencing and Shotgun Metagenomics. J. Food Sci. 2020, 85, 455–464. [Google Scholar] [CrossRef]
  65. May, A.; Narayanan, S.; Alcock, J.; Varsani, A.; Maley, C.; Aktipis, A. Kombucha: A Novel Model System for Cooperation and Conflict in a Complex Multi-Species Microbial Ecosystem. PeerJ 2019, 7, e7565. [Google Scholar] [CrossRef] [PubMed]
  66. Wang, B.; Rutherfurd-Markwick, K.; Zhang, X.-X.; Mutukumira, A.N. Kombucha: Production and Microbiological Research. Foods 2022, 11, 3456. [Google Scholar] [CrossRef] [PubMed]
  67. Galafassi, S.; Merico, A.; Pizza, F.; Hellborg, L.; Molinari, F.; Piškur, J.; Compagno, C. Dekkera/Brettanomyces Yeasts for Ethanol Production from Renewable Sources under Oxygen-Limited and Low-PH Conditions. J. Ind. Microbiol. Biotechnol. 2011, 38, 1079–1088. [Google Scholar] [CrossRef] [PubMed]
  68. Passoth, V.; Blomqvist, J.; Schnürer, J. Dekkera Bruxellensis and Lactobacillus Vini Form a Stable Ethanol-Producing Consortium in a Commercial Alcohol Production Process. Appl. Environ. Microbiol. 2007, 73, 4354–4356. [Google Scholar] [CrossRef] [PubMed]
  69. Menoncin, M.; Bonatto, D. Molecular and Biochemical Aspects of Brettanomyces in Brewing. J. Inst. Brew. 2019, 125, 402–411. [Google Scholar] [CrossRef]
  70. Aguilar Uscanga, M.G.; Délia, M.-L.; Strehaiano, P. Brettanomyces Bruxellensis: Effect of Oxygen on Growth and Acetic Acid Production. Appl. Microbiol. Biotechnol. 2003, 61, 157–162. [Google Scholar] [CrossRef]
  71. Schifferdecker, A.J.; Siurkus, J.; Andersen, M.R.; Joerck-Ramberg, D.; Ling, Z.; Zhou, N.; Blevins, J.E.; Sibirny, A.A.; Piškur, J.; Ishchuk, O.P. Alcohol Dehydrogenase Gene ADH3 Activates Glucose Alcoholic Fermentation in Genetically Engineered Dekkera Bruxellensis Yeast. Appl. Microbiol. Biotechnol. 2016, 100, 3219–3231. [Google Scholar] [CrossRef]
Figure 1. Physiochemical properties of samples within brands. % Ethanol (v/v) (panel A) and relative sugar content versus product labels (decimal fraction) (panel B). Asterisks indicate the statistical significance of t-tests for brands having greater than 0.5% ethanol and greater or less sugar content (two-sided, relative difference) vs. the label. * p < 0.05; ** p < 0.01; *** p < 0.001.
Fermentation 10 00385 g001
Figure 2. Microbial loads of bacteria and yeasts on GYC, MRS, and APDA media. GYC and MRS media contained 200 ppm natamycin to prevent the growth of yeasts. Brand 6 contained the added probiotic Bacillus subtilis that obscured counts on GYC; brand 3 contained the added probiotic Bacillus coagulans that obscured counts on MRS. Different letters within a media type indicate statistically different microbial loads between brands (Tukey’s HSD, p < 0.05). No pairwise comparisons were made between different media types; pairwise comparison letters are unique to each medium.
Fermentation 10 00385 g002
Figure 3. Relative abundance (decimal fraction) of bacterial genera in individual samples grouped by brand. The top plot shows samples before adjunct cultures were removed, and the bottom plot shows samples after adjunct culture removal. Only genera present at mean relative abundance > 1.0% across all samples were plotted; other genera were collapsed into ‘other’. Plotted from genus-agglomerated proportion data.
Fermentation 10 00385 g003
Figure 4. Nonmetric multidimensional scaling ordination of bacterial Bray–Curtis dissimilarities of samples grouped by brand. Coloring of points indicates the % ethanol (v/v) in the samples; green indicates < 0.05%, whereas red indicates > 0.05%. Species with a mean relative abundance > 1.0% across samples are also ordinated too. UR preceding the species name indicates the OTU was taxonomically unresolved; the four-character hash is unique to the specific OTU. Bray–Curtis dissimilarities were calculated between all samples from the species-agglomerated proportion data.
Fermentation 10 00385 g004
Figure 5. Top ten (absolute value) bacterial species coefficients associated with community dissimilarity due to lactic acid content, as determined by PERMANOVA analysis. UR preceding the species name indicates the OTU was taxonomically unresolved; the four-character hash is unique to the specific OTU. Bray–Curtis dissimilarities were calculated between all samples from species-agglomerated proportion data.
Fermentation 10 00385 g005
Figure 6. Correlation between the relative abundance (decimal fraction) of Lactobacillales order and lactic acid content (g/L) in kombucha samples. The R2 value corresponds to the fit of the plotted linear regression. The p value corresponds to the significance of the correlation calculated by a Kendall correlation test.
Fermentation 10 00385 g006
Figure 7. Relative abundances (decimal fractions) of fungal species in individual samples grouped by brand. Only species present at mean relative abundance > 1.0% across all samples were plotted; other species were collapsed into ‘other’. UR preceding the species name indicates the OTU was taxonomically unresolved; the four-character hash is unique to the specific OTU. Plotted from species-agglomerated proportion data.
Fermentation 10 00385 g007
Figure 8. Nonmetric multidimensional scaling ordination of fungal Bray–Curtis dissimilarities of samples grouped by brand. Coloring of points indicates the % ethanol (v/v) in the samples; green indicates < 0.5%, whereas red indicates > 0.5%. Species with mean relative abundance > 1.0% across samples are ordinated too. UR preceding the species name indicates the OTU was taxonomically unresolved; the four-character hash is unique to the specific OTU. Bray–Curtis dissimilarities were calculated between all samples from species-agglomerated proportion data.
Fermentation 10 00385 g008
Figure 9. Co-occurrence network of bacterial and fungal species computed using SPIEC-EASI. All observed co-occurrences are shown. Node color corresponds to the bacterial or fungal genera of each species node; similarly, letters within the nodes correspond to the first letter of the genus listed. Node shape corresponds to the node kingdom: bacteria—circles, fungi—squares. Edge color and type correspond to positive or negative co-occurrences: solid black—positive co-occurrences, dashed purple—negative co-occurrence. Line width corresponds to the strength of co-occurrence. Line opacity corresponds to the edge stability of 1000 subsampling repetitions. UR preceding the genus name indicates the OTU was taxonomically unresolved.
Fermentation 10 00385 g009
Table 1. Selected metabolite levels in kombucha collected from six brands.
Blinded Brandn% Ethanol
(v/v)
pH Lactic Acid
(g/L)
Acetic Acid
(g/L)
Total Sugar
(g/L)
180.27 a
[−0.086–0.63] b
3.3
[3.1–3.5]
0.27
[0.097–0.45]
2.1
[1.6–2.7]
23
[19–28]
280.20
[0.15–0.25]
3.1
[3.0–3.3]
0.93
[0.28–1.6]
2.7
[−0.39–5.7]
27
[25–29]
3110.84
[0.66–1.0]
3.0
[2.8–3.1]
0.097
[0.075–0.12]
2.4
[2.1–2.8]
36
[32–40]
4100.75
[0.58–0.92]
3.1
[2.9–3.2]
0.80
[0.36–1.3]
1.3
[0.97–1.6]
32
[27–37]
530.39
[0.35–0.43]
3.7
[3.4–4.0]
0.093
[0.042–0.15]
0.32
[0.12–0.52]
20
[19–21]
670.12
[0.064–0.17]
3.1
[2.9–3.3]
n.d. c1.1
[0.87–1.3]
42
[37–47]
a Mean values; b 95% confidence interval; c Not detected.
Disclaimer/Publisher’s Note: The statements, opinions and data contained in all publications are solely those of the individual author(s) and contributor(s) and not of MDPI and/or the editor(s). MDPI and/or the editor(s) disclaim responsibility for any injury to people or property resulting from any ideas, methods, instructions or products referred to in the content.

