Article

Correlation between the Characteristic Flavour and Microbial Community of Xuanwei Ham after Ripening

1
Food Science College, Tibet Agriculture & Animal Husbandry University, Nyingchi 860000, China
2
Key Laboratory of Tibetan Medicine Resources Conservation and Utilization of Tibet Autonomous Region, Xizang Agriculture and Animal Husbandry University, Nyingchi 860000, China
3
Yunnan Yiji Food Co., Ltd., Wuhua, Kunming 650000, China
4
School of Information Engineering, Northwest A&F University, Xianyang 712100, China
*
Authors to whom correspondence should be addressed.
These authors contributed equally to this work.
Fermentation 2024, 10(8), 392; https://doi.org/10.3390/fermentation10080392
Submission received: 14 May 2024 / Revised: 8 July 2024 / Accepted: 22 July 2024 / Published: 30 July 2024
(This article belongs to the Special Issue Analysis of Quality and Sensory Characteristics of Fermented Products)

Abstract

:
Xuanwei ham is a traditional fermented meat product in China with a unique production process and excellent-quality reputation at home and abroad. To reveal the microbial community succession of Xuanwei ham at different post-ripening times (W1-4) and its relationship with flavour formation, the microbial community, free amino acids, and volatile flavour compounds (VOCs) were analysed by high-throughput sequencing, liquid chromatography (LC), and gas chromatography–mass spectrometry (GC-MS), respectively. A total of 25 free amino acids were detected, among which W3 contained the fewest, and most were generally lower than in hams in the other three years. Fifty-nine VOCs were detected, among which 17 were esters, and the highest ester content was found in W4. Analysis of the bacterial community composition revealed that the bacterial community composition of ham samples from W3 and other years differed greatly, and at the gate level, the dominant bacterial group of Xuanwei ham from different years was Pseudomonadota. At the genus level, the most abundant genera in W1, W2, and W4 were all dominated by Sarocladium, Klebsiella, and Vibrio, with Klebsiella being the most abundant in W1. The most abundant genus in W3 was Vibrio, and the second most dominant genera were Sarocladium and Gammaretrovirus. In short, this study provides a theoretical basis for the storage, quality, and improvement of Xuanwei ham.

1. Introduction

Xuanwei ham, a traditionally famous specialty product of Yunnan Province, has a history of more than two hundred and seventy years [1] and is favoured by consumers for its delicious taste, rich nutrition, and strong aroma [2]. Xuanwei ham is mainly made from Wujin pigs in the Xuanwei area, which are prepared by trimming, salting, and air-drying under the unique geographical and natural conditions of the Wumeng Mountain area of the Yunnan–Guizhou Plateau. Unique fermentation conditions and a dry-curing process create the unique flavour and texture of Xuanwei ham [3,4].
Microorganisms play an important role in the flavour formation and preservation of fermented meat products. Li [5] et al. and Wang [6] et al., in exploring the relationship between microbial communities and VOCs in dry-cured hams of different quality grades, both found that microbial communities and VOCs were richer in high-quality hams than in poor-quality hams and that the content of aldehydes and alcohols in poor-quality hams was significantly higher than that in high-quality hams (p < 0.05). During the fermentation of meat products, microorganisms induce a series of biochemical reactions, such as protein hydrolysis, amino acid degradation, lipolysis, and lipid oxidation [7], that promote the production and accumulation of aromatic compounds to enhance meat product flavour and quality [8]. During processing, fat is hydrolysed to form free fatty acids under the action of phosphatases and endogenous enzymes, leading to an increase in free fatty acid content [9]. Xuanwei ham, as a typical fermented meat product, is often evaluated by its maturity period to assess quality, and it is generally believed that the longer the maturity period, the better the quality, with a greater accumulation of flavour components [10]. Li [11] et al., in revealing the intrinsic relationship between microbial communities and physicochemical properties during Xuanwei ham maturation, showed that hams with a long maturity period scored the highest marks in colour, texture, flavour, aroma, and acceptability.
It is well known that microorganisms and endogenous enzymes are important ham quality and flavour determinants [12,13]. In fermented fish, Wang [14] et al. explored the potential influence of microorganisms on flavour formation by exploring the relationships between microbial diversity and changes in flavour components. Both Zhong [15] and Deng [16] found that Staphylococcus was associated with most of the flavour changes in sour pork and Jinhua ham by high-throughput sequencing. Staphylococcus, Penicillium, and Lactobacillus were also mentioned by Li [17] et al. as being essential in the formation of ham flavour. However, the relationship between Xuanwei ham flavour changes after ripening and its microbial community remains unclear.
We used gas chromatography–mass spectrometry (GC-MS) and high-throughput sequencing to determine the VOCs and microbial community structure of Xuanwei ham from different years (1, 2, 3, and 4 years), as well as the relationships between dominant bacterial groups and flavour substances, to explore microbial influence on flavour. This could be significant for improving ham stability and quality during production to better understand the relationships between microorganisms and ham flavour.

2. Materials and Methods

2.1. Materials and Reagents

Three pieces of Xuanwei ham aged 1, 2, 3, and 4 years, processed from Wujin pigs reared from the same litter and of the same age and similar weight, were purchased from Xuanwei Yi-ji Foods Co. (Kunming, China). The hind legs of six pigs were taken as raw materials after slaughtering, and the average leg weight was 17.62 ± 0.66 kg. Processing was carried out according to the technical regulations of Xuanwei ham production including trimming and shaping, salting and curing, stacking and turning, washing and sunshine shaping, hanging and air-drying, and fermentation management. The processing time was from December 2019 to December 2023, during which 3 Xuanwei hams were randomly selected each year. The aim was to ensure that each sample of Xuanwei ham selected was representative and from different batches or sources to reduce the possible chance of bias. The biceps femoris (BF) was taken as a sample, and it was vacuum-packed after sampling and stored in a refrigerator at −80 °C for the determination of VOCs; o-phthalaldehyde (OPA) (analytically pure, sigma, Shanghai, China); FMOC (analytically pure, sigma); 3-mercaptopropionic acid (analytically pure, sigma); concentrated hydrochloric acid (analytically pure, Guangzhou Chemical Reagent Factory, Guangzhou, China); boric acid (analytically pure, Guangzhou Chemical Reagent Factory); sodium hydroxide (analytically pure, Guangzhou Chemical Reagent Factory); sodium dihydrogen phosphate dihydrate (analytically pure, Guang-zhou Chemical Reagent Factory); disodium hydrogen phosphate dodecahydrate (analytically pure, Guangzhou Chemical Reagent Factory); 17 kinds of amino acids, standard mix (2.5 µmol/mL, sigma); asparagine, glutamine, citrulline, and n-valine; tryptophan, 21-hydroxyproline, and standard sarcosine (analytical purity, sigma); methanol (chromato-graphic purity, CNW, Istanbul, Turkey); 2.5 mg/mL FMOC-Cl acetonitrile solution; and an o-phthalaldehyde (OPA) solution.

2.2. Instruments and Equipment

The instruments used were a constant temperature magnetic stirrer (08-2T, Shanghai Meiyinpu Instrumentation Manufacturing Co., Ltd., Shanghai, China); solid-phase microextraction device (57330-U, supelco Shanghai, China); 50/30 μm DVB/CAR/PDMS solid-phase microextraction needles (57348-U, supelco Shanghai, China) gas chromatography–mass spectrometry (Agilent 6890N-5973 GC-MS, Santa Clara, CA, USA); gas chromatography column; HP-INNOWax (60 m × 250 μm × 0 25 μm, Shanghai, China); Agilent 1100 liquid chromatography); GC column; HP-INNOWax (60 m × 250 μm × 0.25 μm, Shanghai, China); and Agilent 1100 liquid chromatography (Santa Clara, CA, USA).

2.3. Experimental Methods

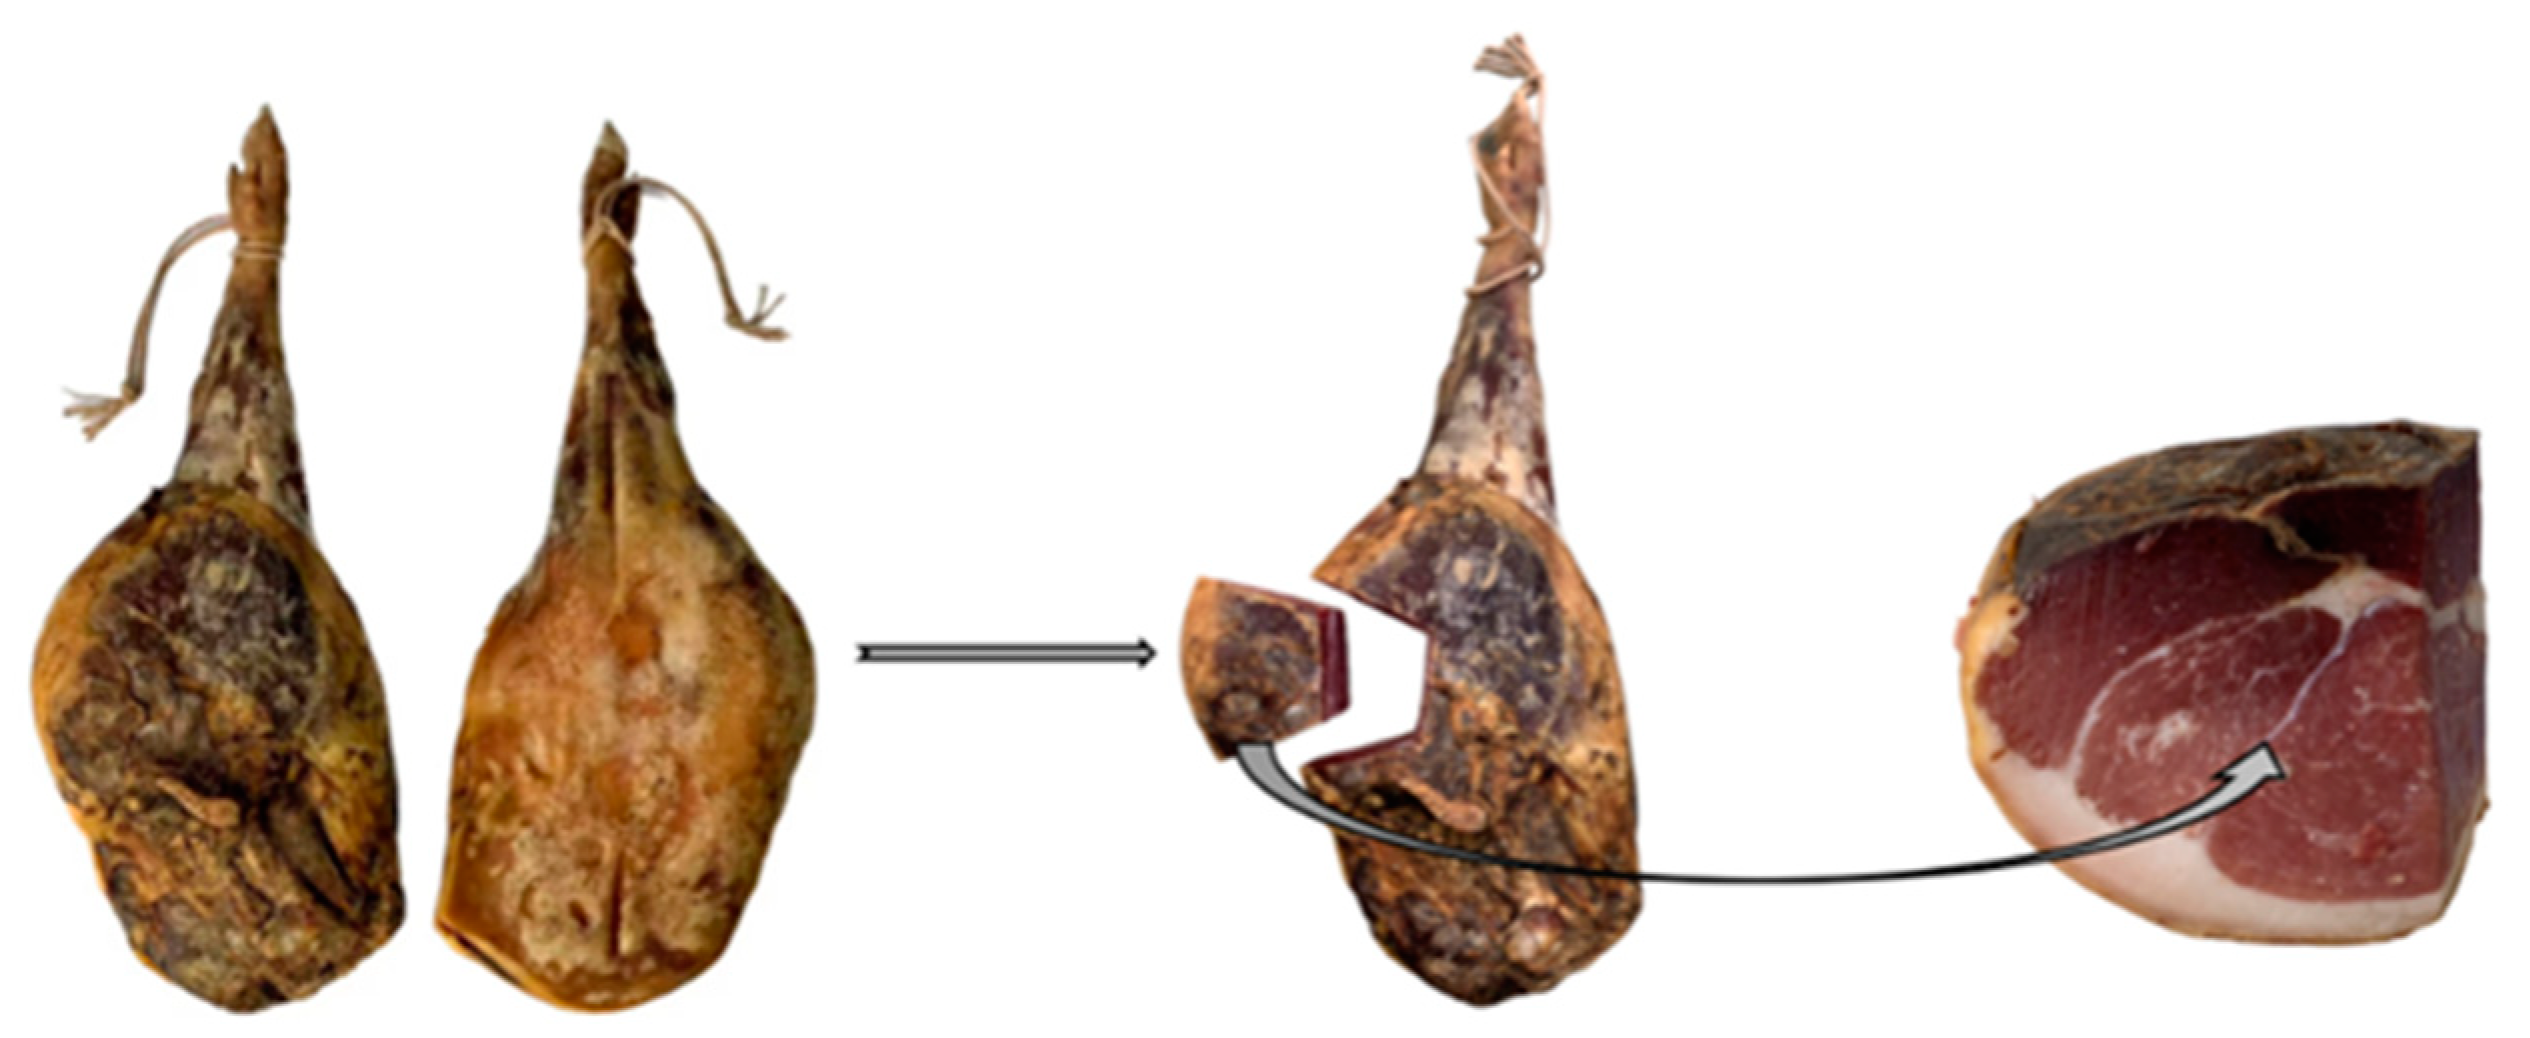
2.3.1. Sample Processing

The BF portion (biceps femoris) of Xuanwei ham was used as a sample after mould washing and trimming (Figure 1).

2.3.2. Free Amino Acid Content Determination

We followed the method of Qiu et al. [18]. Briefly, the ham was stirred, a 0.5 g sample was weighed and placed in a 10 mL centrifuge tube, and 5 mL of 0.01 mol/L hydrochloric acid (or purified water) was added. It was mixed and placed in a boiling water bath for 30 min, then centrifuged at 10,000 rpm for 10 min. The supernatant was retrieved, and the precipitate was added with another 4 mL of 0.01 mol/L hydrochloric acid suspension, ultrasonified for 5 min, centrifuged, combined with the supernatant, and fixed. It was then concentrated to 10 mL and measured by membrane. The resulting solution was derivatized with o-phthalaldehyde (OPA) for primary amino acids and fluorene-methoxycarbonyl chloride (FMOC) for secondary amino acids using Agilent’s automatic on-line derivatization method [19]. Chromatographic conditions: ZORBAX Eclipse AAA (4.6 × 150 mm, 3.5 μm); detection signals: UV 338 nm (0~19 min), 266 nm (19.01~25 min); mobile phase A: 40 mM sodium dihydrogen phosphate (pH 7.8); mobile phase B: acetonitrile/methanol/water = 45/45/10 flow rate: 1.0 mL/min; column temperature: 45 °C.

2.3.3. Taste Active Value (TAV) Calculation

The TAV value can indicate the degree of contribution of the taste substance to the overall taste of the sample [20]. TAV > 1 means that the substance has an important effect on the taste, and the larger the value, the larger the contribution; TAV < 1 means that it does not have an important effect on the taste. The calculation formula is as follows:
T A V = C T
where C is the content of the taste substance, mg/100 g; T is the threshold value of the taste substance, mg/100 g.

2.3.4. Volatile Flavour Content Determination

We followed the method of Cao [21] et al. Extraction conditions: A 5 g sample was weighed and placed into a 20 mL extraction vial; 100 µL of 2,4,6-trimethylpyridine (0.05 mg/mL) was added as the internal standard, sealed, and placed in a water bath at 85 °C with a magnetic stirring speed of 500 rpm, equilibrated for 20 min, then inserted into an extraction needle, and extracted for 30 min. Before using the extraction needle, it was activated at the gas injection port for 20 min (250 °C).
GC-MS conditions: inlet temperature—250 °C, gas interface temperature—250 °C, carrier gas flow rate—1.5 mL/min, and no shunt injection. Temperature increase procedure: initial—40 °C, hold for 5 min; then, 5 °C/min increase to 250 °C, hold for 10 min. Ion source temperature—230 °C, four-stage rod temperature—150 °C, EI ionization—70 eV, and full scan—35~550 da.
Qualitative data analysis: The mass spectrometry data were compared and searched in the NIST 17 spectral library, and compounds with a match of >80% were retained. Quantitative data analysis: 2,4,6-trimethylpyridine was used as the internal standard for the relative quantification of the compounds. The formula was as follows:
C X = S X × C i × V i S i × M X
where CX is the content of the unknown flavour substance (µg/100 g); SX is the chromatographic peak area of the unknown flavour substance; Ci is the concentration of the internal standard (mg/mL); Vi is the volume of the internal standard added (µL); Si is the chromatographic peak area of the internal standard; and MX is the mass of the sample (g).

2.3.5. Electronic Nose Odour Fingerprint Extraction

Pre-treatment of ham samples: 1d before the experiment, the ham samples were thawed at 4 °C. For electronic nose detection, a knife was used to scrape off the sample surface material (mainly some mould and dust), and the inner core of the peeled Xuanwei ham samples was divided into 0.6 × 0.6 × 0.6 cm small pieces. About 75 g of each piece was divided into three 25 g parts, and each was placed into 40 mL headspace sampling bottles, caps screwed tightly on, placed in an oven (set at 50 °C), and left for 30 min. Then, according to the principles of solid–gas equilibrium and solid–liquid equilibrium, the gas component was volatilized, the upper gas in the sample bottle reached a stable state, and electronic nose detection was carried out.
Odour fingerprint data acquisition: a cNose-10 electronic nose produced by Shanghai Baosheng Technology Company was used for determination. Through the pre-test, the following conditions were set: carrier gas was dry air, gas flow rate was 1.0 L/min, test time was 120 s, and injection time was 90 s. Then, odour fingerprint data were collected from all the samples.

2.4. Experimental Procedures of Metagenomic Sequencing

Genomic DNA was extracted from the ham samples using the CTAB method. The concentration, integrity, and purity of DNA were detected using Agilent 5400. After the DNA samples passed the test, the samples were fragmented to a size of 350 bp using a Covaris ultrasonic crusher, and then, whole library preparation was completed by the steps of end repair, the addition of A-tail, the addition of a sequencing junction, fragment screening, and PCR amplification and purification. Then, further PCR amplification was performed, the PCR products were purified, and the library quality was assessed by the Agilent5400 system (Agilent, Santa Clara, CA, USA), and finally, the library concentration was quantified by QPCR (1.5 nM). Based on the effective library concentration and target data volume, the eligible libraries were up-sequenced on the Illumina platform using the PE150 strategy. Macrogenomic sequencing was performed using the Illumina NovaSeq high-throughput sequencing platform to obtain raw macrogenomic data (Raw Data) of ham samples. The raw sequencing data were preprocessed using Kneaddata (0.7.4) software to ensure the reliability of the data [22,23,24].
For comparative analyses, we used Kraken2 and custom databases for taxonomic delineation of species and then predicted the actual relative abundance of species in the samples using Bracken [24,25,26,27,28].

2.5. Data Processing

Data were collated using Excel 2016. Data are presented as mean ± standard deviation (n = 3). Statistical analyses were performed using IBM SPSS Statistics 26 software, and general linear model variable analysis was performed using Duncan’s test, with p < 0.05 indicating significant differences. Microbial flora mapping was performed using the Biotech Cloud platform https://www.bioincloud.tech/ (accessed on 20 May 2024) The analysis was performed according to Gao et al. [29], with slight modifications for data visualization.

3. Results

3.1. Free Amino Acid Content and TAV Value of Differently Aged Xuanwei Hams

Free amino acid content, as the main contributor to ham flavour and texture, is related to protein degradation, as well as amino acid degradation [30], and can be classified as fresh, sweet, bitter, and tasteless according to flavouring characteristics [31]. A total of 25 free amino acids were detected in differently aged Xuanwei hams (Table 1), which initially decreased and then increased, reaching peak content in W4 (4328.70 mg/100 g), which was 65.45% higher than W3.
TAV is the taste activity value, and free amino acids with TAV > 1 are considered to have a strong contribution to Xuanwei ham flavour; the higher the TAV, the greater the contribution. Aspartic acid and glutamic acid are fresh flavour substances, and the TAV values of glutamic acid in differently aged Xuanwei hams were higher than aspartic acid, and glutamic acid content in W3 was significantly lower than W1, W2, and W4 (p < 0.05). Moreover, glutamic acid not only helps to improve the fresh taste but also provides the amino receptor α-ketoglutaric acid when the transamination of branched-chain amino acids occurs, which promotes characteristic flavour generation [32]. Alanine is the main sweet amino acid in Xuanwei ham because it has the lowest threshold among sweet amino acids and can be converted to aldehydes in later stages to promote ham flavour [33]. Alanine content was significantly lower in W4 than W1, W2, and W3 (p < 0.05), and the glutamic acid TAV in W3 (1.06) was significantly lower than W1, W2, and W4 (p < 0.05). W4 had the highest arginine content (TAV value of 5.59), which had a bitter flavour with weak sweetness, which could be masked by NaCl or glutamic acid [34]. Similarly, lysine, which was bitter in W4, also had a high TAV (6.90). High bitter amino acid content can adversely affect ham quality; however, appropriate bitterness can increase the complexity of flavour presentation, which can enhance overall ham flavour [35].

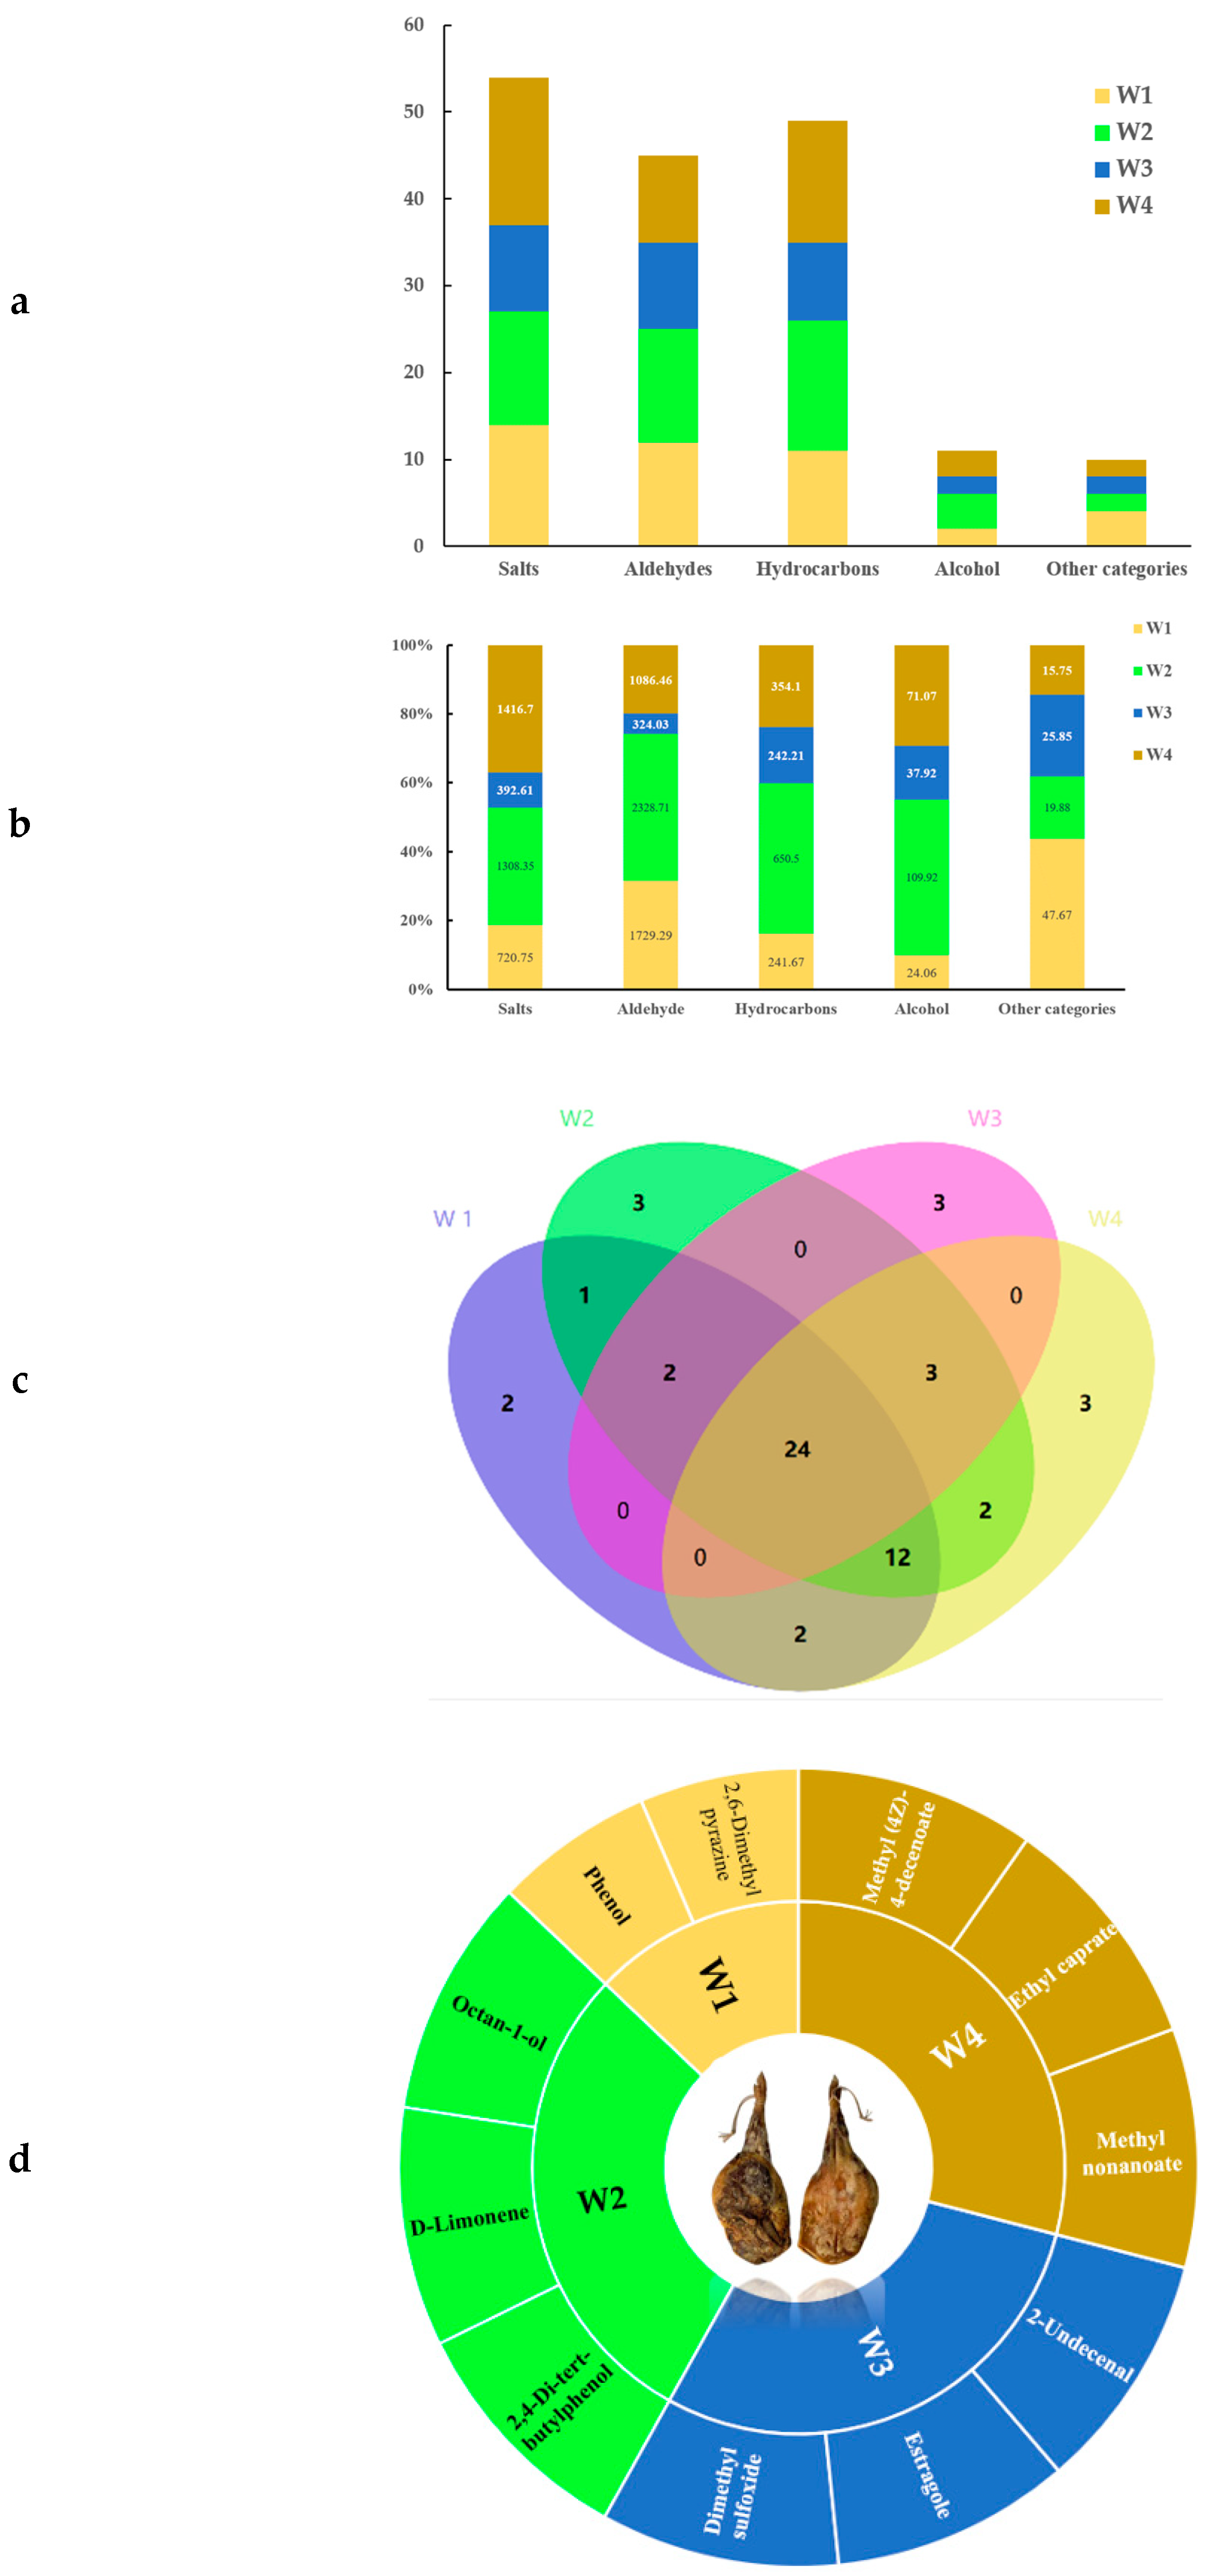
3.2. VOCs in Xuanwei Ham of Different Vintages

A total of 59 VOCs, including 17 esters, 14 aldehydes, 15 hydrocarbons, 6 alcohols, 9 acids, and 7 others, were detected in the four differently aged Xuanwei hams (Table 2). To visualize the distribution of the types, quantities, and contents of the compounds, stacked bar charts, Wayne diagrams, and Asahi diagrams were plotted and analysed (Figure 2). Compound types and content contained in differently aged Xuanwei hams were quite different (Figure 2a,b). W2 had the highest content of VOC substances at 4417.35 μg/100 g, which indicated that amino acid catabolism, fatty acid metabolism, and carbohydrate decomposition were directly involved in VOC formation [17]; this was followed by W4 (2944.08 μg/100 g), W1 (2763.44 μg/100 g), and W3 (1022.62 μg/100 g). Twenty-four VOCs were found in differently aged Xuanwei hams, of which 26 were found in W1, W2, and W3 in total; 27 were found in W2, W3, and W4; 41 were found in W2 and W4; and 26 were found in W1 and W3 in total (Figure 2c). Additionally, two VOCs were detected in W1 only, three in W2 only (Figure 2d), and three in W3 and W4 (Figure 2d). The VOCs with VIP scores > 1 were (Z)-13-Octadecenal, (Z)-2, Phenylacetaldehyde, 4-Decenoicacid, methyl ester, Octadecanal, Methyl octanoate, and Hexadecanal (Figure 2e). Hexadecanal and the VIP scores of Methyl octanoate and Hexadecanal were >2, and the contents were higher in W4 and W2, respectively, which indicated that they had the highest contribution to Xuanwei ham flavour. Their highest content was found in W1, which contributed to its higher flavour score. Hexadecimal has a meat-like flavour and a weak aroma of flowers, and it provides a bitter almond flavour and nutty flavour in meat as the main aromatic aldehyde [36,37].
W1 had a relatively short fermentation time (Table 2); its highest VOCs were aldehydes (1729.29 μg/100 g), followed by esters (720.75 μg/100 g) and hydrocarbons (241.67 μg/100 g). Notably, Hexadecanal has a weak aroma of flowers and wax, which plays an important role in improving ham flavour, and its content was higher in W2 than in all other years, especially W3 (p < 0.05). There was a significant increase in flavour substances after three years of ham fermentation, which may be due to the length of time ham was associated with microbial fermentation factors. Organic acids were generated by esterification reaction with alcohol compounds, which promoted the increase in ham VOCs [38]. Ester content in W4 was significantly higher than in the other three years (p < 0.05), especially for trimethyl borate, methyl caprylate, and methyl decanoate, which played an important role in contributing to the flavour of W4.

3.3. Electronic Nose Analysis of Xuanwei Ham in Different Years

The volatile flavour characteristics of differently aged Xuanwei ham were analysed with a Fox 4000 electronic nose equipped with 10 metal sensors, and their corresponding response substances and category substances are shown in Table 3. Figure 3a is the radar chart made by the sensor response value to Xuanwei ham odour. The electronic nose requires that the sensor’s maximum response value of the tested sample be >0.5, and all the experimental samples met the detection requirements. Its aroma depends not only on flavour molecular composition but also its concentration. Sensors sn-1, sn-2, sn-4, sn-5, sn-6, and sn-8 had higher response values for the flavour of differently aged Xuanwei hams, of which sn-4, sn-5, and sn-8 had a higher degree of differentiation (Figure 3a). Sensor sn-8 had the largest response value, and the sensed signal intensity was W1 > W4 > W2 > W3. W1 intensity was significantly higher than during the other storage periods, which coincided with the volatile flavour substances measured by GC-MS. W2 and W3 radar fingerprints almost overlapped, indicating that similar volatile components existed in the samples. Response values of the sn-3 and sn-9 sensors were significantly smaller than the other sensors, indicating that they were insensitive to the response of methane, ozone, and other flavour substances or that the content of this type of flavour substance was lower; thus, the sensor response was smaller. Overall, radargrams were effective in distinguishing between volatile components of differently aged Xuanwei ham.
PCA uses orthogonal transformations to convert a set of observations of observable correlated variables into a set of linearly uncorrelated variable values of principal components [39]. The contribution of the first principal component was 80.2433%, the contribution of the second was 17.2701%, and the sum of the two was 97.5134%, indicating that PC1 and PC2 extracted the main characteristics of the volatile compounds in the storage period of Xuanwei ham [40], which can be used to characterize overall information of the four selected ham samples (Figure 3b). Thus, it can be used to analyse the changing law of volatile aroma components of Xuanwei ham during different storage periods. The aromas of W2 and W3 Xuanwei ham samples were closer, and W1 was farther away from the other three (Figure 3b). This may be due to the shortest ripening time, whereby ripe ham aroma could not be fully generated and released; with the extension of ripening time, new volatile substances can be generated so that Xuanwei ham can develop its unique ripe aroma.

3.4. Microbial Community Analysis

3.4.1. Macrogenomic Data Overview

To determine the microbial community information present in the ham fermentation process, differently aged Xuanwei hams were analysed using macro-genome sequencing. The process yielded 78.75 Gbp of Raw Base (Table 4). The sequencing errors of Clean Q30 > 97% of reads of differently aged Xuanwei hams were <1‰, which showed the high quality of the sequencing procedure and that it met the analysis requirements. A total of 87,508,391 reads were obtained from Illumina MiSeq sequencing of Xuanwei ham, of which the Chao1 index and Shannon index in W3 were significantly higher than in W1, W2, and W4 (405.41 and 4.61, respectively), indicating that the population variability of the W3 microbial community was relatively large and community diversity was high. This study was analysed using observed_features and, compared to Observed_otus, it better described the different ways in which QlME 2 uses non-categorical features. Chao1 index results were similar to those of observed features, further demonstrating high diversity, as well as an overall abundance of bacterial microbial communities in W3.

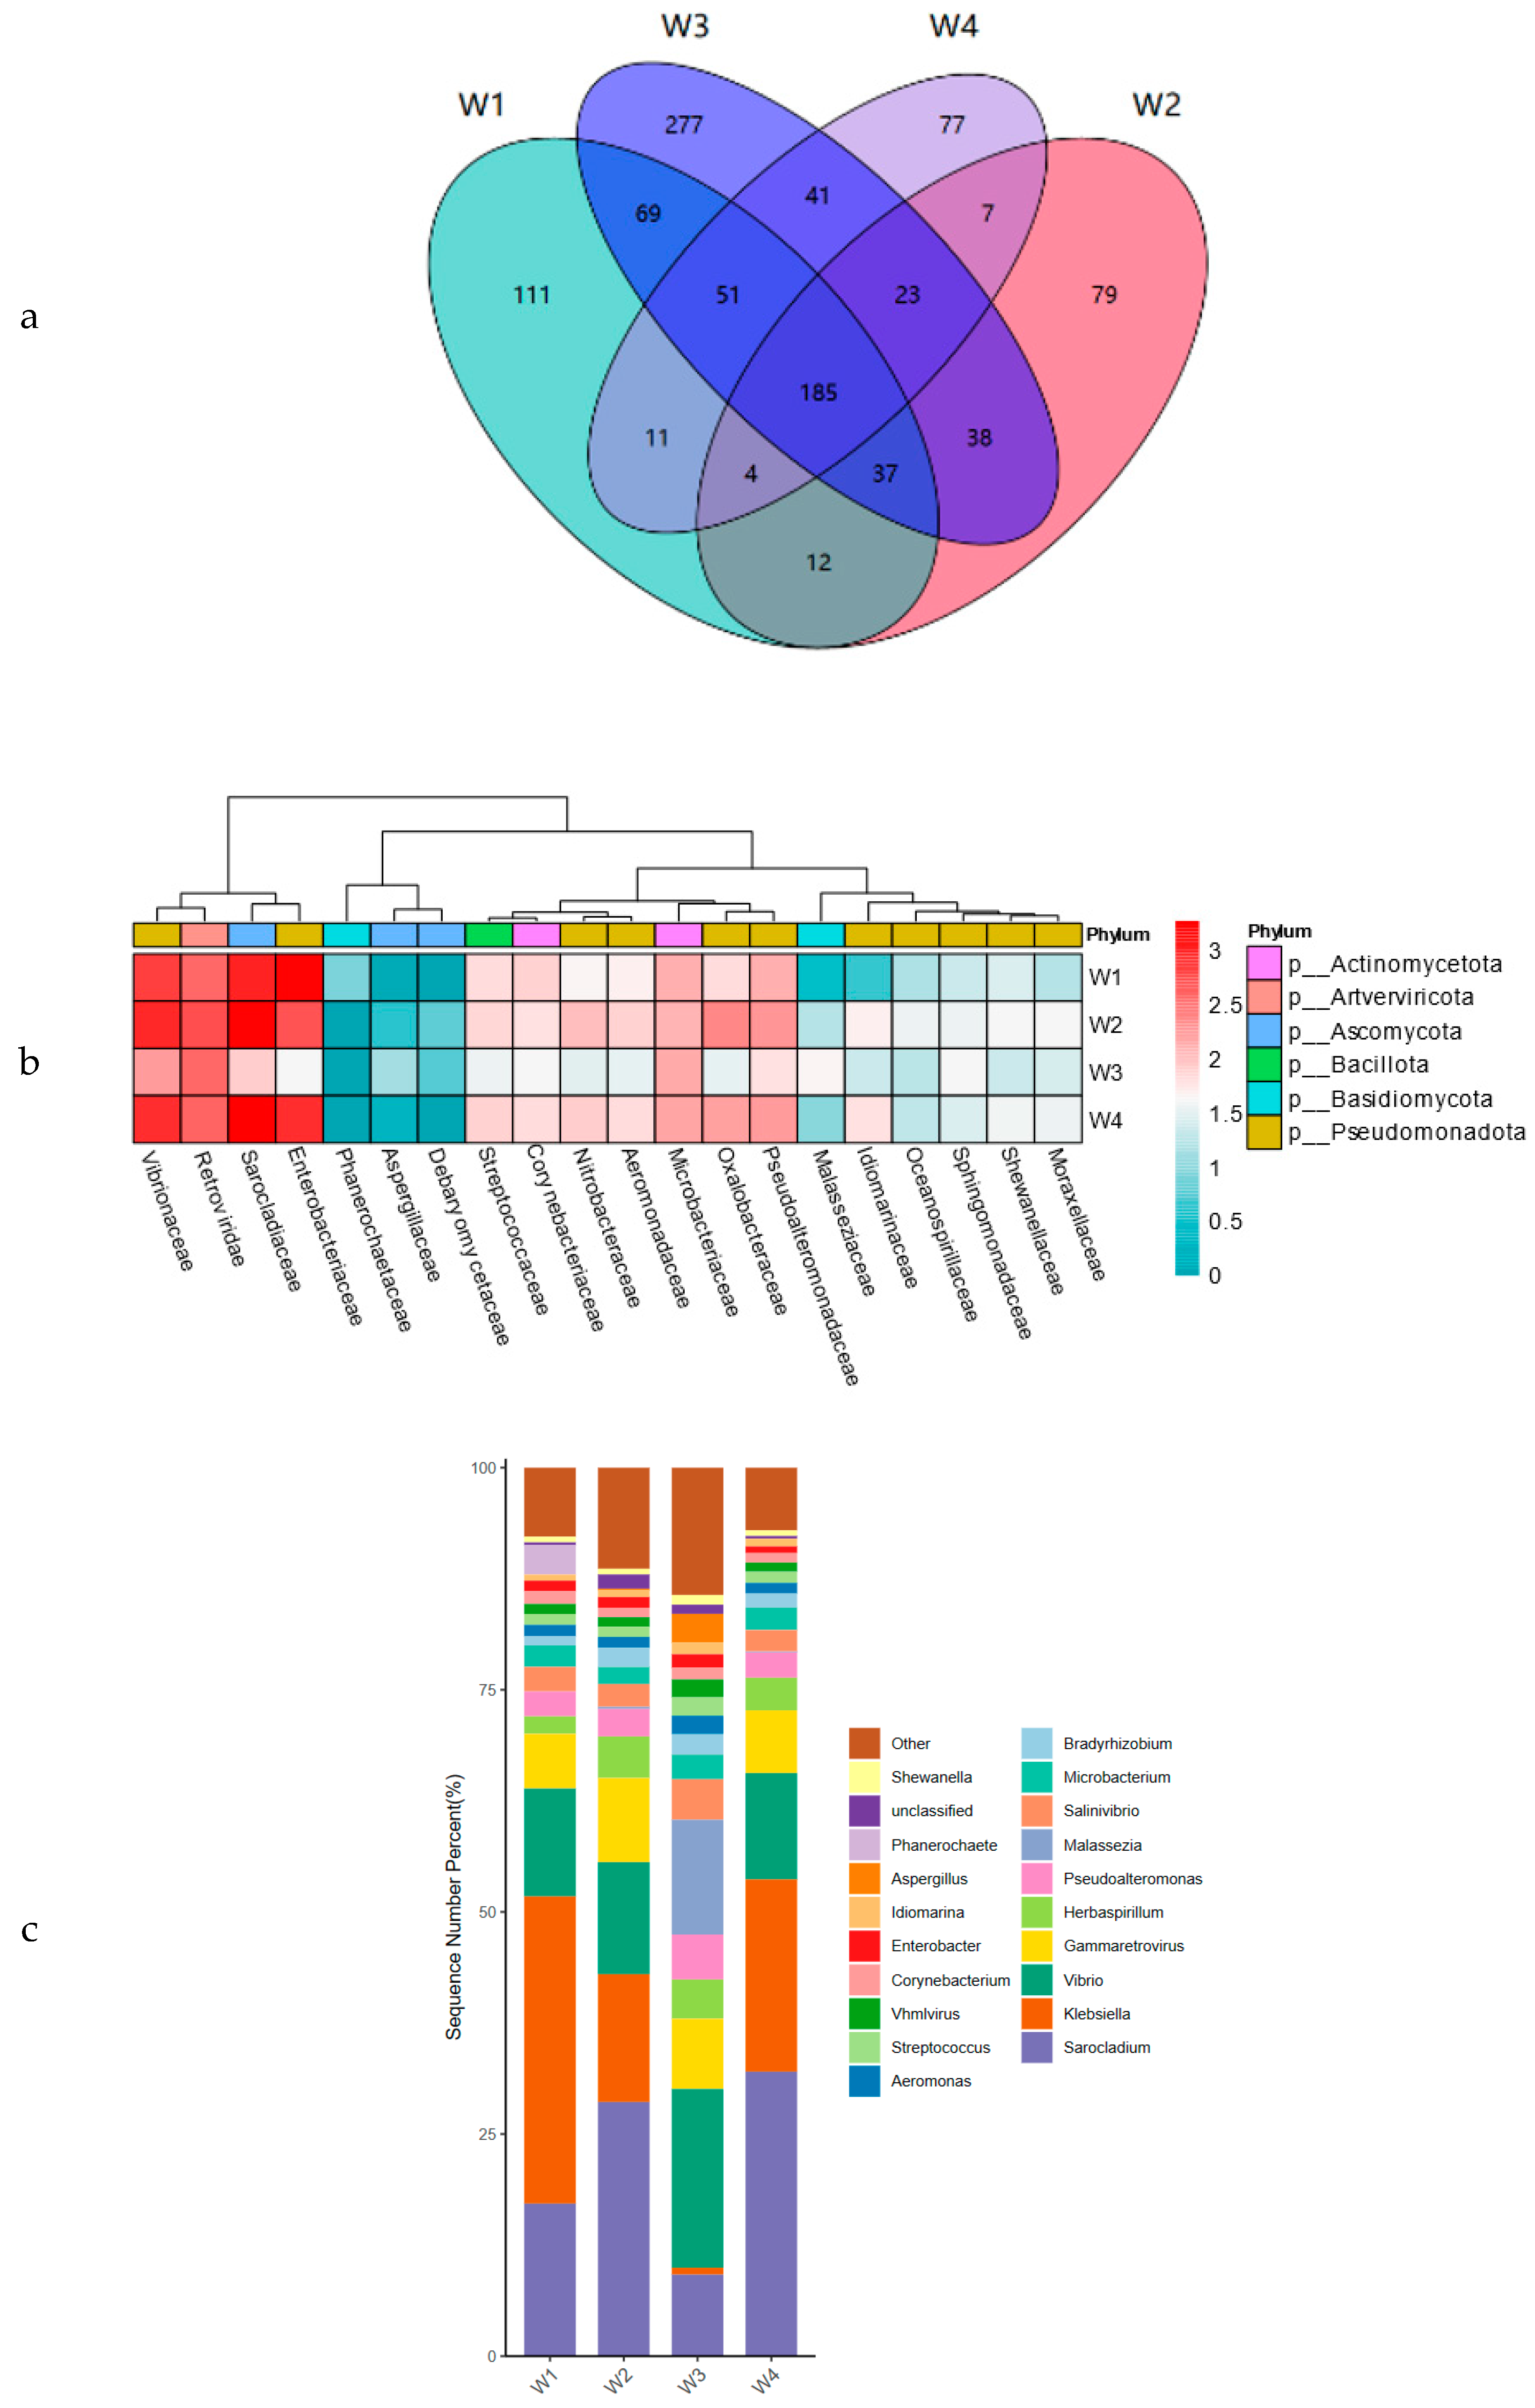
3.4.2. Bacterial Microbiological Composition of Xuanwei Ham

Macro-genome sequencing was performed in differently aged Xuanwei hams (W1, W2, W3, and W4) to analyse changes in microbial composition over time. The dominant phylum of Xuanwei ham in all four years was Pseudomonadota, which concurs with Li Cong’s findings [11]. The most abundant families in W1, W2, and W4 were Enterobacteriaceae, Sarocladiaceae, Retroviridae, and Vibrionaceae, and the relative abundance of Enterobacteriaceae was lowest in W2, while the main families in W3 were Retroviridae and Vibrionaceae (Figure 4b). A total of 185 microorganisms, which accounted for only 9.3% of overall microorganisms, indicate that ham fermentation is an open environment, and maturation involves numerous unknown and uncultured microorganisms (Figure 4a). To fully characterize the microorganisms, a more scientific analysis of microbial composition at the genus level is required. The most abundant genera in W1, W2, and W4 were Sarocladium, Klebsiella, and Vibrio, and Klebsiella was the most abundant genus in W1, indicating that there were few characteristic microorganisms in W1, W2, and W4 at the genus level (Figure 4c). This was consistent with the results of characteristic microorganism analyses, where the most abundant genus in W3 was Vibrio, as was the second most abundant genus. The second most abundant genera were Sarocladium and Gammaretrovirus. This is similar to the results of the comparative analysis of the microbial diversity of five dry-cured hams from Yunnan studied by Lin Junyi et al. [41]. The present experiment found that Sarocladium was the dominant genus in W1 and W4. In this experiment, Sarocladium was found to be the dominant genus in W1, W2, and W4, while Vibrio was found to be the dominant genus in W3, which may be due to the fact that as the hams matured, the salt content of the hams gradually decreased, which resulted in a decrease in the inhibitory ability of the microorganisms; thus, Vibrio became the dominant genus in W3. However, Sarocladium was the dominant genus in W4, probably because a series of biochemical reactions such as protein hydrolysis, amino acid degradation, lipolysis, and lipid oxidation were beneficial to the reproduction of this microorganism; thus, Sarocladium became the dominant genus in W4. In general, the dominant genera of Xuanwei ham in different years were Sarocladium and Vibrio.

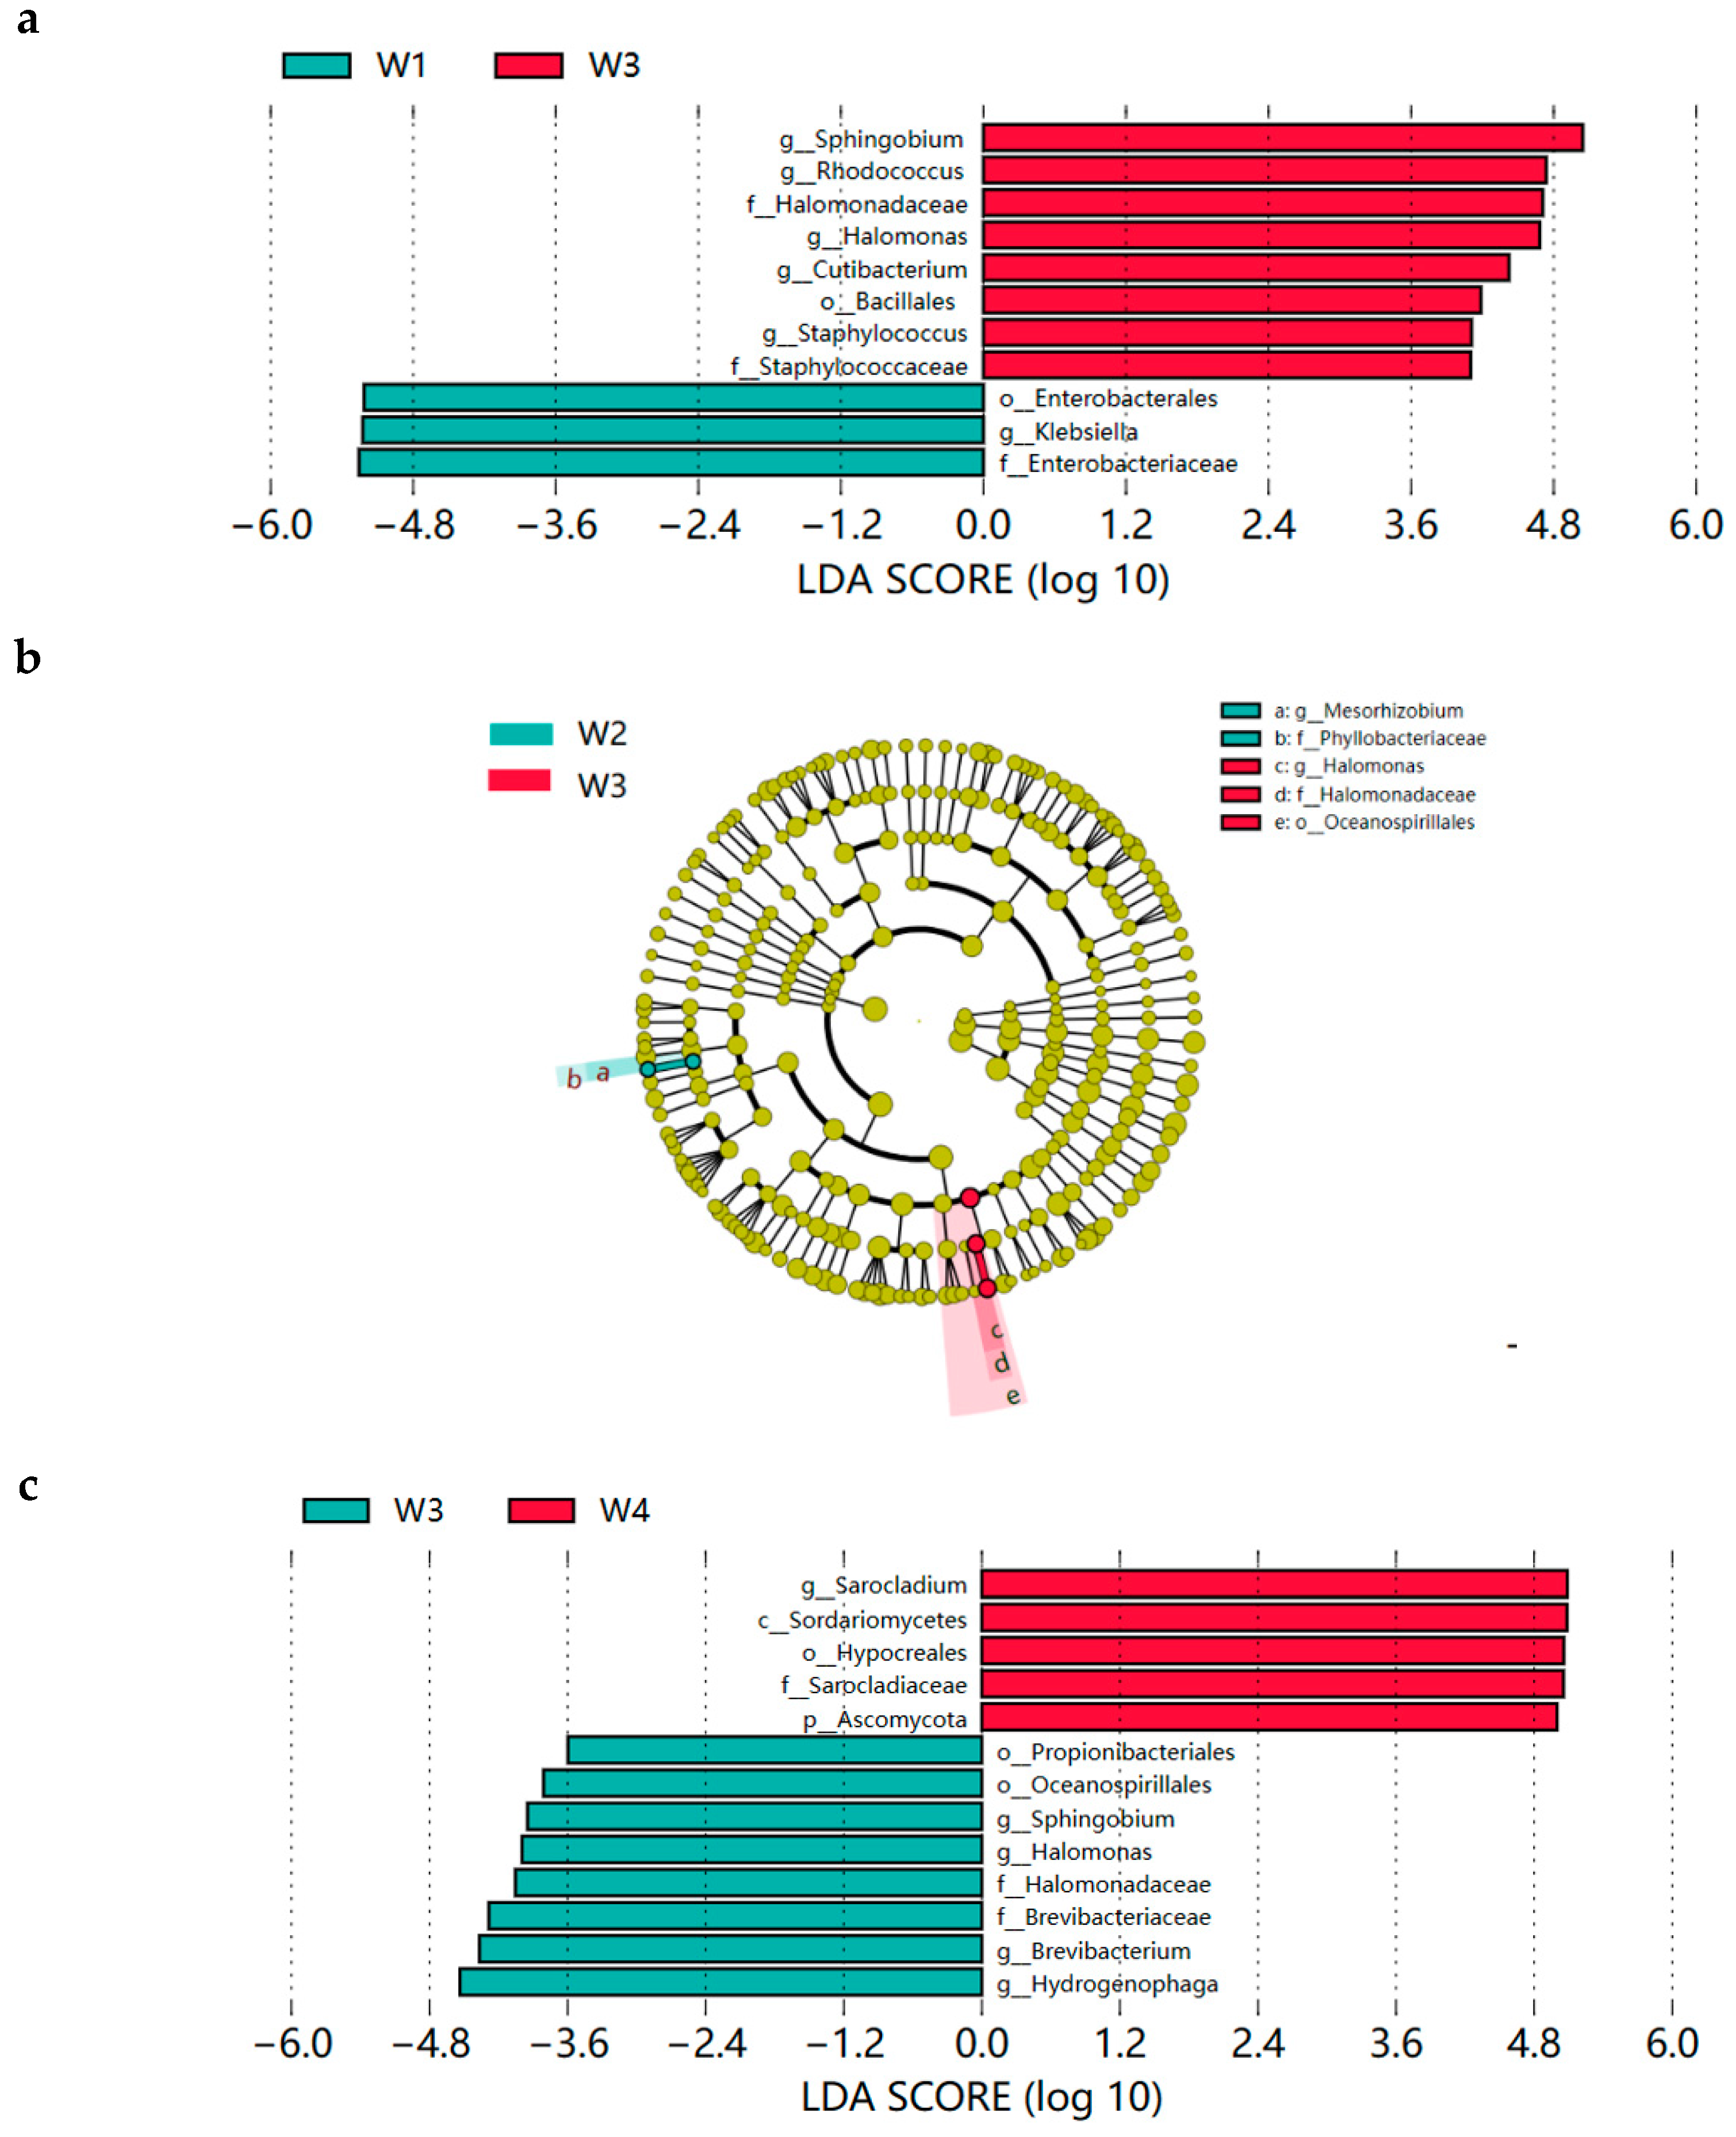
3.4.3. Xuanwei Ham LEfSe Analysis

From the above analysis (Figure 4), it is clear that W1, W2, and W4 have similar microbial abundance in the phylum, family, and genus levels, so there are few characteristic flora present among them. We individually compared W3 with W1, W2, and W4 to identify characteristic microorganisms present in differently aged Xuanwei hams. Through LEfSe analysis, the first three characteristic bacteria were represented. In W1 and W3, the characteristic bacteria in W1 were Enterobacteriaceae, Klebsiella, and Enterobacterales, while in W3, they were Sphingobium, Rhodococcus, and Halomonadaceae (Figure 5a). In W2 and W3, the characteristic bacteria in W2 were Phyllobacteriaceae and Mesorhizobium, while in W3, they were Oceanospirillales, Halomonadaceae, and Halomonas (Figure 5b). In W3 and W4, the representative bacterial microorganisms in W3 were Hydrogenophaga, Brevibacterium, and Brevibacteriaceae, while in W4, they were Sarocladium, Sordariomycetes, and Hypocreales (Figure 5c).

3.4.4. Correlation Analysis of Phylum and Genus Microbiota with Free Amino Acids, VOCs

A correlation heatmap was used to study the relationship of bacterial microbial communities with free amino acids and VOCs (Figure 6). Correlation analyses of free amino acids with microorganisms with large TAV values and high contributions were performed, and Ascomycota showed a highly significant positive correlation with Ala at the phylum level (p < 0.01) and Glu, Arg, Leu, and Ser at the genus level (Figure 6a). Gly was positively correlated with Mycoplasma and Nakaseomyces (p < 0.05), and Klebsiella showed a highly significant positive correlation (p < 0.01) with Asp, Phe, and Ile, indicating that Klebsiella may promote their production, and the high W4 total content of free amino acids may not be separated from the presence of Klebsiella. Correlation analysis was performed using VOCs with VIP scores > 1 and microorganisms, and, at the phylum level, Mycoplasmatota and Ascomycota showed a highly significant positive correlation (p < 0.01) with 4-Decenoicacid, methyl ester (Figure 6b). At the genus level, Colwellia, Mycoplasma, Nakaseomyces, Ruminococcus, Capronia, Fretibacterium, Sinorhizobium, Thomasclavelia, and Brucella showed a significant positive correlation (p < 0.05) with 4-Decenoicacid, methyl ester and Mycoplasma. Nakaseomyces showed a highly significant positive correlation (p < 0.01) with 4-Decenoicacid, methyl ester, suggesting that many microorganisms are favourable for its production; it has a papaya aroma [42] and was only present in W4, suggesting that it can offer a unique flavour to aged hams. Mesorhizobium and Sarocladium showed highly significant positive correlations (p < 0.01) with Hexadecanal and Methyl octanoate, respectively, constituting the main microorganisms in hams that contribute to flavour formation.

4. Conclusions

During ripening, the highest total free amino acid content, significantly higher glutamic acid content, and the main fresh flavour amino acid were found in 4-year-aged Xuanwei ham (p < 0.05) and could not be separated from the presence of Klebsiella. Lin [43] et al. found that Klebsiella could enhance the flavour of traditional Mongolian cheese during the ripening process. Of the 59 VOCs detected, 17 were esters, and the highest ester content was found in 4-year-old Xuanwei ham. Hexadecanal VIP scores were significantly higher than those of other VOCs, and the highest content was found in 1-year-old Xuanwei ham, which contributed to its higher flavour score. The bacterial composition of 3-year-old Xuanwei ham differed greatly from other ham samples, with Pseudomonadota being the dominant bacterial group at the phylum level. At the genus level, differently aged Xuanwei hams were mainly dominated by Sarocladium and Vibrio. The production of Asp, Phe, and Ile was directly or indirectly correlated with the action of Klebsiella microorganisms. Mycoplasmatota, Ascomycota, Colwellia, and Mycoplasma were significantly positively correlated with 4-Decenoic acid and methyl ester (4Decenoic acid, methyl ester), and methyl ester was significantly positively correlated (p < 0.05) and was only present in 4-year-old Xuanwei ham. This substance may only be present in aged Xuanwei hams. Since we studied only four years of ham samples, follow-up studies are required to further confirm this possibility. The correlation between Mycoplasmatota and other phyla and 4-Decenoicacid, methyl ester was only hypothesised based on high-throughput sequencing, and its contribution to VOCs was not directly confirmed. Therefore, this hypothesis can be confirmed by subsequent back-joining fermentation based on the isolation and purification of the relevant dominant bacteria. And our group follow-up studies should try to analyse the correlation between major microorganisms and the acceptability of the hams. This will provide a theoretical basis for accelerating the maturation of Xuanwei ham, which will greatly reduce the fermentation time of the ham and enrich its flavour and will be favoured by more consumers. The results of this study provide a better scientific basis for the formation of flavour and quality control of Xuanwei ham.

Author Contributions

G.L.; conceptualization, methodology, validation, investigation, and writing—original draft preparation. S.L.; methodology, validation, and writing review and editing. Y.W. and J.Y.; data curation and software. Z.L.; conceptualization, writing—review and editing, visualization, project administration, and funding acquisition. Y.C.; investigation and methodology. and L.L.; conceptualization, methodology, project administration, and funding acquisition. H.W. resources. P.W. and W.W. visualization. All authors have read and agreed to the published version of the manuscript.

Funding

The Tibet College of Agriculture and Animal Husbandry Graduate Education Innovation Programme Project (YJS2024-54), Major Science and Technology Projects of the Tibet Autonomous Region (XZ202101ZD0005N), and Graduate Teaching Reform and Construction Project of University—Xizang Agriculture and Animal Husbandry College (YJSJG2023-015) funded this study.

Institutional Review Board Statement

Not applicable.

Informed Consent Statement

Not applicable.

Data Availability Statement

All data generated or analysed in this study are available within the manuscript and are available from the corresponding authors upon request.

Conflicts of Interest

Author Huaiyao Wang is employed by the company “Yunnan Yiji Food Co., Ltd.”. But, for the purposes of this investigation, there was no financing relationship with the company; therefore, there are no conflicts of interest. The remaining authors declare that the research was conducted in the absence of any commercial or financial relationships that could be construed as a potential conflict of interest.

References

  1. Dong, Y. Modernisation of traditional Chinese flavour meat products. Meat Res. 1998, 2, 3–6. [Google Scholar]
  2. Wu, W.; Zhou, Y.; Wang, G.; Zhu, R.; Ge, C.; Liao, G. Changes in the physicochemical properties and volatile flavor compounds of dry-cured Chinese Laowo ham during processing. J. Food Process. Preserv. 2020, 44, e14593. [Google Scholar] [CrossRef]
  3. Huang, A.X.; Ge, C.R.; Huang, Q.C. The study of ingredients and processing techniques of Xuanwei style ham. J. Food Process. Preserv. 2010, 34, 136–148. [Google Scholar] [CrossRef]
  4. Yi, Y.; Wang, X.; Xiang, J.; Zang, L.; Chen, C.; Chen, D.; Wang, X.; Cao, J. Effects of curing agent and rinsing process on the flavour of Xuanwei ham. Food Ferment. Ind. 2024, 50, 85–92. [Google Scholar] [CrossRef]
  5. Li, Z.; Wang, Y.; Pan, D.; Geng, F.; Zhou, C.; Cao, J. Insight into the relationship between microorganism communities and flavor quality of Chinese dry-cured boneless ham with different quality grades. Food Biosci. 2022, 50, 102174. [Google Scholar] [CrossRef]
  6. Wang, H.; Yin, X.; Zhang, L.; Wang, X.; Zhang, J.; Wen, R.; Cao, J. Insight into the Relationship between the Causes of Off-Odour and Microorganism Communities in Xuanwei Ham. Foods 2024, 13, 776. [Google Scholar] [CrossRef] [PubMed]
  7. Guo, X.; Wang, Y.; Lu, S.; Wang, J.; Fu, H.; Gu, B.; Lyu, B.; Wang, Q. Changes in proteolysis, protein oxidation, flavor, color and texture of dry-cured mutton ham during storage. LWT 2021, 149, 111860. [Google Scholar] [CrossRef]
  8. Zhu, Y.; Guo, Y.; Yang, F.; Zhou, C.; Tang, C.; Zhou, G. Combined application of high-throughput sequencing and UHPLC-Q/TOF-MS-based metabolomics in the evaluation of microorganisms and metabolites of dry-cured ham of different origins. Int. J. Food Microbiol. 2021, 359, 109422. [Google Scholar] [CrossRef] [PubMed]
  9. Yu, Y.R.; Wang, G.Y.; Sun, Y.H.; Ge, C.R.; Liao, G.Z. Changes in physicochemical parameters, free fatty acid profile and water-soluble compounds of Yunnan dry-cured beef during processing. J. Food Process. Preserv. 2020, 44, e14380. [Google Scholar] [CrossRef]
  10. Virgili, R.; Saccani, G.; Gabba, L.; Tanzi, E.; Soresi Bordini, C. Changes of free amino acids and biogenic amines during extended ageing of Italian dry-cured ham. Lwt–Food Sci. Technol. 2007, 40, 871–878. [Google Scholar] [CrossRef]
  11. Li, C.; Zheng, Z.; Wang, G.; Chen, G.; Zhou, N.; Zhong, Y.; Yang, Y.; Wu, H.; Yang, C.; Liao, G. Revealing the intrinsic relationship between microbial communities and physicochemical properties during ripening of Xuanwei ham. Food Res. Int. 2024, 186, 114377. [Google Scholar] [CrossRef] [PubMed]
  12. Ge, Q.; Pei, H.; Liu, R.; Chen, L.; Gao, X.; Gu, Y.; Hou, Q.; Yin, Y.; Yu, H.; Wu, M.; et al. Effects of Lactobacillus plantarum NJAU-01 from Jinhua ham on the quality of dry-cured fermented sausage. LWT 2019, 101, 513–518. [Google Scholar] [CrossRef]
  13. Wang, Y.; Li, F.; Chen, J.; Sun, Z.; Wang, F.; Wang, C.; Fu, L. High-throughput sequencing-based characterization of the predominant microbial community associated with characteristic flavor formation in Jinhua Ham. Food Microbiol. 2021, 94, 103643. [Google Scholar] [CrossRef]
  14. Wang, Y.; Shen, Y.; Wu, Y.; Li, C.; Li, L.; Zhao, Y.; Hu, X.; Wei, Y.; Huang, H. Comparison of the microbial community and flavor compounds in fermented mandarin fish (Siniperca chuatsi): Three typical types of Chinese fermented mandarin fish products. Food Res. Int. 2021, 144, 110365. [Google Scholar] [CrossRef] [PubMed]
  15. Zhong, A.; Chen, W.; Duan, Y.; Li, K.; Tang, X.; Tian, X.; Wu, Z.; Li, Z.; Wang, Y.; Wang, C. The potential correlation between microbial communities and flavors in traditional fermented sour meat. LWT 2021, 149, 111873. [Google Scholar] [CrossRef]
  16. Deng, J.; Xu, H.; Li, X.; Wu, Y.; Xu, B. Correlation of characteristic flavor and microbial community in Jinhua ham during the post-ripening stage. LWT 2022, 171, 114067. [Google Scholar] [CrossRef]
  17. Li, P.; Bao, Z.; Wang, Y.; Su, X.; Zhou, H.; Xu, B. Role of microbiota and its ecological succession on flavor formation in traditional dry-cured ham: A review. Crit. Rev. Food Sci. Nutr. 2023, 1–17. [Google Scholar] [CrossRef] [PubMed]
  18. Qiu, D.; Duan, R.; Wang, Y.; He, Y.; Li, C.; Shen, X.; Li, Y. Effects of different drying temperatures on the profile and sources of flavor in semi-dried golden pompano (Trachinotus ovatus). Food Chem. 2023, 401, 134112. [Google Scholar] [CrossRef]
  19. Zhu, N.; Wang, S.; Zhao, B.; Zhang, S.; Zang, M.; Wu, Q.; Li, S.; Qiao, X. Label-free proteomic strategy to identify proteins associated with quality properties in sauced beef processing. Food Biosci. 2021, 42, 101163. [Google Scholar] [CrossRef]
  20. Xu, X.; You, M.; Song, H.; Gong, L.; Pan, W. Investigation of umami and kokumi taste-active components in bovine bone marrow extract produced during enzymatic hydrolysis and Maillard reaction. Int. J. Food Sci. Technol. 2018, 53, 2465–2481. [Google Scholar] [CrossRef]
  21. Cao, C.; Feng, M.; Sun, J.; Xu, X.; Zhou, G. Effects of functional fermentation agents on oxidative stability and volatile flavour substances of fermented sausages. Food Sci. 2019, 40, 106–113. [Google Scholar] [CrossRef]
  22. Marcel, M. Cutadapt removes adapter sequences from high-throughput sequencing reads. Eur. Mol. Biol. Netw. 2011, 17, 1. [Google Scholar] [CrossRef]
  23. Schmieder, R.; Edwards, R. Quality control and preprocessing of metagenomic datasets. Bioinformatics 2011, 27, 863–864. [Google Scholar] [CrossRef] [PubMed]
  24. Langmead, B.; Salzberg, S.L. Fast gapped-read alignment with Bowtie 2. Nat. Methods 2012, 9, 357–359. [Google Scholar] [CrossRef] [PubMed]
  25. Wood, D.E.; Salzberg, S.L. Kraken: Ultrafast metagenomic sequence classification using exact alignments. Genome Biol. 2014, 15, R46. [Google Scholar] [CrossRef] [PubMed]
  26. Lu, J.; Breitwieser, F.P.; Thielen, P.; Salzberg, S.L. Bracken: Estimating species abundance in metagenomics data. PeerJ Comput. Sci. 2017, 3, e104. [Google Scholar] [CrossRef]
  27. Mandal, S.; Van Treuren, W.; White, R.A.; Eggesbø, M.; Knight, R.; Peddada, S.D. Analysis of composition of microbiomes: A novel method for studying microbial composition. Microb. Ecol. Health Dis. 2015, 26, 27663. [Google Scholar] [CrossRef]
  28. Brum, J.R.; Ignacio-Espinoza, J.C.; Roux, S.; Doulcier, G.; Acinas, S.G.; Alberti, A.; Sullivan, M.B.; Roux, S.; Doulcier, G.; Acinas, S.G.; et al. Patterns and ecological drivers of ocean viral communities. Science 2015, 348, 1261498. [Google Scholar] [CrossRef] [PubMed]
  29. Gao, Y.; Zhang, G.; Jiang, S.; Liu, Y.X. Wekemo Bioincloud: A user-friendly platform for meta-omics data analyses. iMeta 2024, 3, e175. [Google Scholar] [CrossRef]
  30. Li, Q. Identification of Characteristic Flavour Substances in Agaricus Bisporus Soup and Study on the Release of Flavour Substances during Simmering. Ph.D. Thesis, Jiangnan University, Wuxi, China, 2011. [Google Scholar]
  31. Liu, B.; Wang, X.; Zhao, W.; Li, H.; Li, H.; Zhang, J.; Shi, Q. Physicochemical and flavour properties of Norden ham from different sources and years. Meat Res. 2021, 35, 1–8. [Google Scholar] [CrossRef]
  32. Ur-Rehman, S.; Fox, P.F. Effect of added α-ketoglutaric acid, pyruvic acid or pyridoxal phosphate on proteolyis and quality of Cheddar cheese. Food Chem. 2002, 76, 21–26. [Google Scholar] [CrossRef]
  33. Zhao, J. Study on the Melad Reaction Involving Free Amino Acids during the Flavour Formation of Jinhua Ham. Master’s Thesis, Henan Agricultural University, Zhengzhou, China, 2013. [Google Scholar]
  34. Michikawa, K.; Konosu, S. Sensory identification of effective components for masking bitterness of arginine in synthetic extract of scallop. In Proceedings of the Olfaction and Taste XI: Proceedings of the 11th International Symposium on Olfaction and Taste and of the 27th Japanese Symposium on Taste and Smell, Joint Meeting Held at Kosei-Nenkin Kaikan, Sapporo, Japan, 12–16 July 1993; Springer: Tokyo, Japan, 1994; p. 278. [Google Scholar] [CrossRef]
  35. Sforza, S.; Pigazzani, A.; Motti, M.; Porta, C.; Virgili, R.; Galaverna, G.; Dossena, A.; Marchelli, R. Oligopeptides and free amino acids in Parma hams of known cathepsin B activity. Food Chem. 2001, 75, 267–273. [Google Scholar] [CrossRef]
  36. Zhang, M.; Wu, G.; Ma, Y.; Suo, H.; Wang, L. Effects of lactic acid bacteria complex on growth performance, slaughter performance, meat quality and volatile flavour composition of black Tibetan sheep. China Feed 2023, 21, 73–80. [Google Scholar] [CrossRef]
  37. Chen, Y. Analysis of Microflora of Low-Salt and High-Moisture Sichuan Bacon and the Effect of Pasteurisation Treatment on Its Storage Quality. Master’s Thesis, Sichuan Agricultural University, Yaan, China, 2022. [Google Scholar] [CrossRef]
  38. Reyes-Díaz, R.; González-Córdova, A.F.; del Carmen Estrada-Montoya, M.; Méndez-Romero, J.I.; Mazorra-Manzano, M.A.; Soto-Valdez, H.; Vallejo-Cordoba, B. Volatile and sensory evaluation of Mexican Fresco cheese as affected by specific wild Lactococcus lactis strains. J. Dairy Sci. 2020, 103, 242–253. [Google Scholar] [CrossRef]
  39. Papadopoulou, O.S.; Panagou, E.Z.; Mohareb, F.R.; Nychas, G.J.E. Sensory and microbiological quality assessment of beef fillets using a portable electronic nose in tandem with support vector machine analysis. Food Res. Int. 2013, 50, 241–249. [Google Scholar] [CrossRef]
  40. Rattray NJ, W.; Hamrang, Z.; Trivedi, D.K.; Goodacre, R.; Fowler, S.J. Taking your breath away: Metabolomics breathes life in to personalized medicine. Trends Biotechnol. 2014, 32, 538–548. [Google Scholar] [CrossRef]
  41. Lin, J.; Song, C.; Zhang, Y.; Zhang, Y.; Quan, W.; Shu, X. Comparative analysis of microbial diversity of five dry-cured hams from Yunnan. China Food Addit. 2023, 34, 233–241. [Google Scholar] [CrossRef]
  42. Zhang, W.; Jiang, L.; Jiang, Y.; Zhao, P. GC-MS analysis of aroma components of white-flowered papaya fruit. South. China Fruit Tree 2017, 46, 117–120. [Google Scholar] [CrossRef]
  43. Lin, J. Correlation between Microbial Community Structure and Flavour Substances in the Ripening Process of Traditional Mongolian Cheese. Master’s Thesis, Inner Mongolia Agricultural University, Hohhot, China, 2023. [Google Scholar] [CrossRef]
Figure 1. Schematic diagram of biceps femoris sample from Xuanwei ham.
Fermentation 10 00392 g001
Figure 2. Distribution and content of VOCs in differently aged Xuanwei ham samples. (a) Classification and quantity of VOCs; (b) classification and content of VOCs; (c) Venn diagram analysis of VOCs; (d) characteristic VOCs; and (e) PLS-DA diagram of Xuanwei hams.
Fermentation 10 00392 g002aFermentation 10 00392 g002b
Figure 3. Radar fingerprints of Xuanwei ham flavour (a) and PCA (b).
Fermentation 10 00392 g003
Figure 4. Differently aged Xuanwei ham microflora distributions at the (a) phylum, (b) family, and (c) genus levels.
Fermentation 10 00392 g004
Figure 5. LEfSe analyses of Xuanwei ham in (a) W1 and W3, (b) W2 and W3, and (c) W3 and W4. Prefixes k, p, c, o, f, and g of the bacterial name stand for kingdom, phylum, class, order, family, and genus, respectively.
Fermentation 10 00392 g005
Figure 6. Correlation analysis of microbial community with (a) free amino acids and (b) volatile flavour in Xuanwei ham. (* means significant p < 0.05, ** means extremely significant p < 0.01).
Fermentation 10 00392 g006
Table 1. Free amino acid content and TAV value of Xuanwei ham.
FAATaste ContributionThresholds/
(mg/100 g)
W1W2W3W4
Content/
(mg/100 g)
TAVContent/
(mg/100 g)
TAVContent/
(mg/100 g)
TAVContent/
(mg/100 g)
TAV
AspFresh/Sweet (+)100213.40 ± 4.41 a2.13167.61 ± 1.87 c1.6866.32 ± 0.47 d0.66180.21 ± 0.45 b1.80
GluFresh (+)30434.65 ± 3.65 b14.49370.64 ± 2.31 c12.35157.67 ± 4.62 d5.26452.99 ± 3.53 a15.10
SerSweet (+)150191.68 ± 1.90 b1.28177.65 ± 3.61 c1.1867.05 ± 1.09 d0.45216.27 ± 2.64 a1.44
GlySweet (+)130189.87 ± 0.86 b1.46178.94 ± 3.27 c1.3854.37 ± 1.37 d0.42197.76 ± 2.20 a1.52
ThrSweet (+)260194.56 ± 1.96 b0.75171.33 ± 3.06 c0.6654.56 ± 0.53 d0.21210.65 ± 3.77 a0.81
AlaSweet (+)60138.75 ± 2.23 b2.31164.80 ± 0.87 a2.75121.12 ± 0.86 c2.0263.82 ± 0.35 d1.06
SarSweet (\)\24.72 ± 0.72 a\19.25 ± 3.94 a\16.44 ± 0.51 a\17.81 ± 2.92 a\
ArgSweet/Bitter (+)50248.02 ± 1.43 b4.96212.58 ± 1.40 c4.2586.94 ± 1.48 d1.74279.66 ± 4.44 a5.59
ValSweet/Bitter (+)40208.82 ± 1.16 a5.22192.27 ± 1.73 b4.8173.73 ± 2.47 c1.84213.88 ± 1.07 a5.35
ProSweet/Bitter (+)300171.66 ± 2.03 b0.57150.96 ± 2.14 c0.5053.04 ± 2.10 d0.18187.08 ± 2.81 a0.62
CysSweet/Bitter (−)2507.58 ± 0.04 b<0.17.76 ± 0.06 b<0.11.75 ± 0.14 c<0.18.90 ± 0.12 a<0.1
LysSweet/Bitter (−)50310.07 ± 3.12 b6.20265.52 ± 5.72 c5.3189.32 ± 3.11 d1.79345.45 ± 11.37 a6.90
HisBitter (−)20106.25 ± 3.48 a5.3199.12 ± 3.77 a4.9629.78 ± 0.12 b1.49106.97 ± 4.26 a5.35
TyrBitter (−)\58.65 ± 0.30 a\57.89 ± 1.49 a\27.92 ± 0.32 c\53.75 ± 0.38 b\
MetBitter (\)30107.77 ± 1.71 b3.5987.59 ± 1.10 c2.9229.49 ± 0.20 d0.98121.76 ± 0.62 a4.06
NvaBitter (\)\11.99 ± 0.43 c\17.77 ± 0.16 a\15.86 ± 0.22 b\10.56 ± 0.15 d\
TrpBitter (−)\30.15 ± 0.44 a\21.51 ± 0.57 b\5.85 ± 0.09 c\29.47 ± 0.46 a\
PheBitter (−)90164.60 ± 3.94 a1.83137.37 ± 0.23 b1.5344.93 ± 0.46 c0.50153.09 ± 8.62 a1.70
IleBitter (−)90183.26 ± 4.11 a2.04153.86 ± 3.19 b1.7152.21 ± 0.67 c0.58190.82 ± 0.61 a2.12
LeuBitter (−)190414.28 ± 4.35 b2.18354.51 ± 4.84 c1.87135.12 ± 3.15 d0.71437.66 ± 2.51 a2.30
HypBitter (\)\159.88 ± 0.69 a\130.65 ± 3.02 b\90.81 ± 2.89 c\118.79 ± 9.26 b\
CitBitter (\)\7.61 ± 0.08 c\12.02 ± 0.35 b\2.68 ± 0.04 d\13.82 ± 0.28 a\
AsnOdourless\78.78 ± 0.19 b\56.90 ± 1.04 c\17.90 ± 0.34 d\90.40 ± 2.39 a\
GlnOdourless\3.45 ± 0.03 c\4.77 ± 0.11 b\1.71 ± 0.04 d\7.53 ± 0.10 a\
GabaOdourless\568.32 ± 3.04 b\553.98 ± 5.21 c\199.20 ± 0.59 d\619.59 ± 4.10 a\
Total Amino Acid Content4228.76 ± 37.14 b3767.25 ± 51.26 c1495.77 ± 22.63 d4328.70 ± 41.37 a
Note: + Good taste; − Bad taste; \ Corresponding values were not found or could not be calculated; different lowercase letters in the same row indicate significant differences between groups (p < 0.05).
Table 2. VOC content of Xuanwei ham.
CategoriesPKLibraryCASRT/minContent/(μg/100g)
W1W2W3W4
SaltsA1Trimethyl borate000121-43-76.18118.26 ± 2.63 d239.82 ± 5.46 a179.07 ± 9.51 b152.94 ± 2.91 c
A2Methyl butyrate000623-42-78.1111.86 ± 2.13 c21.96 ± 1.46 b\26.94 ± 3.03 a
A3Methyl 2-methylbutyrate000868-57-58.7143.47 ± 1.79 a\\38.71 ± 2.01 b
A4Methyl isovalerate000556-24-19.0341.64 ± 1.72 b53.93 ± 2.68 a\33.49 ± 3.12 c
A5Methyl caproate000106-70-714.1389.44 ± 1.86 b213.30 ± 2.49 a10.29 ± 1.22 c93.04 ± 2.35b
A6Methyl octanoate000111-11-520.3070.34 ± 2.04 c234.75 ± 3.22 b\364.52 ± 3.69a
A7Methyl n-caprate000110-42-925.7425.50 ± 2.00 c51.34 ± 2.19 b7.57 ± 2.07 d261.30 ± 1.85a
A8Dodecanoic acid, methylester000111-82-030.564.36 ± 1.83 c12.07 ± 1.34 b5.41 ± 1.94 c18.25 ± 2.15a
A9Methyl myrist000124-10-734.8827.54 ± 0.99 b39.53 ± 2.25 a18.08 ± 2.71 c37.64 ± 1.67a
A10Methyl hexadecanoate000112-39-038.8585.20 ± 1.93 b141.80 ± 1.49 a63.71 ± 1.50 d75.93 ± 3.28c
A111,6-Hexanediol diacrylate013048-33-438.9262.45 ± 2.52 b91.83 ± 1.44 a13.55 ± 2.00 d27.63 ± 1.25c
A12Octadecanoic acid, methyl ester000112-61-842.5122.16 ± 1.53 b31.57 ± 2.13 a17.43 ± 1.81 c21.82 ± 1.53b
A13Methyl oleate000112-62-942.8655.45 ± 1.96 c84.05 ± 2.43 a57.44 ± 2.15 c67.26 ± 0.84b
A14Methyl linoleate000112-63-043.6663.07 ± 2.61 b83.39 ± 2.71 a20.04 ± 3.44 d44.55 ± 1.99c
A15Methyln-nonanoate001731-84-623.16\\\13.53 ± 1.81
A16Ethyl caprate000110-38-325.78\\\6.61 ± 1.92
A174-Decenoic acid, methylester, (4Z)-007367-83-127.05\\\132.56 ± 2.37
Subtotal 720.75 ± 5.59 c1308.35 ± 2.02 b392.61 ± 9.97 d1416.70 ± 0.64 a
AldehydeB1Isovaleraldehyde000590-86-36.4632.01 ± 1.77 c114.82 ± 1.50 a9.40 ± 1.07 d43.44 ± 1.79 b
B2Hexanal000066-25-111.0510.31 ± 1.95 b15.59 ± 2.14 a4.44 ± 1.12 c\
B31-Nonana000124-19-620.5059.30 ± 1.73 b147.36 ± 2.16 a11.70 ± 1.35 c56.38 ± 1.00 b
B4Phenylmethana000100-52-724.2162.51 ± 2.16 c157.20 ± 2.41 a15.51 ± 1.27 d74.66 ± 0.74 b
B5Phenylacetaldehyde000122-78-127.0276.54 ± 0.54 b122.30 ± 1.75 a28.93 ± 1.70 c\
B6trans,trans-2,4-Decadien-1-al025152-84-530.978.45 ± 2.18 b18.97 ± 1.66 a\\
B7Tetradecanal000124-25-433.2018.92 ± 1.57 b29.09 ± 1.47 a\16.63 ± 2.04 b
B8Pentadecanal002765-11-935.3426.31 ± 2.19 b44.21 ± 2.00 a\24.52 ± 2.16 b
B9Hexadecanal000629-80-137.411029.03 ± 2.34 b1334.18 ± 2.37 a169.45 ± 1.84 d638.27 ± 1.84 c
B10Heptadecanal1000376-70-039.3568.20 ± 2.04 b72.42 ± 1.82 a14.37 ± 1.25 d46.29 ± 2.06 c
B11Octadecanal000638-66-441.23195.35 ± 2.03 a143.28 ± 1.77 b25.42 ± 2.09 d98.52 ± 2.35 c
B1213-Octadecenal, (13Z)-058594-45-941.66142.35 ± 1.82 a112.64 ± 1.96 b17.48 ± 1.92 d75.19 ± 2.05 c
B132-Methylbutyraldehyde000096-17-36.38\16.66 ± 1.50 a\12.56 ± 2.07 b
B142-Undecenal002463-77-629.61\\27.33 ± 1.87\
Subtotal 1729.29 ± 10.07 b
2328.71 ± 3.92 a
324.03 ± 10.79 d1086.46 ± 4.30 c
HydrocarbonsC1Valencene004630-07-328.078.35 ± 2.25 ab5.54 ± 2.07 b\9.27 ± 2.05a
C2trans-Caryophyllene000087-44-528.9021.90 ± 1.47 c39.36 ± 2.15 a7.39 ± 1.08 d29.25 ± 2.01b
C3alpha-himachalene003853-83-628.9827.63 ± 1.90 c54.13 ± 1.00 a11.94 ± 1.48 d35.92 ± 2.54b
C4delta-Cadinene000483-76-129.6053.59 ± 1.80 c124.63 ± 0.98 a\56.91 ± 1.74b
C5germacrene d023986-74-529.7013.50 ± 1.96 c25.53 ± 1.97 a6.41 ± 0.80 d17.25 ± 2.21 b
C6α-curcumene000644-30-429.9322.45 ± 2.03 c48.73 ± 2.53 a11.54 ± 1.00 d32.57 ± 0.99 b
C7Cuparene016982-00-631.1314.32 ± 1.02 b25.86 ± 2.02 a6.51 ± 0.92 c25.51 ± 1.79 a
C8Calamenene000483-77-231.2912.44 ± 2.07 c30.58 ± 2.13 a\21.73 ± 1.33 b
C9D-Limonene005989-27-514.37\22.39 ± 2.04\\
C10Pentadecane000629-62-923.5720.56 ± 0.96 b34.51 ± 1.04 a7.84 ± 1.50 c18.65 ± 2.35 b
C11n-Hexadecane000544-76-326.0732.38 ± 2.12 b49.43 ± 1.94 a\19.26 ± 1.02 c
C12n-Heptadecane000629-78-728.4114.57 ± 1.01 b23.59 ± 2.01 a\9.32 ± 1.56 c
C13Hexane000110-54-33.69\45.68 ± 1.79 b88.89 ± 1.66 a23.53 ± 1.87 c
C14Heptane000142-82-54.00\41.91 ± 1.53 a37.26 ± 0.86 b16.35 ± 1.05 c
C15Cyclohexane000110-82-74.09\78.6 ± 2.04 a64.43 ± 2.06 b38.59 ± 2.08 c
Subtotal 241.67 ± 2.80 c650.50 ± 3.49 a242.21 ± 2.13 c354.10 ± 9.46 b
AlcoholD1Mushroom alcohol003391-86-421.967.58 ± 1.79 b28.03 ± 1.48 a\10.05 ± 1.86 b
D2Dodecyl alcohol000112-53-833.9216.48 ± 0.89 b37.23 ± 1.86 a4.42 ± 0.99 c\
D31-Octanol000111-87-524.76\30.31 ± 1.03\\
D42-Phenylethanol000060-12-832.90\14.35 ± 0.85 a\7.39 ± 2.18 b
D5Dodecyl alcohol000112-53-833.92\\33.51 ± 1.88 a9.30 ± 1.20 b
Subtotal 24.06 ± 2.64 d109.92 ± 0.38 a37.92 ± 0.89 c32.74 ± 3.57 b
ElseE1Butylated hydroxytoluene000128-37-032.858.10 ± 1.68 b11.47 ± 0.96 a\5.56 ± 1.93 b
E2Phenol000108-95-234.7312.37 ± 2.03\\\
E32,4-Di-tert-butylphenol000096-76-440.28\8.41 ± 2.02\\
E4Methyl tridecyl ketone002345-28-035.187.69 ± 1.52 b\\10.19 ± 1.40 a
E52,6-Dimethyl pyrazine000108-50-918.9419.52 ± 1.95\\\
E6Estragole000140-67-031.29\\10.45 ± 0.84\
E7Dimethyl sulfoxide000067-68-526.07\\15.40 ± 2.07\
Subtotal 47.67 ± 7.08 a19.88 ± 1.07 bc25.85 ± 1.34 b15.75 ± 0.57 c
Aggregate59 2763.44 ± 3.88 c4417.35 ± 3.60 a1022.62 ± 20.76 d
2944.08 ± 9.71 b
\ Corresponding values were not found or could not be calculated; different lowercase letters in the same row indicate significant differences between groups (p < 0.05).
Table 3. Corresponding information of electronic nose sensors.
TransducersResponsive SubstanceCategory Substances
S1Alkanes, fumesPropane, natural gas, fumes
S2Alcohols, aldehydes, short-chain alkanesAlcohol, fumes, isobutane, formaldehyde
S3Ozone (O3)\
S4SulphideHydrogen sulphide
S5Organic amineAmmonia, methylamine, ethanolamine
S6Organic gases, benzophenones, alcohols, and aldehydes; aromatic compoundsToluene, acetone, ethanol, hydrogen, and other organic vapours
S7Short-chain burnt hydrocarbonsMethane, natural gas, biogas
S8Aromatic compounds, alcohols, and aldehydesToluene, formaldehyde, benzene, alcohol, acetone
S9Hydrogen-containing gasHydrogen (gas)
S10Flammable gasesMethane CH4
\ Corresponding values were not found or could not be calculated.
Table 4. Bacterial diversity of Xuanwei ham in different years.
W1W2W3W4
chao1262.72232.83405.41253.079
observed_features231200.33342214.33
shannon_entropy3.714.094.613.69
Simpson0.780.840.890.79
Raw Base (GB)6.646.097.196.33
Clean Reads197,130170,440255,527189,746
Clean Q20 (%)99.4299.3699.2999.40
Clean Q30 (%)97.9197.7897.4697.86
Clean GC (%)42.3342.6743.0041.00
Disclaimer/Publisher’s Note: The statements, opinions and data contained in all publications are solely those of the individual author(s) and contributor(s) and not of MDPI and/or the editor(s). MDPI and/or the editor(s) disclaim responsibility for any injury to people or property resulting from any ideas, methods, instructions or products referred to in the content.

