Abstract
In this study, proteins were prepared from Schizochytrium pombe residue after oil extraction using isoelectric point precipitation, and their physicochemical and emulsifying properties were investigated. Our objective was to assess the suitability of these proteins for functional ingredient applications. Through a one-way experiment and optimization using response surface design, the effects of time, temperature, pH, and the material–liquid ratio of NaOH alkaline extraction were explored. The isoelectric point is verified by isoelectric point precipitation; the results revealed that crude protein from Schizochytrium (SCP) is minimally soluble at pH 4.2. Compared with whey protein (WP), it promotes better emulsion stability through the emulsification test. This study suggests that Schizochytrium oil-processing byproducts represent a promising source of protein, with potential applications as functional ingredients, offering implications for the usage of these byproducts in various industries.
1. Introduction
Docosahexaenoic acid (DHA) is an omega-3 polyunsaturated fatty acid with a variety of physiological functions. These include promoting brain neurodevelopment, improving vision, anti-inflammatory effects, improving immunity, and maintaining intestinal and cardiovascular health [1,2]. DHA supplements are becoming increasingly popular as people pursue healthy diets. The primary dietary source of DHA is marine resources, such as deep-sea fish. The implementation of marine resource protection measures has led to a gradual increase in the price of DHA, prompting individuals to seek alternative nutrient sources. Schizochytrium, a single-celled marine microorganism, can accumulate high levels of DHA (20–25% of the cell dry weight) when cultured heterotrophically. This is regarded as an optimal new resource for DHA [3].
Currently, studies on the production of DHA by Schizochytrium have primarily focused on the optimization of the fermentation process and the extraction of DHA. Consequently, little attention has been paid to the nutritional components, processing, and utilization of the residual cells of Schizochytrium after oil extraction. Currently, cell residue is used solely as animal feed or fertilizer, and lacks high-value commercial applications. The protein content of Schizochytrium oil extraction residues was determined to be approximately 40%, rendering them an optimal source of high-purity protein.
The most common protein extraction methods include alkaline extraction and isoelectric precipitation [4], solvent extraction [5], reverse micellar extraction, enzymatic, microwave, and ultrasonic-assisted extraction. The extraction method and conditions used affect the rate of protein extraction. Alkaline extraction–isoelectric precipitation is the most widely used and industrialized protein extraction method, largely because of its advantages of simple operation, easy control, and low cost [5,6]. Fan Xing studied the protein extraction process of the algal residue of Scenedesmus dimorphus [7], revealing that the optimal extraction conditions were as follows: the extraction value of pH was 12, the ratio of liquid to solid was 40 mL/g, the extraction temperature was 45 °C, and the extraction time was 140 min. Under these conditions, the extraction rate of the algal residue protein was 40.13%. McHardy extracted proteins from microalga C. vulgaris using an alkali extraction and acid precipitation method [8], resulting in a protein recovery of 79.1% ± 5.3%. This was 1.32 times higher than that in the control group without ultrasonic treatment.
In industrial production, proteins are used in a variety of applications, including the stabilization of emulsions, the prevention of foaming, and the fortification of nutritional products. These applications are closely related to the physicochemical characteristics of proteins, and the protein source and extraction process exert a profound influence on their physicochemical characteristics. Emulsification is one of the most important physicochemical properties of proteins. Proteins are employed in a multitude of food products, including milk, mayonnaise, salad dressings, baked goods, and frozen desserts, owing to their emulsification properties [9]. The emulsification activity of proteins is typically quantified by measuring their emulsification activity/stability index (EAI/ESI) [10].
In this study, the residual residue resulting from DHA extraction was used as raw material. The protein extraction process was optimized, and the emulsification characteristics of the protein were studied to establish a foundation for the development and use of defatted Schizochytrium residues (DOS).
2. Materials and Methods
2.1. Materials and Reagents
Schizochytrium was supplied by Qingdao Keyuan Marine Biology Co., Ltd. (Qingdao, China). Artificial seawater (Sodium chloride 11.2 g/L, potassium chloride 0.8 g/L, magnesium sulfate 1.9 g/L, magnesium chloride 2.6 g/L, dissolved in purified water); seed medium (glucose 50 g/L, MSG (Lotus, Zhoukou, China)10 g/L, yeast (Angel Yeast, Yichang, China) 10 g/L, purified water and artificial seawater are added at a proportion of 50% (v/v) each, to dissolve; filling volume, 50 mL/500 mL of a triangle bottle, sterilization condition: 118 °C heating for 20 min); glucose fermentation medium (glucose 120 g/L, yeast powder 10 g/L, sodium glutamate 20 g/L, ammonium sulfate 1 g/L, purified water and artificial seawater accounted for 50% (v/v) dissolved, 500 mL conical bottle with liquid volume 50 mL, sterilization conditions: 118 °C heating for 20 min).
The components of the DOS are as follows: proteins (43 ± 3 g/100 g dry matter), ash (6.23 ± 1.32 g/100 g dry matter), total sugar (22.5 ± 1.5 g/100 g dry matter), and fats (4.8 ± 0.5 g/100 g dry matter). DOS was subjected to two successive Soxhlet extractions with hexane for 12 h. The freeze-dried Schizochytrium/hexane ratio was 1:20 at each step. The degreased algae residue was stored in a refrigerator at −4 °C in the dark.
Whey protein (WP) was procured from Fonterra (Auckland, New Zealand) and had an estimated protein content of approximately 80% (80% of the dry matter). The solvents and chemicals used were of analytical grade.
2.2. Preparation of Defatted Schizochytrium Residues (DOS)
The glycerol cryovial with Schizochytrium stored in the refrigerator at −80 °C was inoculated into the seed medium with an inoculation amount of 0.4% (v/v), and incubated at 28 °C at 180 r/min with constant temperature oscillation and continuous cultivation for 22 h. Subsequently, the cultured seed medium was inoculated in the fermentation medium at 5% (v/v) inoculum volume, the culture temperature was 28 °C, and the same constant temperature and shock culture was 180 r/min for 96 h, after which it was collected and centrifuged at 6000× g for 5 min. The supernatant was discarded, Schizochytrium was washed twice with deionized water, and cells were collected for steam deodorization pretreatment (heat to remove the fishy smell). The main step is to heat the collected cells using steam at 100 °C for 15 min in an autoclave (ZEALWAY, America). The cells were then freeze-dried, and used for oil extraction. Subsequently, lyophilized Schizochytrium was subjected to wall-breaking treatment using a traditional Chinese medicine grinder (Lingsum, Lishui, China), and Schizochytrium oil was extracted using Soxhlet extraction for 10 h; defatted Schizochytrium residues (DOS) were subjected to two successive Soxhlet extractions with hexane for 2 h. The freeze-dried Schizochytrium/hexane ratio was 1:20 at each step. The degreased algae residue was stored in a refrigerator at −4 °C in the dark. A uniformly defatted Schizochytrium residue powder was prepared from Schizochytrium and used as a raw material for protein extraction.
2.3. Preparation of Crude Protein of Schizochytrium (SCP)
2.3.1. Extraction of SCP and Determination of Extraction Rate
Accurately weigh the DOS (dry base) and mix with distilled water, adjust the mixture to a certain pH with NaOH, and then place the mixture in a beaker and place it at a certain bath temperature for a specified time. After that, centrifuge the mixture at 8000× g for 10 min. The supernatant was collected and the protein content in the extract was detected using the Kjeldahl method. The supernatant was then adjusted to pH 4.2 with 1 mol/L HCl. Centrifuge the solution again (8000× g, 10 min) and collect the pellet. The pellet of crude protein is then freeze-dried and stored at −20 °C.
The total protein content in the DOS was m2 and the protein content in the extract supernatant was m1, determined using a fully automated Kjeldahl nitrogen analyzer (FOSS, Kjeltec™8400, Yangzhou, China), and calculated using a protein conversion factor of 6.25. The SCP protein extraction rate was calculated using Equation (1).
2.3.2. Single-Factor Experiments and Determination of Extraction Rate
Defatted Schizochytrium residue (DOS) and distilled water were combined in varying proportions (1:10, 1:15, 1:20, 1:25, 1:30, 1:35, 1:40), and the pH (9, 10, 11, 12, 13) was adjusted using sodium hydroxide. The water bath was agitated at various temperatures (35 °C, 40 °C, 45 °C, 50 °C, 55 °C) for a specified duration (90 min, 120 min, 150 min, 180 min, 210 min, 240 min). The specific steps are as follows: Accurately weigh 10.00 g of DOS (dry base) and add it to distilled water, mix it according to the ratio (1:10, 1:15, 1:20, 1:25, 1:30, 1:35, 1:40), and determine the optimal extraction material to liquid ratio. The other factors are set to a temperature of 40 °C, a time of 180 min, and a pH of 9. After determining the optimal extraction solid–liquid ratio-X, the pH (9,10,11,12,13) was changed, other factors were taken as the optimal solid–liquid ratio-X; the temperature was 40 °C, and the time was 180 min. According to this method, the optimal parameters of four single factors are obtained for subsequent testing.
After which, centrifugation was performed at 8000× g for 10 min at 20 °C. The supernatant was collected, and the pH was adjusted to 4.2 with 1 mol/L HCl. After letting it stand for a period of 30 min, the sample was centrifuged at 8000× g for 10 min. Subsequently, precipitation and suspension were performed in pure water with a total solids content of 5% (w/v). The pH was adjusted to 7 using 1 mol/L NaOH. Crude protein from Schizochytrium (SCP) was produced and subsequently freeze-dried.
2.3.3. Response Surface Analysis
This study was based on the principles of the Box–Behnken experimental design, which is based on the optimal extraction material–liquid ratio obtained (1:30) from single-factor experiments. To identify the optimal extraction conditions, three factors—temperature, pH, and time—were selected for a response surface experimental design (Table 1). The response surface software Design Expert was used to simulate and validate the model at three factors and levels. Finally, the experimental data were analyzed using Design Expert software (Version 13.0, Stat-Ease Inc., Minneapolis, MN, USA). The experiment was conducted in a randomized manner to minimize the potential for errors resulting from any systematic trends in the variables.

Table 1.
Factors of Box-Behnken design and coding level.
2.4. Determination of Main Components
Protein, lipid, moisture, and ash content was determined according to the standard AOAC method [11], and carbohydrate content was determined according to Cuesta and Suarez [11,12].
2.5. Study on the Properties of SCP Emulsions
2.5.1. Surface Tension
A contact angle and surface tension meter (Krüss Force Tensiometer K20, Hamburg, Germany) was used to assess the interfacial tension of the protein at the oil–water interface. First, configured SCP solutions of varying concentrations and pH values were poured into a glass dish. The purified peanut oil was then gently spread on top of the protein solution, which was subsequently placed on a vertically movable platform and protected by a glass cover. The testing mica sheet (24 × 10 × 0.1 mm) was fixed at the bottom of a high-precision electronic balance, and the platform was slowly raised to immerse the mica sheet in the measured solution to detect the oil–water interfacial tension. A mica sheet (24 × 10 × 0.1 mm) was affixed to the base of a high-precision electronic balance, and the gradual elevation of the platform submerged the mica sheet in the measured solution, enabling the detection of an oil–water interfacial tension.
2.5.2. Emulsion Preparation
The SCP was quantitatively weighed in pure water and stirred for 10 h to achieve complete dissolution. Subsequently, peanut oil (Luhua, Laiyan, China) (15%, v/v) was added proportionately, and the disperser (Guangzhou AICA Instrument Co., Ltd., Zhaoqing, China) was operated at 10,000× g for 90 s, and then again for another minute after a 2 s pause at 200 bar using high-pressure homogenization (Rexroth, ATS, Suzhou, China). The WP emulsion was prepared in a similar manner for the SCP emulsion.
2.5.3. Protein Emulsifying Properties (EAI/ESI)
The emulsifying activity index (EAI) and emulsifying stability index (ESI) were determined according to the methodology proposed by Zhang [13]. After adjusting the pH, the protein solution and vegetable oil were homogenized at 10,000× g for 90 s at different concentrations to prepare emulsions. After the emulsion is prepared, 20 μL of emulsion is quickly drawn from the bottom with a pipette, diluted in 5 mL 0.1% SDS solution, vortexed for 10 s, then a UV–VIS spectrophotometer (TU-1900, Beijing Purkinje General Instrument Co., Ltd., Beijing, China) is used to read the absorbance at 500 nm. A second aliquot of the emulsion is then taken 20 min later, following the same procedure. Emulsifying activity and stability were calculated using Equations (2) and (3), respectively.
where D represents the dilution multiple, 250; A0 is the light absorption value at 500 nm; φ is the volume fraction of the oil drop, 0.25; C represents the protein mass per unit volume before emulsification in grams per unit (g/mL); and 10,000 is the correction factor in square meters, where A1 is the absorbance of the emulsion at 500 nm after 0 min, A2 is the absorption value of the emulsion at 500 nm after standing for 20 min, and t is the emulsion stabilization time (20 min).
2.5.4. Average Particle Size of Emulsion
A laser particle size analyzer (NanoBook 90Plus PALS, Nashua, NH, USA) was used to measure the mean particle size d4,3 (volume-weighted average diameter) of the emulsion. Pure water and 1% SDS were used as the dispersants. The refractive indices of the dispersed and continuous phases were set to 1460 and 1330, respectively, and each sample was measured thrice in parallel [14].
2.5.5. Creaming Index (CI)
The CI was determined by transferring freshly prepared emulsions (15% peanut oil/SCP, w/w) into clear glass bottles (22 × 100 mm), The CI was calculated using Equation (4).
The CI was developed by Liang [15] with some modifications. The total height of the emulsion Hs is the height of the separated oil phase above (already reduced), and Ht is the height of emulsified layer at the start of the creaming test (at a time of zero); the emulsion was placed vertically at 25 °C, and the height of the emulsified layer was measured every 5 days.
2.5.6. Microstructure of Emulsions
The microstructure of the emulsions was observed using an ordinary light microscope (CX23; Olympus Corporation, Tokyo, Japan). A drop of the emulsion was placed on a slide, covered with a coverslip, and examined under an optical microscope at 40× magnification to observe the microstructure of the SCP-stabilized emulsion.
2.6. Statistical Analyses
All experiments were conducted in triplicate, and the resulting data are expressed as standard deviation mean ± (SD). One-way ANOVA and Duncan’s multiple range test were used to analyze the data and identify significant differences between the samples. Statistical analyses were conducted using IBM SPSS Statistics [16], and the resulting data were considered statistically significant. The threshold for statistical significance was set at p < 0.05.
3. Results and Discussion
3.1. Optimization of SCP Extraction Process
Alkaline extraction and isoelectric precipitation is a commonly used protein extraction method that utilizes the high solubility of proteins under alkaline conditions to dissolve the proteins in a material into a solution. After centrifugation, the supernatant is retained, and the pH of the supernatant is adjusted to the isoelectric point of the protein, using an acidic solution to precipitate the protein and obtain crude protein. Alkaline extraction and isoelectric precipitation has been widely used for plant and microalgae protein extraction. The isoelectric point protein extraction process is divided into two steps: material protein leaching under alkaline conditions and isoelectric point precipitation. This study focused on optimizing the conditions for the alkaline leaching of proteins from defatted Schizochytrium residues (DOS).
3.1.1. Single-Factor Experiments
The protein extraction stage is influenced by several process parameters, including the feed/liquid ratio, feed/liquid pH, extraction temperature, and extraction time. These parameters affect the protein extraction rate and protein quality [17]. The results of the single-factor optimization of the alkaline leaching stage of the SCP process are presented in Figure 1. When the extraction pH increased from 9 to 12, the protein leaching rate increased, and the color of the feed solution remained unchanged. However, when the pH exceeded 12, the protein leaching rate decreased rapidly, and the color of the feed solution increased significantly. Vilg and Undeland [18] also demonstrated that protein extraction from Saccharina latissima biomass exhibited the highest protein extraction at pH 12. The optimal pH for general plant protein extraction is approximately 9–10 [19], whereas the optimal pH for algal protein extraction is between 11 and 12 [20]. Furthermore, the protein extraction rate decreased sharply at pH > 12.
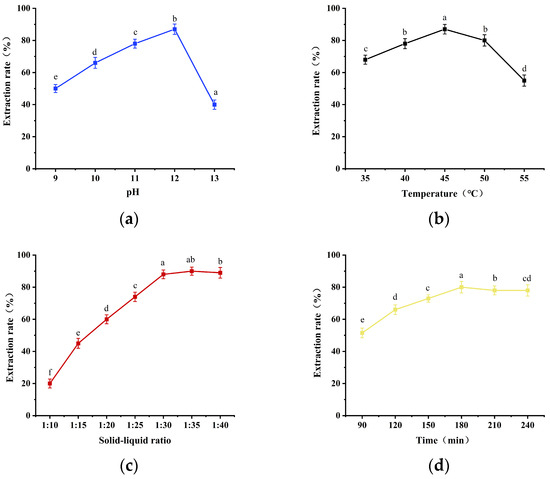
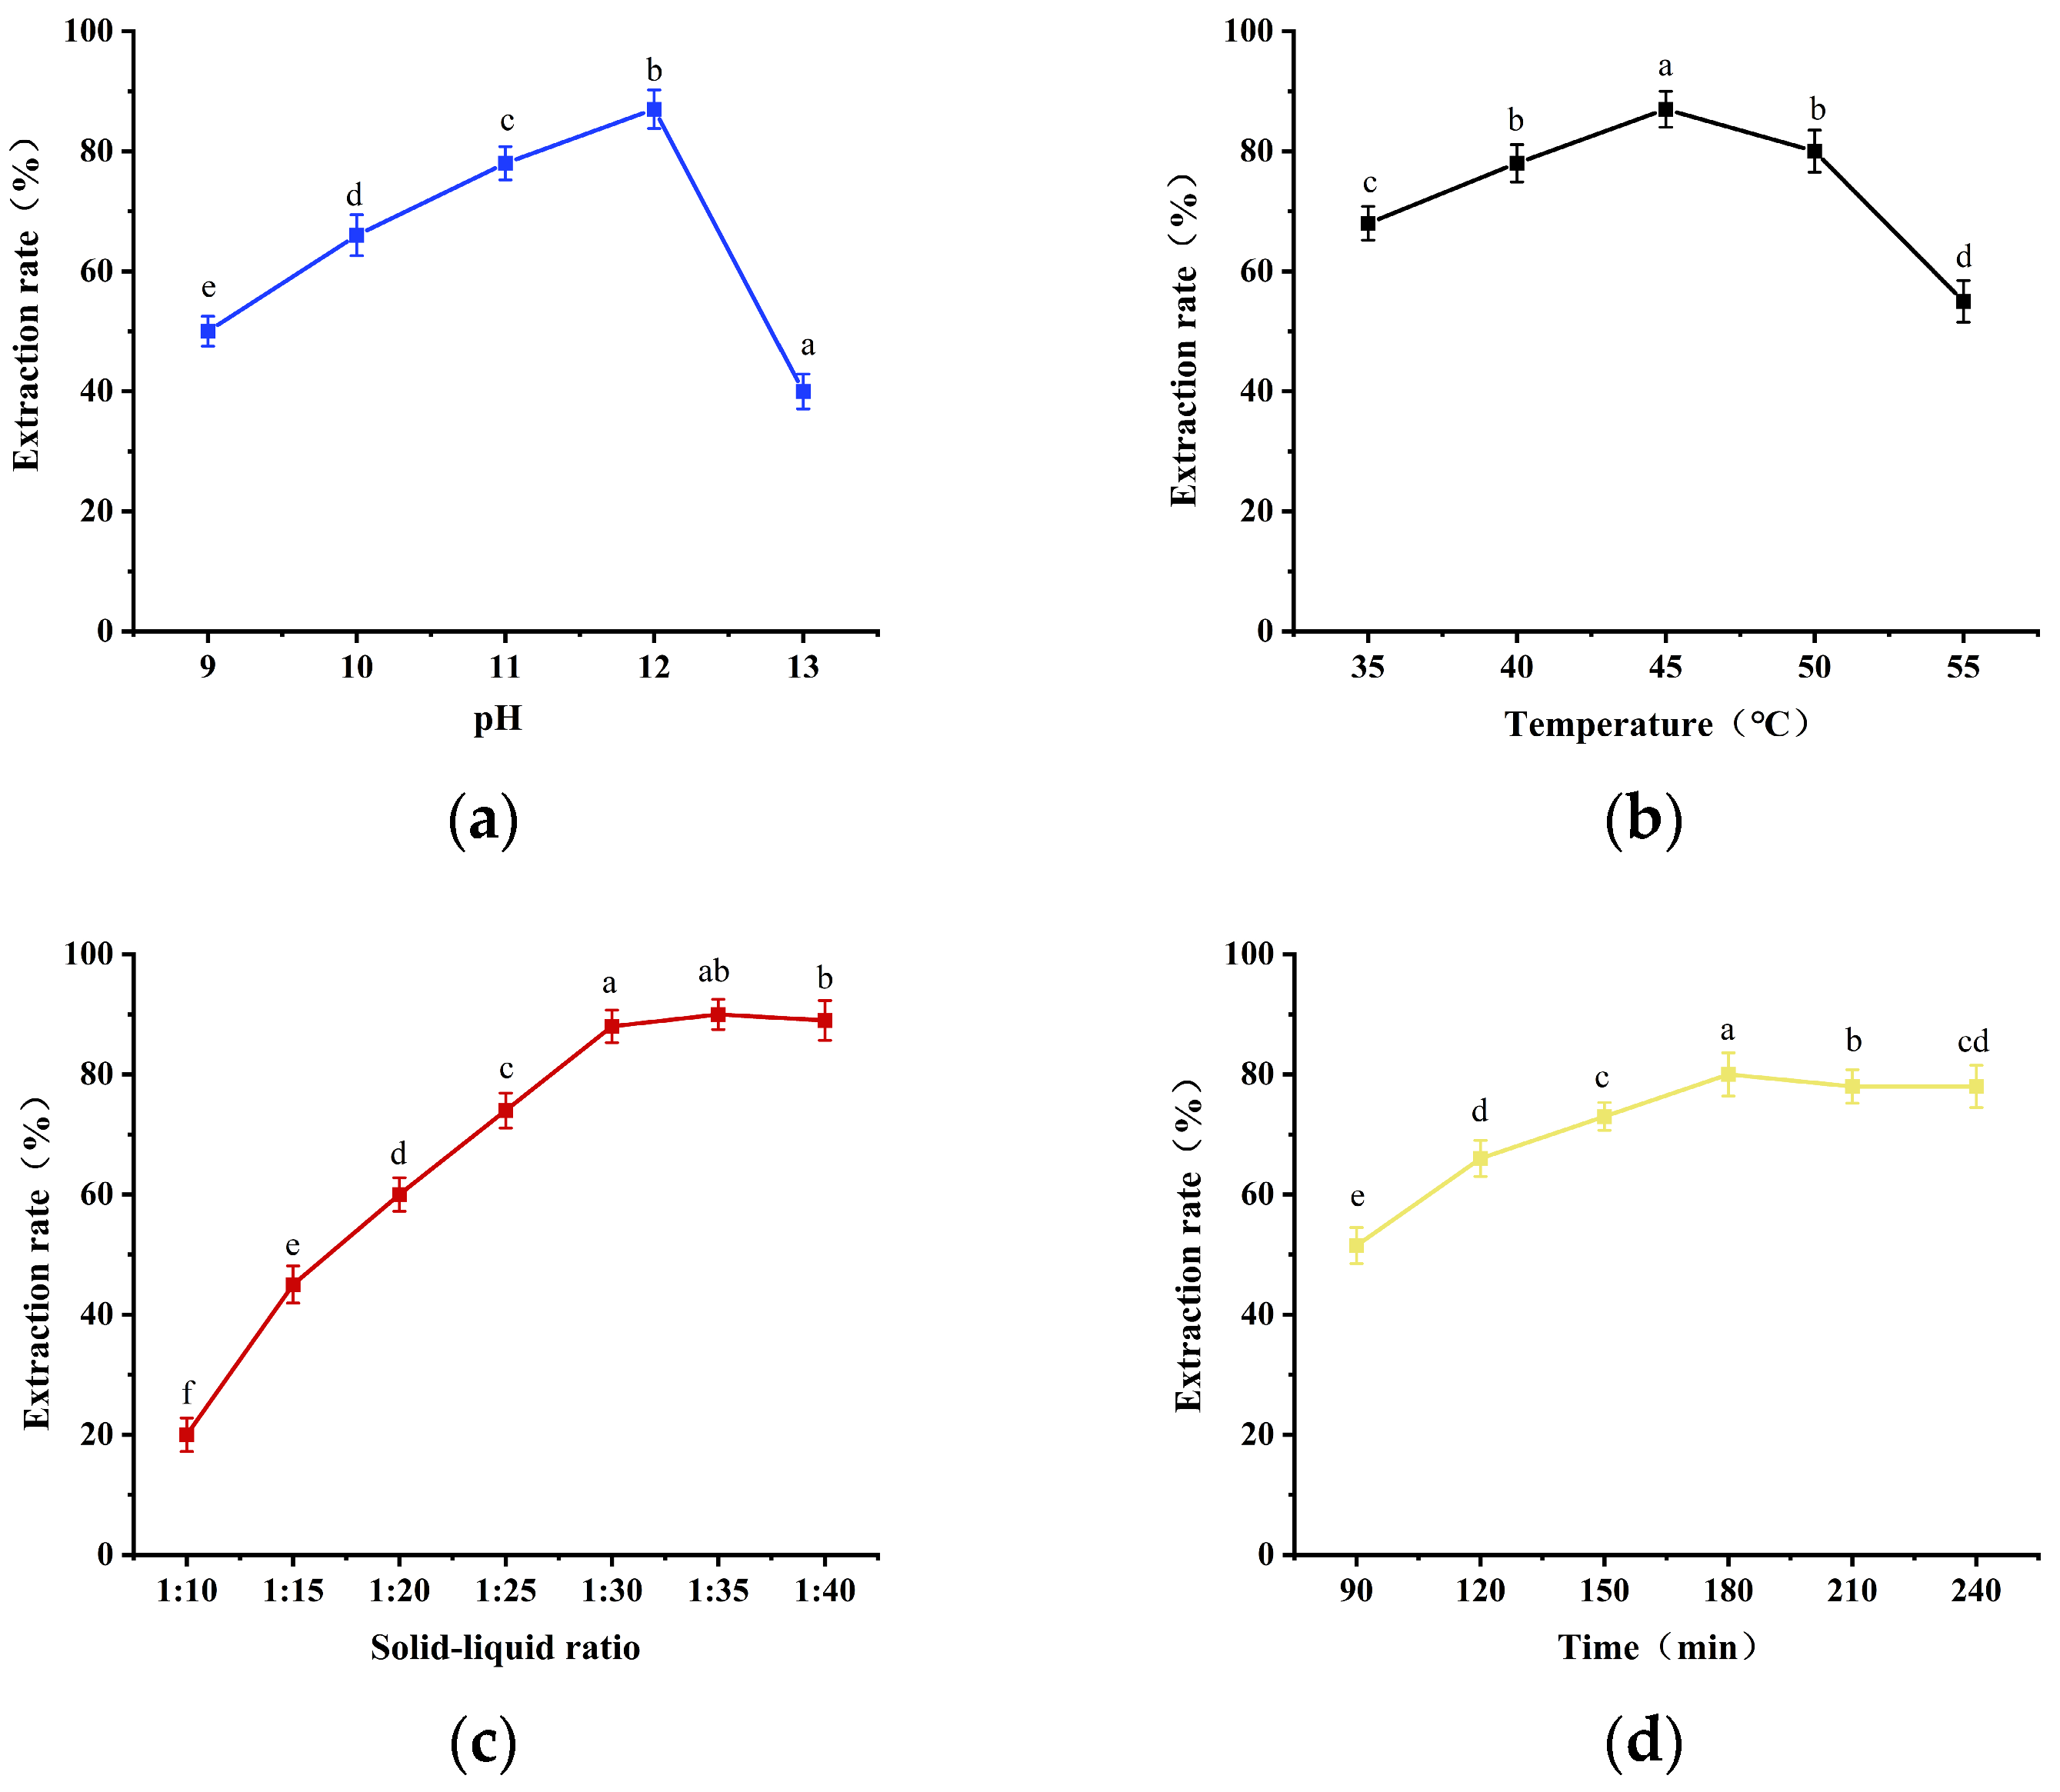
Figure 1.
Optimization of single-factor experiments for alkaline leaching of DOS proteins: (a) effect of pH on protein extraction rate; (b) effect of temperature on protein extraction rate; (c) effect of solid–liquid ratio on protein extraction rate; (d) effect of time on protein extraction rate. Different lowercase letters in the diagram suggest significant differences (p < 0.05).
Figure 1b shows that when the extraction temperature was 45 °C, the SCP extraction rate reached a maximum value of 87%. Furthermore, the protein leaching rate rapidly decreased when the temperature was lower than 40 °C or higher than 50 °C. This trend aligns with the extraction rate at the temperature observed in the extraction of Chlorella protein by Ursu [21]. In that study, the extraction rate of Chlorella protein also increased with increasing extraction temperature. However, this increasing trend slowed significantly when the temperature exceeded 40 °C. The slow leaching rate at low temperatures is the primary reason for this phenomenon. Conversely, elevated temperatures can lead to protein denaturation, reducing protein extraction. The feed/liquid ratio is also a crucial parameter for protein extraction. A low feed/liquid ratio is beneficial for increasing the protein concentration in the leachate, but it will concomitantly reduce the extraction yield, according to Gao [22]. The viscosity of a low feed/liquid ratio is too high, and the molecules are not easily diffusible, which leads to a low extraction rate. Conversely, a high feed/liquid ratio can enhance the total protein extraction rate, but the protein concentration in the leachate will be reduced accordingly, which is disadvantageous for subsequent isoelectric point precipitation. Figure 1c illustrates that the protein extraction rate reached a maximum of 88% when the material–liquid ratio was 1:30. Figure 1d demonstrates that the protein extraction rate reached a maximum at an extraction time of 180 min. The increase in extraction rate with increasing extraction time was not statistically significant after 180 min. This was due to the cohesive precipitation of proteins in the solution with increasing extraction time. Protein precipitation was eliminated along with the residue during filtration, which reduced the protein extraction rate. Ursu [21] also observed that the protein extraction rate of Chlorella vulgaris remained constant over time, in accordance with the change in Schizochytrium extraction time.
3.1.2. Results of Response Surface Test on the Extraction Rate of SCP
The present work was further optimized based on single-factor experiments using the Box-Behnke experimental design for the three factors of extraction temperature (A), extraction pH (B), and extraction time (C). The experimental combinations and results are listed in Table 2.
Table 2.
Experimental design and results of the response surface analysis.
Regression analyses of the experimental data in Table 2 were conducted using the Design Expert V10.0.7 software to ascertain the influence of the factors on the protein extraction rate and to identify potential interactions between them. The statistical significance of the models was also evaluated (Table 3). A regression model equation (Equation (5)) was derived from the regression analysis to describe the relationship between the extraction temperature (A), pH (B), extraction time (C), and true value extraction rate (Y). The p-value of the model was less than 0.0001, indicating that the model difference was highly significant. The out-of-fit term was 0.1249, which was greater than 0.05, indicating that it was not significant. This suggests that unknown factors have a minimal impact on the results. The order of influence of these factors can be determined from their F values. The factors were ordered as follows: pH (B) > extraction time (C) > extraction temperature (A). The coefficients of determination (R2) for the model were 0.9874, the corrected coefficient of determination (R2Adj) was 0.9713, and the predicted coefficient of determination (R2Pred) was 0.9017. These values indicate that the model was well-fitted to the actual experiments, with high credibility and good predictive performance. The coefficient of variation for the model was 4. The model exhibited a coefficient of variation of 25% (<5%), indicating excellent reproducibility. The signal-to-noise ratio of the model was 27.975, exceeding 4, demonstrating the credibility and suitability of the model for analyzing the change rule of the predicted response value with the independent variable.
Table 3.
Significance test of regression equation coefficients.
The optimal process conditions for the extraction of proteins were identified as pH 11.58, extraction temperature 46.11 °C, extraction time 188 min, and predicted mycobacterial protein solubilization rate of 94.16%. Verification experiments were conducted three times under these conditions, and the protein extraction rate of Schizochytrium pombe was 93.98 ± 0.9%. This result is consistent with the predicted value, confirming the accuracy and practicality of the equation.
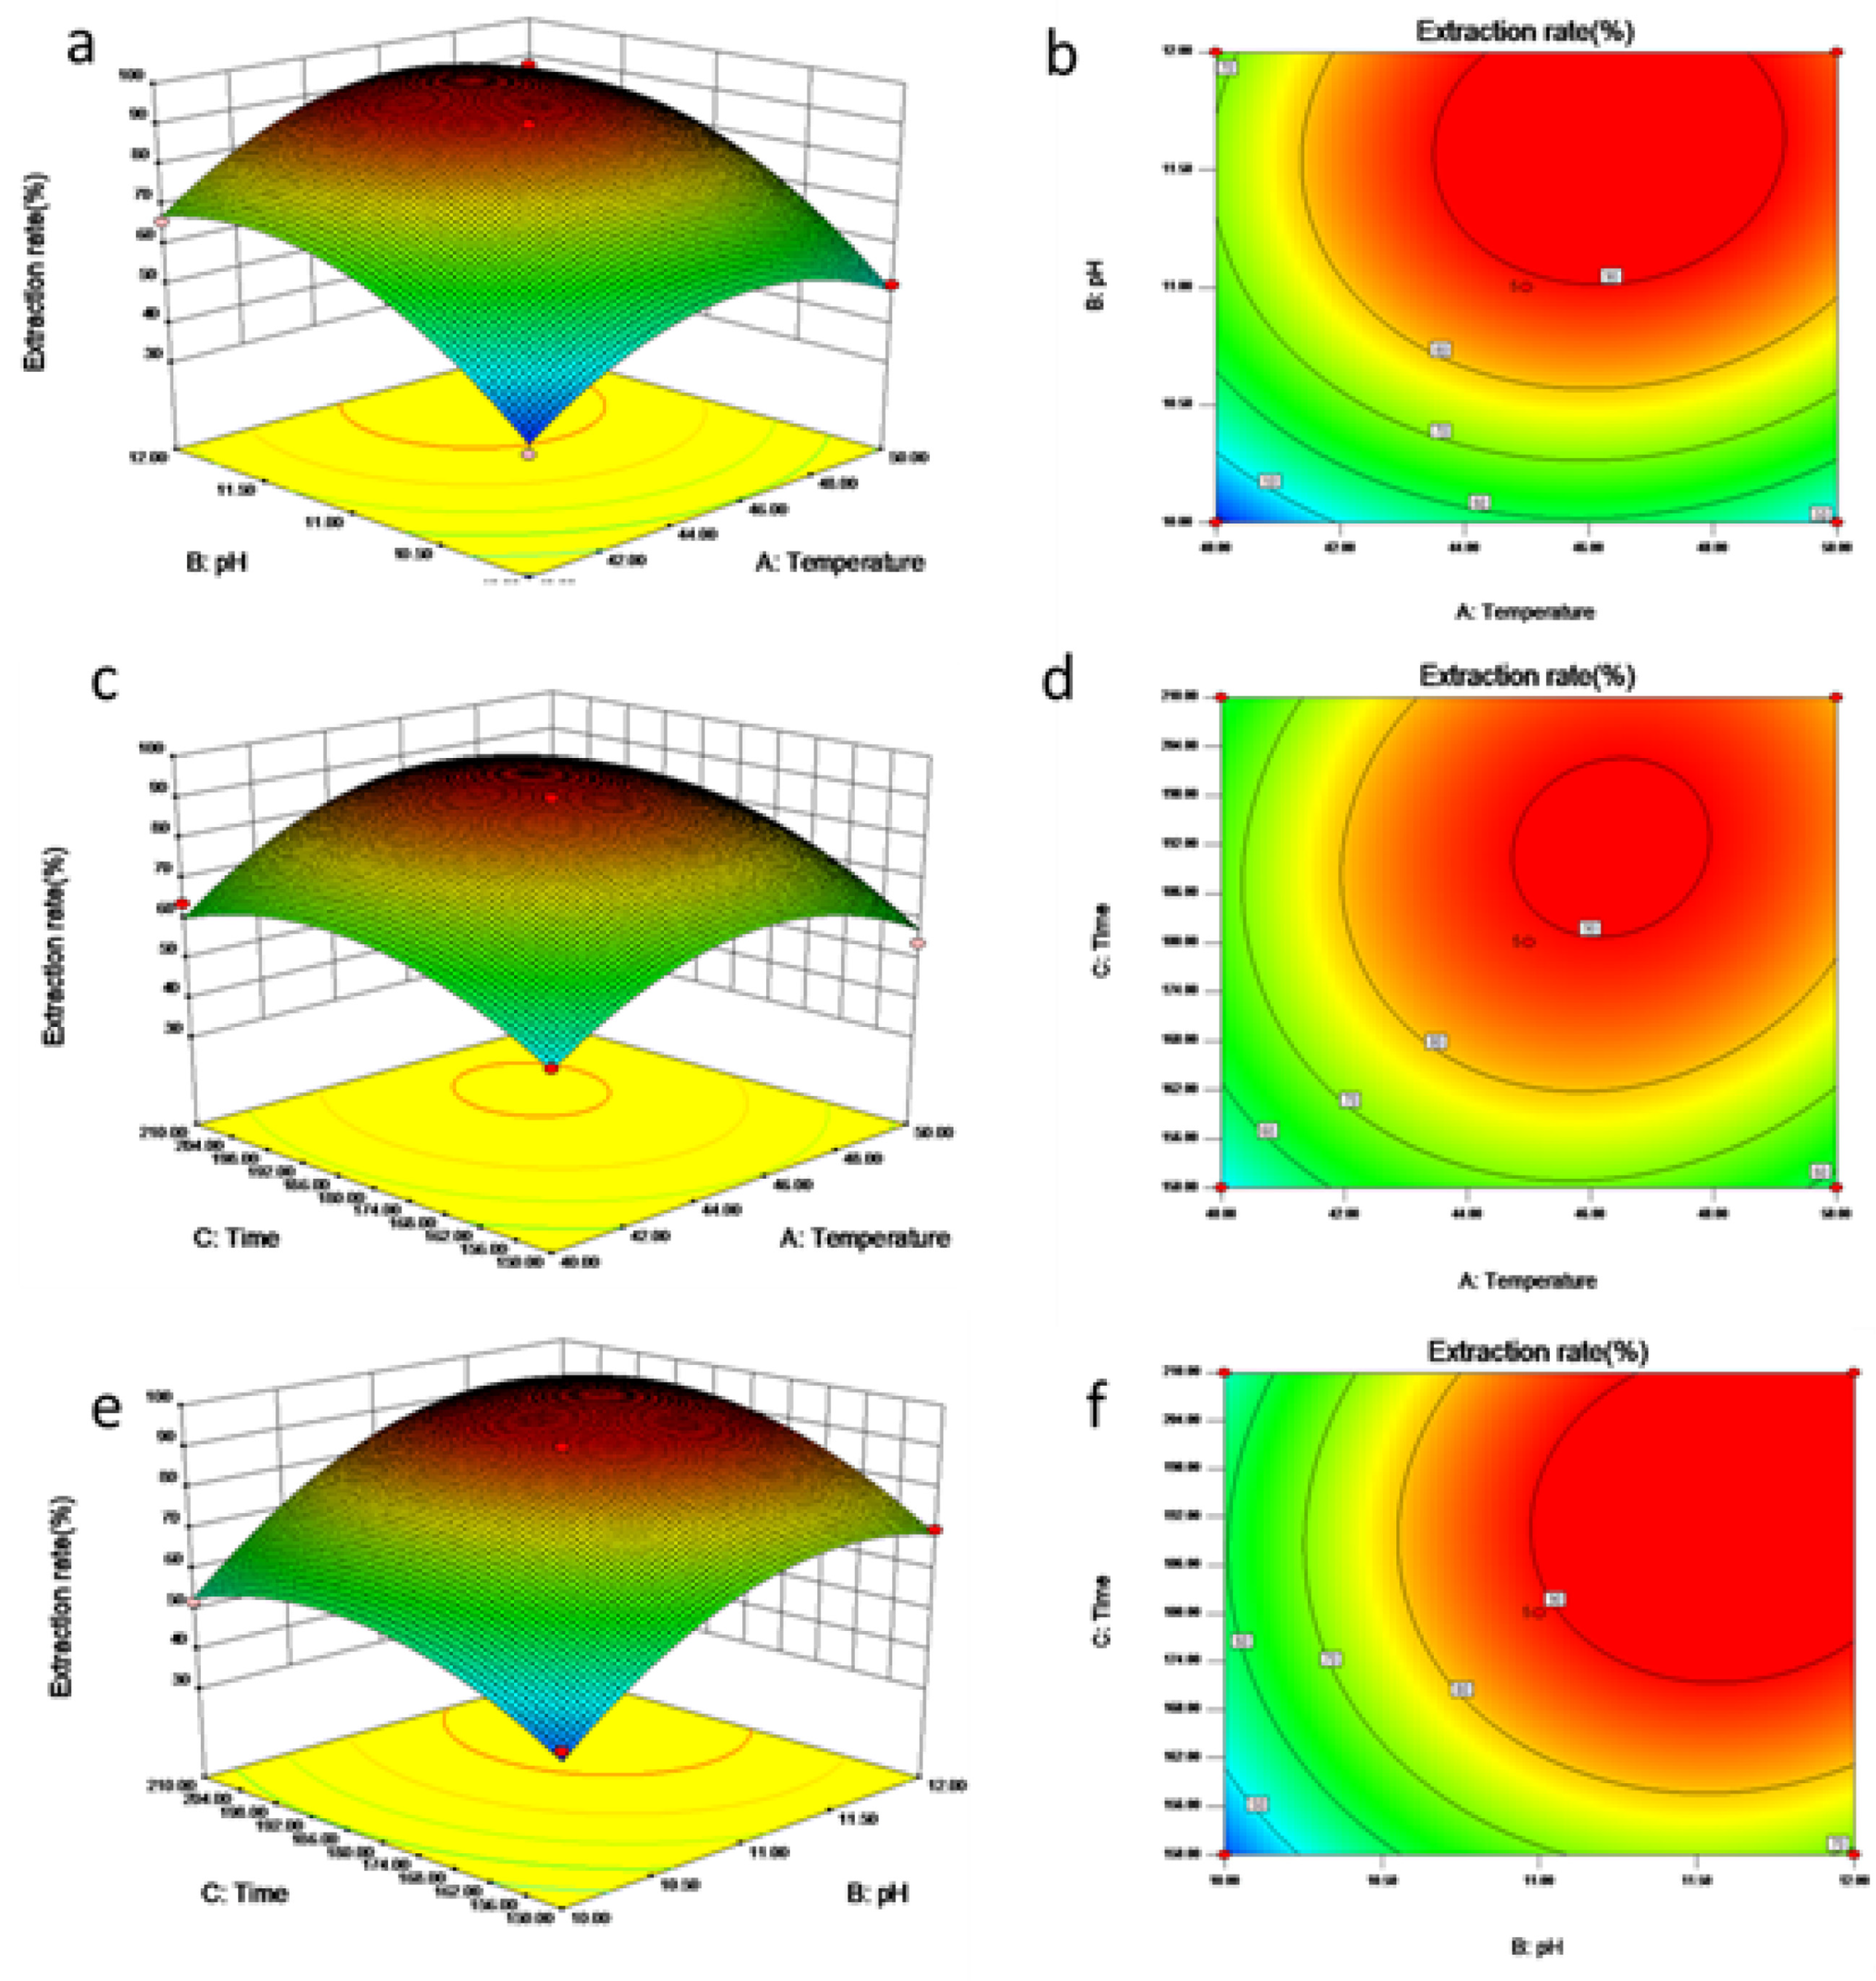
Three-dimensional response surface plots and contour plots were generated using the full model obtained from the regression equations (Figure 2), which demonstrated that higher SCP extraction rates were achieved at the center-time temperature and pH than at other temperatures (A) and pH (B) (Figure 2a,b). Furthermore, the two parameters of extraction temperature (A) and time (C) and extraction pH (B) and time (C) exhibited similar trends to those of temperature, pH (A), and time (C) (Figure 2c–f). These interactions demonstrated comparable trends with temperature and pH, as illustrated in Figure 2c–f. The slope of the 3D graph of the response surface intuitively reflects the influence of each of the two factors on the extraction rate of the SCP. A steeper surface indicates greater interaction between the two factors, resulting in a greater impact on the response value. Conversely, a shallower surface indicates a smaller impact. As illustrated in Figure 2, surface temperature (A) and pH (B) exhibited the steepest slopes, indicating a more pronounced interaction and a more pronounced effect on the SCP extraction rate. This finding aligns with the data in Table 3.

Figure 2.
Response surface and contour plots for each factor. Temperature (A), pH (B), and time (C) response surface plots (a,c,e) and contour plots (b,d,f).
3.1.3. Isoelectric Precipitation
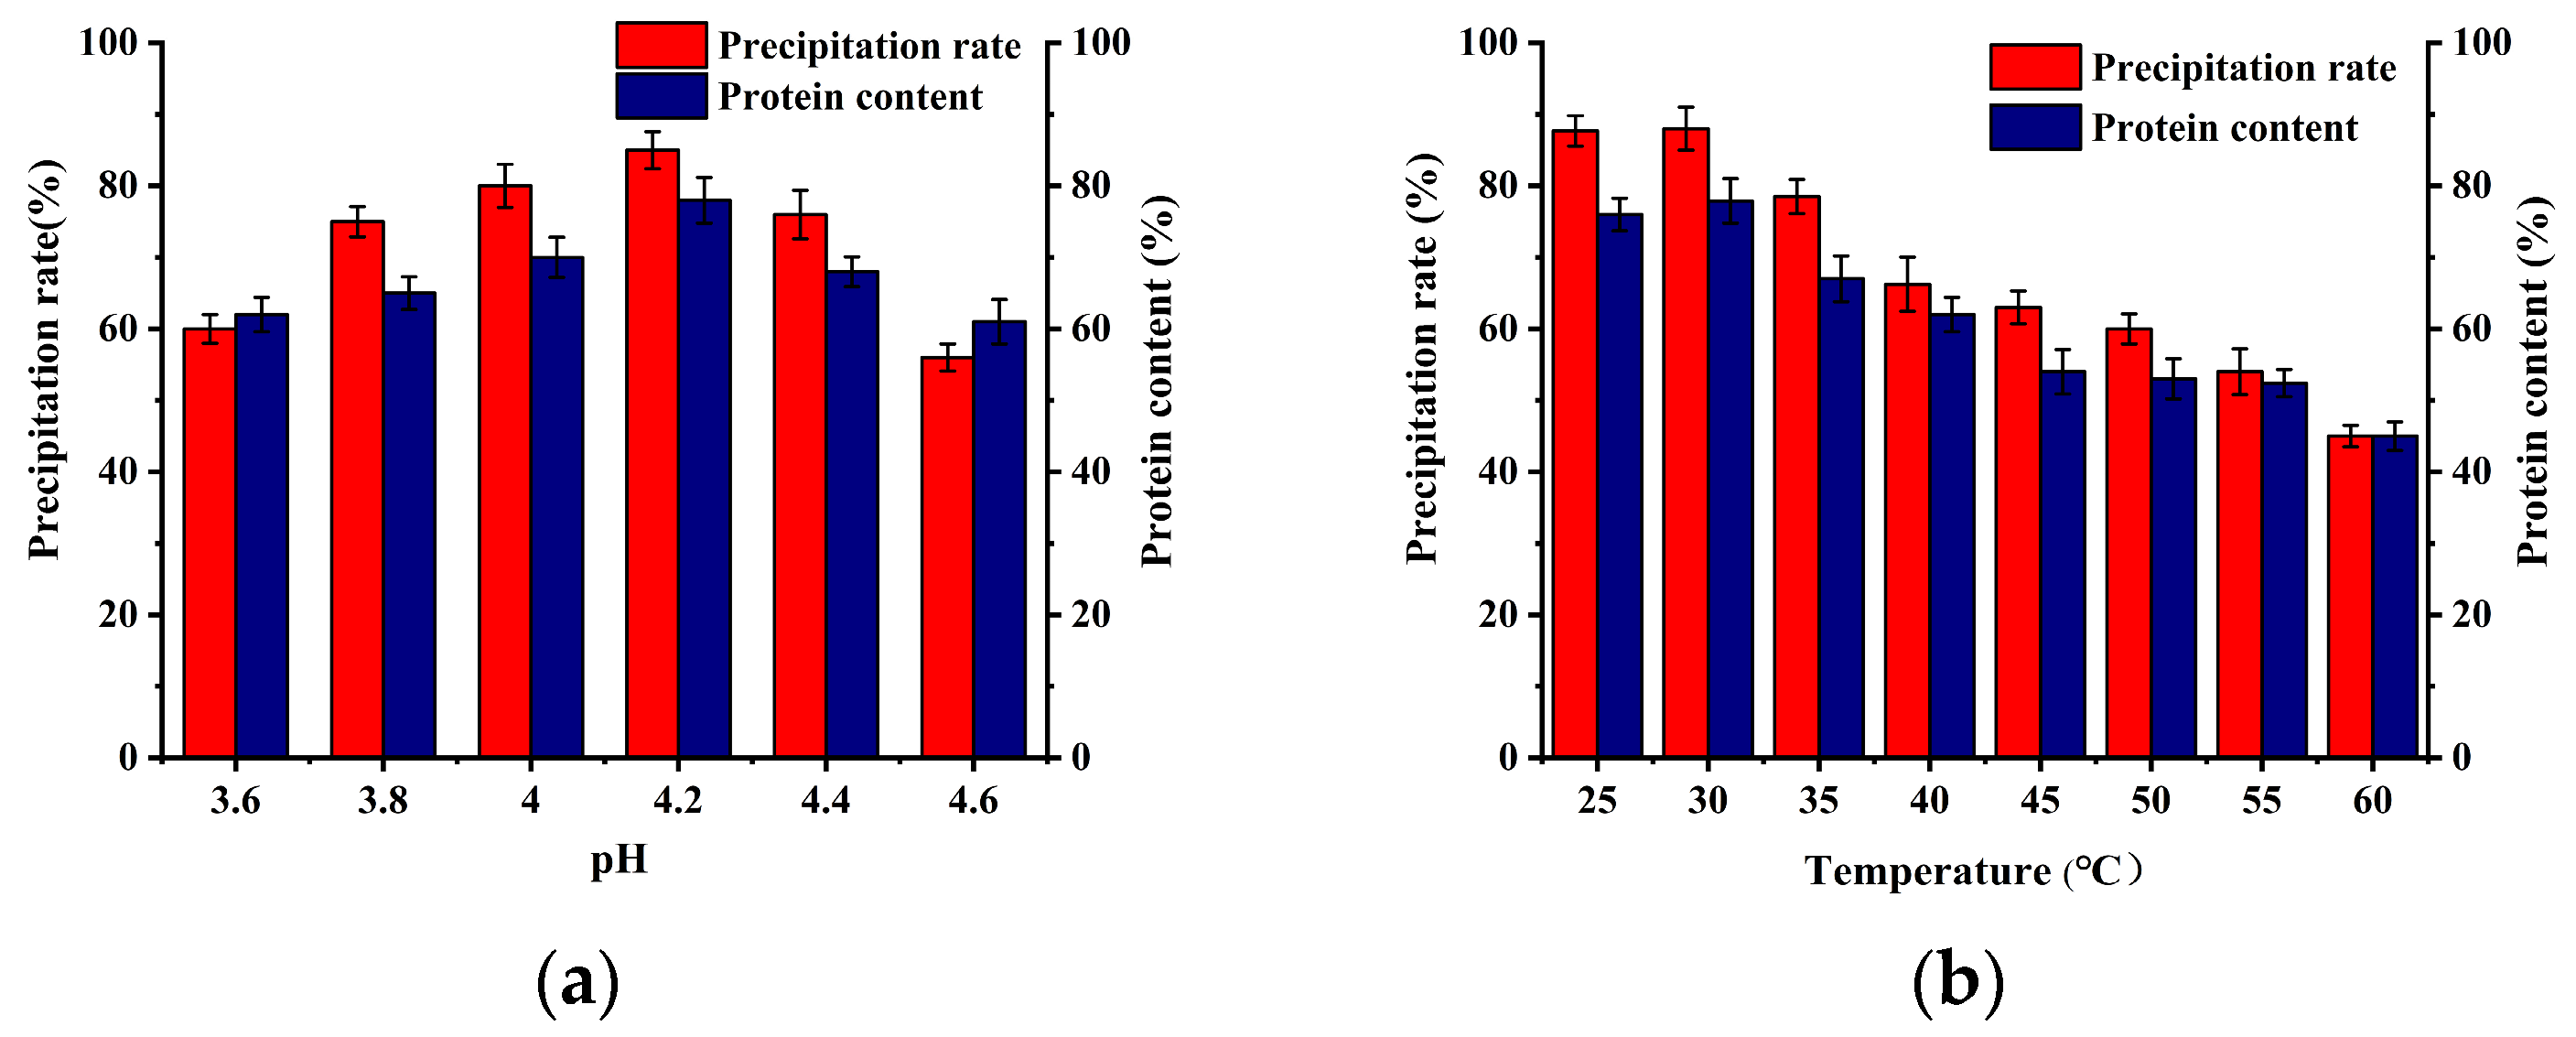
Following the alkaline leaching step, the DOS proteins were transferred to the solution. Subsequently, the remaining bacterial residue was isolated, and acid was added to adjust the pH of the solution to the isoelectric point of the proteins, precipitating the proteins. Figure 3 illustrates the precipitation rate of SCP and the protein content of the precipitated SCP under various pH and temperature conditions. At pH 4.2, the precipitation rate and protein content of SCP were the highest, and the isoelectric point of SCP was determined to be 4.2. Similarly, the protein extracted by Schwenzfeier [23] from Tetraselmis sp. had a pH of approximately 4, and the rate of precipitation was at its maximum.
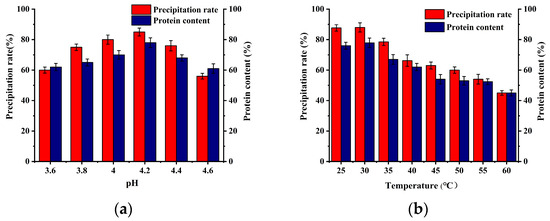
Figure 3.
Effect of acid precipitation conditions on SCP precipitation rate and content: (a) effect of acid precipitation pH on SCP precipitation rate and content; (b) effect of acid precipitation temperature on precipitation rate and content of SCP.
Heat treatment is a common method of increasing the protein precipitation rate during the acid precipitation step in industrial production. Juel [24] used a combination of acid precipitation and heat treatment for the extraction of Ulva stramonium seaweed proteins, and the results demonstrated that the protein precipitation rate increased from 20% to 40% as the temperature increased from 70 °C to 90 °C. In this study, the temperature of the acid precipitation stage of the SCP was also examined. The results demonstrated that the highest protein precipitation rate and content were obtained at room temperature (25 °C; Figure 3b). Conversely, under heating conditions, the precipitation rate and content of the SCP decreased continuously with increasing temperature. It was concluded that heating was unfavorable for SCP recovery.
3.2. Study on Emulsification Properties of SCP
The emulsification properties represent a crucial aspect of protein chemistry, as the protein source and extraction process exert a significant influence on these properties. This paper presents a comprehensive evaluation of emulsification properties [25], including the determination of the SCP oil–water interfacial tension, emulsification activity, and emulsion storage stability. Studies have demonstrated that pH and protein concentration are the primary factors influencing the emulsification performance of proteins [26]. Consequently, this study sought to investigate the effects of protein concentration and pH on emulsification performance to provide a reference for potential applications in the food industry.
3.2.1. Interfacial Tension
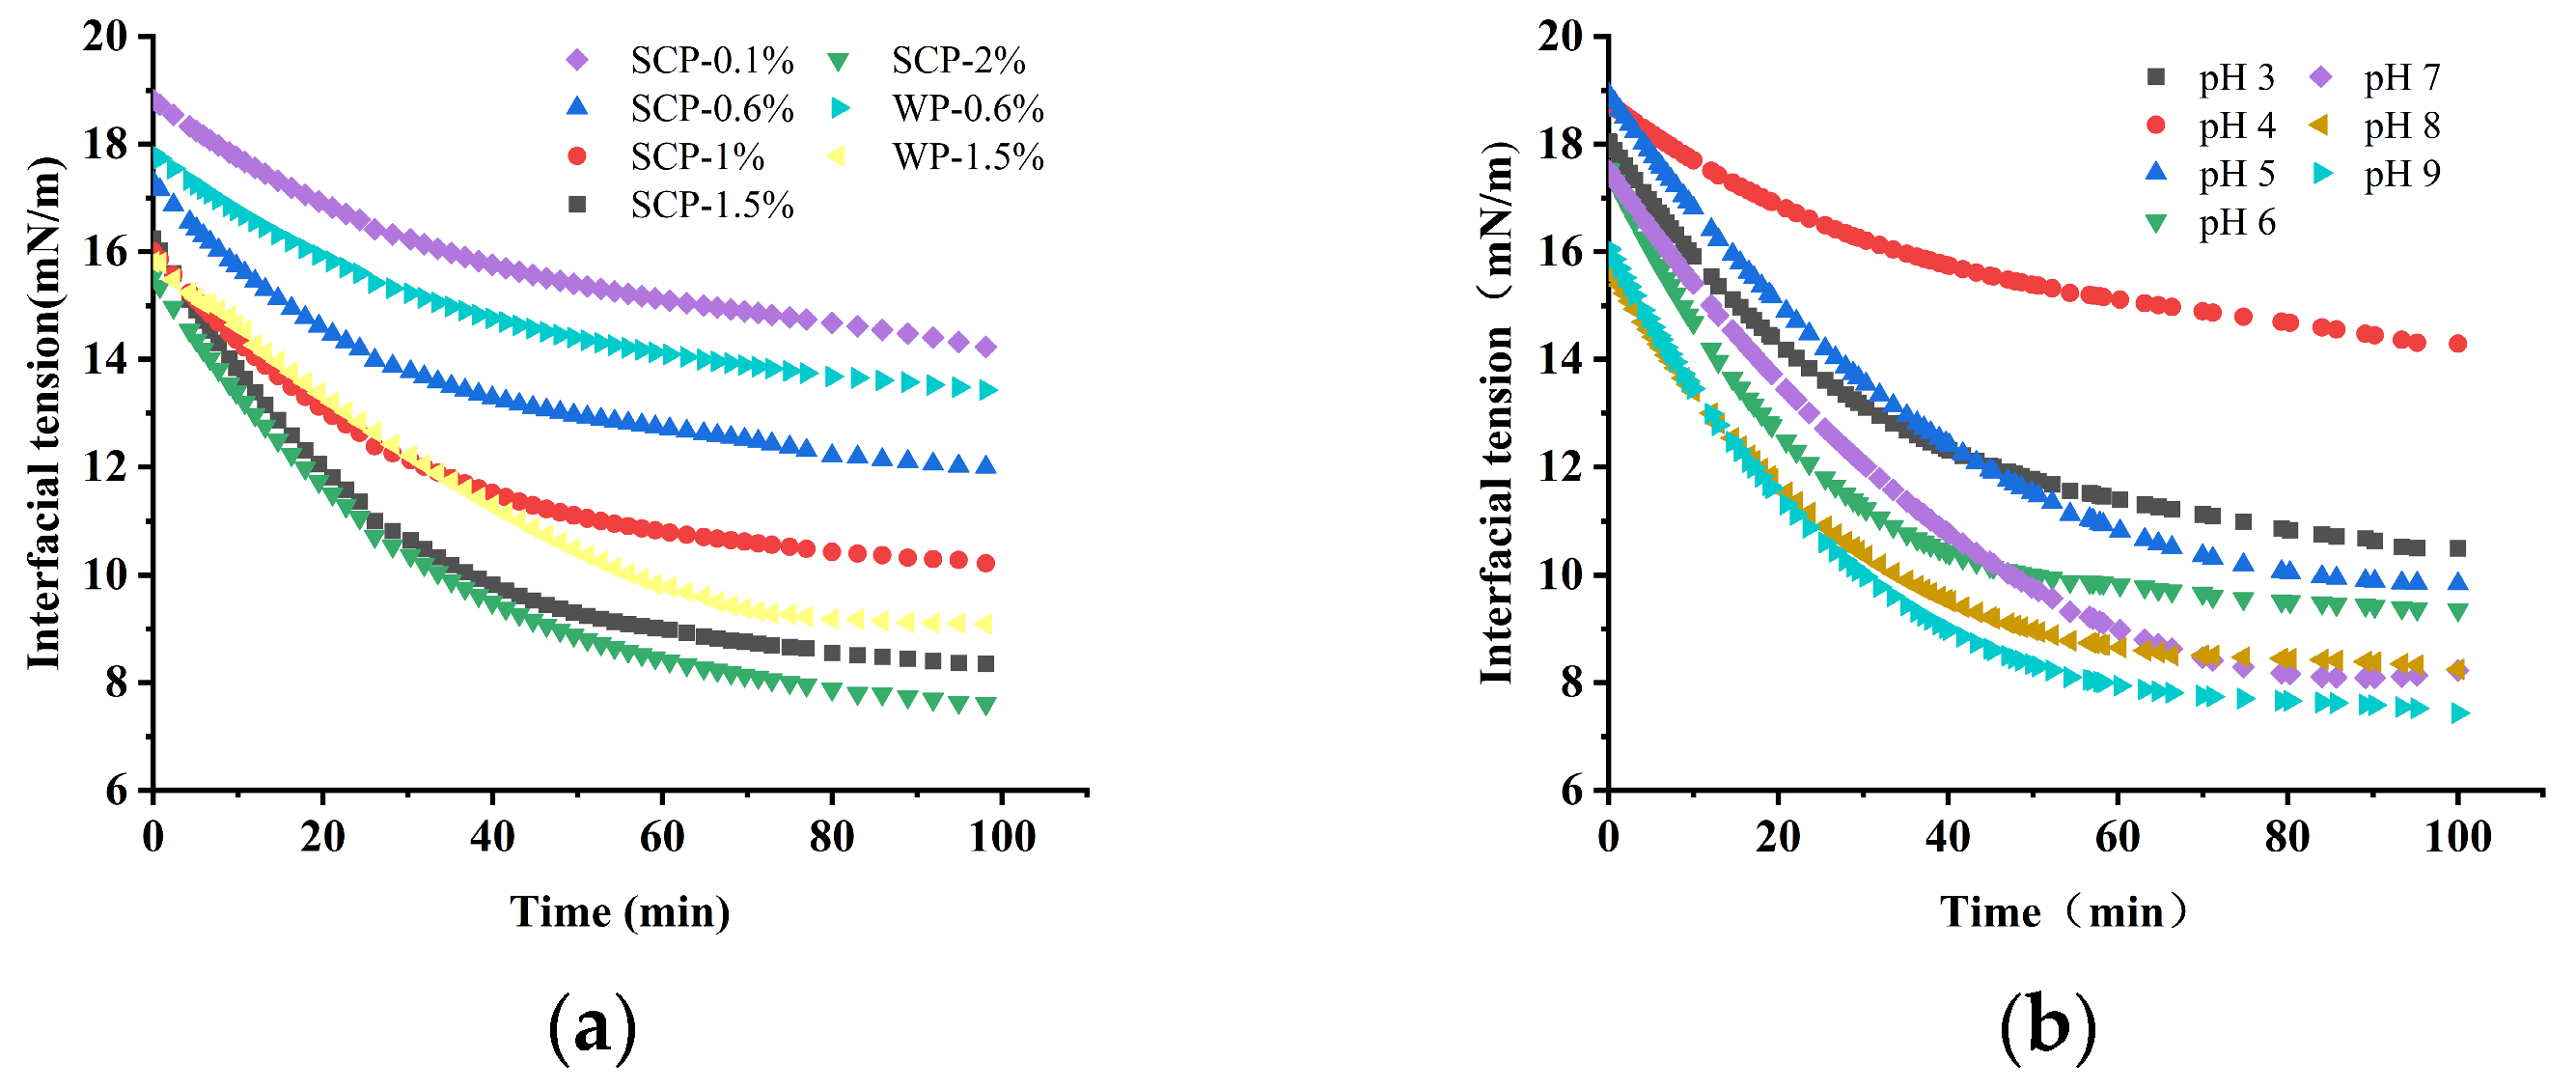
The adsorption of the emulsifier at the oil–water interface reduces the interfacial tension, which is an important indicator for assessing the emulsifying ability of the emulsifier. The effect of the SCP concentration and pH of the solution on the oil–water interfacial tension is illustrated in Figure 4. The interfacial tension of the proteins decreased slightly with longer observation times under the experimental conditions. This may be related to the slow conformational change in the protein molecules adsorbed at the interface [27]. In the concentration range of 0.1% to 2% SCP, the ability to reduce the interfacial tension between oil and water increased with increasing concentration (Figure 4a). However, at concentrations exceeding 1%, the effect on the interfacial tension between the oil and water was significantly reduced. Furthermore, the ability of SCP to reduce interfacial tension is stronger than that of WP, which is often used as an emulsifier, at the same protein concentration. As Karaca [28] poses, the greater the solubility of a protein, the more effective it is in reducing the interfacial tension. The solubility of proteins is lowest near their isoelectric point, where SCP is soluble and thus has the least ability to reduce interfacial tension. Conversely, the further away from the isoelectric point, the greater the insolubility and the ability to reduce the interfacial tension.

Figure 4.
Effect of SCP solution concentration and pH on the interfacial tension of oil and water: (a) variation in interfacial tension at the oil–water interface with time for different SCP protein concentrations (0.1–2% w/v) and WP (0.6% and 1.5% w/v); (b) interfacial tension of SCP at pH 3.0–9.0.
3.2.2. Emulsifying Properties of SCP
Protein emulsifiability is usually evaluated in terms of the emulsifying activity (EAI) and emulsion stability (ESI) [29]. EAI is the ability of a protein to be adsorbed at the oil–water interface during emulsion preparation, whereas ESI is the ability of a protein to maintain its stability. The EAI and ESI of the 1.5% (w/v) SCP and WP emulsions were determined under neutral conditions (pH 7.0). The results (Table 4) show that SCP had a higher EAI than WP under the same conditions, and its emulsification stability was nearly six times higher than that of WP.
Table 4.
Comparison of SCP and whey protein (WP) emulsification properties.
3.2.3. Factors Affecting Emulsification Activity and Emulsion Stability of SCP
Protein emulsification activity and stability are influenced by environmental conditions, including pH, as well as the protein source and its properties [13].
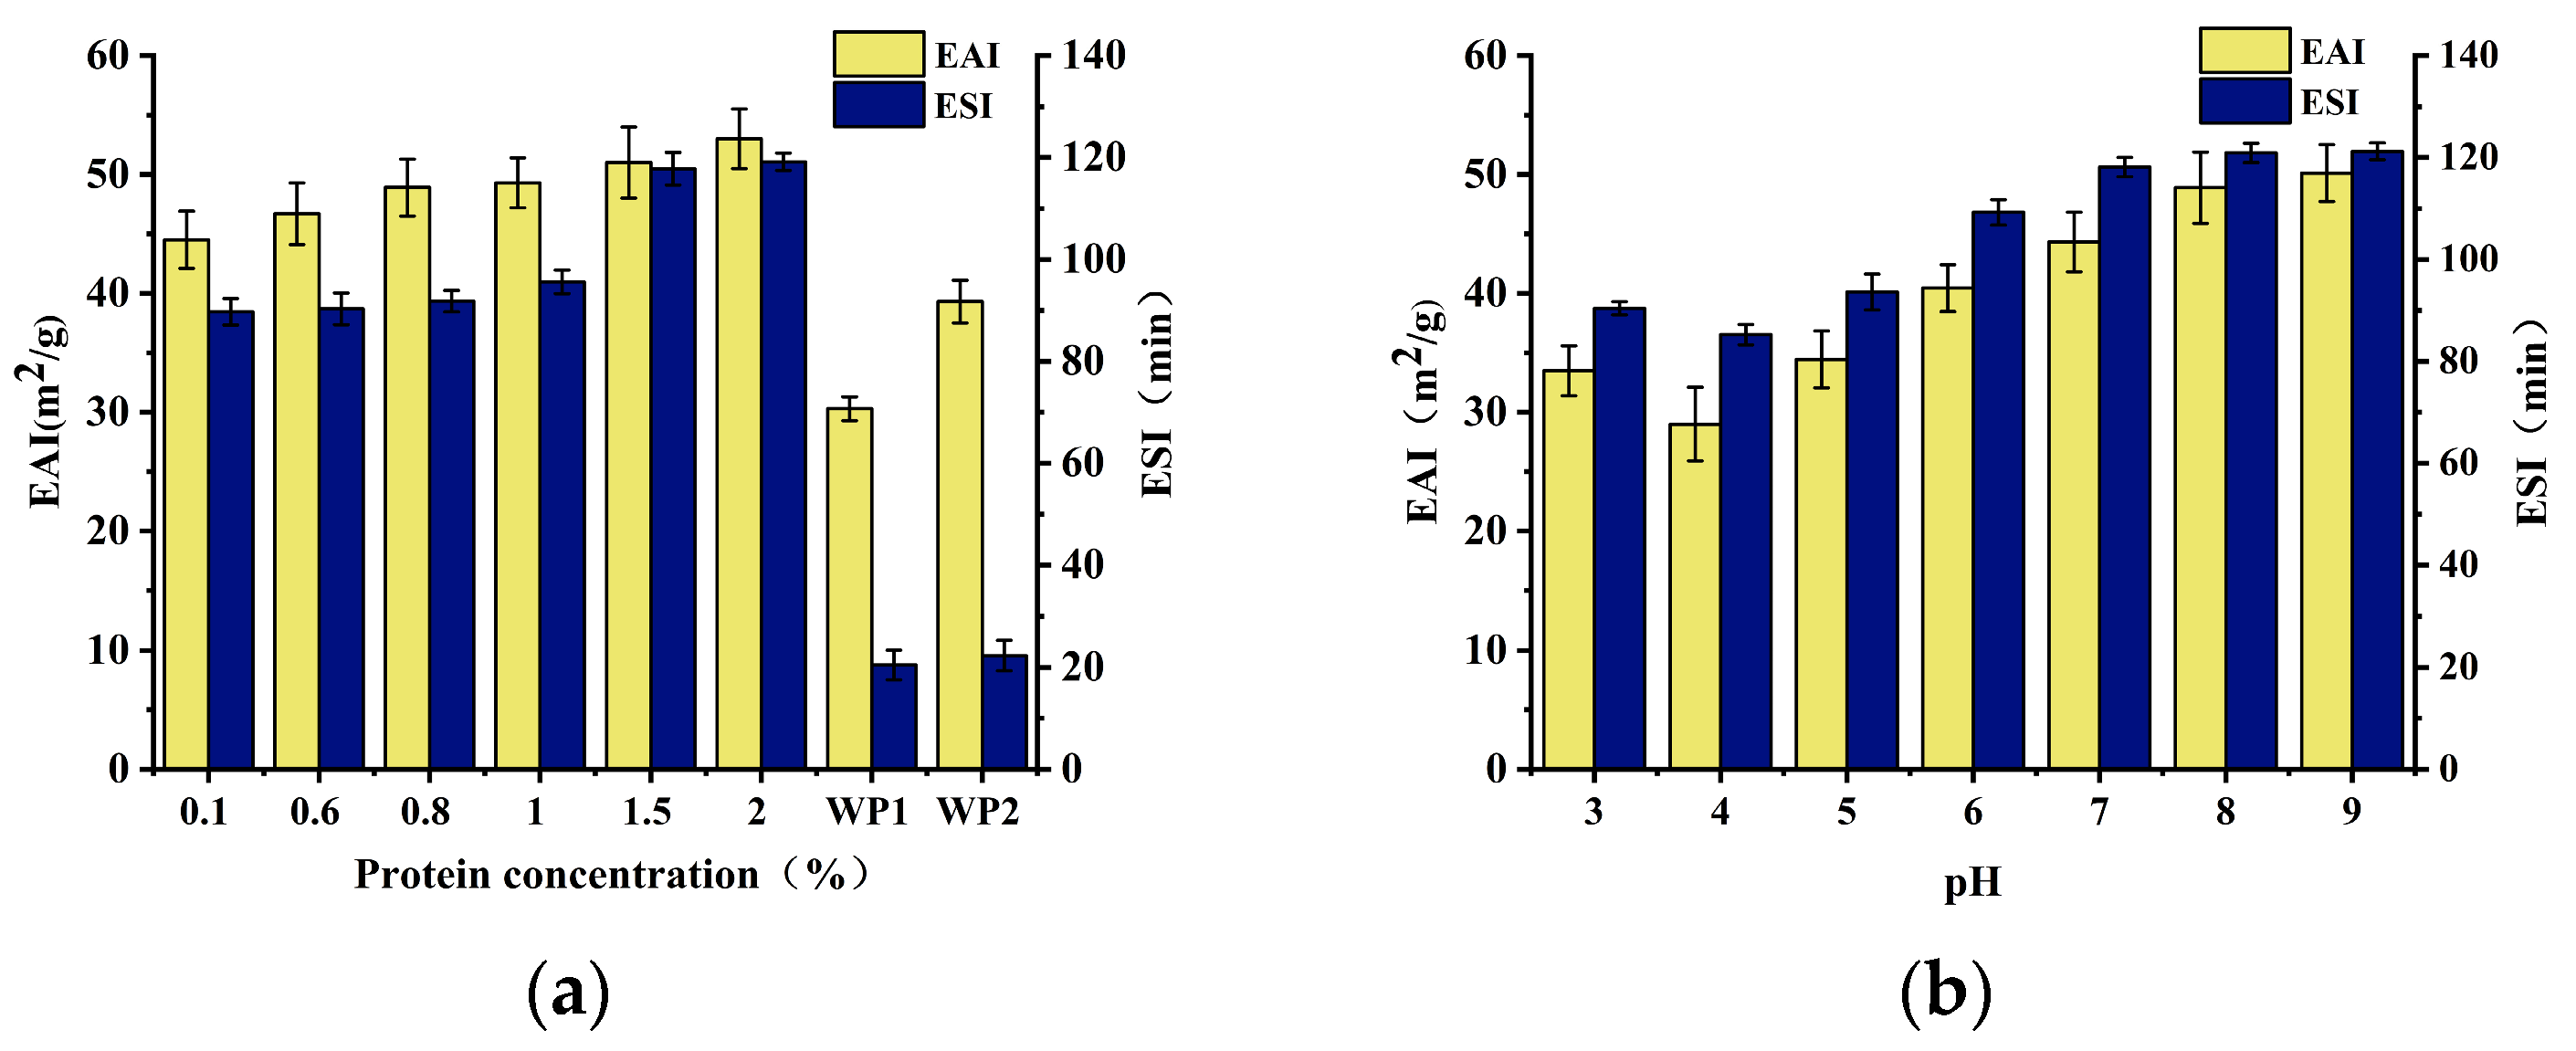
The effects of SCP concentration (a) and pH (b) on the emulsification activity and stability of SCP are illustrated in Figure 5. Protein concentration plays a pivotal role in stabilizing emulsions. Essentially, there must be a sufficient amount of protein to effectively cover droplet coalescence and form a strong interfacial film. As illustrated in Figure 5a, EAI demonstrated a consistent increase at protein concentrations ranging from 0.1% to 2% (w/v) and reached a peak value of 53 m2/g at a 2% concentration. Other proteins documented in literature, including amygdaloid proteins, wheat gluten, and soybean 11S globulin (AS11S), exhibit comparable characteristics [30]. This is because at a certain protein concentration, the tendency of protein diffusion increases as the protein concentration increases, which can promote the formation of new droplets and thus produce a greater EAI. However, if the protein concentration exceeds a certain range, the molecular activation energy barrier prevents protein migration in a diffusion-dependent manner. Consequently, excess protein reduces the effectiveness of protein adsorption, leading to a lower EAI. The ESI of SCP exhibited a gradual increase with increasing protein concentration (0.1–2%), with the ESI increasing and leveling off when the concentration exceeded 1.5%. This is because, at lower protein concentrations, the protein is insufficient to cover all the droplet coalescence produced during homogenization, and the spatial and electrostatic repulsion between the droplets is too weak to prevent aggregation. The droplets collided and agglomerated to form larger droplets. As a result, the emulsions became unstable. In contrast, an emulsion with a high protein concentration is relatively stable because droplet coalescence between droplets is prevented by an increase in the interfacial protein concentration. Furthermore, an appropriately high concentration favors the distribution of the oil phase and increases its viscosity [31], thus reducing the mobility and diffusion of droplet coalescence within the emulsion and increasing its emulsion stability.
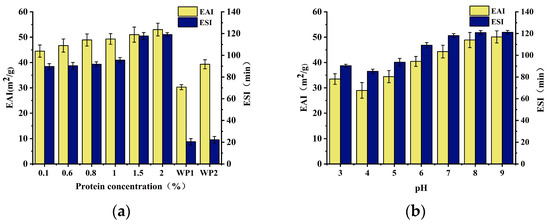
Figure 5.
EAI and ESI: (a) EAI and ESI at different concentrations of SCP (0.1–2% w/v) and WP (0.6% and 1.5% w/v); (b) EAI and ESI of SCP at different pH (3–9) conditions. WP 1 refers to a WP emulsion with a protein concentration of 0.6%, and WP 2 refers to a WP emulsion with a protein concentration of 1.5%.
As proteins are amphoteric molecules, the pH of the solution affects the degree of ionization of the protein molecules, which in turn affects the forces between protein molecules and the solubility of proteins in water [32]. The solubility of proteins is lowest near their isoelectric point. As the solution pH moves away from the isoelectric point, the protein becomes more charged, exhibits increased solubility, and displays enhanced emulsifying activity and stability [30,33,34]. The effect of pH on emulsifiability showed a similar trend (Figure 5b).
3.2.4. Droplet Size of Emulsion
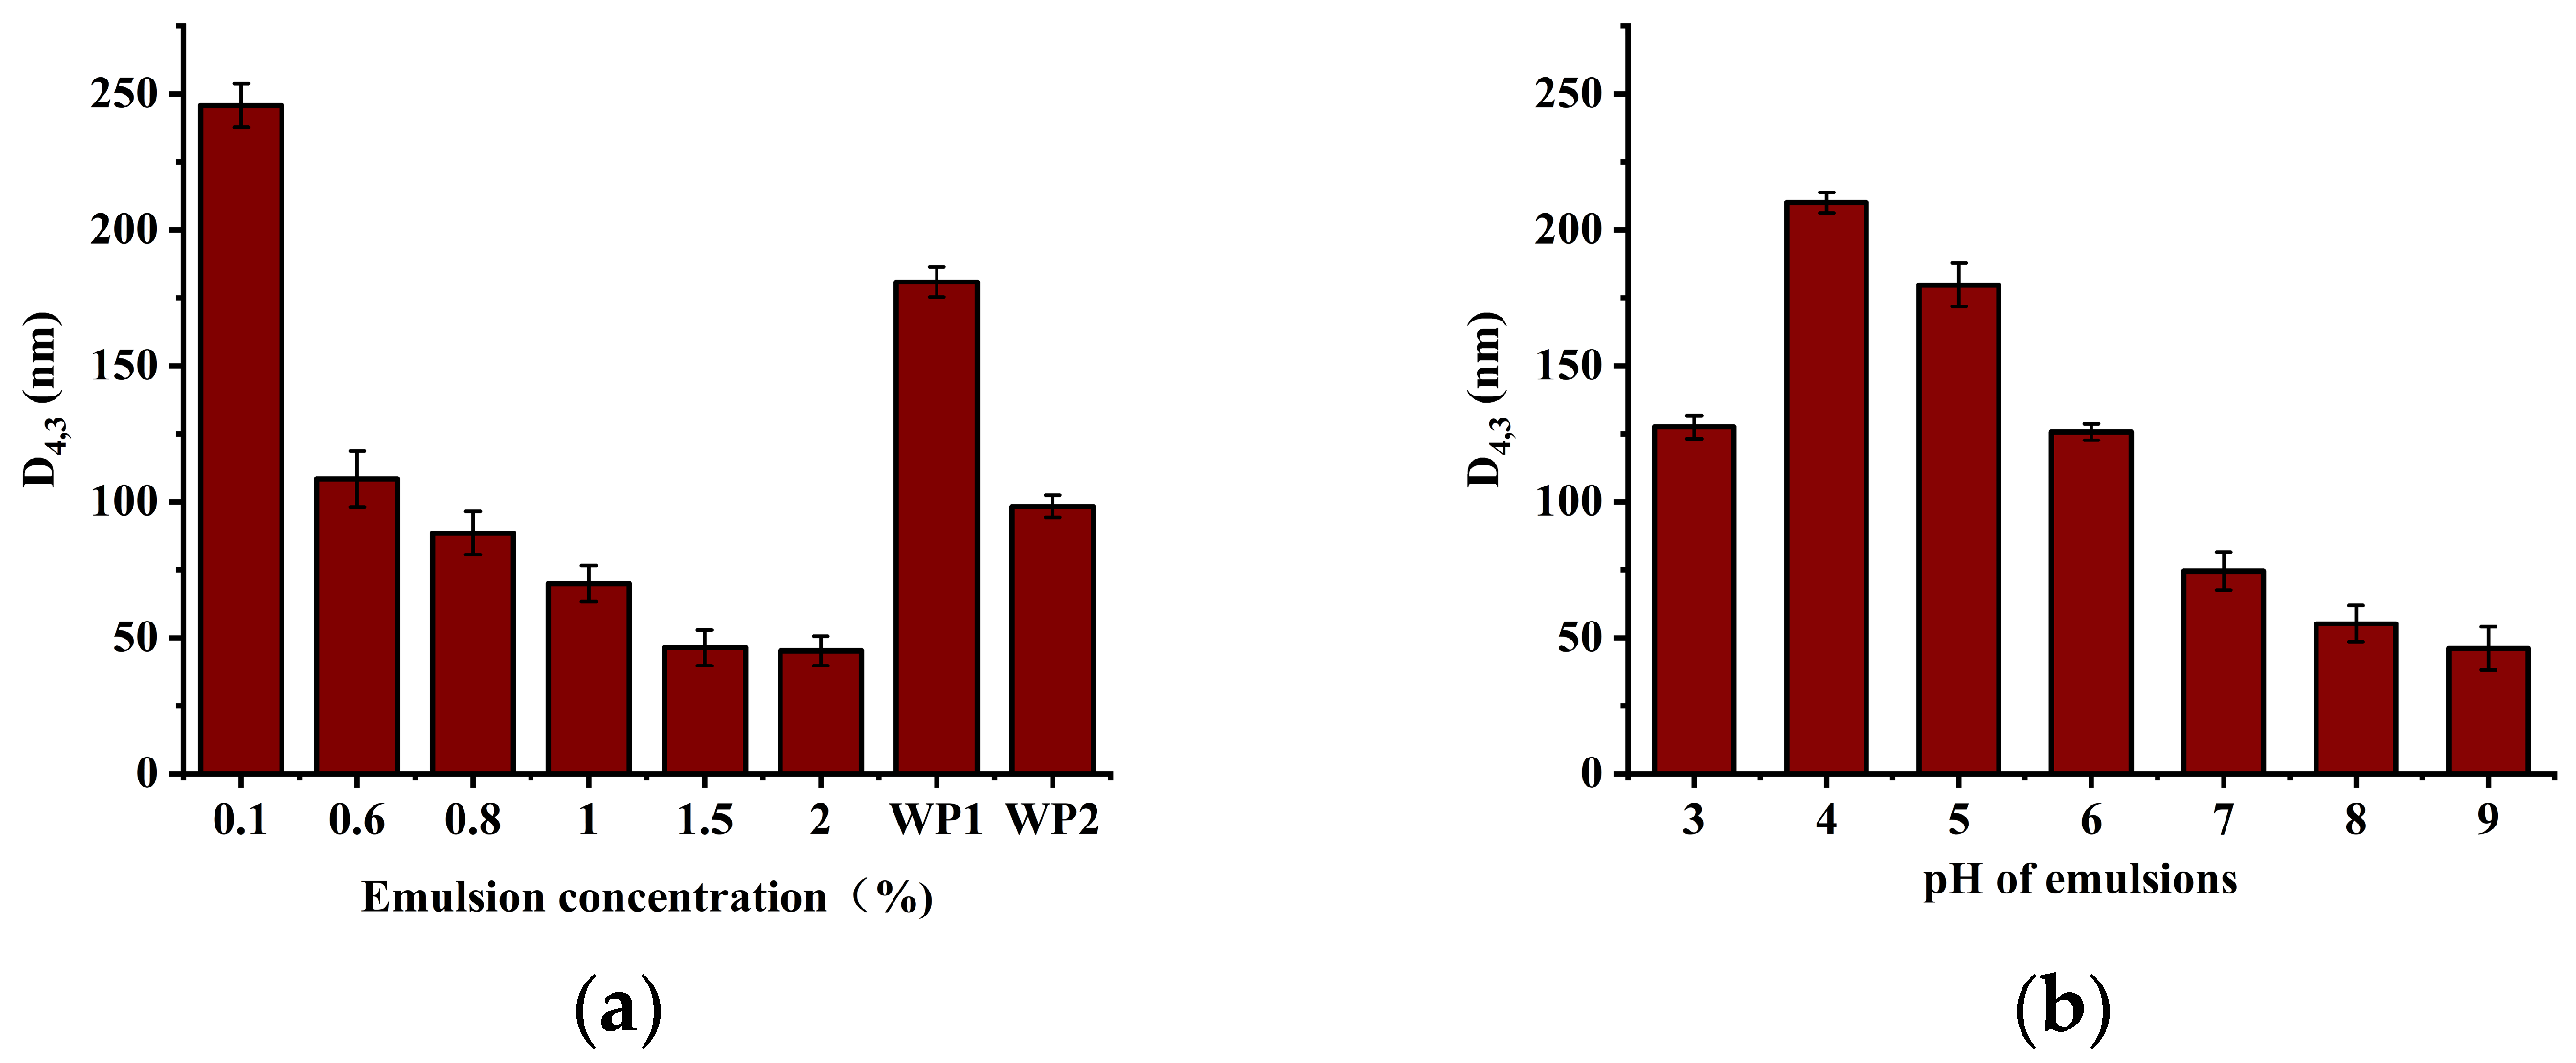
The droplet size of an emulsion plays a pivotal role in its stability. The smaller the droplet size of an emulsion, the greater the emulsion stability. The concentration, structure, and charge characteristics of the proteins used as emulsifiers influence the droplet size of an emulsion. An increase in protein concentration enhances emulsion stability by facilitating the adsorption of protein molecules at the oil–water interface, forming a protective layer that is more resilient to disruption. As illustrated in Figure 6a, an increase in the SCP concentration resulted in a reduction in emulsion droplet size. This trend was also observed in the WP emulsion, which was consistent with the findings of Lv [35]. However, at identical concentrations, the droplet size of the SCP emulsion was significantly smaller than that of the WP emulsion. The protein concentration was 5%, and the average droplet size of the SCP was 46.31 nm, which was significantly smaller than that of the WP emulsion (98.3 nm). This suggests that the SCP has more particles that can cover a larger interfacial region, which results in smaller droplet sizes [36]. Similar results were observed for the microstructures of the emulsions (Figure 7a). pH exerts a significant influence on the charge state and solubility of proteins, which affects emulsion stability and droplet size. In certain instances, a change in pH may cause protein coalescence, which subsequently influences emulsion dimensions. The effect of emulsion pH on the droplet size of the SCP emulsion was significant. The maximum emulsion size was observed near the isoelectric point, whereas smaller droplets formed in the alkaline pH range. Similar results were obtained from the microstructural observations (Figure 7b).
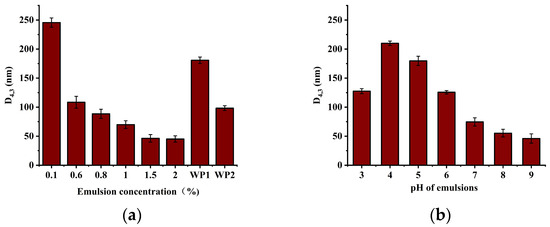
Figure 6.
Mean emulsion droplet diameters (D4,3): (a) Mean droplet diameters of emulsions (D4,3) with different concentrations of SCP (0.1–2% w/v) and WP (0.6% and 1.5% w/v). (b) Mean droplet diameters of SCP emulsions (D4,3) at different pH (3–9). WP 1 refers to a WP emulsion with a protein concentration of 0.6% and WP 2 refers to a WP emulsion with a protein concentration of 1.5%.
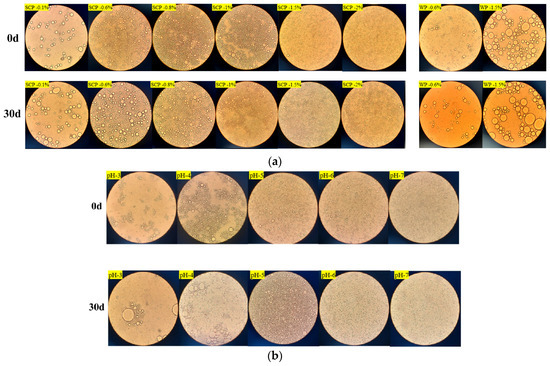
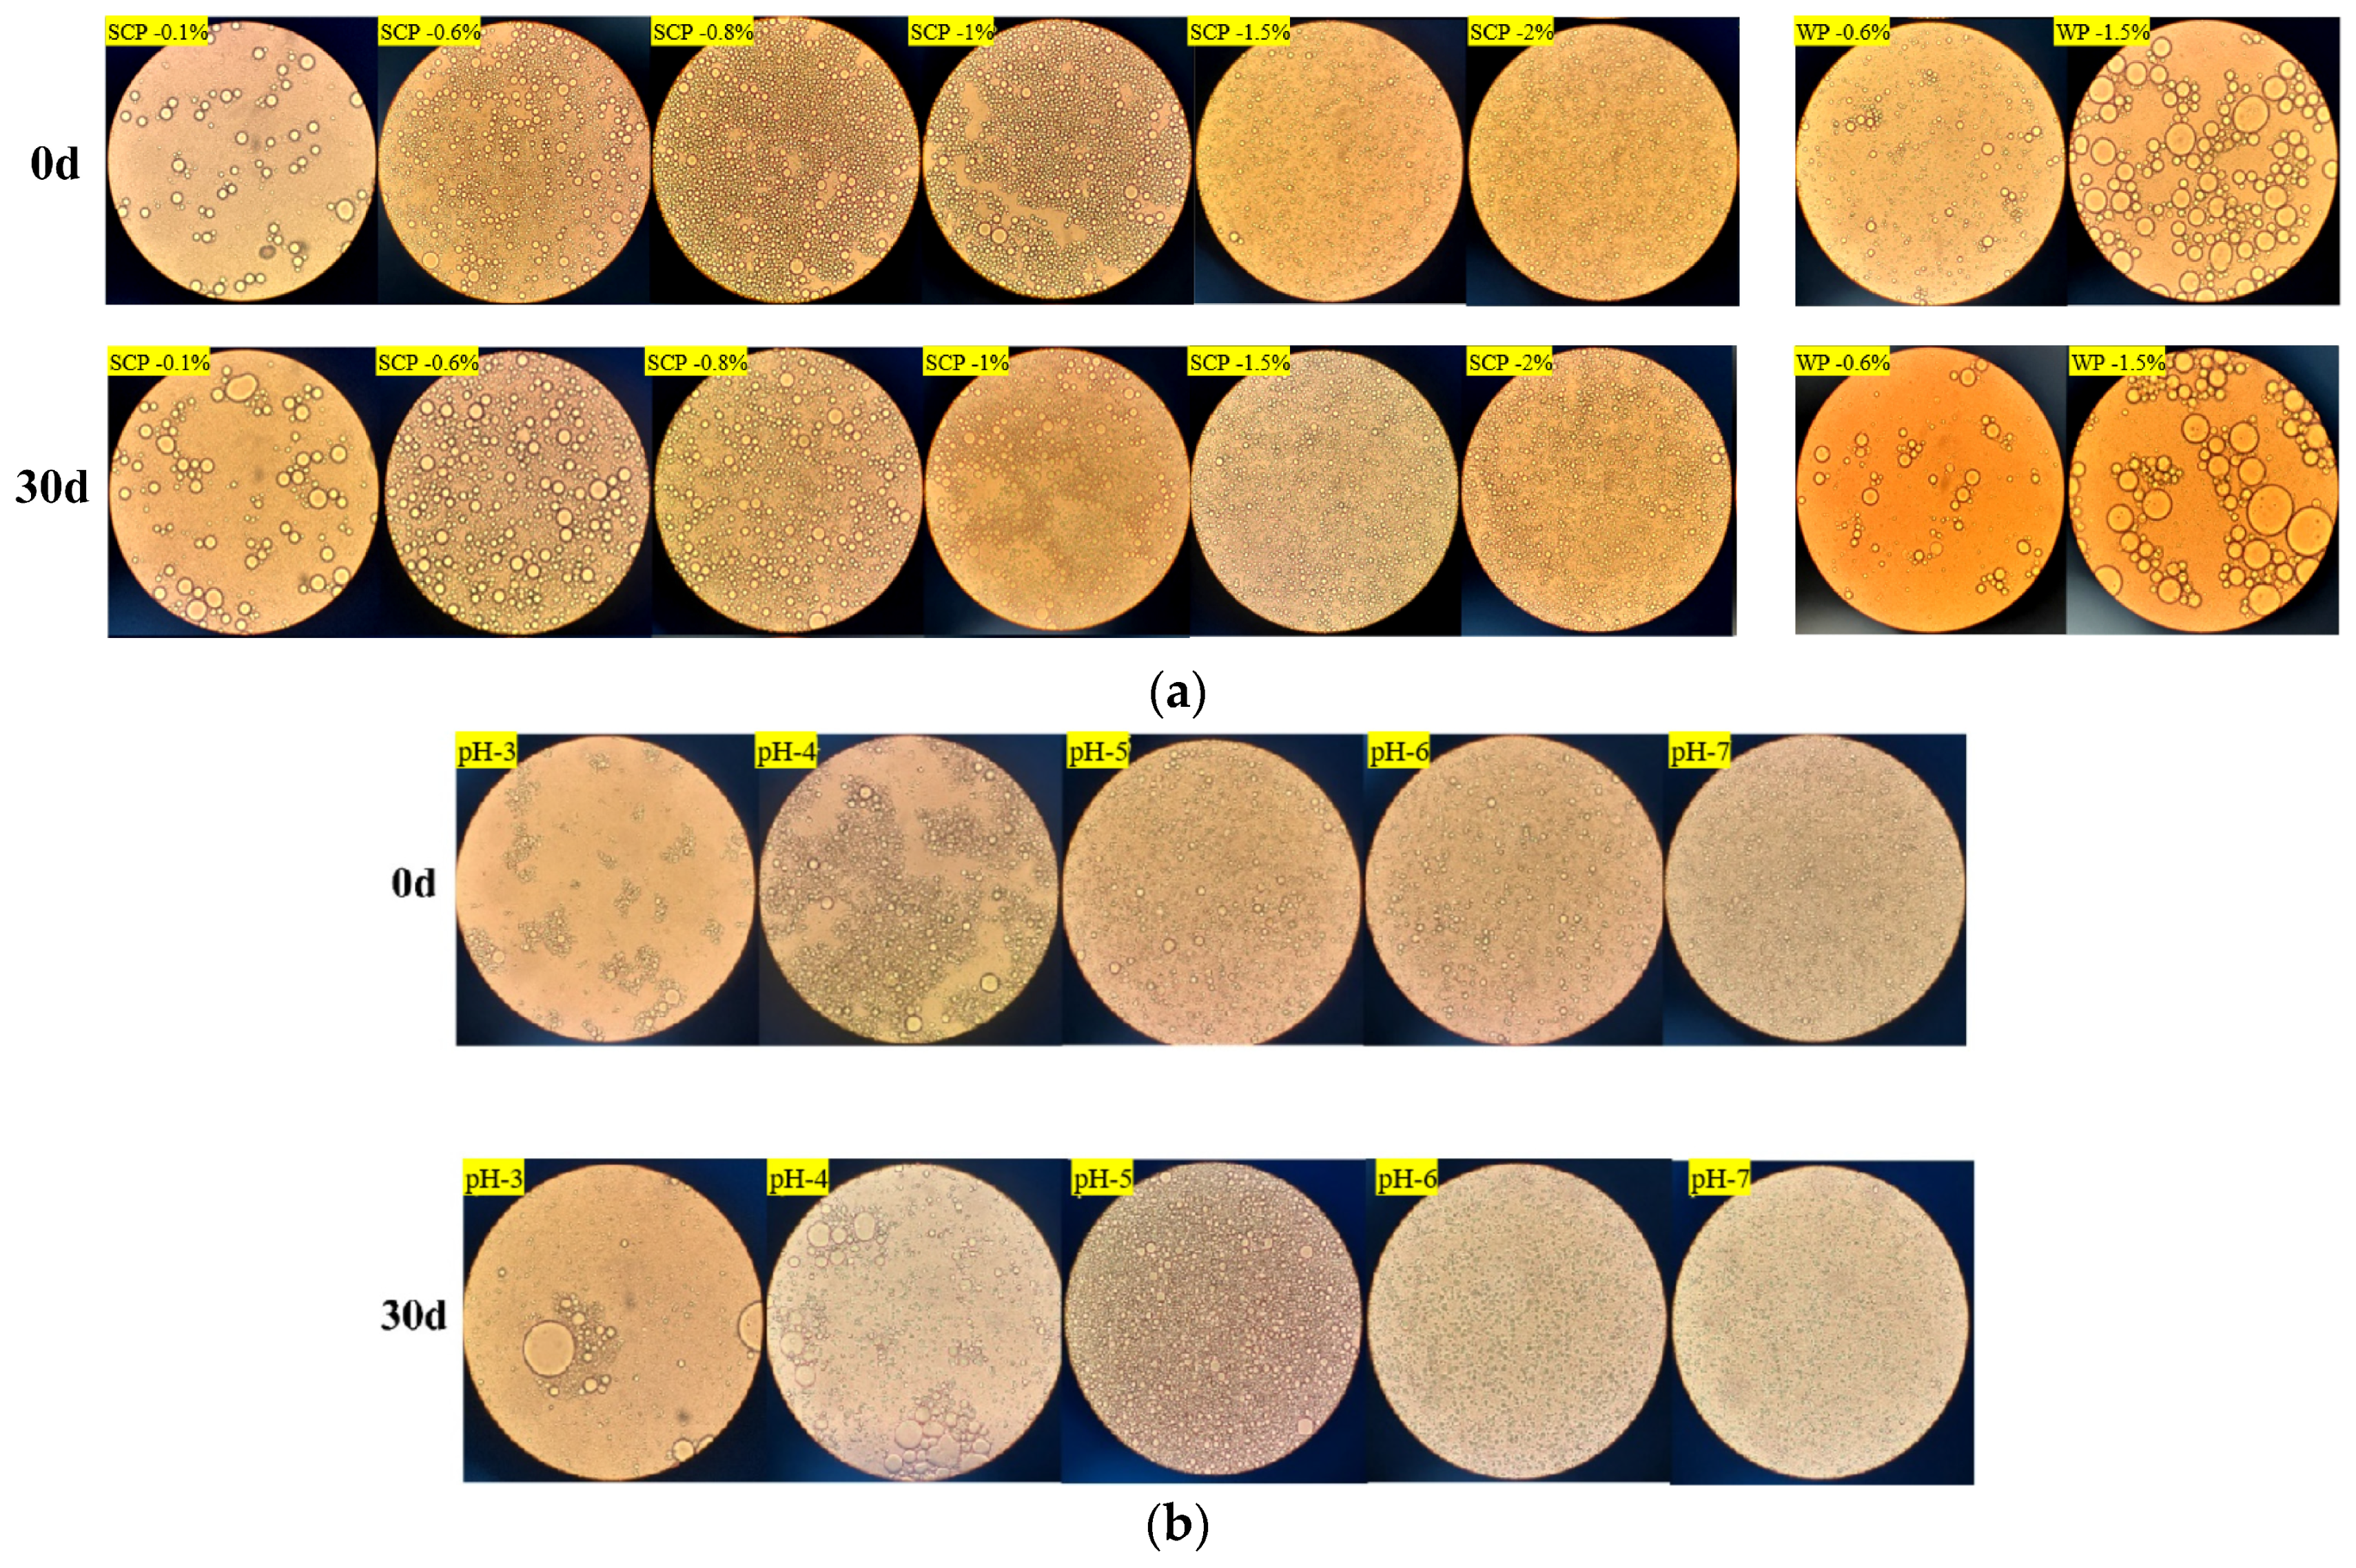
Figure 7.
Micrographs of SCP emulsions at 0 and 30 days after storage: (a) micrographs of different concentrations of SCP (0.1–2% w/v) and WP (0.6% and 1.5% w/v) emulsions at 0 and 30 days after placement; (b) micrographs of SCP emulsions at different pH (3–7) at 0 and 30 days after placement.
3.2.5. Storage Stability of SCP Emulsions
Figure 7a presents micrographs of the SCP emulsions as a function of protein concentration (0.1–2.0%, w/v). The droplet coalescence exhibited a range of sizes and was unevenly dispersed, with aggregates present in the fresh emulsion at low SCP concentrations (0.1–0.8%, w/v). In contrast, at higher SCP concentrations (1.0–2.0%, w/v), the structures of the SCP emulsions appeared to be fairly homogeneous. The D4,3 value gradually decreased with increasing SCP concentration. After 30 d of storage, the structure of the SPP emulsion depended on the protein concentration, as illustrated in Figure 7a. Significant consolidation and droplet coalescence were observed at low protein concentrations. However, no evidence of droplet coalescence is observed at higher protein concentrations. Figure 7b shows micrographs of the SCP emulsions as a function of pH (3–7). The droplet coalescence exhibited the largest size in the emulsions prepared at pH 4.0, as this pH value is close to the zero net effective charge of the proteins. This situation favors protein–protein interactions and hinders protein rearrangement at the oil–water interface [37]. The electrostatic repulsive forces between protein molecules are favored at pH values that are not close to the zero net effective charge, which reduces the droplet coalescence of protein-stabilized droplets.
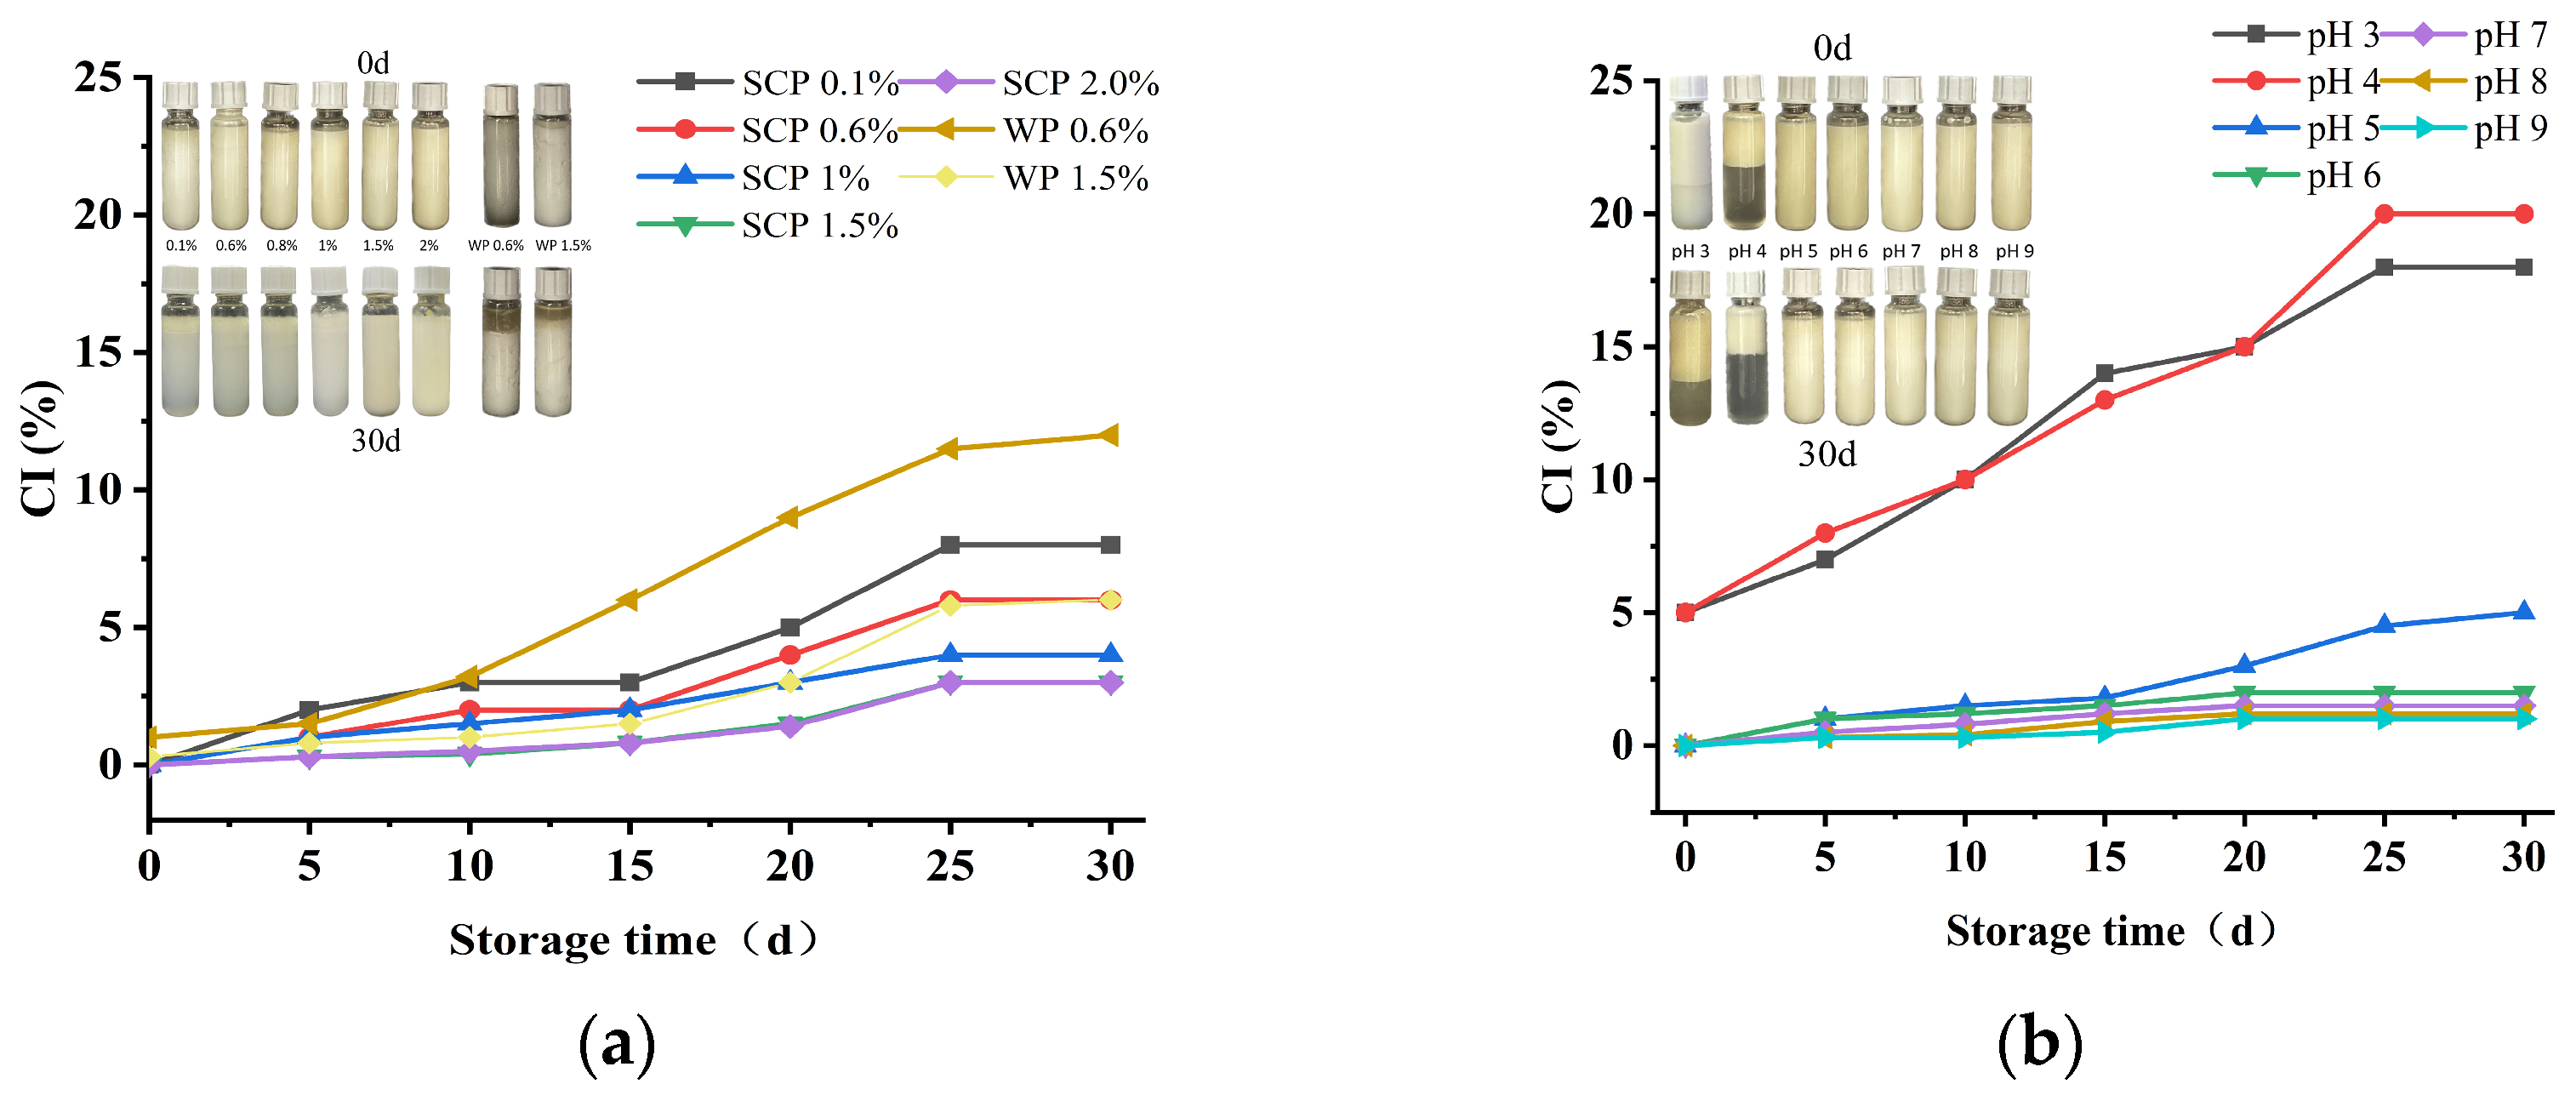
The creaming index provides indirect information regarding the degree of droplet aggregation in an emulsion. The higher the creaming index, the less stable the emulsion [38]. The emulsification behavior of emulsions stabilized by SCP at varying concentrations and pH values was evaluated over a period of up to one month, as illustrated in Figure 8. As anticipated, the creaming index (CI) of all emulsions increased gradually. It is well established that the higher the degree of droplet coalescence, the higher the CI value. Furthermore, the emulsification behavior gradually decreased as the concentration of SCP increased, which was consistent with the droplet size (Figure 7a). According to Ye et al. [39], CI continued to increase with increasing protein concentration from 0.1% to 2.0% (w/v), with a subsequent decrease. This suggests that increasing the protein concentration leads to the inhibition of emulsification. SCP emulsions with the same concentration exhibited smaller droplet sizes and CI values than WP emulsions (Figure 7a and Figure 8a), which exhibited higher emulsification stability. During the emulsion production process, pH exerted a pronounced influence on droplet size, with the same emulsification behavior observed as the pH increased. As the isoelectric point of the protein approaches, the CI value decreases, which is consistent with the observed droplet size reduction (Figure 7). The Figure shows the appearance of the emulsion after being freshly prepared at 0 d and stored for 30 d under cold storage conditions (Figure 8). As can be seen from the figure, at day 0, all emulsions are stable, without any signs of emulsification or separation; after 30 days of storage, WP emulsion showed obvious phase separation, and low concentration (0.1–1%, w/v) SCP emulsion also showed emulsification to varying degrees, which was consistent with the microscopic observation. Compared with whey protein, SCP protein emulsions with relevant concentrations showed higher emulsion stability. The creaming index profiles of the SCP protein-stabilized emulsions differed at each pH (Figure 8). Emulsions produced at pH 3.0 and 4.0 exhibited precipitation at the bottom of the test tubes (Figure 8), which may be attributed to protein–protein interactions resulting from their low solubility. This is supported by the observation that proteins with low solubility have lower adsorption rates [40]. This impairs the coverage of new droplets during the deformation and disruption processes, leading to the agglomeration of the droplet coalescence.
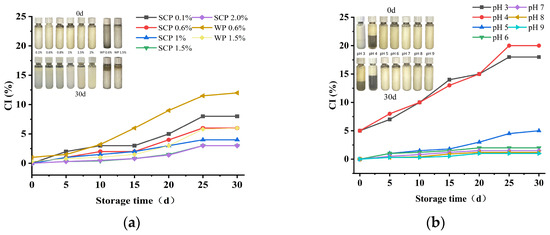
Figure 8.
Creaming index of emulsions and appearance of SCP emulsion (after 0 h and 30 d of storage): (a) creaming index of emulsions and appearance of SCP (0.1–2% w/v) and WP (0.6% and 1.5% w/v) emulsions at different concentrations over a 30-day period of placement; (b) creaming index of emulsions and appearance of SCP emulsions at different pH (3–9) during 30 days of placement.
4. Conclusions
The objective of this study was to identify the optimal extraction process for the precipitation of SCP by isoelectric point precipitation, employing a one-way response surface methodology. The results demonstrated that the optimal parameters for the preparation of SCP by NaOH alkaline immersion were as follows: pH 11.58, extraction temperature 46.11 °C, and extraction time 188 min. The extraction rate of SCP under these conditions was 93.98 ± 0.9%, which was a relatively high rate of extraction. Furthermore, its solubility was minimal at a pH of approximately 4.2, with a protein precipitation rate and content at this pI point of 85% and 78%, respectively, exhibiting high content. The results of the emulsification experiments demonstrated that SCP can be employed as a reliable source of proteins for the production of proteins with functional and emulsion properties. Moreover, SCP exhibited superior emulsifying activity compared with WP. The findings of this study indicate that SCP is a promising source of proteins with emulsifying properties.
Author Contributions
Conceptualization, Y.Y. and X.Z.; data curation, L.L. and X.W.; formal analysis, X.W.; investigation, J.Z.; methodology, Y.Y. and L.L.; project administration, X.Z.; software, R.L.; writing—original draft, Y.Y.; writing—review and editing, Y.Y. and X.Z. All authors have read and agreed to the published version of the manuscript.
Funding
This work was supported by Major Innovation Pilot Project of Integration of Science, Education and Industry of Qilu University of Technology (Shandong Academy of Science) (No. 2022JBZ01-08); the development of plant protein preparation technology and new equipment (2020CXGC010604).
Institutional Review Board Statement
Not applicable.
Informed Consent Statement
Not applicable.
Data Availability Statement
Data are contained within the article.
Conflicts of Interest
The authors declare no conflicts of interest.
References
- Meng, C.; Peng, B. Establishment of a high-throughput screening platform to screen Schizochytrium sp. with a high yield of DHA. Algal Res. 2023, 74, 103201. [Google Scholar] [CrossRef]
- Calder, P.C. Very long-chainn-3 fatty acids and human health: Fact, fiction and the future. Proc. Nutr. Soc. 2017, 77, 52–72. [Google Scholar] [CrossRef]
- Jia, Y.-L.; Zhang, Y.; Xu, L.-W.; Zhang, Z.-X.; Xu, Y.-S.; Ma, W.; Gu, Y.; Sun, X.-M. Enhanced fatty acid storage combined with the multi-factor optimization of fermentation for high-level production of docosahexaenoic acid in Schizochytrium sp. Bioresour. Technol. 2024, 398, 130532. [Google Scholar] [CrossRef]
- Patra, A.; Arun Prasath, V. Isolation of detoxified cassava (Manihot esculenta L.) leaf protein by alkaline extraction-isoelectric precipitation: Optimization and its characterization. Food Chem. 2024, 437, 137845. [Google Scholar] [CrossRef]
- Wang, S.; Miao, S.; Sun, D.-W. Modifying structural and techno-functional properties of quinoa proteins through extraction techniques and modification methods. Trends Food Sci. Technol. 2024, 143, 104285. [Google Scholar] [CrossRef]
- Fang, B.; Chang, L.; Ohm, J.-B.; Chen, B.; Rao, J. Structural, functional properties, and volatile profile of hemp protein isolate as affected by extraction method: Alkaline extraction–isoelectric precipitation vs salt extraction. Food Chem. 2023, 405, 135001. [Google Scholar] [CrossRef]
- Fan, X. Nutrient analysis and optimization of protein extraction process of the algal sludge of Pseudomonas sp. J. Process Eng. 2015, 15, 126–131. [Google Scholar]
- McHardy, C.; Djike Kammegne, T.; Jänich, I. Energy-efficient ultrasound-assisted extraction of food proteins from the microalga C. vulgaris at elevated static pressure. Innov. Food Sci. Emerg. 2021, 73, 102797. [Google Scholar] [CrossRef]
- Yan, H.; Zou, H.; Li, S.; Sun, S.; Xu, Q.; Yu, C. Modification of functional properties of mussel actomyosin by ultrasound treatment and the appplication at O/W emulsion. LWT 2022, 170, 114086. [Google Scholar] [CrossRef]
- Resendiz-Vazquez, J.A.; Ulloa, J.A.; Urías-Silvas, J.E.; Bautista-Rosales, P.U.; Ramírez-Ramírez, J.C.; Rosas-Ulloa, P.; González-Torres, L. Effect of high-intensity ultrasound on the technofunctional properties and structure of jackfruit (Artocarpus heterophyllus) seed protein isolate. Ultrason. Sonochem. 2017, 37, 436–444. [Google Scholar] [CrossRef]
- Cuesta, G.; Suarez, N.; Bessio, M.I.; Ferreira, F.; Massaldi, H. Quantitative determination of pneumococcal capsular polysaccharide serotype 14 using a modification of phenol–sulfuric acid method. J. Microbiol. 2003, 52, 69–73. [Google Scholar] [CrossRef] [PubMed]
- de Souza, T.S.P.; Dias, F.F.G.; Koblitz, M.G.B.; de Moura Bell, J.M.L.N. Effects of enzymatic extraction of oil and protein from almond cake on the physicochemical and functional properties of protein extracts. Food Bioprod. Process. 2020, 122, 280–290. [Google Scholar] [CrossRef]
- Zhang, X.; Wang, Q.; Liu, Z.; Zhi, L.; Jiao, B.; Hu, H.; Ma, X.; Agyei, D.; Shi, A. Plant protein-based emulsifiers: Mechanisms, techniques for emulsification enhancement and applications. Food Hydrocoll. 2023, 144, 109008. [Google Scholar] [CrossRef]
- Li, K.; Fu, L.; Zhao, Y.-Y.; Xue, S.-W.; Wang, P.; Xu, X.-L.; Bai, Y.-H. Use of high-intensity ultrasound to improve emulsifying properties of chicken myofibrillar protein and enhance the rheological properties and stability of the emulsion. Food Hydrocoll. 2020, 98, 105275. [Google Scholar] [CrossRef]
- Liang, H.-N.; Tang, C.-H. pH-dependent emulsifying properties of pea [Pisum sativum (L.)] proteins. Food Hydrocoll. 2013, 33, 309–319. [Google Scholar] [CrossRef]
- Kumar, M.; Tomar, M.; Potkule, J.; Reetu; Punia, S.; Dhakane-Lad, J.; Singh, S.; Dhumal, S.; Chandra Pradhan, P.; Bhushan, B.; et al. Functional characterization of plant-based protein to determine its quality for food applications. Food Hydrocoll. 2022, 123, 106986. [Google Scholar] [CrossRef]
- Hadidi, M.; Khaksar, F.B.; Pagan, J.; Ibarz, A. Application of Ultrasound-Ultrafiltration-Assisted alkaline isoelectric precipitation (UUAAIP) technique for producing alfalfa protein isolate for human consumption: Optimization, comparison, physicochemical, and functional properties. Food Res. Int. 2020, 130, 108907. [Google Scholar] [CrossRef]
- Vilg, J.V.; Undeland, I. pH-driven solubilization and isoelectric precipitation of proteins from the brown seaweed Saccharina latissima—Effects of osmotic shock, water volume and temperature. J. Appl. Phycol. 2017, 29, 585–593. [Google Scholar] [CrossRef]
- Luo, Q.; Li, X.; Zhang, Z.; Chen, A.; Li, S.; Shen, G.; Li, M.; Liu, X.; Yin, X.; Cheng, L.; et al. Extraction of Zanthoxylum seed protein and identification of its simulated digestion products. LWT 2022, 161, 113412. [Google Scholar] [CrossRef]
- Phusunti, N.; Cheirsilp, B. Integrated protein extraction with bio-oil production for microalgal biorefinery. Algal Res. 2020, 48, 101918. [Google Scholar] [CrossRef]
- Ursu, A.-V.; Marcati, A.; Sayd, T.; Sante-Lhoutellier, V.; Djelveh, G.; Michaud, P. Extraction, fractionation and functional properties of proteins from the microalgae Chlorella vulgaris. Bioresour. Technol. 2014, 157, 134–139. [Google Scholar] [CrossRef] [PubMed]
- Gao, Z.; Liu, K.; Chen, F. Optimization of extraction conditions for corn germ protein by Alkali Method. Food Ind. 2020, 41, 5–8. [Google Scholar]
- Schwenzfeier, A.; Wierenga, P.A.; Gruppen, H. Isolation and characterization of soluble protein from the green microalgae Tetraselmis sp. Bioresour. Technol. 2011, 102, 9121–9127. [Google Scholar] [CrossRef] [PubMed]
- Juel, N.; Juul, L.; Tanambell, H.; Dalsgaard, T.K. Extraction and purification of seaweed protein from Ulva sp.—Challenges to overcome. LWT 2024, 198, 115944. [Google Scholar] [CrossRef]
- Shi, T.; Cao, J.; Cao, J.; Zhu, F.; Cao, F.; Su, E. Almond (Amygdalus communis L.) kernel protein: A review on the extraction, functional properties and nutritional value. Food Res. Int. 2023, 167, 112721. [Google Scholar] [CrossRef]
- Benelhadj, S.; Gharsallaoui, A.; Degraeve, P.; Attia, H.; Ghorbel, D. Effect of pH on the functional properties of Arthrospira (Spirulina) platensis protein isolate. Food Chem. 2016, 194, 1056–1063. [Google Scholar] [CrossRef] [PubMed]
- Dickinson, E. Adsorbed protein layers at fluid interfaces: Interactions, structure and surface rheology. Colloids Surf. B 1999, 15, 161–176. [Google Scholar] [CrossRef]
- Karaca, A.C.; Low, N.; Nickerson, M. Emulsifying properties of chickpea, faba bean, lentil and pea proteins produced by isoelectric precipitation and salt extraction. Food Res. Int. 2011, 44, 2742–2750. [Google Scholar] [CrossRef]
- Zhao, Q.; Xie, T.; Hong, X.; Zhou, Y.; Fan, L.; Liu, Y.; Li, J. Modification of functional properties of perilla protein isolate by high-intensity ultrasonic treatment and the stability of o/w emulsion. Food Chem. 2022, 368, 130848. [Google Scholar] [CrossRef]
- Liu, G.; Hu, M.; Du, X.; Liao, Y.; Yan, S.; Zhang, S.; Qi, B.; Li, Y. Correlating structure and emulsification of soybean protein isolate: Synergism between low-pH-shifting treatment and ultrasonication improves emulsifying properties. Colloids Surf. 2022, 646, 128963. [Google Scholar] [CrossRef]
- Geerts, M.E.J.; Nikiforidis, C.V.; van der Goot, A.J.; van der Padt, A. Protein nativity explains emulsifying properties of aqueous extracted protein components from yellow pea. Food Struct. 2017, 14, 104–111. [Google Scholar] [CrossRef]
- Wu, C.; Zhang, Y.; Wang, J.; Xu, W.; Hu, Z.; Hu, C. Continuous enzyme crosslinking modifying colloidal particle characteristics and interface properties of rice bran protein to improve the foaming properties. LWT 2023, 184, 114997. [Google Scholar] [CrossRef]
- Xu, F.; Pan, M.; Li, J.; Ju, X.; Wu, J.; Cui, Z.; Wang, L. Preparation and characteristics of high internal phase emulsions stabilized by rapeseed protein isolate. LWT 2021, 149, 111753. [Google Scholar] [CrossRef]
- Jiang, J.; Chen, J.; Xiong, Y.L. Structural and Emulsifying Properties of Soy Protein Isolate Subjected to Acid and Alkaline pH-Shifting Processes. J. Agric. Food Chem. 2009, 57, 7576–7583. [Google Scholar] [CrossRef] [PubMed]
- Lv, P.; Wang, D.; Dai, L.; Wu, X.; Gao, Y.; Yuan, F. Pickering emulsion gels stabilized by high hydrostatic pressure-induced whey protein isolate gel particles: Characterization and encapsulation of curcumin. Food Res. Int. 2020, 132, 109032. [Google Scholar] [CrossRef] [PubMed]
- Dai, L.; Zhan, X.; Wei, Y.; Sun, C.; Mao, L.; McClements, D.J.; Gao, Y. Composite zein—Propylene glycol alginate particles prepared using solvent evaporation: Characterization and application as Pickering emulsion stabilizers. Food Hydrocoll. 2018, 85, 281–290. [Google Scholar] [CrossRef]
- Ozturk, B.; Argin, S.; Ozilgen, M.; McClements, D.J. Formation and stabilization of nanoemulsion-based vitamin E delivery systems using natural surfactants: Quillaja saponin and lecithin. J. Food Eng. 2014, 142, 57–63. [Google Scholar] [CrossRef]
- Wang, B.; Li, D.; Wang, L.-J.; Özkan, N. Effect of concentrated flaxseed protein on the stability and rheological properties of soybean oil-in-water emulsions. J. Food Eng. 2010, 96, 555–561. [Google Scholar] [CrossRef]
- Ye, F.; Miao, M.; Jiang, B.; Campanella, O.H.; Jin, Z.; Zhang, T. Elucidation of stabilizing oil-in-water Pickering emulsion with different modified maize starch-based nanoparticles. Food Chem. 2017, 229, 152–158. [Google Scholar] [CrossRef] [PubMed]
- Romero, A.; Beaumal, V.; David-Briand, E.; Cordobes, F.; Guerrero, A.; Anton, M. Interfacial and emulsifying behaviour of rice protein concentrate. Food Hydrocoll. 2012, 29, 1–8. [Google Scholar] [CrossRef]
Disclaimer/Publisher’s Note: The statements, opinions and data contained in all publications are solely those of the individual author(s) and contributor(s) and not of MDPI and/or the editor(s). MDPI and/or the editor(s) disclaim responsibility for any injury to people or property resulting from any ideas, methods, instructions or products referred to in the content. |
© 2024 by the authors. Licensee MDPI, Basel, Switzerland. This article is an open access article distributed under the terms and conditions of the Creative Commons Attribution (CC BY) license (https://creativecommons.org/licenses/by/4.0/).