Article

Effects of Total Solid Content on Anaerobic Fermentation Performance and Biogas Productivity of Tail Vegetables

by
Li Yao
,
Yanqin Wang
*,
Ran Li
,
Longyun Fu
,
Zhaodong Liu
and
Xinhao Gao
State Key Laboratory of Nutrient Use and Management, Key Laboratory of Wastes Matrix Utilization, Ministry of Agriculture and Rural Affairs, Institute of Agricultural Resources and Environment, Shandong Academy of Agricultural Sciences, Jinan 250100, China
*
Author to whom correspondence should be addressed.
Fermentation 2024, 10(8), 437; https://doi.org/10.3390/fermentation10080437
Submission received: 1 August 2024 / Revised: 18 August 2024 / Accepted: 21 August 2024 / Published: 22 August 2024
(This article belongs to the Section Industrial Fermentation)

Abstract

:
A large amount of vegetable waste generated by farms is currently damaging the environment and public health. Anaerobic fermentation is a mature technology that significantly contributes to the recovery of energy and resources from tail vegetables and the control of environmental pollution. However, most vegetable wastes have not been utilized due to poor performance of biogas production, lack of optimal solid contents, and multiple other reasons. Herein, the anaerobic digestion biogas production performance of tail vegetables treated with different total solid (TS) content was studied using solanaceous and leafy vegetables as raw materials. Results showed that there was no acidification in all trials except for treatment with TS of 6%. The optimal TS for anaerobic fermentation of vegetable waste was determined to be around 20% in terms of methane production and biogas production efficiency. The cumulative methane production per unit of volatile solids (VSs) reached 241.7 mL CH4/g of VS, and the methane content was about 65% during the peak period of biogas production. Theoretically, the value of methane production based on anaerobic fermentation of tail vegetables is as high as 1.8 × 10¹³~4.6 × 10¹³ L in China. This research provides advice for screening specific and efficient parameters to promote the biogas production rate by tail vegetable anaerobic fermentation.

1. Introduction

The treatment of tail vegetables is becoming a major issue worldwide due to their generation in significant quantities, especially in China. Just in the year 2015 alone, more than 785 million tons of vegetables were produced, followed by more than 360 million tons of vegetable waste [1,2]. More than 60% of vegetable waste is discarded without any treatment. Vegetable waste contains high moisture and nutrient content, and a large number of pathogens [3], resulting in the spread of bacteria [4] and the emission of volatile organic compounds [5,6], causing serious environmental health risks. Therefore, how to convert vegetable waste with high moisture content into harmless and environment-friendly products has become a major problem for the development of facility agriculture. Anaerobic fermentation has a lot of advantages, such as low energy consumption, elimination of odors, energy acquisition, and the reduction of the environmental impact in the treatment process [7]. However, vegetable waste is easy to hydrolyze, producing a large amount of volatile fatty acids (VFAs) rapidly, destroying the stability of the fermentation system, thereby reducing the activity of methanogens [8,9,10] and making the methanogenic stage a rate-limiting step in the anaerobic digestion process. Thus, a comprehensive analysis of the whole cycle behavior of tail vegetables in the anaerobic fermentation process contributes to clarifying the key limiting factors in the anaerobic fermentation process of vegetable waste, reveals the potential effective adjustment path, and provides a theoretical basis for expanding the biogas project with vegetable waste as the main fermentation raw material.
In the process of anaerobic fermentation, mass transfer among the gas–liquid–solid affects substrate degradation and gas production, which is mostly determined by the total solid (TS) content [11]. TS was also related to the hydrolysis rate constant, maximum microbial growth rate, and methane production [12]. Anaerobic fermentation could be divided into Wet-AF (TS < 10%), Semi-AF (10% ≤ TS < 15%), and Dry-AF (TS ≥ 15%) [13]. In the process of liquid fermentation, the lignin and cellulose components in the tail vegetables will float and stratify, which inevitably increases the heterogeneity of the fermentation system [14]. In this case, there were significant differences in the changing trend of physical and chemical indexes, the composition and distribution of fermentation microorganisms, and gas production, which were related to the total solid content [15,16,17]. When TS increased from 8% to 38%, VFAs and ammonia nitrogen inhibited the methane production decreases during the anaerobic fermentation of Arundo donax [18]. This is due to the low content of lignocellulose in rotten vegetables, which makes it difficult to achieve a balance between hydrolysis, acidification, and methanogenesis in wet fermentation [15]. Since the higher TS content limits the diffusion of the material [19], a previous study has found that methane production at 20% TS treatment was more than both 25% and 30% TS treatments [4].
For this study, the mixture of solanaceous and leafy vegetables was selected as the experimental material to investigate the feasibility of anaerobic fermentation of tail vegetables, which would provide a theoretical basis for the anaerobic fermentation of vegetable wastes. We focused on the characteristics of high moisture content and easy acidification of vegetable waste and carried out continuous anaerobic fermentation experiments under medium temperature conditions. Through the tracking and monitoring of each index and the analysis of the variation law of each index, the effects of different water content on the stability of a medium-temperature vegetable waste anaerobic fermentation system were compared. Finally, this work aims to provide a theoretical basis and optimization measures for anaerobic fermentation to solve the problem of resource waste and environmental pollution of tail vegetables.

2. Materials and Methods

2.1. Characteristics of Tail Vegetables and Inoculum

Tail vegetables (including cabbage leaves and solanaceous straw, solanaceous in this study mainly contained eggplant and tomato) were collected from a facility vegetable garden (Jinan city, Shandong province, China) after sorting out plastic bags and other debris and crushed into 1–2 cm using a food waste disposer (DAOGRS MCD-56, DAOGRS INC, China). Two types of tail vegetable fragments were mixed according to the mass ratio of 1:1. Biogas residue with cow dung was used as inoculum and cultured for two years in the lab before the fermentation experiment. The characteristics of feedstock for anaerobic fermentation are detailed in Table 1.
The content of TS and VS was determined according to the National Environmental Protection Standard of the People’s Republic of China (HJ 643-2013 [20]). Lignin and cellulose were determined by normal washing method [16]. The total carbon (TC) and total nitrogen (TN) in tail vegetables and inoculum were determined by an element analysis system (Vario EL Ⅲ, Langenselbold, Germany) according to a previous study [10].

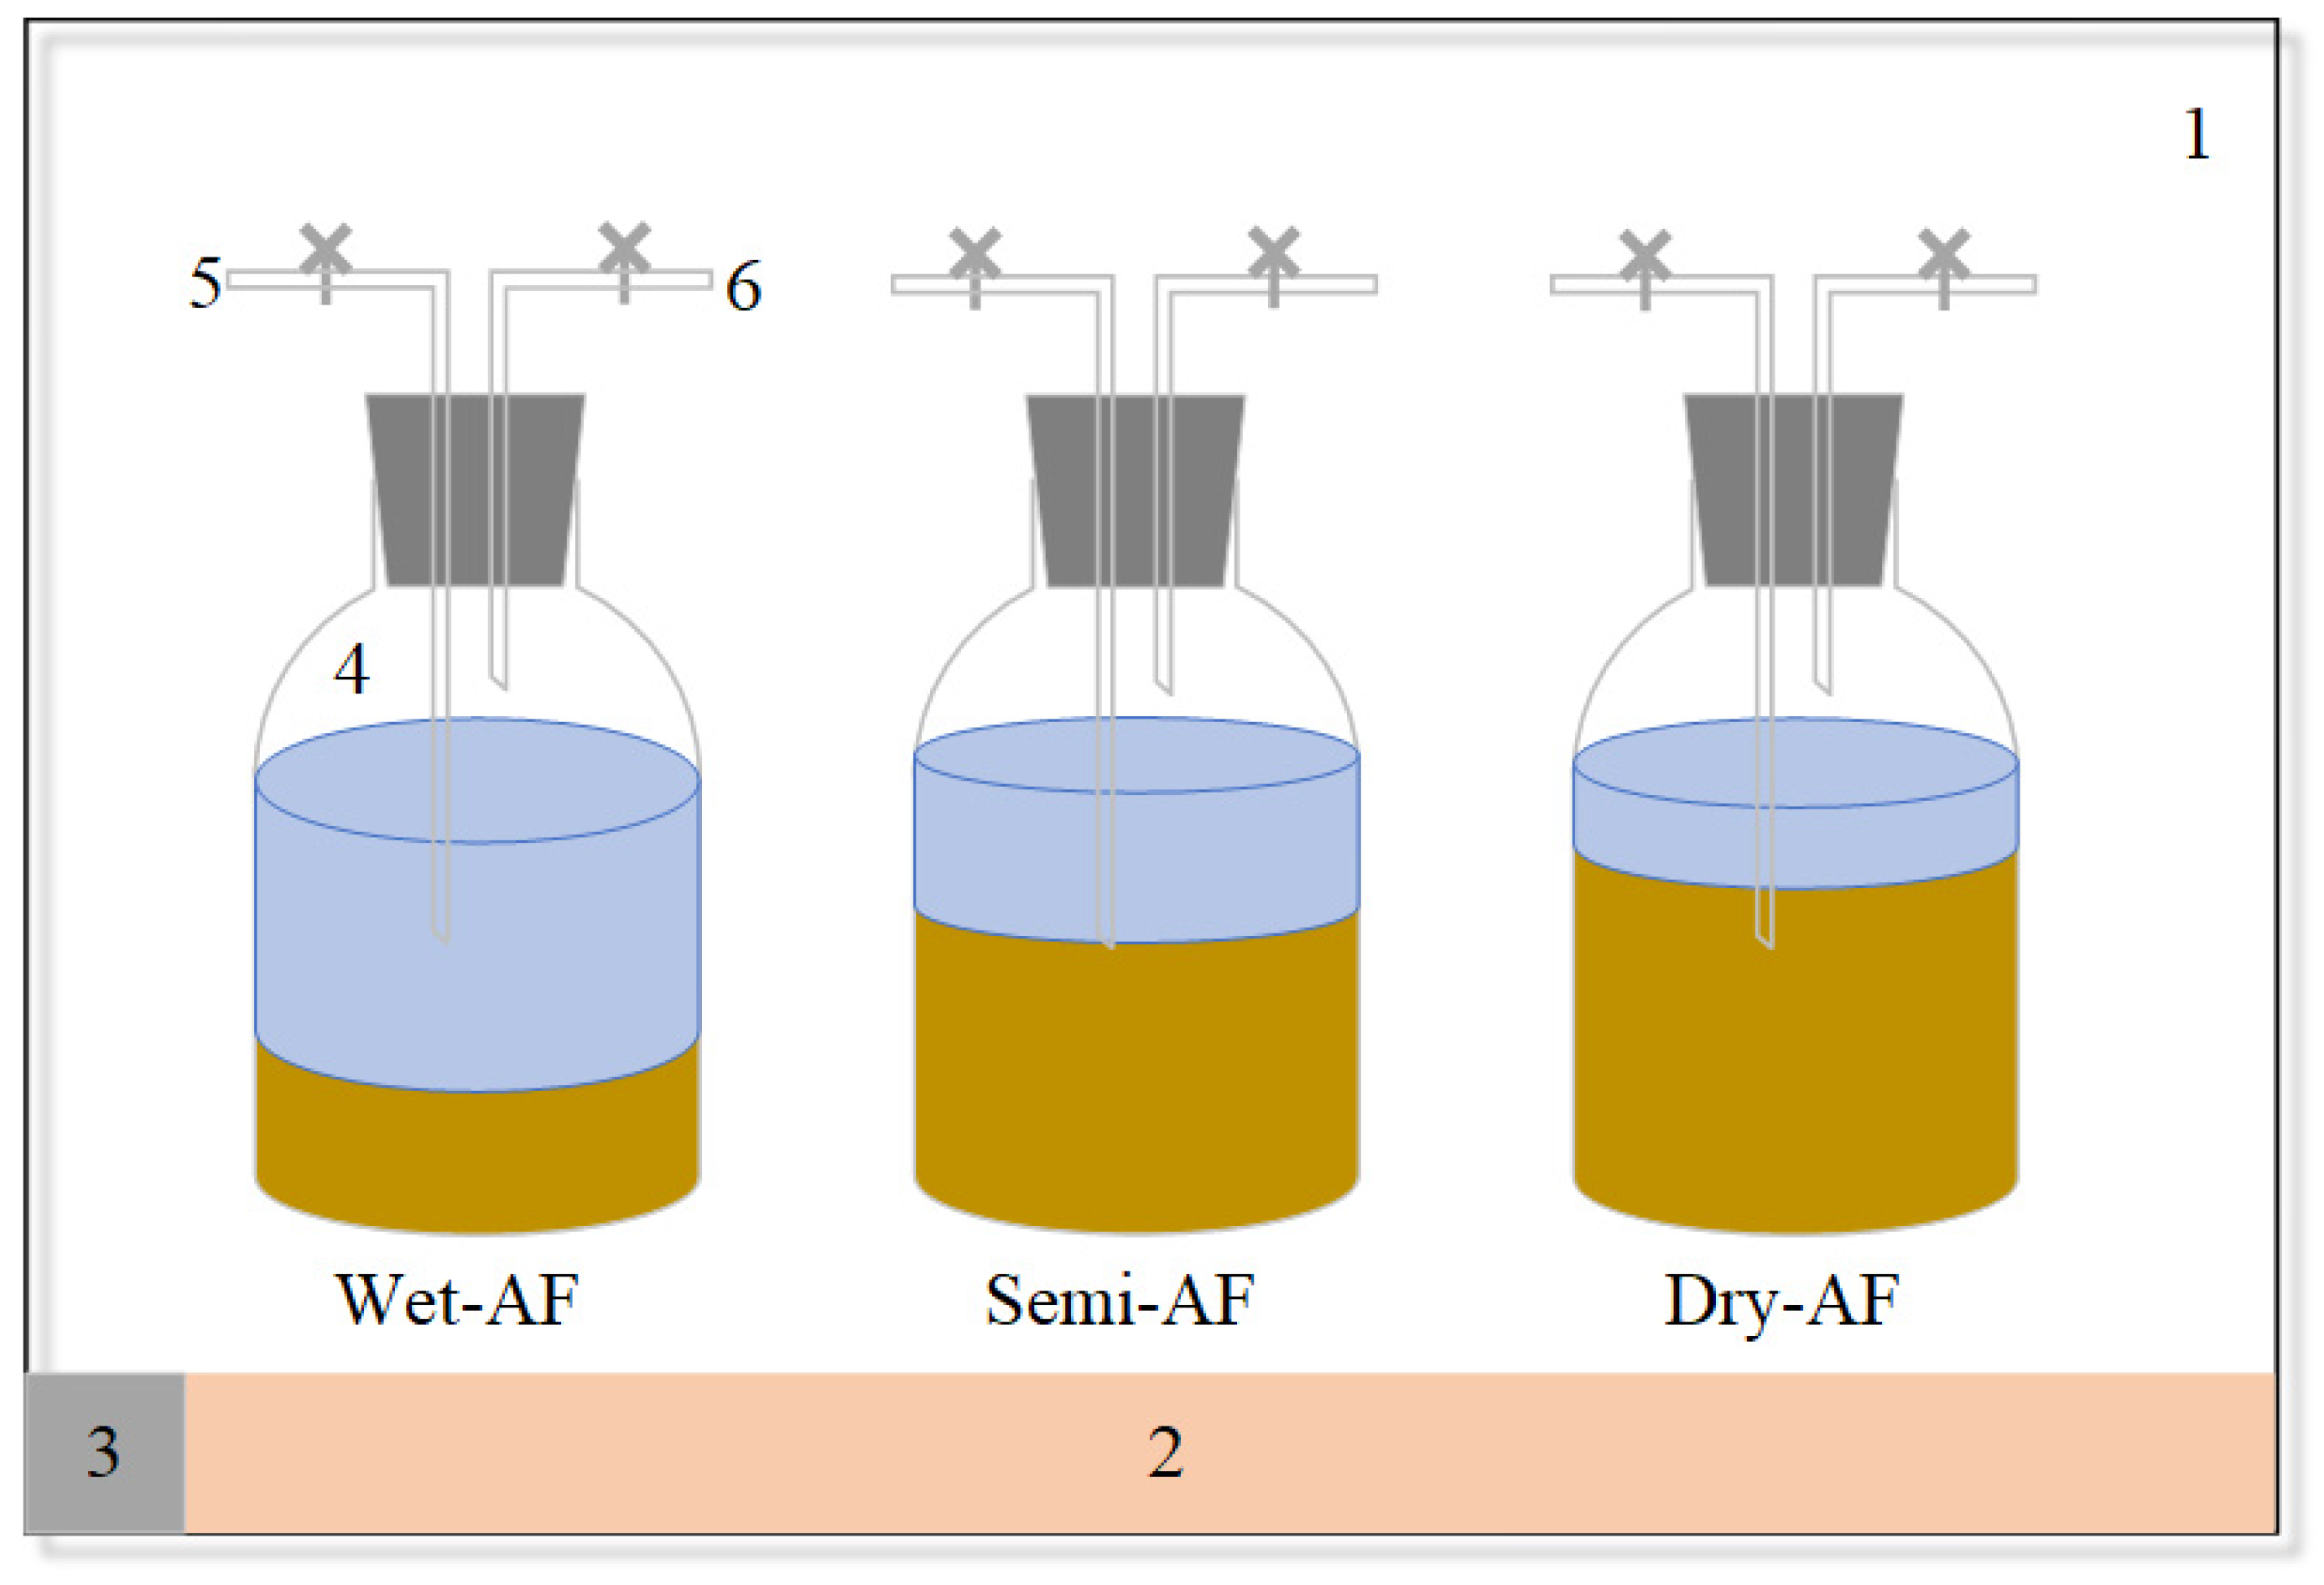
2.2. Anaerobic Fermentation Experimental Design and Apparatus

As shown in Figure 1, the apparatus contained a constant temperature cabinet, a fermentation bottle, a flowmeter, and a gas-collecting bag. The fermentation bottle (effective volume is 2.5 L) is connected to the flow meter and the gas collecting bag through a glass tube and rubber tube. The fermentation of different tail vegetables was performed at different TS contents varying from 6% to 25%, and all bath tests are detailed in Table 2. The generated biogas was collected by the gas-collecting bag. The fermentation bottles were placed in a thermostat at 37 ± 1℃ for dynamic monitoring. Additionally, the substrate/inoculum (S/I) ratio in all anaerobic fermentation treatments in this study was controlled to 1.68 (as shown in Table 2) to exclude its effect on the experimental results.

2.3. Determination and Methodology of Liquid Phase

In total, 5 g of sample was added into 100 mL centrifuge tube and dispersed with 50 mL of deionized water, fully shaken for 2 min, and left standing for 30 min, and then pH value was determined by acidometer (PHS-3C, Shanghai Precision Scientific Instruments Co., Ltd., Shanghai, China). To determine cellulose, hemicellulose, and lignin content, we referred to the work by van Soest [21] with slight modifications: The dried samples (0.5 ± 0.05 g) were put into a special test bag (F57, ANTOM, USA), sealed, and put into an ANTOM 220 cellulose analyzer (Beijing Zhongshiye Technology Co., Ltd., Beijing, China) for determination. After washing with neutral detergent, acidic detergent, and 72% H2SO4, they were dried and placed in a crucible. All samples were burned at 550 °C for 3 h in a muffle furnace. After cooling and weighing, the contents of cellulose, hemicellulose, and lignin were obtained, respectively.
The concentrations of propionic acid and acetic acid were determined by gas chromatography (GC2014, Shimadzu, Kyoto, Japan). The chromatographic conditions were as follows: capillary column (DB-WAX, Agilent, Santa Clara, CA, USA) was used, high purity N2 was used as a carrier gas, and hydrogen ion flame detector (FID detector) was used. The temperatures of the instrument inlet and detector were set at 250 °C and 300 °C, respectively. The column box was programmed to increase the temperature. The initial temperature was set at 110 °C, maintained for 1 min, and then increased to 250 °C at 10 °C/min and maintained for 5 min [17]. Total ammonia nitrogen (including free ammonia (NH3) and ammonia nitrogen (NH4+-N)) was determined by a flow injection analyzer (AA3, SEAL, Norderstedt, Germany) according to the standard of ISO 5664-1984 [22]. Alkalinity (ALK) was determined by ZDJ-5B (Leici, Shanghai, China).

2.4. Determination and Methodology of Gas Phase

The amount of biogas was measured by the biogas flow meter (Ritter, Bochum, Germany), and the components of the biogas (CO2, CH4, N2, H2, and O2) were analyzed by the gas chromatography system with the thermal conductivity detector (TCD detector). Helium was used as the carrier gas at a flow rate of 5.2 mL/min. The temperature of the detector room was maintained at 200 °C, while the initial temperature of the oven was 40 °C and then rapidly increased to 60 °C within 1 min. The amount of methane produced per gram of raw material expressed by mL CH4/g VS and the amount of methane loaded into the reactor at start-up were corrected by subtracting the amount of methane produced per gram of inoculum from the amount of methane loaded into the control reactor [3].

2.5. Kinetic Characteristics of Methane Production

The modified Gompertz model was used to analyze the CH4 production in anaerobic fermentation of tail vegetables under different moisture content treatments [23,24]:
P = P m a x × e e R m a x × e P m a x λ t + 1
In Formula (1), P represents accumulation CH4 yields per gram VS (mL CH4/g VS) at time t, Pmax is the maximum accumulation CH4 production per gram VS (mL CH4/g VS), t is the time (d), Rmax is the maximum CH4 generation per gram VS rate ((mL CH4/g VS)/d), λ is the lag phase (d), and e is 2.71828.
t m a x = λ + P m a x R m a x × e
In Formula (2), tmax (d) is the time when the CH4 yield reaches the maximum value, which is calculated by Formula (3).
k = R m a x P m a x
In Formula (3), k (d−1) is the reaction kinetic constant, which represents the conversion rate of fermentation raw materials.
All the above kinetic parameters of biomethane production are shown in Table S1.

2.6. Statistical Analysis

All treatments were carried out in triplicate, and the data were presented as the mean value ± standard error. Statistically significant differences between mean values were determined using one-way analysis of variance (ANOVA) with LSD. A p value < 0.05 indicates a statistically significant difference (within 95% confidence intervals).

3. Results and Discussion

3.1. Characteristics of Raw Materials and Inoculants

The tail vegetables used in this study were a mixture of solanaceous straw and leafy vegetables, which contained high levels of structural carbohydrates (hemi-/cellulose and lignin) (66.1%, TS ratio), as shown in Table 1, so dry fermentation treatments with a high ratio of tail vegetables may require longer anaerobic digestion times. The C/N ratio of rotten vegetables used in this study was 19.7, which was suitable for anaerobic microbial growth [25]. It is worth noting that the low pH (6.5) of the tail vegetables, which may deplete the alkalinity of the reaction substrate during anaerobic fermentation, hurts the anaerobic process [26].
Some studies have found that the adoption of an appropriate inoculation ratio in anaerobic fermentation can also effectively avoid over-acidification and other adverse phenomena and achieve good gas production results. For instance, in the anaerobic fermentation of corn stover, increasing the inoculation amount can effectively prevent the partial acid in the early stage of fermentation and shorten the start-up time of fermentation [15,17,27]. The appropriate ratio of TS can avoid the problem of uneven diffusion in the process of biogas production and then effectively improve the biogas production and release rate [7,28]. Therefore, it is necessary to explore the methane production and kinetic parameters in the anaerobic fermentation process of tail vegetables with different moisture contents and to clarify the TS content of the maximum methane yield in the anaerobic fermentation of tail vegetables.

3.2. The Effect of TS Content on Biogas Production Performance

We explored the effects of different TS contents on biogas production during anaerobic fermentation of tail vegetables. The CH4 production per gram of treatment increased rapidly at the beginning stage (Figure S1a–c) and then decreased at different rates after reaching the peak value [29]. The peak value of methane production occurred at 5–11 days, in contrast to previous studies [19,30], and the daily methane production in wet and semi-dry fermentation conditions increased with the delay of the peak time of methane production. When TS content was 6%, 8%, and 10%, the peak values of biogas production were 13.5, 18.8, and 19.1 mL CH4/g VS on the 5th, 9th, and 9th days, respectively (Figure S1d). The peak values of biogas production were 19.8, 15.1, and 22.8 mL CH4/g VS at TS content of 12%, 15%, and 18% on the 9th, 10th, and 11th days, respectively (Figure S1e). This may be attributed to the large amount of cellulose and crude protein in the tail vegetables, which are easily hydrolyzed by fermentative bacteria in the early stage of anaerobic reaction and produce a large amount of volatile fatty acids, thus inhibiting the biological activity of methanogens [29,31].
Compared with wet fermentation and semi-dry fermentation, dry fermentation has a higher TS content, a later peak time of methane production, and lower daily biogas production (Figure S1). The first biogas production peak appeared on the 6th (25.0 mL CH4/g VS), 9th (20.4 mL CH4/g VS), and 9th (21.5 mL CH4/g VS) day in the 20%, 22%, and 25% TS content (dry fermentation) treatment, respectively (Figure S1f). It should be noted that the highest biogas production peak appeared in the treatment with a TS content of 20%, which was 85.2% higher than that of the 6% TS content treatment (p < 0.05), which were directly related to the characteristics of tail vegetables (Table 1). The contents of cellulose and hemicellulose in solanaceous straw and leafy vegetables were higher, and the hydrolysis rate was slower, which perhaps inhibited the acidification process under dry fermentation conditions, thus alleviating the effect of acidification on the biogas production rate.

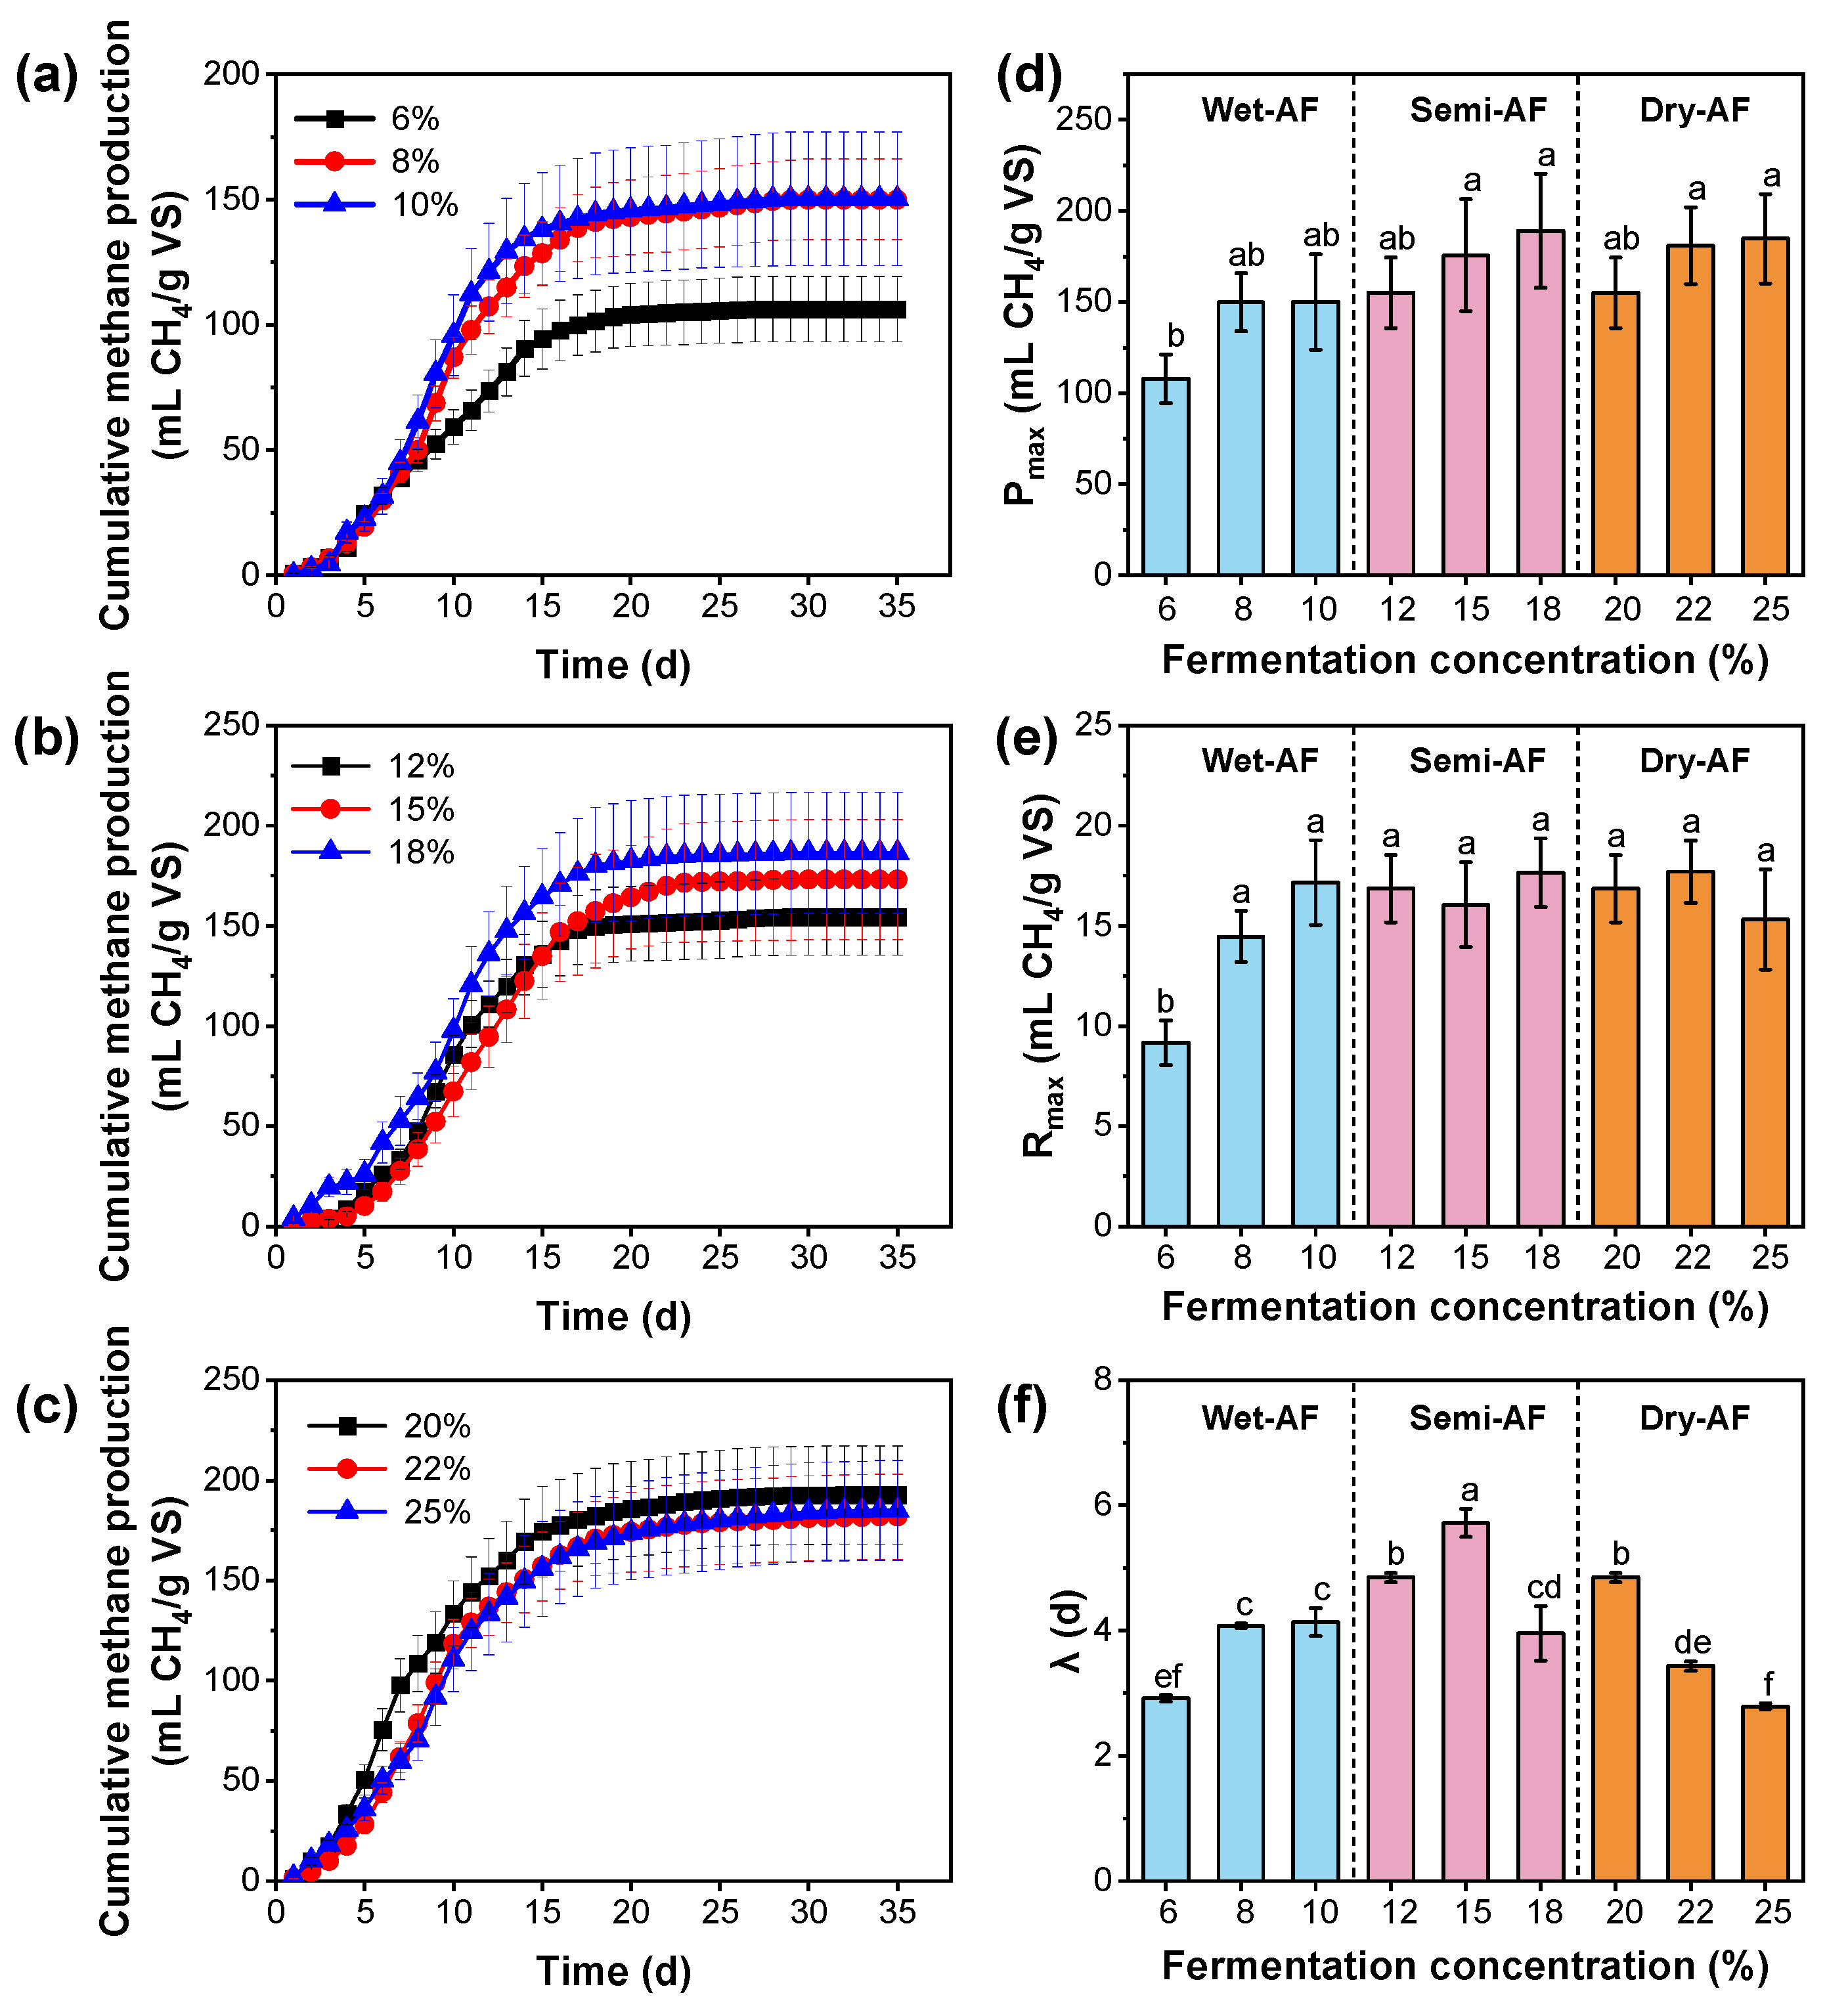
3.3. The Performances of Cumulative Methane Production under Different TS Content Treatments

The modified Gompertz model was used to simulate the anaerobic fermentation process of tail vegetables under different TS content treatments. The simulation results are shown in Table S1 and Figure 2, and R2 is above 0.99. As shown in Figure 2a–c and Table S1, the predicted cumulative methane production (Pmax) of TS with different ratios was almost consistent with the measured value (Pmea). The Pmax is closely related to the TS content, and the descending order is the following: Dry-AF (155.20~184.83 mL CH4/g VS) ≈ Semi-AF (154.49~189.12 mL CH4/g VS) > Wet-AF (107.87~150.07 mL CH4/g VS) (Figure 2d). This is consistent with the increase in cumulative methane production with the decrease in TS content in some previous studies [30]. Furthermore, the maximum methane production rates (Rmax) of Semi-AF and Dry-AF were similar, while the Rmax at a TS content of 6% (9.17 mL CH4/g VS)/d) was significantly (p < 0.05) lower than that of all other treatments (Figure 2e). As for the lag phase (λ), the TS contents of 6% (2.92 d) and 25% (2.79 d) treatments were significantly shorter than other treatments (p < 0.05) (Figure 2f). The low content of cellulose and hemicellulose leads to the low methane production potential of the 6% TS content treatment. In contrast, high TS content treatment (especially 25% TS content) can accelerate the methane production rate (Rmax) and shorten the fermentation time (λ). Consistent with some previous studies [26,31,32], this study has found that the higher TS content results in a lower methane production rate due to its influence on solute mass transfer in the solid matrix. Meanwhile, in semi-dry fermentation and dry fermentation, the time to reach the maximum methanogenic rate (tmax) was later than that in wet fermentation, while the methanogenic rate (k) was inverse (Table S1). In some previous studies, the composition of TS is one of the key factors affecting methane production under the same anaerobic fermentation conditions. In detail, the Pmax of lipid-rich dairy products is 80, but the toxic long-chain fatty acid accumulation is produced by neutral lipid hydrolysis (λ = 13 days); the Pmax of cellulose-rich corn stover is 58, and the small molecular organic acid produced by it will destroy the acid-buffering performance of the system (λ = 25 days); the Pmax of lignin-rich cow dung and other inoculums is 28, and the complex molecular structure directly extends λ into 20 days [33,34]. Similarly, the amount of difficult-to-degrade lignin in solanaceous vegetables reduces its conversion rate during anaerobic fermentation and delays the peak time of methane production in this study. In another study [35], the total amount of leafy vegetables in Semi-AF and Dry-AF was higher than that in Wet-AF, the cellulose content was higher, and the initial stage of anaerobic digestion was largely hydrolyzed, which weakens the acid buffering capacity of the system, thereby inhibiting the activity of methanogens and further destroying the reaction of methanogens.
Based on the above analysis, there were significant differences in methanogenic performance between different treatments. However, it is not clear whether the degradability of organic material components or the heterogeneity of the system under different TS content plays a key role in the process of anaerobic fermentation, which needs to be further verified.

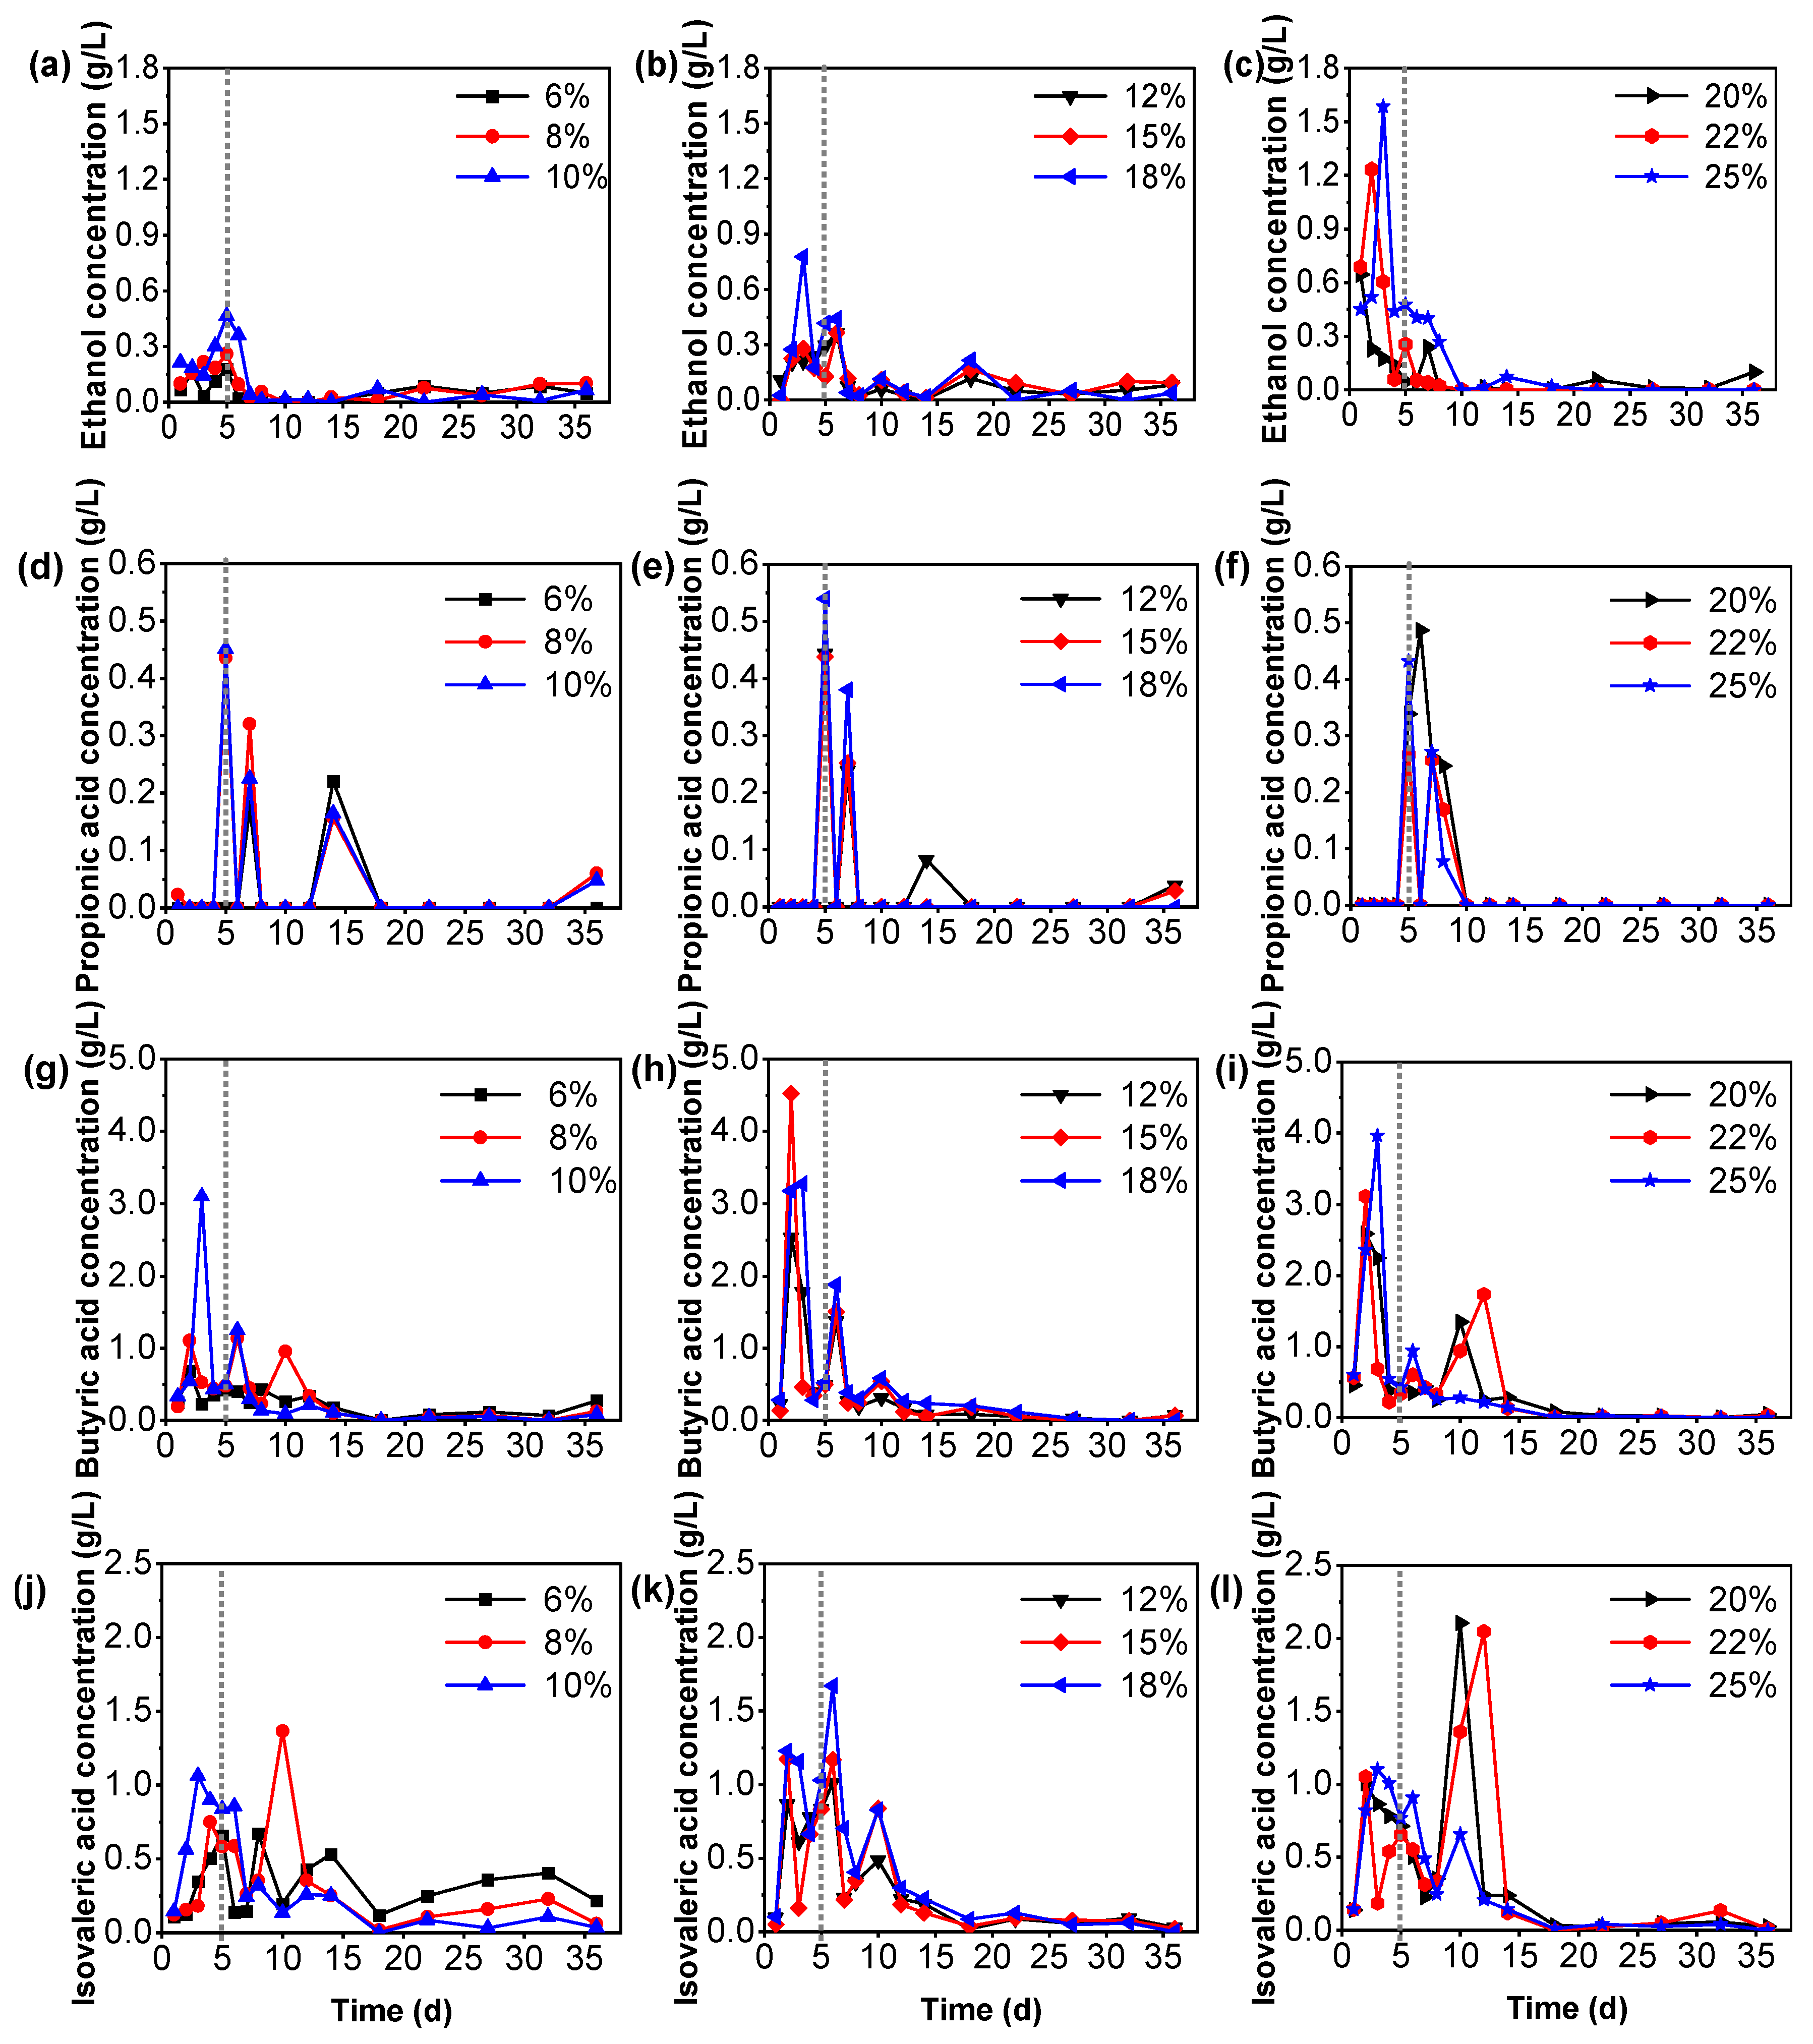
3.4. The Variation in Acetic Acid and VFAs in Tail Vegetables Anaerobic Fermentation

Since only acetic acid can be directly converted to CH4 and CO2 by methanogens in anaerobic fermentation systems, it is necessary to explore its ratio to further clarify its methanogenic potential [36]. As shown in Figure 3a–c, the complex organic matter in the rotten vegetable was further hydrolyzed by hydrogen-producing and acetic acid-producing bacteria into small molecular organic acids such as acetic acid; thus, the concentration of acetic acid increased rapidly in the early stage (0–5 days) of fermentation. After 5–20 days of fermentation, the concentration of acetic acid decreased, and methane was produced by methanogens at this stage, which was also the peak period of methane production, consistent with the daily methane production (Figure S1). Previous studies have found that when the concentration of acetic acid in the anaerobic fermentation system exceeds 0.8 g/L, it will affect the stability of the system and even lead to the collapse of the anaerobic fermentation system [37]. The change in acetic acid concentration in each treatment increased rapidly above 0.8 g/L in the first 5th day for the wet fermentation with a TS content of 6%, and the high concentration of acetic acid could last for 7–9 days (Figure 3d). This indicates that acetic acid has accumulated to affect the system, which is consistent with the daily methane production (Figure S1d). None of the other treatments showed any accumulation of acetic acid, which decreased at a time corresponding to the peak of daily methane production (Figure S1e,f). Accordingly, the methane production rate at 6–10% TS content treatment was positively correlated with the acetic acid production rate, while the methane production rate and acetic acid yield in the high TS content (12–25%) treatment were not consistent, resulting from other factors.
Due to the different composition of organic waste and metabolic pathways of organic matter, different TS content of tail vegetables will produce corresponding VFAs (including acetic acid and propionic acid, butyric acid, and isovaleric acid) or alcohol fermentation products or yields in the anaerobic fermentation process [16]. As indicated in Figure 3d–f, the total VFA concentration peaked on the 6th day and then gradually decreased. That is mainly due to the fact that the hydrolysis/acid production rate of organic matter in tail vegetables is higher than the methane production rate in the early stage of fermentation. The easily degraded matter is hydrolyzed into VFAs, which are then converted into methane and carbon dioxide by methanogens. Appels et al. [38] found that a total VFA concentration above 6 g/L inhibits methanogenic activity. However, the peak values of total VFAs in 20–25% TS content fermentation were higher than the threshold concentration without affecting the acidification of the fermentation system (Figure 3f). One possible reason is that tail vegetables with an appropriate C/N ratio as raw materials may produce a large amount of VFAs and sufficient buffer substances such as ammonia nitrogen during the degradation process. Therefore, although the peak content of total VFAs in the tank is high, it is easy to neutralize by ammonia nitrogen, which maintains the stability of the anaerobic fermentation system [3,6]. In addition, the concentration of VFAs in the treatment with a TS content of 6% was kept at a high level (Figure 3d), which indicated that the reduction in methane production might be related to the excessive accumulation of VFAs. The concentration change in VFAs is not only related to the operation efficiency of the reactor [10] but also plays one of the important early warning indicators to diagnose whether the system is stable [39,40]; thus, this population must be monitored.

3.5. The Differences in Acidogenic Types in Tail Vegetables’ Anaerobic Fermentation

In this study, we have detected the concentration of ethanol and typical VFAs (Figure 4) to analyze the effect of different TS contents on the methanogenic potential of the anaerobic fermentation process. The fermentation type of acid production stage can be divided into ethanol fermentation (main fermentation products are ethanol and acetic acid), propionic acid fermentation (main fermentation products are propionic acid and acetic acid), butyric acid fermentation (main fermentation products are butyric acid and acetic acid), and mixed acid fermentation, based on the relative amount of each species of VFAs [41]. The above fermentation products were used as substrates for hydrogen-producing acetogens and methanogens and were eventually degraded into CH4 and CO2. Based on this, we analyzed the effects of different acid production pathways caused by different TS content treatments on methane productivity.
In the early stage of anerobic fermentation of tail vegetables, the peak values of VFAs (this section discusses C3–C5 VFAs without acetic acid) contents of Wet-AF treatment from high to low are ordered as follows: butyric acid (1.0–3.2 g/L) > isovaleric acid (0.6–1.1 g/L) > ethanol (0.2–0.5 g/L) > propionic acid (0.0–0.5 g/L) (Figure 4a,d,g,j); in Semi-AF treatments, peak values from high to low of VFAs and alcohol contents are ordered as butyric acid (2.5–4.6 g/L) > isovaleric acid (0.8–1.3 g/L) > ethanol (0.3–0.8 g/L) > propionic acid (0.4–0.5 g/L) (Figure 4b,e,h,k); and in Dry-AF treatments, peak values from high to low of VFAs and alcohol contents are ordered as butyric acid (1.0–1.8 g/L) > ethanol (0.6–1.6 g/L) > isovaleric acid (0.8–1.1 g/L) > propionic acid (0.0–0.4 g/L) (Figure 4c,f,i,l). Consistent with other results in previous studies [42,43], the carbohydrate-rich organic material can improve the proportion of propionic acid and butyric acid in mixed acid products, and organic matter with high protein content can promote the valerate acid proportion in the anaerobic formation. In the process (5–15 days) of fermentation, the second peak values of VFA concentrations appeared: in Wet-AF treatments, isovaleric acid (0.2–1.5 g/L) > butyric acid (0.2–1.2 g/L) > propionic acid (0.0–0.2 g/L); in Semi-AF treatments, isovaleric acid (0.5–1.7 g/L) > butyric acid (0.8–0.9 g/L) > propionic acid (0.2–0.4 g/L); in Dry-AF treatments, isovaleric acid (0.6–2.2 g/L) > butyric acid (1.0–1.9 g/L) > propionic acid (0.2–0.5 g/L). With the process of anaerobic fermentation, initially, soluble organic carbon and proteins within organic substances are fermented to yield propionic acid (Figure 4d–f) or butyric acid (Figure 4g–i); subsequently, cellulose, which is challenging to degrade and hydrolyze, is gradually utilized by acetogenic bacteria to generate acetic acid, directly facilitating the production of methane. Nevertheless, under the treatment of 20–25% TS content, as the accumulation of acetic acid and propionic acid increases, the conversion and accumulation of butyric acid and isovaleric acid also concurrently rise, suggesting that high TS content (Dry-AF) is not conducive to the acetogenic methanogenesis pathway (Figure 3a–c and Figure 4j–l). Under the treatment of 20–25% TS content, the accumulation of ethanol (Figure 4a–c), and the potential harm to microbial activity further provide evidence for this speculation. Under 20–25% TS content treatment, VFAs exhibit a secondary accumulation phenomenon, which might be attributed to the preferential degradation of soluble carbohydrates and proteins under high load conditions, and the residual concentration of VFAs after microbial utilization does not reach the conditions to inhibit the degradation of refractory organic matter (such as cellulose) in tail vegetables, and cellulose is dissolved and utilized as time progresses. In turn, VFAs accumulate anew (Figure 3f). Additionally, 6–10% TS content might cause the main types of VFAs to shift from acetic acid and butyric acid to isovaleric acid, butyric acid, and acetic acid. Jiang et al. [44] also obtained similar research findings, suggesting that reducing the organic matter content will inhibit the generation of acetic acid.
Therefore, different TS content treatments may alter the anaerobic fermentation process of methane production and subsequently influence the methane production rate. It is indicated that wet fermentation has a positive effect on the direct methane production of acetic acid, while the large amount of dissolved organic carbon introduced in dry fermentation and semi-dry fermentation benefits the production of C3-C5 VFAs, which strengthens the carbon chain extension process and is not conducive to the formation of acetic acid and subsequent methane production.

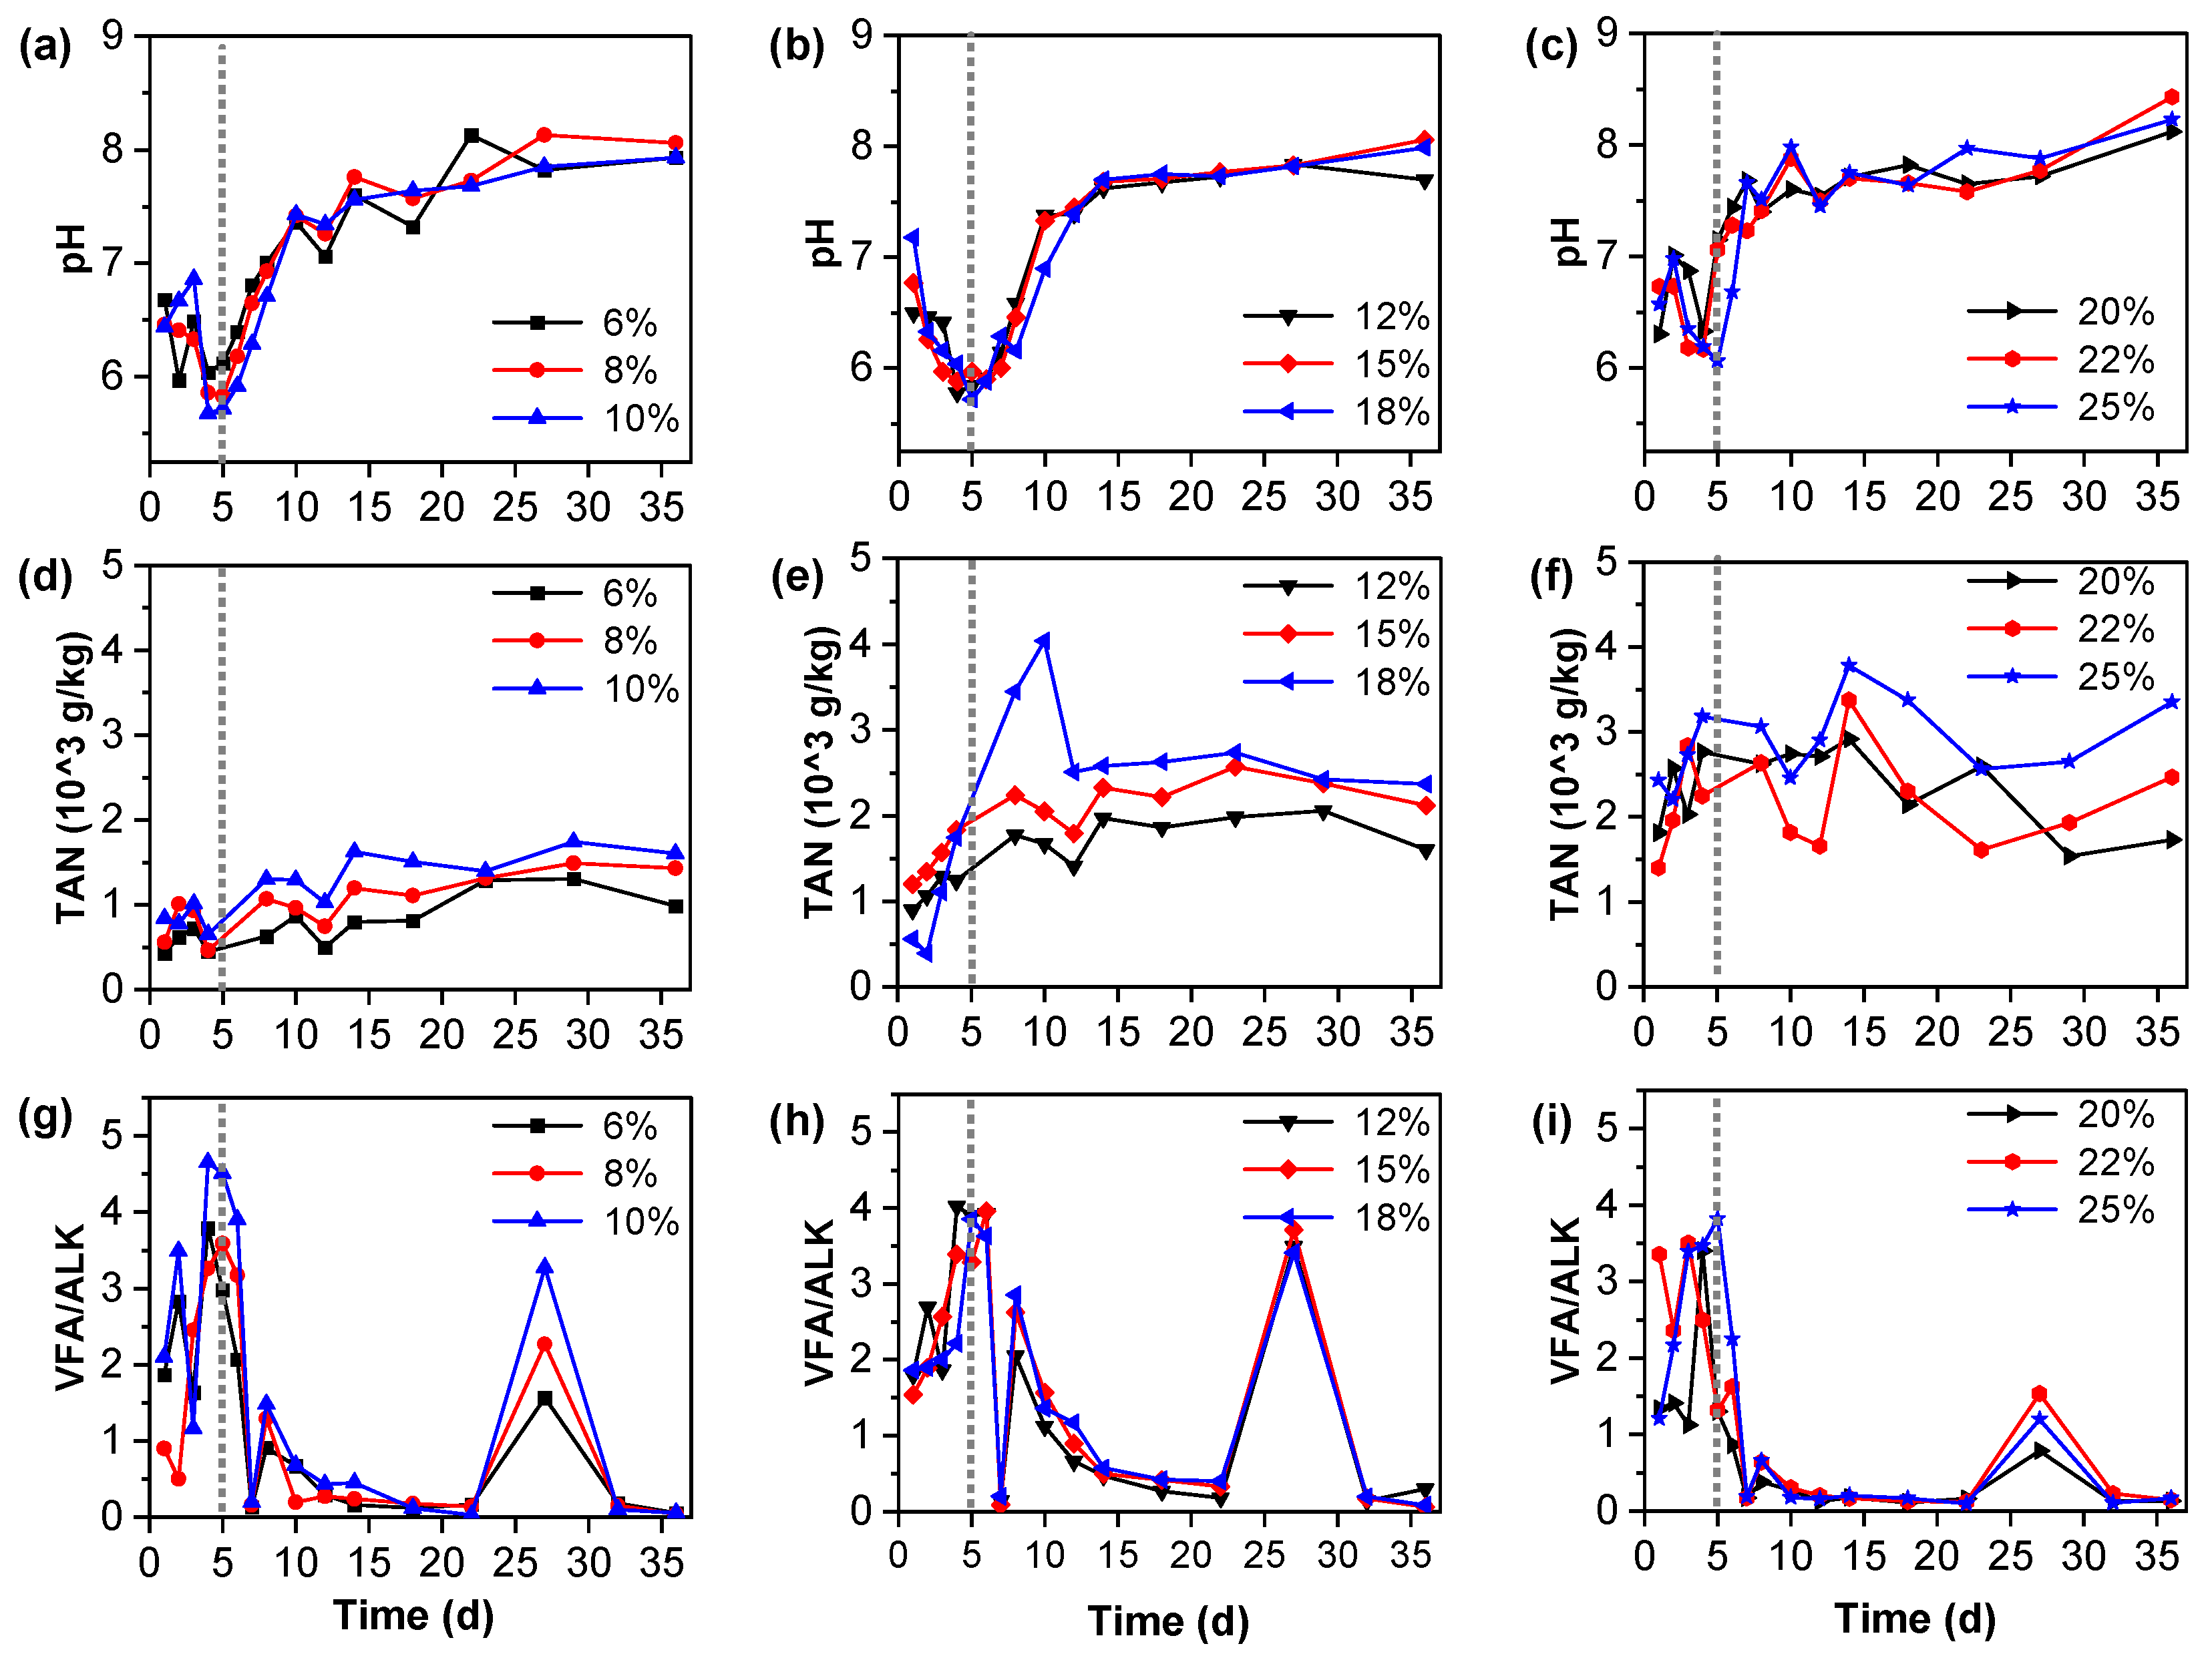
3.6. The Characteristics of pH, VFA/ALK, and TAN in the Fermentation Broth

For anaerobic fermentation, the pH value of fermentation materials, VFA/ALK, and total ammonia nitrogen (TAN) are important indexes to judge the stability of the fermentation system. Figure 5 shows the changes in pH, VFA/ALK, and TAN before and after fermentation with different treatments. Studies have shown that the optimum pH of methanogens is between 6.5 and 8.2 and that methanogens metabolism is severely inhibited when pH is below 6.5 and above 8.2 [45]. The initial pH value of all TS content fermentation was stable between 6.4 and 6.9 in this study (Figure 5). The pH value of 6% TS in wet fermentation was reduced to 6.1 (Figure 5a), below the optimal pH range of 6.5–7.2 for anaerobic fermentation [46]. The pH values of other treatments are between 7.6 and 8.1, which indicates that the system is stable (Figure 5d,g). The pH value of the 20–25% TS content fermentation system was slightly higher than those of the 6–10% TS content fermentation system and the 12–18% TS content fermentation system. This is similar to the results found in previous studies that pH is directly related to the type of acidogenic fermentation [44]. The ratio of VFA/ALK is also commonly used as a criterion for evaluating the stability of an anaerobic reaction system. VFA/ALK below 0.4 indicates that the system is stable and has some cushioning capacity, while VFA/ALK greater than 0.8 indicates significant instability of the anaerobic fermentation system [43]. As the final VFA/ALK at 6%, TS reached 0.7 (Figure 5c), the system was acidified and unstable, the buffer capacity was poor, and the cumulative methane production was relatively low. When the final VFA/ALK at 8% TS was 0.4, the system was unstable (Figure 5c). The VFA/ALK ratio of other fermentation processes is 0.1–0.3 (Figure 5f,i), and these systems are stable and consistent with methane production (Figure S1e,f).
Total ammonia nitrogen in an anaerobic fermentation system is also very important. On the one hand, ammonia nitrogen, as a metabolite of microorganisms, has a certain toxicity to methanogens. On the other hand, the presence of ammonia nitrogen can neutralize VFAs and increase pH value. In anaerobic systems, adequate ammonia accumulation helps to increase the buffer capacity of NH4HCO3 formation [9], and studies have shown that TAN above 5 g/L inhibits methane production [13]. According to TAN content (Figure 5b,e,h), the ammonia nitrogen value of the system increased slightly with the decomposition of macromolecular organic matter during fermentation. The best fermentation effect was the TS content of a 20% system with a stable TAN at a range of 1500–1900 g/kg (Figure 5h). The value of ammonia nitrogen in each treatment was not more than 3.5 g/kg, which indicated that there was no ammonia inhibition in the system.

3.7. Economic and Environmental Analysis of Rotten Vegetable Methane Source

The cost of a methane source is a critical factor to be considered in the process of anaerobic fermentation, which directly affects the economic effectiveness of engineering applications. Because tail vegetables are not needed by people, their costs were extremely low and set at 0.01 USD/kg. One research work has found that the total output of vegetables was 798 million tons in China in 2016, and about 51% of the total amount was tail vegetables. And as far as we know, the price of methane was 0.35 USD/m3 in China in 2023. Accordingly, we estimated the economic benefits of methane production by anaerobic fermentation with different TS contents of tail vegetables as detailed in Table S1. The results showed that the methane production efficiency by tail vegetables under different TS content treatments was from high to low: Wet-AF (1.75~2.18 L/kg) > Semi-AF (1.22~1.57 L/kg) > Dry-AF (0.86~0.96 L/kg); correspondingly, the economic benefits of methane production are consistent. It is worth mentioning that the methane obtained from the wet fermentation treatment of the tail vegetable has a theoretical yield of 1.8 × 10¹³~4.6 × 10¹³ L and benefit of USD 125~157 million per year for China (Table S2). However, the construction of the Wet-AF system requires a large amount of water and inoculum, and compared with the other two systems, the control of the tank volume and fermentation parameters of wet fermentation also requires a lot of capital investment. Therefore, although the wet fermentation of tail vegetables can obtain a large amount of energy and economic income, it is necessary to further optimize and explore cost-saving fermentation facilities and parameters.
In recent years, biogas residue and slurry from anaerobic fermentation of rotten vegetables have been frequently studied as soil amendments. It was found that the fermentation broth of vegetable waste is rich in water-soluble organic carbon and active mineral nutrients while producing methane by anaerobic fermentation. The fermentation broth can be used to regulate soil nitrate accumulation and vegetable growth after pH adjustment. Among them, the high dose was mainly used as a carbon source for the reduction treatment of high nitrate nitrogen accumulation facility soil (high nitrate soil) during the fallow period to reduce the nitrate nitrogen surplus [47]; as a comprehensive soil conditioner, it is used to regulate soil nitrate nitrogen accumulation and vegetable biomass accumulation during the growth period [48,49]. Additionally, acidic fermentation broth without pH correction has the potential to improve alkaline poor organic soil, but its salt content needs to be further reduced.
As the main by-product in the process of facility agricultural production, a tail vegetable not only directly pollutes the environment but also carries a lot of pesticides, antibiotics, and resistance genes, agricultural film debris (such as microplastics, phthalates, and phenols), and other pollutants [50,51,52]. It is necessary to conduct further analysis of the reduction and fate of pollutants in the anaerobic fermentation process to clarify the environmental significance of methane production by anaerobic fermentation of tail vegetables. Recently, researchers have found that microbial and environmental effects during anaerobic fermentation can lead to the degradation of plastics, pesticides, and antibiotics. Therefore, the anaerobic fermentation process is an effective disposal method for the degradation and harmlessness of pollutants in tail vegetables.

4. Conclusions

This study proves the technical feasibility of anaerobic fermentation measures for the recovery of vegetable waste and environmental improvement. By setting gradients of wet anaerobic fermentation (6–10% TS content), semi-dry anaerobic fermentation (12–18% TS content), and dry anaerobic fermentation (20–25% TS content), it was confirmed that wet anaerobic fermentation is the best treatment solution for leafy vegetables and chopped vegetables. The fermentation of vegetable waste is affected by the TS content. The highest biogas peak was observed in the treatment with 20% TS, which was 85.2% higher than the treatment with 6% TS. When the TS content increased from 8% to 20%, the cumulative methane production trended upward. The differences in cumulative methane production among the treatments were not significant. In the wet anaerobic fermentation of vegetable waste with 6–10% TS content, the production of acetic acid was more favorable for methane production than the production of C3-C5 VFAs. The VFA/ALK ratio of the fermentation residue can be used as an indicator of whether the fermentation tank will become acidic. After the 6% TS treatment, the VFA concentration remained at a high level, the system was acidic and unstable, and the buffering capacity was poor. It is possible to use anaerobic fermentation to treat vegetable waste, and the fermentation concentration should be above 8%. Technical support and theoretical guidance should be further provided for the rational use of tail vegetable anaerobic fermentation for resource utilization.

Supplementary Materials

The following supporting information can be downloaded at: https://www.mdpi.com/article/10.3390/fermentation10080437/s1, Figure S1: The variation of daily methane content (a–c) and biogas yield (d–f) in each treatment: TS concentration at 6–10%, 12–18% and 20–25% are classified as Wet-AF, Semi-AF and Dry-AF, respectively; Table S1: Kinetic parameters of the methane production by fitting the modified Gompertz equation; Table S2: Comparison of economic performance with different TS content anaerobic fermentation of vegetable residues.

Author Contributions

Conceptualization, L.Y., Y.W., and R.L.; data curation, L.Y., Y.W., and L.F.; funding acquisition, L.Y.; methodology, L.Y. and Y.W.; project administration, X.G.; resources, Y.W., L.F., and X.G.; software, R.L.; validation, Y.W. and L.F.; visualization, Y.W.; writing—original draft, L.Y. and Z.L.; writing—review and editing, R.L. and Z.L. All authors will be informed about each step of manuscript processing including submission, revision, revision reminder, etc., via emails from our system or assigned assistant editor. All authors have read and agreed to the published version of the manuscript.

Funding

This study was financed by the Agricultural Scientific and Technological Innovation Project of Shandong Academy of Agricultural Sciences (CXGC2024A06), the Key R&D Program of Shandong Province, China (2022TZXD0039), and the Modern Agro-industry Technology Research System of Shandong Province-Edible Fungi (SDAIT-07-07).

Institutional Review Board Statement

Not applicable.

Informed Consent Statement

Not applicable.

Data Availability Statement

The original contributions presented in the study are included in the article/supplementary material, further inquiries can be directed to the corresponding author.

Conflicts of Interest

The authors declare no conflict of interest. The funder was not involved in the study design, collection, analysis, interpretation of data, the writing of this article or the decision to submit it for publication.

References

  1. Li, C.; Bremer, P.; Harder, M.K.; Lee, M.S.W.; Parker, K.; Gaugler, E.C.; Mirosa, M. A systematic review of food loss and waste in China: Quantity, impacts and mediators. J. Environ. Manag. 2022, 3031, 14092. [Google Scholar] [CrossRef]
  2. Ganesh, K.S.; Sridhar, A.; Vishali, S. Utilization of fruit and vegetable waste to produce value-added products: Conventional utilization and emerging opportunities-A review. Chemosphere 2022, 287, 132221. [Google Scholar] [CrossRef] [PubMed]
  3. Liang, Z.; Liao, W.; Yu, Y.; Li, G.; An, T. How Does Vegetable Waste Decomposition Influence the Antibiotic Resistome and the Human Bacterial Pathogen Structure in Leachates? ACS ES&T Water 2021, 2, 226–236. [Google Scholar]
  4. Lin, D.; Huang, D.; Zhang, J.; Yao, Y.; Zhang, G.; Ju, F.; Xu, B.; Wang, M. Reduction of antibiotic resistance genes (ARGs) in swine manure-fertilized soil via fermentation broth from fruit and vegetable waste. Environ. Res. 2022, 214, 113835. [Google Scholar] [CrossRef] [PubMed]
  5. Qu, H.; Cao, J.; Wang, P.; Li, R.; Qi, Z.; Fu, J.; Chen, Y.; Chen, M. Volatile organic compounds and dominant bacterial community during aerobic composting of vegetable waste and cow manure co-complexing. BioResources 2022, 17, 1338–1353. [Google Scholar] [CrossRef]
  6. Liang, Z.; Feng, Q.; Zhang, Y.; Yu, Y.; Liao, W.; Li, G.; An, T. Odorous VOCs released from bio-decomposition and its interaction mechanism with bacteria: Compared inter-type with intra-type household garbage. J. Clean. Prod. 2024, 447, 141523. [Google Scholar] [CrossRef]
  7. Agrawal, A.; Chaudhari, P.K.; Ghosh, P. Anaerobic digestion of fruit and vegetable waste: A critical review of associated challenges. Environ. Sci. Pollut. Res. 2022, 30, 24987–25012. [Google Scholar] [CrossRef]
  8. Wilinska-Lisowska, A.; Ossowska, M.; Czerwionka, K. The influence of co-fermentation of agri-food waste with primary sludge on biogas production and composition of the liquid fraction of digestate. Energies 2021, 14, 1907. [Google Scholar] [CrossRef]
  9. Gao, Q.; Zhang, Y.; Li, L.; Zhou, H.; Wang, K.; Ding, J.; Jiang, J.; Wei, L.; Zhao, Q. The stress of bioactive compounds on microbes in anaerobic digestion of food waste and mitigation strategies: A critical review. Chem. Eng. J. 2024, 493, 152764. [Google Scholar] [CrossRef]
  10. Wu, D.; Liu, H.; Xing, T.; Xiao, F.; Liu, Y.; Zhen, F.; Sun, Y. An integrated evaluation strategy for anaerobic digestion monitoring based on acid-base balance and thermodynamics of volatile fatty acid degradation. Chem. Eng. J. 2024, 486, 150340. [Google Scholar] [CrossRef]
  11. Ge, X.; Xu, F.; Li, Y. Solid-state anaerobic digestion of lignocellulosic biomass: Recent progress and perspectives. Bioresour. Technol. 2016, 205, 239–249. [Google Scholar] [CrossRef] [PubMed]
  12. Zhu, J.; Yang, L.; Li, Y. Comparison of premixing methods for solid-state anaerobic digestion of corn stover. Bioresour. Technol. 2015, 175, 430–435. [Google Scholar] [CrossRef]
  13. Liotta, F.; d’Antonio, G.; Esposito, G.; Fabbricino, M.; Frunzo, L.; van Hullebusch, E.; Lens, P.; Pirozzi, F. Effect of moisture on disintegration kinetics during anaerobic digestion of complex organic substrates. Waste Manag. Res. J. A Sustain. Circ. Econ. 2014, 32, 40–48. [Google Scholar] [CrossRef]
  14. Xu, F.; Wu, Z.; Li, Y. Predicting the methane yield of lignocellulosic biomass in mesophilic solid-state anaerobic digestion based on feedstock characteristics and process parameters. Bioresour. Technol. 2014, 173, 168–176. [Google Scholar] [CrossRef] [PubMed]
  15. Chakraborty, D.; Mohan, S.V. Effect of food to vegetable waste ratio on acidogenesis and methanogenesis during two-stage integration. Bioresour. Technol. 2018, 254, 256–263. [Google Scholar] [CrossRef]
  16. Li, D.; Chen, L.; Liu, X.; Mei, Z.; Ren, H.; Cao, Q.; Yan, Z. Instability mechanisms and early warning indicators for mesophilic anaerobic digestion of vegetable waste. Bioresour. Technol. 2017, 245, 90–97. [Google Scholar] [CrossRef] [PubMed]
  17. Wang, Y.; Li, G.; Chi, M.; Sun, Y.; Zhang, J.; Jiang, S.; Cui, Z. Effects of co-digestion of cucumber residues to corn stover and pig manure ratio on methane production in solid state anaerobic digestion. Bioresour. Technol. 2018, 250, 328–336. [Google Scholar] [CrossRef]
  18. Yang, L.; Li, Y. Anaerobic digestion of giant reed for methane production. Bioresour. Technol. 2014, 171, 233–239. [Google Scholar] [CrossRef]
  19. Xu, F.; Li, Y.; Ge, X.; Yang, L.; Li, Y. Anaerobic digestion of food waste: Challenges and opportunities. Bioresour. Technol. 2018, 247, 1047–1058. [Google Scholar] [CrossRef]
  20. HJ 643-2013; Solid Waste—Determination of Volatile Organic Compounds—Headspace-Gas Chromatography/Mass Method. Ministry of Ecology and Environment of People’s Republic of China: Beijing, China, 2013.
  21. van Soest, P. Methods for dietary fiber, neutral detergent fiber and nonstarch polysaccharides in relation to animal nutrition. J. Dairy Sci. 1991, 10, 3583–3597. [Google Scholar] [CrossRef]
  22. ISO 5664-1984; Water Quality—Determination of Ammonium—Distillation and Titration Method. ISO: Geneva, Switzerland, 1984.
  23. Xiao, L.; Zheng, S.; Lichtfouse, E.; Luo, M.; Tan, Y.; Liu, F. Carbon nanotubes accelerate acetoclastic methanogenesis: From pure cultures to anaerobic soils. Soil. Biol. Biochem. 2020, 150, 107938. [Google Scholar] [CrossRef]
  24. Farghali, M.; Mayumi, M.; Syo, K.; Satoshi, A.; Seiichi, Y.; Takashima, S.; Ono, H.; AP, Y.; Yamashiro, T.; Ahmed, M.; et al. Potential of biogas production from manure of dairy cattle fed on natural soil supplement rich in iron under batch and semi-continuous anaerobic digestion. Bioresour. Technol. 2020, 309, 123298. [Google Scholar] [CrossRef]
  25. Pang, Y.; Liu, Y.; Li, X.; Wang, K.; Yuan, H. Improving biodegradability and biogas production of corn stover through sodium hydroxide solid state pre- treatment. Energy Fuel 2008, 22, 2761–2766. [Google Scholar] [CrossRef]
  26. Xu, F.; Wang, Z.; Tang, L.; Li, Y. A mass diffusion-based interpretation of the effect of total solids content on solid-state anaerobic digestion of cellulosic biomass. Bioresour. Technol. 2014, 167, 178–185. [Google Scholar] [CrossRef] [PubMed]
  27. Greses, S.; Tomás-Pejó, E.; Gónzalez-Fernández, C. Agroindustrial waste as a resource for volatile fatty acids production via anaerobic fermentation. Bioresour. Technol. 2020, 297, 122486. [Google Scholar] [CrossRef] [PubMed]
  28. Al Mamun, M.; Torii, S. Comparison effect of feedstock to inoculum ratios on biogas yields of cafeteria, vegetable, fruit wastes with cattle manure using co-digestion process. Int. J. Green. Energy 2017, 14, 665–673. [Google Scholar] [CrossRef]
  29. Li, Y.; Li, Y.; Zhang, D.; Li, G.; Lu, J.; Li, S. Solid state anaerobic co-digestion of tomato residues with dairy manure and corn stover for biogas production. Bioresour. Technol. 2016, 217, 50–55. [Google Scholar] [CrossRef]
  30. Li, Y.; Wang, Y.; Yu, Z.; Lu, J.; Li, D.; Wang, G.; Li, Y.; Wu, Y.; Li, S.; Xu, F.; et al. Effect of inoculum and substrate/inoculum ratio on the performance and methanogenic archaeal community structure in solid state anaerobic co-digestion of tomato residues with dairy manure and corn stover. Waste Manag. 2018, 81, 117–127. [Google Scholar] [CrossRef]
  31. Chen, H.; Wu, J.; Huang, R.; Zhang, W.; He, W.; Deng, Z.; Han, Y.; Xiao, B.; Luo, H.; Qu, W. Effects of temperature and total solid content on biohydrogen production from dark fermentation of rice straw: Performance and microbial community characteristics. Chemosphere 2022, 286, 131655. [Google Scholar] [CrossRef]
  32. Liu, Z.; Lv, J. The effect of total solids concentration and temperature on biogas production by anaerobic digestion. Energy Sources Part A Recovery Util. Environ. Eff. 2016, 38, 3534–3541. [Google Scholar] [CrossRef]
  33. Liu, W.; Liao, B. Anaerobic co-digestion of vegetable and fruit market waste in LBR + CSTR two-stage process for waste reduction and biogas production. Appl. Biochem. Biotechnol. 2018, 188, 185–193. [Google Scholar] [CrossRef]
  34. Labatut, R.; Angenent, L.; Scott, N. Biochemical methane potential and biodegradability of complex organic substrates. Bioresour. Technol. 2011, 102, 2255–2264. [Google Scholar] [CrossRef]
  35. Motte, J.; Escudié, R.; Bernet, N.; Delgenes, J.; Steyer, J.; Dumas, C. Dynamic effect of total solid content, low substrate/inoculum ratio and particle size on solid-state anaerobic digestion. Bioresour. Technol. 2013, 144, 141–148. [Google Scholar] [CrossRef] [PubMed]
  36. Morales-Polo, C.; Cledera-Castro, M.d.M.; Moratilla Soria, B.Y. Biogas production from vegetable and fruit markets waste-compositional and batch characterizations. Sustainability 2019, 11, 6790. [Google Scholar] [CrossRef]
  37. Wu, B.; Lin, T.; Lu, Z.; Yu, X.; Huang, M.; Yang, R.; Wang, C.; Tian, C.; Li, J.; Sun, Y.; et al. Fe binuclear sites convert methane to acetic acid with ultrahigh selectivity. Chem 2022, 8, 1658–1672. [Google Scholar] [CrossRef]
  38. Appels, L.; Baeyens, J.; Degrève, J.; Dewil, R. Principles and potential of the anaerobic digestion of waste-activated sludge. Prog. Energy Combust. Sci. 2008, 34, 755–781. [Google Scholar] [CrossRef]
  39. Triolo, J.; Sommer, S.; Møller, H.; Weisbjerg, M.; Jiang, X. A new algorithm to characterize biodegradability of biomass during anaerobic digestion: Influence of lignin concentration on methane production potential. Bioresour. Technol. 2011, 102, 9395–9402. [Google Scholar] [CrossRef]
  40. Bouallagui, H.; Touhami, Y.; Cheikh, R.B.; Hamdi, M. Bioreactor performance in anaerobic digestion of fruit and vegetable wastes. Process Biochem. 2005, 40, 989–995. [Google Scholar] [CrossRef]
  41. Jiang, J.; Zhang, Y.; Li, K.; Wang, Q.; Gong, C.; Li, M. Volatile fatty acids production from food waste: Effects of pH, temperature, and organic loading rate. Bioresour. Technol. 2013, 143, 525–530. [Google Scholar] [CrossRef]
  42. Greses, S.; Tomás-Pejóa, E.; Gonzalez-Fernández, C. Food waste valorization into bioenergy and bioproducts through a cascade combination of bioprocesses using anaerobic open mixed cultures. J. Clean. Prod. 2022, 372, 133680. [Google Scholar] [CrossRef]
  43. Li, C.; Li, Z.; Liu, X.; Du, M.; He, D.; Fu, Q.; Pan, M.; Leu, S.; Wang, D. Cetyltrimethylammonium bromide enhances anaerobic fermentative production of short-chain fatty acids from waste activated sludge. ACS ES&T Eng. 2023, 3, 2051–2061. [Google Scholar]
  44. Feng, L.; Chen, Y.; Zheng, A. Enhancement of waste activated sludge protein conversion and volatile fatty acids accumulation during waste activated sludge anaerobic fermentation by carbohydrate substrate addition: The Effect of pH. Environ. Sci. Technol. 2009, 43, 4373–4380. [Google Scholar] [CrossRef] [PubMed]
  45. Buyukkamaci, N.; Filibeli, A. Volatile fatty acid formation in an anaerobic hybrid reactor. Process Biochem. 2004, 39, 1491–1494. [Google Scholar] [CrossRef]
  46. Lahav, O.; Morgan, B. Titration methodologies for monitoring of anaerobic digestion in developing countries: A review. J. Chem. Technol. Biotechnol. 2004, 79, 1331–1341. [Google Scholar] [CrossRef]
  47. Appels, L.; Lauwers, J.; Gins, G.; Degrève, J.; Van Impe, J.; Dewil, R. Parameter identification and modeling of the biochemical methane potential of waste activated sludge. Environ. Sci. Technol. 2011, 45, 4173–4178. [Google Scholar] [CrossRef] [PubMed]
  48. Bai, X.; Jiang, Y.; Zhi, H.; Xue, S.; Chen, Z.; Zhou, J. Intensive vegetable production results in high nitrate accumulation in deep soil profiles in China. Environ. Pollut. 2021, 287, 117598. [Google Scholar] [CrossRef]
  49. Li, Y.; Zhang, R.; Liu, X.; Chen, C.; Xiao, X.; Feng, L.; He, Y.; Liu, G. Evaluating methane production from anaerobic mono- and co-digestion of kitchen waste, corn stover, and chicken manure. Energy Fuels 2013, 27, 2085–2091. [Google Scholar] [CrossRef]
  50. Qiao, Y.; Tie, J.; Wang, X.; Wei, B.; Zhang, W.; Liu, Z.; Zhang, G.; Lyu, J.; Liao, W.; Liu, L.; et al. Comprehensive evaluation on effect of planting and breeding waste composts on the yield, nutrient utilization, and soil environment of baby cabbage. J. Environ. Manag. 2023, 341, 117941. [Google Scholar] [CrossRef]
  51. Cui, Z.; Wang, Y.; Du, L.; Yu, Y. Contamination level; sources, and health risk of polycyclic aromatic hydrocarbons in suburban vegetable field soils of Changchun, Northeast China. Sci. Rep. 2022, 12, 11301. [Google Scholar] [CrossRef]
  52. Gao, J.; Zhang, D.; Proshad, R.; Uwiringiyimana, E.; Wang, Z. Assessment of the pollution levels of potential toxic elements in urban vegetable gardens in southwest China. Sci. Rep. 2021, 11, 22824. [Google Scholar] [CrossRef]
Figure 1. Schematic diagram of experimental device: 1. incubator; 2. heater; 3. temperature control panel; 4. digester; 5. sampling pipe; 6. gas tube.
Fermentation 10 00437 g001
Figure 2. The cumulative methane production and kinetic parameters in different TS content treatments: (ac) are cumulative methane production of 6–10%, 12–18%, and 20–25%, respectively; (df) are Pmax, Rmax, and λ are parameters in modified Gompertz equation, respectively. For each parameter, significant differences between different TS contents are indicated by different lowercase letters (p  <  0.05).
Fermentation 10 00437 g002
Figure 3. Variation in acetic acid and total VFA concentrations: (ac) are acetic acid concentrations and (df) are total VFA concentrations in 6–10%, 12–18%, and 20–25% TS content treatments, respectively.
Fermentation 10 00437 g003
Figure 4. Variation in ethanol and each specific VFA concentrations: (ac) are ethanol concentrations, (df) are propionic acid concentrations, (gi) are butyric acid concentrations, and (jl) are isovaleric acid concentrations in 6–10%, 12–18%, and 20–25% TS content treatments, respectively.
Fermentation 10 00437 g004
Figure 5. Variation in pH, TAN, and VFA/ALK in the fermentation process of different TS content treatments of vegetable residues: (a,d,g) are pH, TAN, and VFA/ALK of 6–10% TS content treatments, respectively; (b,e,h) are pH, TAN, and VFA/ALK of 12–18% TS content treatments, respectively; (c,f,i) are pH, TAN, and VFA/ALK of 12–18% TS content treatments, respectively.
Fermentation 10 00437 g005
Table 1. Physicochemical properties of feedstock for anaerobic fermentation.
ParametersVegetable ResiduesInoculum
TS (%)16.1 ± 0.342.7 ± 0.3
VS (%)10.9 ± 0.310.8 ± 0.3
TC (%)41.3 ± 1.224.4 ± 0.3
TN (%)2.1 ± 0.11.9 ± 0.0
pH6.5 ± 0.17.9 ± 0.1
C/N Ratio19.7 ± 0.513.2 ± 0.5
Cellulose (%)28.3 ± 1.412.5 ± 1.6
Hemicellulose (%)26.4 ± 0.52.0 ± 0.3
Lignin (%)11.4 ± 1.37.8 ± 1.0
Notes: TS: total solid; VS: volatile solid; TC: total carbon; TN: total nitrogen; C/N Ratio: carbon-to-nitrogen ratio.
Table 2. Proportion of vegetable residues and inoculum for anaerobic fermentation.
TreatmentVegetable Residues (g)Inoculum (g)Water (g)TS Content (%)
Wet-AF6%29517515306
8%39523513708
10%495294121110
Semi-AF12%570339109112
15%74044082015
18%89052958118
Dry-AF20%98558543020
22%108564527022
25%12357343125
Note: Wet-AF: wet state anaerobic fermentation; Semi-AF: semi-dry state anaerobic fermentation; Dry-AF: dry state anaerobic fermentation; vegetable residues and inoculum were both valued in grams with wet materials.
Disclaimer/Publisher’s Note: The statements, opinions and data contained in all publications are solely those of the individual author(s) and contributor(s) and not of MDPI and/or the editor(s). MDPI and/or the editor(s) disclaim responsibility for any injury to people or property resulting from any ideas, methods, instructions or products referred to in the content.

