Article

Statistical Optimization and Purification of Cellulase Enzyme Production from Trichosporon insectorum

1
Laboratory of Biotechnology, Environment, Agrifood and Health, Faculty of Sciences Dhar El Mahraz, Sidi Mohamed Ben Abdellah University, P.O. Box 1796, Fez-Atlas 30003, Morocco
2
National Agency of Medicinal and Aromatic Plants, Taounate 34000, Morocco
3
Laboratory of Ecology and Environment, Faculty of Sciences & Techniques Saiss, Sidi Mohamed Ben Abdellah University, P.O. Box 1796, Fez 30000, Morocco
4
Department of Biotechnology, Faculty of Science, University of Sargodha, Sargodha 40100, Pakistan
5
Institute of Biomolecular Chemistry, Consiglio Nazionale delle Ricerche, Via Campi Flegrei 34, 80078 Pozzuoli, Italy
6
Ministry of Health and Social Protection, Higher Institute of Nursing Professions and Health Techniques, Marrakech 40000, Morocco
7
Department of Pharmacognosy, College of Pharmacy, King Saud University, Riyadh 11451, Saudi Arabia
*
Author to whom correspondence should be addressed.
Fermentation 2024, 10(9), 453; https://doi.org/10.3390/fermentation10090453
Submission received: 27 June 2024 / Revised: 23 August 2024 / Accepted: 28 August 2024 / Published: 1 September 2024
(This article belongs to the Section Industrial Fermentation)

Abstract

:
Enzymatic degradation of cellulosic biomass represents the most sustainable and environmentally friendly method for producing liquid biofuel, widely utilized in various commercial processes. While cellulases are predominantly produced by bacteria and fungi, the enzymatic potential of cellulase-producing yeasts remains significantly less explored. In this study, the yeast strain Trichosporon insectorum, isolated from the gut of the coprophagous beetle Gymnopleurus sturmii, was utilized for cellulase production in submerged fermentation. A central composite design was employed to optimize cellulase production, with substrate concentration, temperature, and pH as dependent variables. The highest CMCase activity of 0.71 IU/mL was obtained at 1% substrate concentration, pH 5, and an incubation temperature of 40 °C for 72 h of fermentation using cellulose as a carbon source. For FPase production, the high value was 0.23 IU/mL at 0.5% CMC, pH 6, and an incubation temperature of 40 °C for 72 h. After purification, the enzymes produced by T. insectorum represent 39% of the total proteins. The results of this study offer an alternative strategy for utilizing various carbon sources, both soluble (CMC, carboxymethylcellulose) and insoluble (cellulose), to efficiently produce cellulase for the degradation of lignocellulosic materials. This approach holds promising benefits for sustainable waste management.

1. Introduction

Enzymes are proteins that catalyze a chemical or biological reaction [1,2] that are omnipresent in animals, plants, and different microorganisms [3]. Cellulase enzymes break down cellulose molecules into oligosaccharides and beta-glucose [2]. Given that cellulose is a major component of plants [4], its degradation has significant economic implications [5,6]. Due to the strong bonds that bind cellulose molecules, cellulose is comparatively more difficult to break down than other polysaccharides such as starch [7]. Several groups of cellulases vary both mechanically and structurally [3]. Cellulases are complex enzymes comprising endoglucanases (EC 3.2.1.4), cellobiohydrolases (EC 3.2.1.91), and β-glucosidases (EC 3.2.1.21), which act to produce glucose by hydrolysis of cellulose [8,9,10,11]. They catalyze the hydrolysis of β-1,4 bonds in cellulose chains [12,13]. Cellulase production has been observed in many strains of yeasts [14,15,16], like Trichosporon pullulans, Trichosporon cutaneum [17], Cryptococcus sp. S-2 [18], Aureobasidium pullulans 98 [19], Cystobasidium oligophagum [20], and Trichosporon laibachii [21]. For cellulolytic enzyme production, different substrates can be used [4], including agricultural waste [22] and agro-industrial waste [23], such as wheat bran, bagasse, sugar cane, rice straw, wheat straw, and wheatears [24,25]. The cellulases produced by these fermentation technologies are widely used in various industries [26,27], such as textiles, pulp and paper, and bioenergy production. Optimizing nutritional and environmental parameters is crucial for enhancing cellulase production in fermentation systems. Two approaches are commonly used for this optimization: the one-factor-at-a-time (OFAT) method and response surface methodologies (RSM). While OFAT is time-consuming and less precise, RSM is widely favored due to its numerous advantages [28]. The main objectives of this study were (1) to investigate the effects of various influencing factors on the production of carboxymethyl cellulase (CMCase) and filter paper cellulase (FPase), and (2) to utilize response surface methodology (RSM) with CMC substrates and cellulose fiber to optimize production parameters.

2. Materials and Methods

2.1. Microorganism and Cultural Conditions

The cellulolytic yeast Trichosporon insectorum isolated from the gut of the coprophage, Gymnopleurus sturmii [29] was used to optimize the culture medium. The yeast was cultivated with the optimal conditions at initial cell concentration (1%; OD at 600 nm = 1 corresponds to 4.11 1013 CFU/mL), peptone (10 g/L), yeast extract (10 g/L), and ammonium sulfate (1.4 g/L).
The experimental research plan was organized according to a factorial plan composed of three factors: incubation temperature (33, 36.5, and 40 °C), the concentration of CMC (carboxymethylcellulose) or FC (fiber cellulose) as carbon source (0.1, 0.5, and 1%), and the initial pH of the medium (4.5 and 6). The plan was generated with fifteen experiments for CMC or FC as the carbon source in the culture medium. The supernatant was analyzed for the enzymatic activities (CMCase and FPase) and the protein concentration [30].

2.2. Measurement of Cellulase Activities

For CMCase activity, 0.5 mL of a 5% (w/v) CMC substrate solution in 0.1 M sodium acetate buffer (pH 5) was preincubated for 10 min at 55 °C. Then, 0.5 mL of the enzymatic medium was added, and the reaction mixture was incubated at 55 °C for an additional 10 min.
For FPase activity, 80 mg of filter paper Whatman No. 1 (1 × 6 cm pieces) was added to 1 mL of acetate buffer (0.1 M, pH 5), and the mixture was preincubated at 55 °C for 30 min. Then, 0.5 mL of the enzymatic medium was added. The reaction mixture was incubated at 55 °C for 15 min.
The DNS method measures the amount of glucose released into the reaction mixture [31]. The values presented are the mean of three replicates (±SE) obtained from three independent experiments.

2.3. Experimental Design

To optimize process conditions for cellulase production, a Box–Behnken Design (BBD) was employed. The independent variables were the concentration of the carbon source (X1), incubation temperature (X2), and initial pH of the medium (X3), with their levels detailed in Table 1. Each variable’s low and high levels were coded as −1 and 1, respectively, with the midpoint coded as 0.
This design is most suitable for quadratic response surfaces and generates a second-order polynomial regression model. The response was calculated using STATISTICA ‘99 software [32].

2.4. Statistical Analyzes

The data obtained were statistically evaluated using the analysis of variance (ANOVA) at a level of significance p < 0.05 using the computer-based program SPSS (V29.0).

2.5. Enzyme Purification

2.5.1. Partial Purification of Enzymes

The resulting enzyme’s medium was centrifuged at 10,000 rpm for 15 min at 4 °C. After reaching maximum clarity, ammonium sulfate was added to the supernatant until 80% saturation, and the mixture was maintained at 4 °C for 18 h for protein precipitation. After centrifugation at 10,000 rpm for 15 min, the pellet of the precipitated proteins was dissolved in a small volume of 0.1 M acetate buffer (pH 5). The protein suspension was placed in a dialysis tube [28] and then dialyzed against 0.05M acetate buffer (pH 5) with water changes every 4 h for 20 h.

2.5.2. Enzyme Purification by Gel Filtration Chromatography

The partially purified enzyme extract was subjected to an additional purification by Sephadex S-300 Hr (Aldrich, Markham, ON, Canada). Ben gel filtration using a 190 mL column. The extract was poured over the filtration gel and eluted with 0.1 M acetate buffer, pH 5.4. The elution flow was maintained at 0.4 mL/min. A total of 100 fractions were collected, each with a volume of 2.3 mL.

2.5.3. Thin Layer Chromatography

The content of each fraction was revealed by thin-layer chromatography. The stationary phase was represented by a plate of TLC silica gel 60 F 254, on which a spot of each fraction was deposited and numbered. The polysaccharides were revealed by α-naphthol and the proteins by ninhydrin.

2.5.4. Determination of the Activities of Partially and Purified Enzymes

After dialysis, the total proteins were collected to determine the enzymatic activities of CMCase, Xylanase, ß-glucosidase, and ß-xylosidase.
CMCase activity: CMCase activity was measured as described above in Section 2.2.
Xylanase activity: An amount of 2 mL of enzymatic medium A or B was added to 1 mL of Xylan substrate (from birchwood) 50 mg/mL, dissolved in 0.1 M acetate buffer pH 5.4. The reaction mixture was incubated at 55 °C. After 0.5 or 10 min, 0.3 mL of the solution was withdrawn to assay the quantity of xylose released. To this solution, 0.2 mL of water and 0.5 mL of DNS were added. The new mixture was placed in a water bath at 100 °C for 5 min, and then 0.5 mL of water was added. The absorbance was measured at 540 nm, and the concentration of xylose released was determined from a standard range of xylose using a stock solution of 0.05 mg/mL.
β-glucosidase activity: An amount of 0.6 mL of enzymatic medium A and B was added to 0.3 mL of PNPG substrate (5 mM), previously prepared in 0.1 M acetate buffer pH 5.4. The reaction mixture was incubated at 55 °C after 0, 5 or 20 min. 0.3 mL of the solution was taken to assay the amount of PNP released after adding 0.6 mL of sodium carbonate (1M). The absorbance was measured at 540 nm, and the concentration of PNP was determined from a standard range of PNP concentrations ranging from 0 to 0.25 mM.
β-xylosidase activity: An amount of 0.6 mL of enzymatic medium A or B was added to 0.3 mL of the PNPX substrate (5 mM), previously prepared in 0.1 M acetate buffer pH 5.4. The reaction mixture was incubated at 55 °C after 0.5 or 20 min. Then, 0.3 mL of the solution was taken to assay the amount of PNP after adding 0.6 mL of sodium carbonate (1 M). The absorbance was measured at 405 nm, and the concentration of PNP was determined from a standard range of PNP concentrations ranging from 0 to 0.25 mM.

2.5.5. Determination of Protein Concentration

The protein concentration of partially purified extracts was carried out according to Bradford’s method [33].

3. Results and Discussion

3.1. Experimental Responses

3.1.1. Production of CMCase

The results in Table 2 indicate that the maximum CMCase production was 0.6 IU/mL when the culture medium was supplemented with 0.5% CMC, at pH 4, 40 °C, and a cultivation period of 72 h. In contrast, using a culture medium with 1% FC as the carbon source, at pH 5, 40 °C, and a cultivation period of 72 h, the maximum CMCase production achieved was 0.71 IU/mL.
The CMCase activity was calculated using polynomial regression Equations (1) and (2), where Y is the yield of CMCase activity (IU), whereas X1, X2, and X3 represent the concentration of the carbon source, incubation temperature, and initial pH of the medium, respectively.
Y (CMCase activity, IU) = 19.23793 + 0.18948 (pH) − 1.07947(T °C) + 0.94238([CMC]) + 0.03375(pH)2 + 0.01582 (T °C)2 − 0.07153 ([CMC])2 − 0.01357 (pH * T °C) − 0.13405 (pH * ([CMC])−0.00500 (T °C * [CMC])
Y (CMCase activity, IU) = 17.74416 + 0.13667 (pH) − 0.9701 (T °C) − 1.34260 ([FC]) − 0.02000 (pH)2 + 0.01286 (T °C)2 + 0.07708 ([FC])2 + 0.00357 (pH * T
°C) − 0.13957 (pH * [FC]) + 0.05609 (T °C * [FC])

3.1.2. Production of FPase

The results in Table 3 show that the maximum production of FPase was 0.23 IU/mL in a medium with CMC (0.5%) at pH 6 and 40 °C for a cultivation period of 72 h. With FC (0.5%), the maximum production of FPase was 0.21 IU/mL at pH 6 and 40 °C for 72 h of cultivation period.
The FPase activity was calculated using polynomial regression Equations (3) and (4):
Y (FPase activity, IU) = 8.766967 − 0.172682 (pH) − 0.457437 (T °C) + 0.049119 ([CMC]) − 0.021250 (pH)2 + 0.005612 (T °C)2 − 0.006250 ([CMC])2 + 0.010714 (pH * T °C) + 0.003067(pH * [CMC]) − 0.001578 (T °C * [CMC])
Y (FPase activity, IU) = 9.382777 − 0.289943 (pH) − 0.480131(T °C) + 0.320803 ([FC]) − 0.018750 (pH)2 + 0.006429 (T °C)2 + 0.059028 ([FC])2 + 0.003571 (pH * T °C) − 0.036503 (pH * [FC]) − 0.005872 (T °C * [FC])

3.2. Statistical Study

3.2.1. Production of CMCase

The results were analyzed by ANOVA and shown in Table 4 and Table 5. p values are used as statistical indicators to evaluate the important parameters of the model. The model used in this study was significant, having a Fisher’s test value of 7.984293 in the CMC medium. In this study, some parameters were significant, whereas others were insignificant for CMC or FC medium cellulase production. Based on our results, temperature is the only factor that significantly affects the production of CMCase. The other factors, namely, carbon source concentration ([CS]) and pH of the medium, have no significant effect on the enzyme activity studied. The quadratic effect of T° has a p-value < 0.05, whatever the carbon source used. According to the analysis of variance, the values of P obtained for the interactions of the type pH * T°, pH * [CS], and T °C * [CS] are, respectively, 0.117, 0.061, and 0.766 (>0.05) in the presence of CMC (Table 4), or 0.766, 0.175 and 0.077 (>0.05) in the presence of FC (Table 5).
The adjusted R² and R² values with CMC as the carbon source were 93.49% and 81.78%, respectively. In contrast, with FC as the carbon source, the adjusted R² and R² values were 85.07% and 58.19%, respectively (Table 6).

3.2.2. Production of FPase

According to the ANOVA results (Table 7 and Table 8), the temperature factor (T °C) significantly affects FPase production in the presence of either CMC or FC in the cultivation medium. The other factors, including [SC] and pH, do not have a significant impact on the enzyme activity. For the medium with CMC, the quadratic effects of pH and T °C are significant, with p-values of 0.027 and 0.0001, respectively (p < 0.05) (Table 7). In the FC medium, only T °C has a significant effect, with a P-value of 0.002 (Table 8). The analysis of variance also shows that the interaction between pH and T °C is significant with a p-value of 0.002 (p < 0.05) (Table 8). For the FC medium, the P-values for the interactions pHT °C, pH[CS], and T °C * [CS] are 0.388, 0.269, and 0.514, respectively (>0.05), indicating no significant effect.
The adjusted R2 and R2 values in the presence of the CMC carbon source were 97.01% and 91.79%, respectively, while in the presence of FC, they were 88.88% and 68.88%, respectively (Table 9).

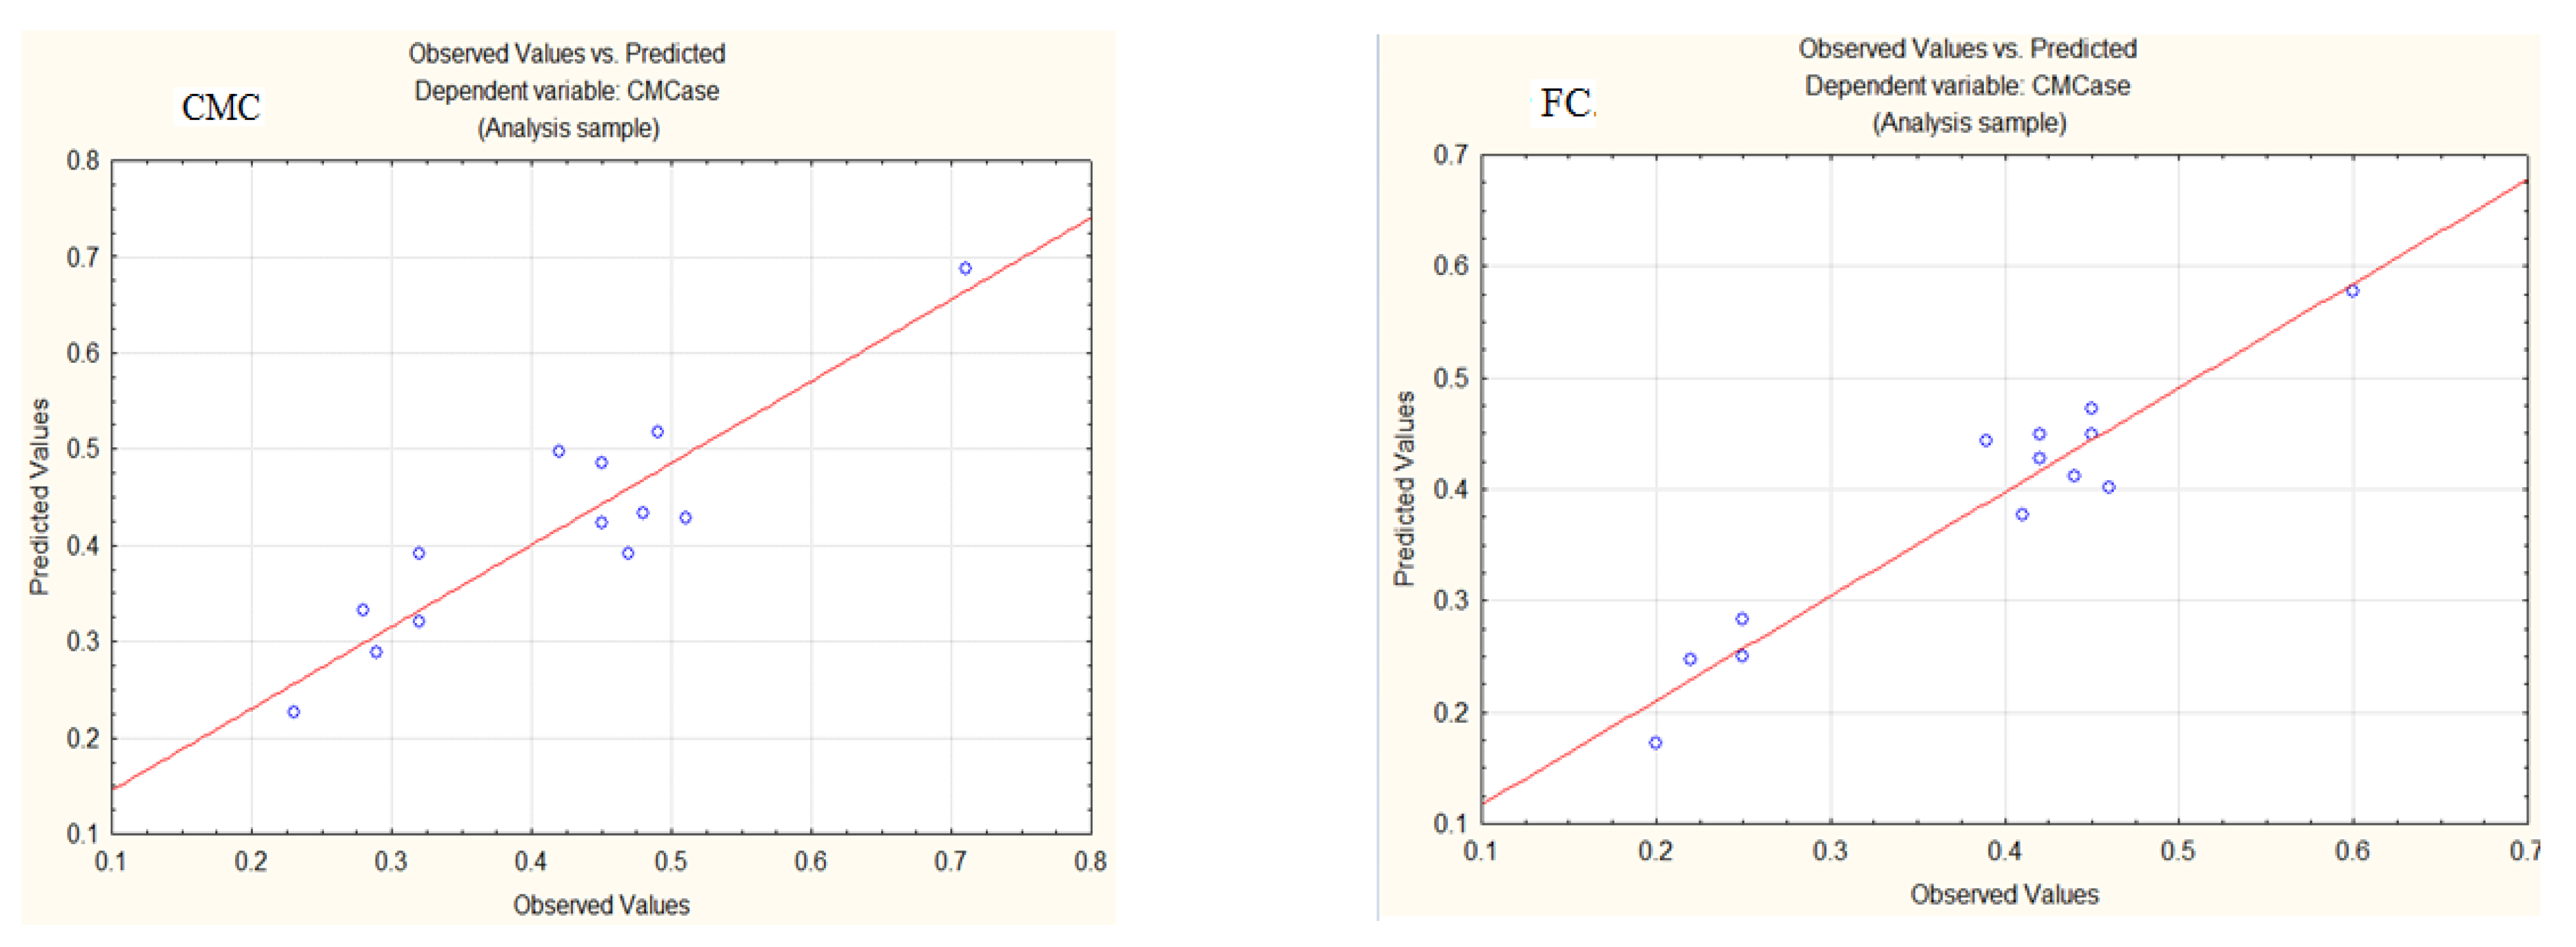
3.3. Model Validation

3.3.1. Production of CMCase

Figure 1 demonstrates that the data points are distributed around the regression line for both CMC and FC. This distribution suggests that the model is of sufficient quality, with a 93.49% likelihood (for CMC) and an 85.07% likelihood (for FC) of effectively explaining the observed variations in the response. The model adequately captures the studied phenomenon.

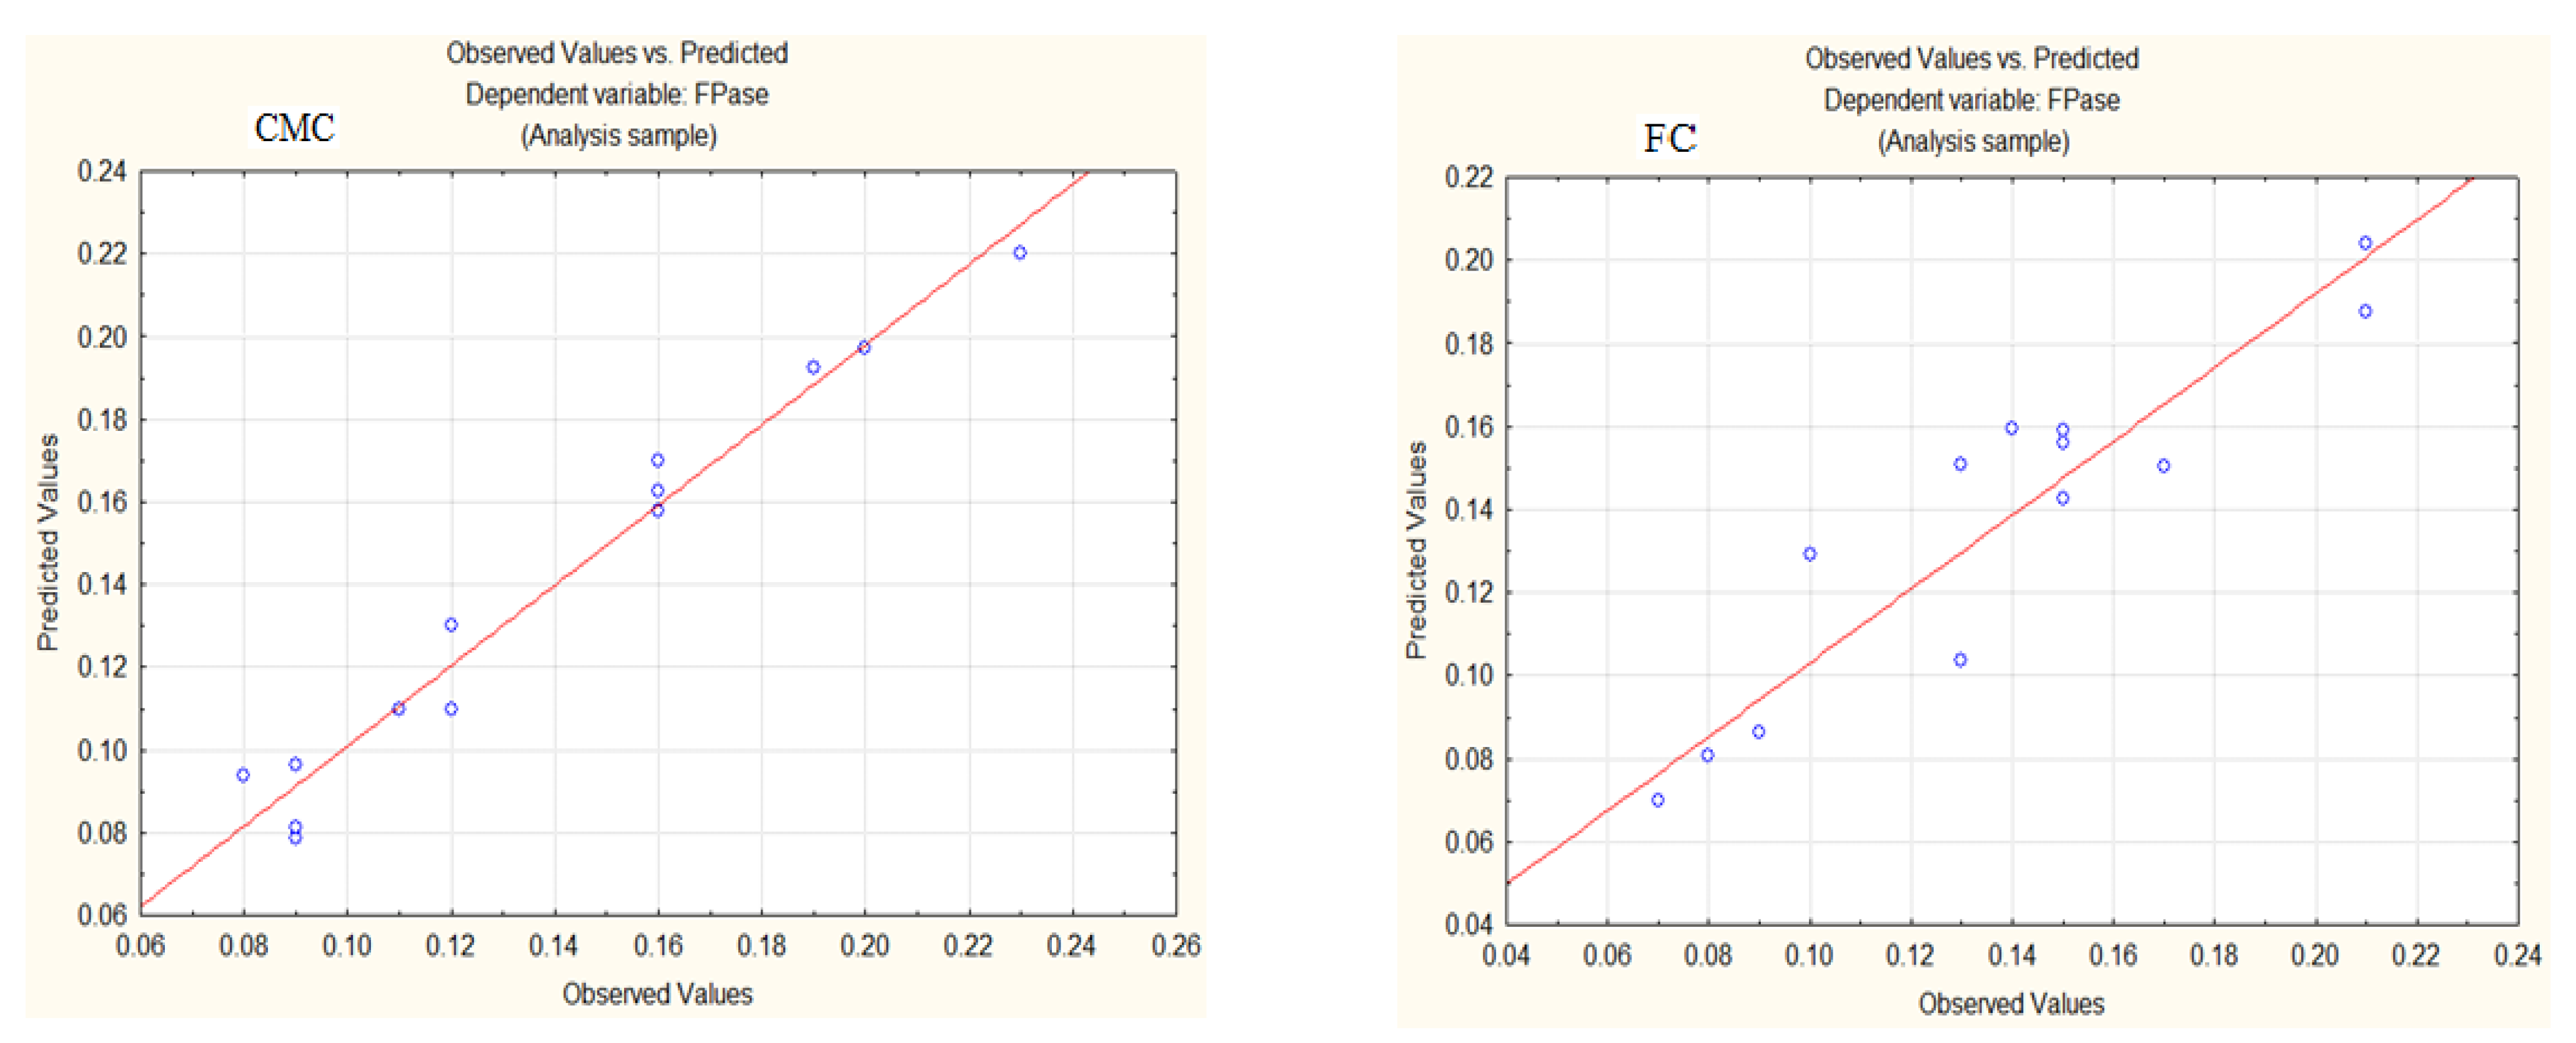
3.3.2. Production of FPase

Figure 2 shows that the data points are distributed around the regression line for both CMC and FC. This indicates that the model is of sufficient quality, with a 97.01% likelihood (for CMC) and an 88.88% likelihood (for FC) of effectively explaining the observed variations in the response. The model effectively captures the phenomenon.

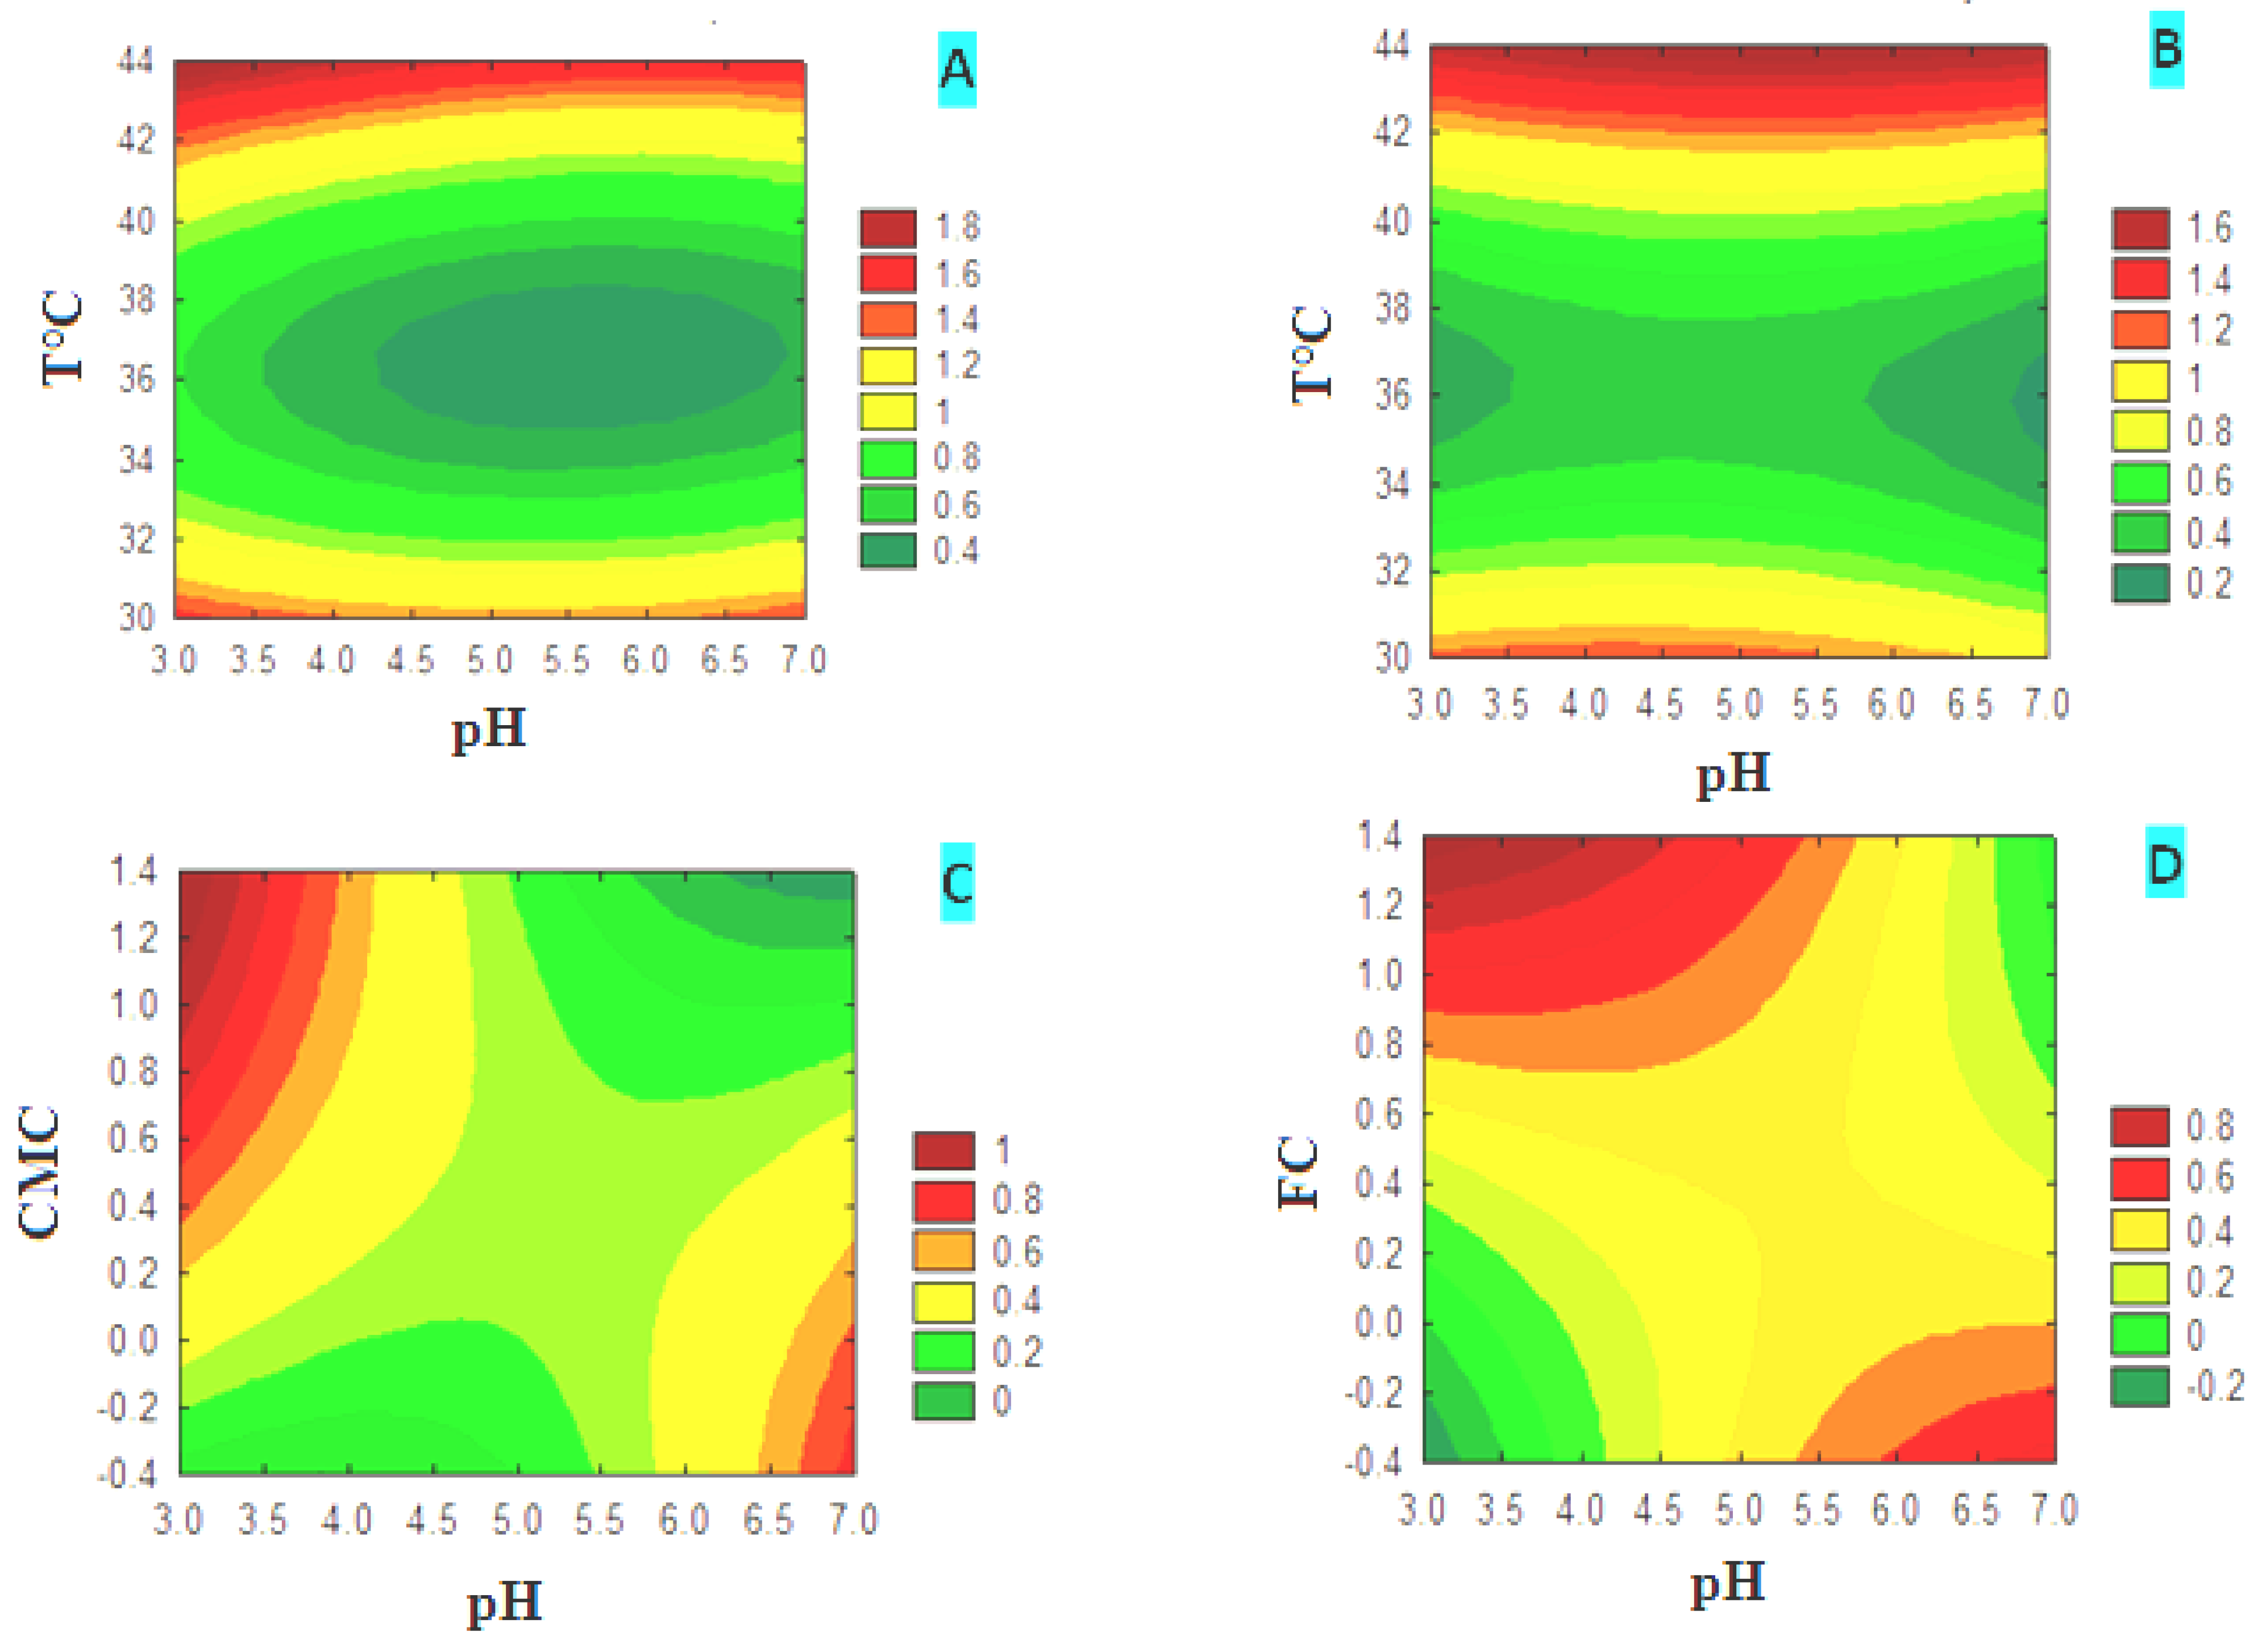
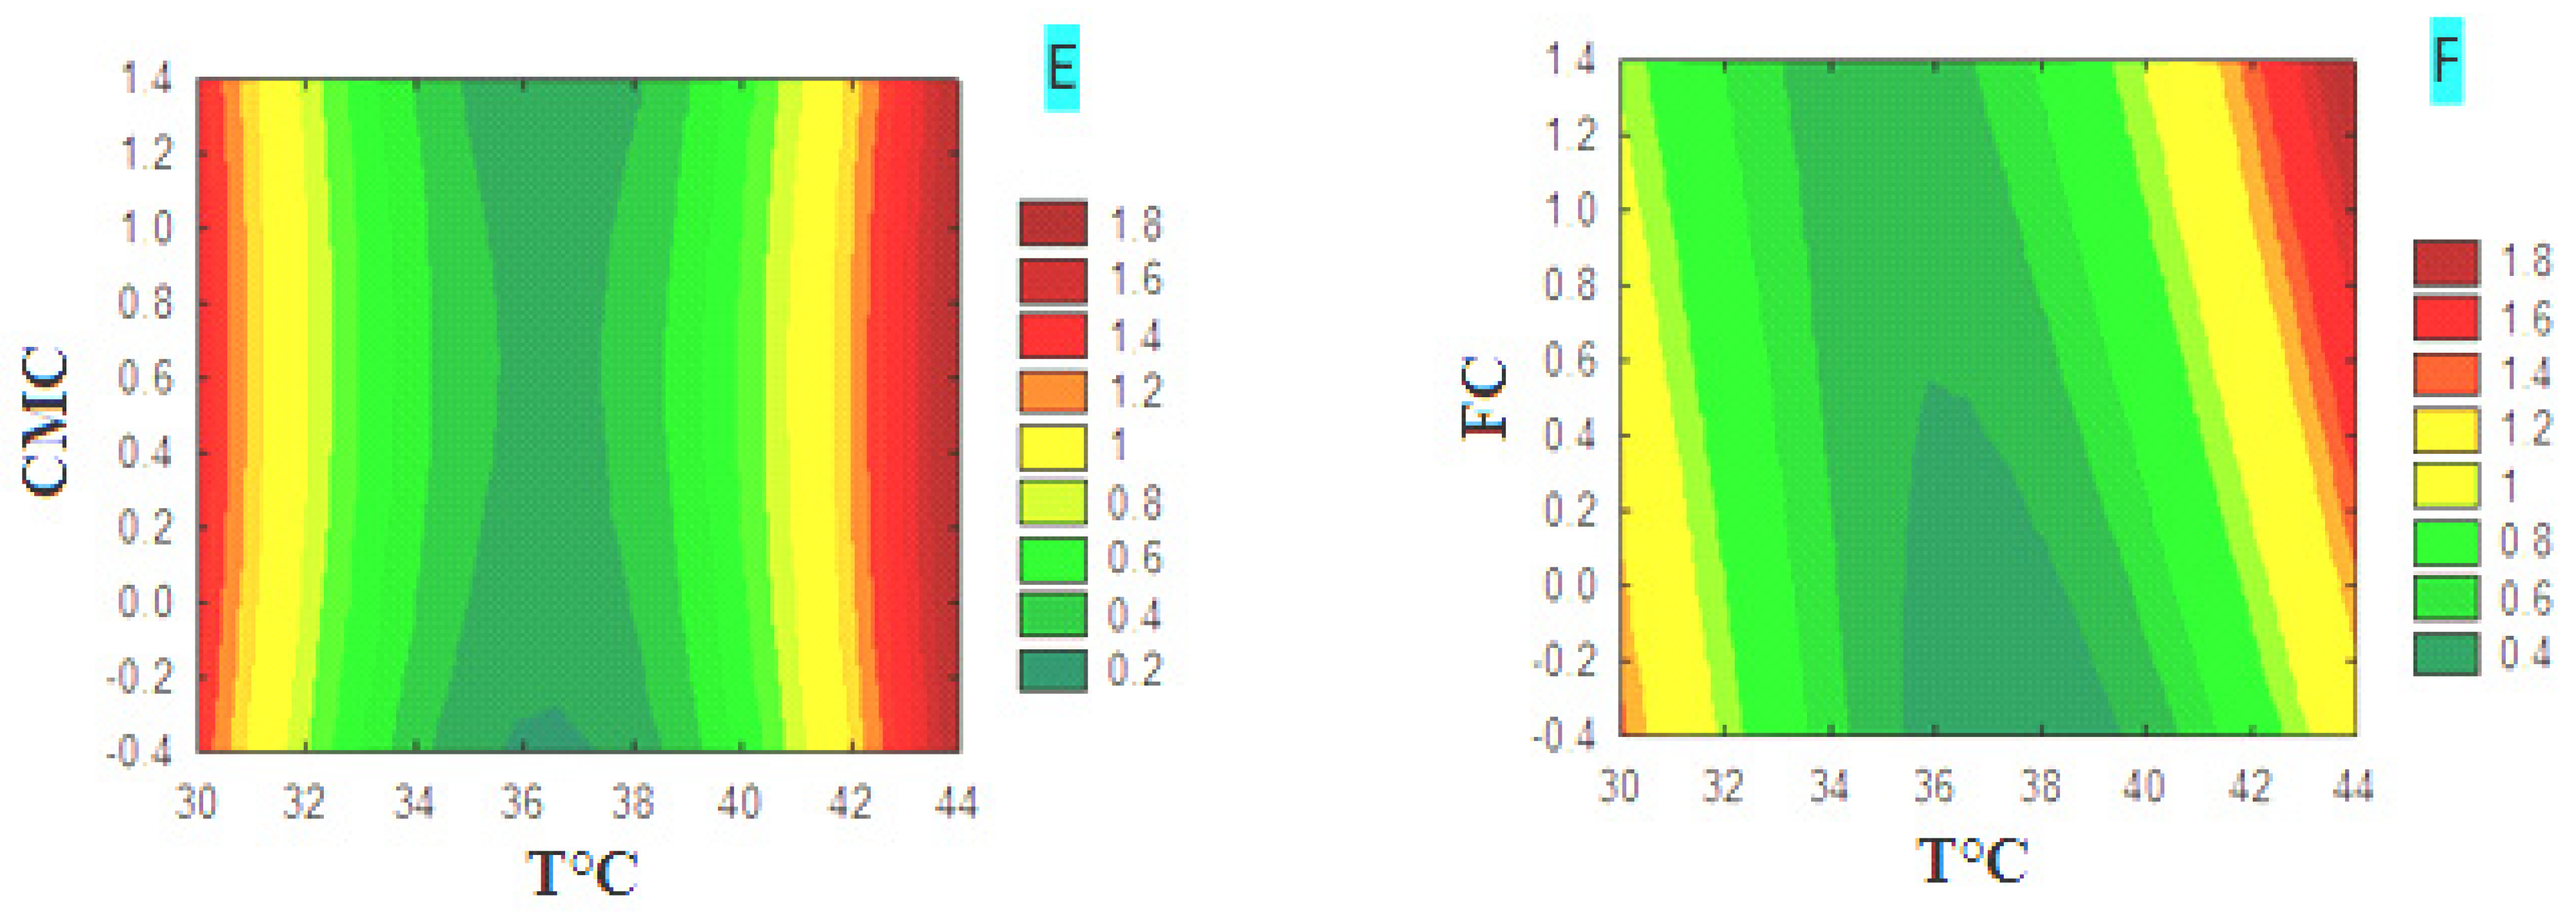
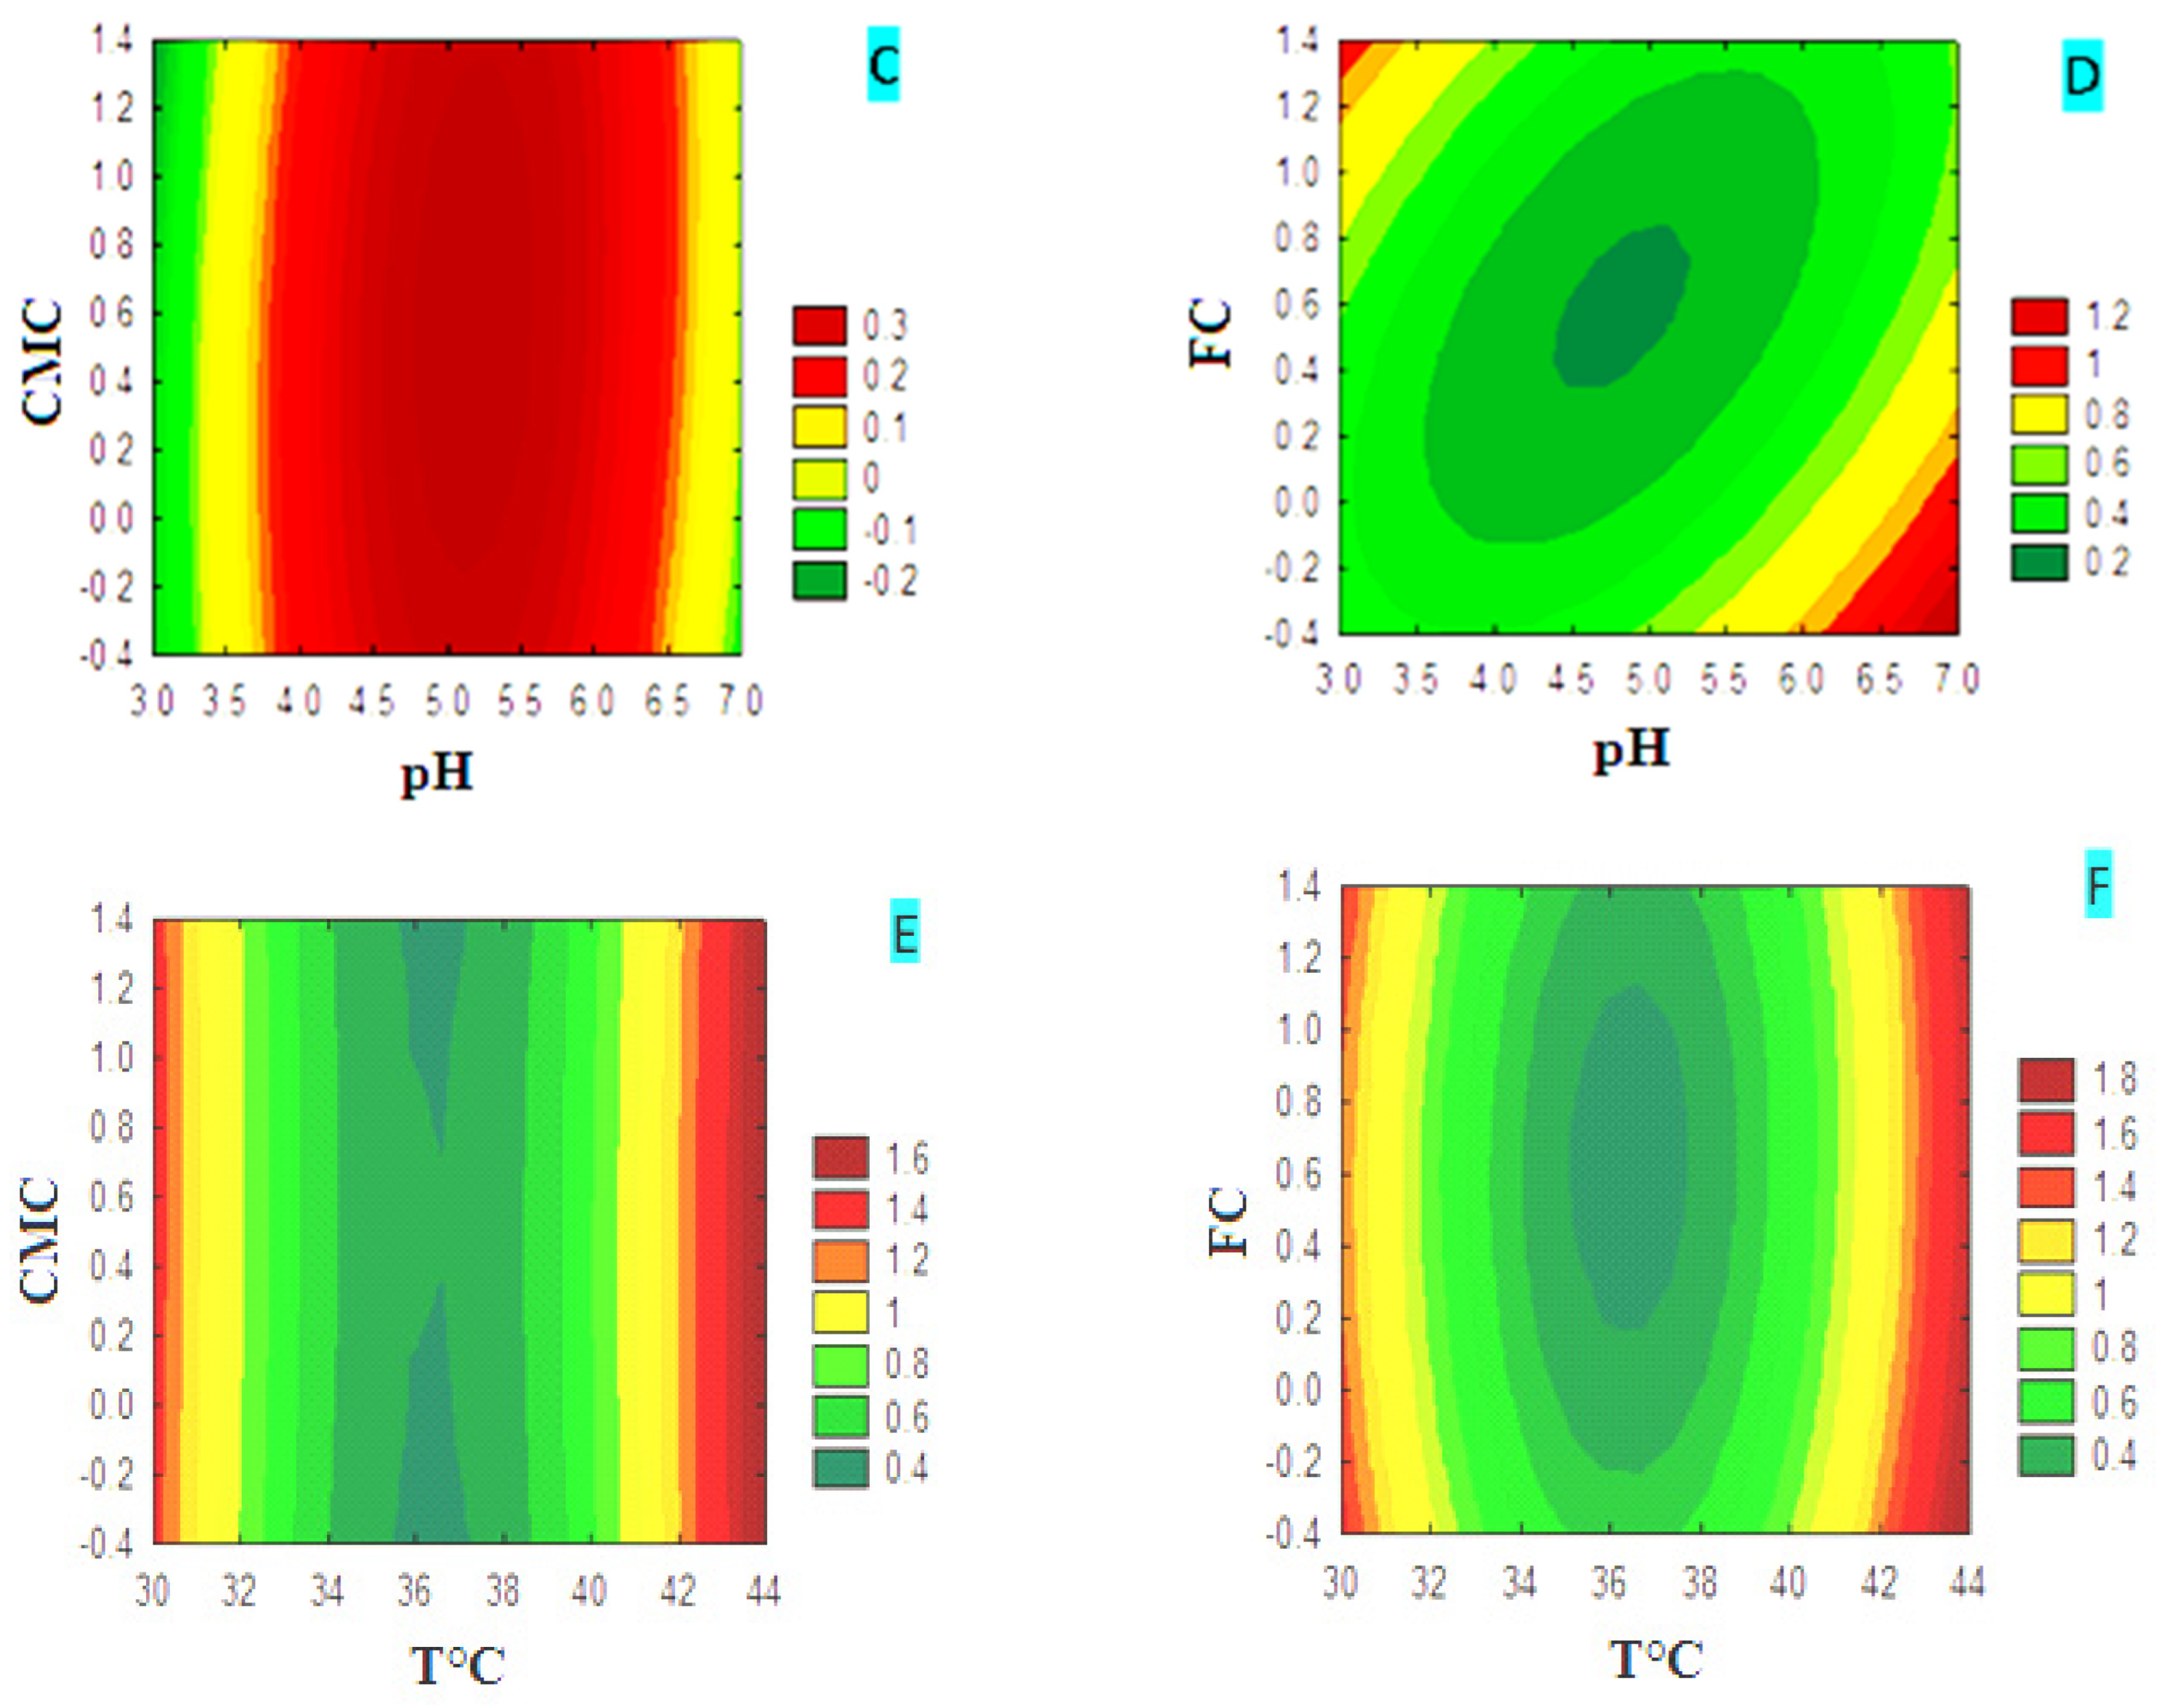
3.4. Optimization of Cellulase Production

The final step is to find the optimal answer for each factor. From the validated mathematical model and using the STATISTICA ‘99 software, the 2D contours were graphically produced by the combination of the three induced factors. Each time, we chose one of the factors to be fixed at the optimal level. The other two factors studied are represented on the X and Y axes. The response value is represented by a shaded region in the 2D contour curve. These graphs make it possible to search for more desirable optimal solutions with the best possible precision.

3.4.1. CMCase Contour Diagrams

The plot of the different response surface variables for CMCase production is shown as a contour plot (Figure 3). Contour plots (A) and (B) show that CMCase production is highly temperature-dependent for both carbon sources, CMC and FC, while pH shows a minor effect. The production of CMCase increased from 39 °C to reach a maximum value, indicated by the dark red zone, which is of the order of 1.6. The latter remains constant, at 44 °C, despite the variation of the pH margin in the medium based on CMC or FC. The study of the interaction of the pH and the concentration of the carbon source on the production of CMCase showed that it is strongly affected by both factors. In the CMC medium (graph C), the production increased from a concentration of 1% CMC and a minimum pH value between 3 and 3.5. In the FC medium (graph D), production increases from a concentration of 0.8% FC and at pH values between 3 and 5. The combination of the concentration of the carbon source, CMC (graph E) or FC (graph F), with the incubation temperature showed that the production of CMCase is temperature-dependent for both carbon sources. The production of CMCase increased from 44 °C and reached a maximum value of 1.8, indicated by the dark red zone. The results indicate a greater interactive effect in the combination of pH and concentration of the carbon source. In contrast, the other combinations have less significant effects on the production of CMCase, and they act independently.

3.4.2. FPase Contour Diagrams

The plot of the different response surface variables for FPase production is shown as contour plots (Figure 4). Contour plots (A and B) show that FPase production depended on incubation temperature regardless of carbon source, while pH exhibited less effect. The production of FPase increased from 42 °C to reach a maximum value indicated by the dark red zone, which is around 1.8 at 44 °C. This value remained constant between pH 3 and 7 for the FC medium and between pH 4 and 7 for the medium supplemented with CMC. The combination of the pH and the carbon source concentration showed that the production of FPase is strongly affected by the pH in the medium supplemented with CMC (graph C). The maximum production was obtained between pH 3.5 and 6.5; the optimum value indicated by the dark red zone was around 0.3. This value remained constant regardless of the concentration of CMC used. In the medium supplemented with FC (graph D), the production of FPase was affected by the two factors, with a greater effect of pH. Production increased from pH 5.5 and then reached a value of 1.2 IU at pH 6.5. The combination of the concentration of the carbon source with the temperature in the CMC medium (graph E) and the FC medium (graph F) showed that the production of FPase depended on the temperature of the two carbon sources. The production of FPase increased from 42 to 44 °C, reaching a maximum value of 1.6 IU in the CMC medium and 1.8 IU in the FC medium. These results show that temperature and pH have the most important interactive effect, while the other parameters combined were less so for the production of FPase; therefore, they act independently.

3.5. Purification of the Enzymes Produced

3.5.1. Ammonium Sulfate Protein Precipitation

After culturing the T. insectorum, the supernatant or enzymatic medium was recovered, and then the proteins were precipitated with 80% ammonium sulfate. The specific activities of the different enzymes studied are shown in Table 10. The specific CMCase activity was 1.876 U/mg. The specific xylanase, ß-glucosidase, and ß-xylosidase activities were 3.365 U/mg, 0.430 U/mg, and 0.013 U/mg, respectively (Table 10).

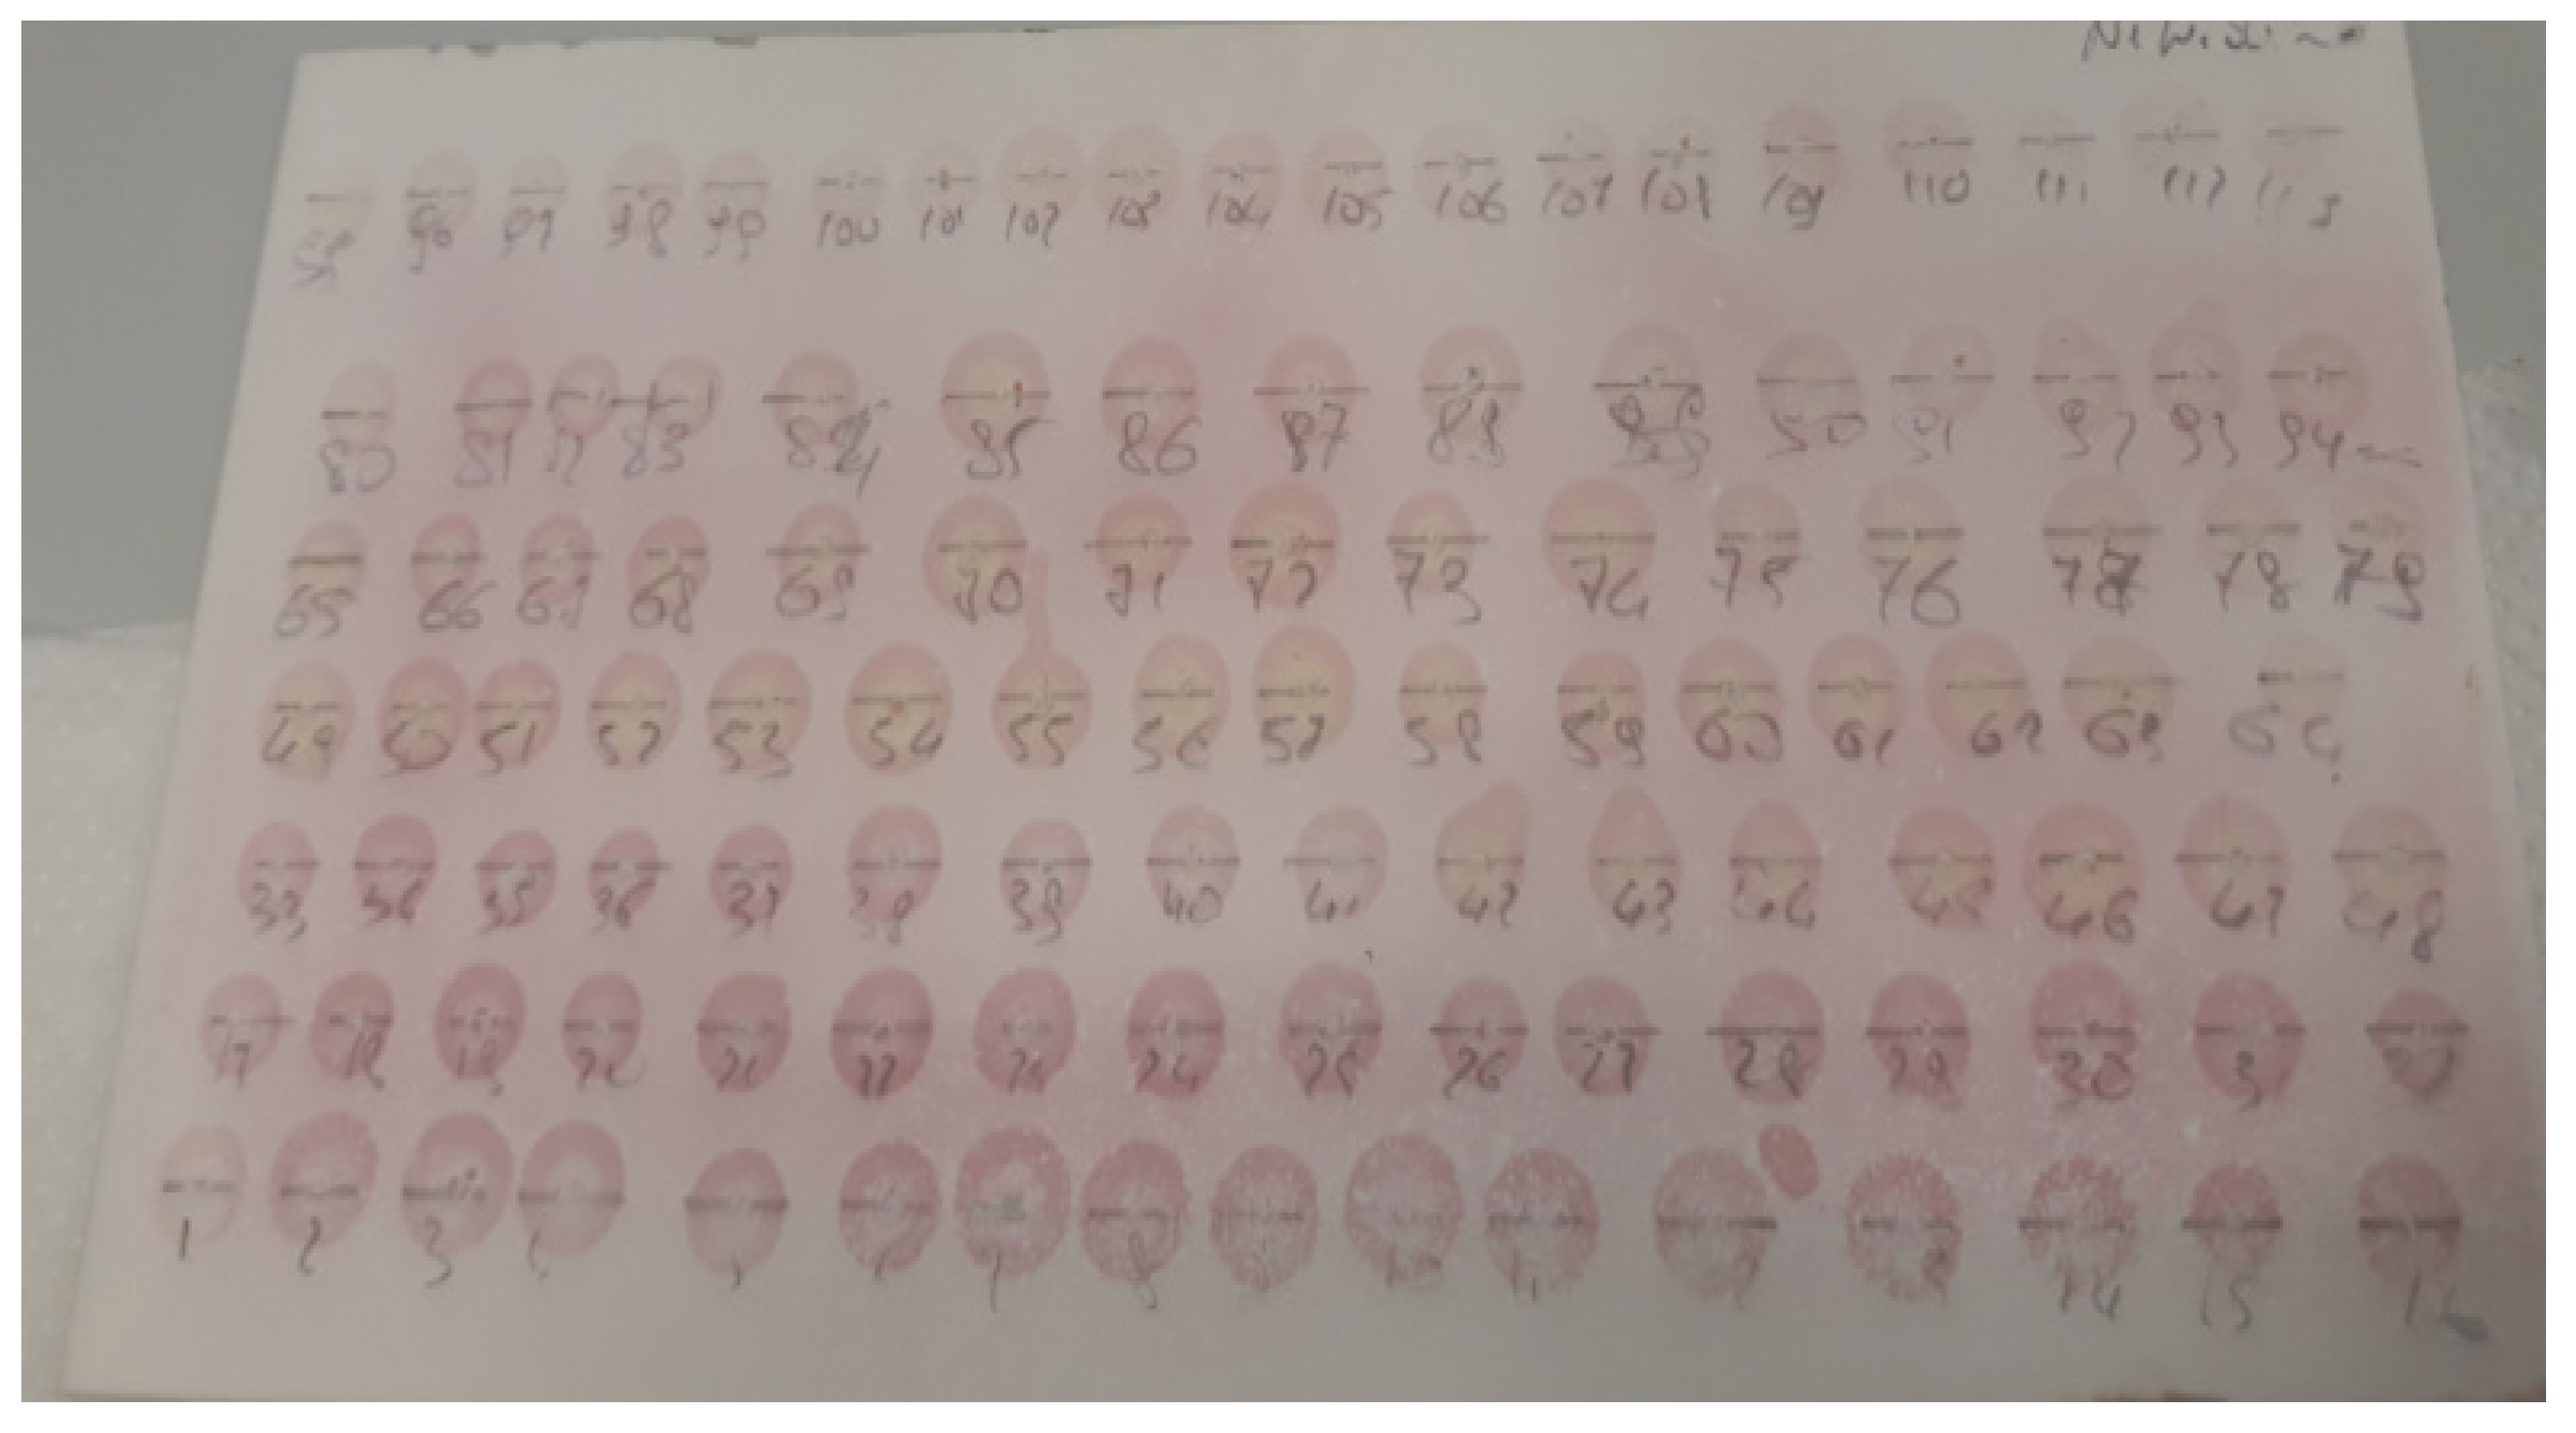
3.5.2. Fractionation by Molecular Exclusion Chromatography

Molecular exclusion chromatography carries out the fraction of proteins from the dialyzed extract.

Protein density of eluted fractions

A total of 118 fractions are recovered from 25 mL of enzymatic medium. Figure 5 shows the absorbance at 280 nm relative to each purified fraction. The protein concentration remained low between fractions 1 and 13 (OD ≤ 0.033). From fraction 14 (OD = 0.203), the protein concentration increased until it reached a maximum value of 0.69 for fraction 36. From fraction 81 (OD = 0.566), there was a decrease in protein concentration in subsequent fractions.

Analysis of eluted fractions

The analysis of the purified fractions was carried out by thin-layer chromatography. The revelation of polysaccharides (residual CMC) and proteins in different fractions was carried out by the α-naphthol test for the former and the ninhydrin test for the latter. A positive reaction to α-naphthol is manifested by the appearance of a spot of blue color, revealing the presence of a polysaccharide in the fraction tested (Figure 6). The density of the color is proportional to the quantity of Residual CMC. A positive reaction to ninhydrin is manifested by the appearance of a spot of pink coloration, revealing the presence of proteins in the fraction tested (Figure 7). The density of the pink coloration is proportional to the number of proteins. Following the above results, we gathered the fractions obtained in the four collections. Collection 1 gathers the fractions from 1 to 14; they reacted positively with ninhydrin and negatively with α-naphthol. Collection 1 is, therefore, protein-dominant. Collection 2 gathers fractions from 15 to 41, which are rich in proteins. Fractions 42 to 90 are positive for both tests, ninhydrin, and α-naphthol; they are collected in collection 3 and contain proteins with the residual CMC. Fractions 90 to 117 reacted weakly with ninhydrin and α-naphthol. These fractions are gathered in collection 4.

3.5.3. Determination of the Enzymatic Activities of the Collected Fractions

The protein concentration of each of the four collections was determined. Table 11 shows that the protein concentrations were 0.216, 0.199, 0.092, and 0.008 mg/mL in collections 3, 4, 2, and 1, respectively. We noted that the protein concentration in the enzymatic medium before purification was 0.28 mg /mL. The protein loss in the samples is probably caused by the excessive amount of high-viscosity CMC in the enzymatic solution, which obstructs the gel network and thereby hinders proper elution. After purification, the maximum specific activities of CMCase (0.73 U/mg) and xylanase (1.34 U/mg) were obtained in collection 2. The specific activities Β-glucosidase (0.15 U/mg) and Β-xylosidase (0.047 U/ mg) were obtained in collection 4.

4. Discussion

In this study, the production of cellulase, CMCase, and FPase by the yeast Trichosporon insectorum was studied using culture media supplemented with CMC or FC as the sole carbon source. The effect of the three variables, the pH of the growth medium, the concentration of the carbon source used, and the temperature of cellulase production, was studied using the response surface methodology. The maximum production of CMCase (0.71 IU/mL) was obtained following yeast culture in a medium supplemented with FC (1%) at pH 5, at a temperature of fermentation of 40 °C for 72 h. With the culture medium supplemented with 0.5% CMC at pH 4 and an incubation temperature of 40 °C, the maximum production of CMCase was 0.6 IU/mL after 72 h of fermentation. The maximum production of FPase (0.23 IU/mL) was obtained in the medium supplemented with CMC (0.5%) at pH 6 after 72 h of incubation at 40 °C. The production of FPase did not exceed 0.21 IU/mL when the culture was carried out in a medium supplemented with FC (0.5%) at pH 6 after 72 h of incubation at 40 °C. Our results corroborate the study of Imran et al. [34], which showed a maximum cellulase production (0.81 IU/mL) by Aspergillus tubingensis IMMIS2 after using corn stalks as a carbon source. Giese et al. [21] obtained maximum CMCase production (0.35 IU/mL) by T. laibachii MG270406-1A14 with 10% CMC. Saini et al. [35] noted that the maximum production of cellulases (1.26 IU/mL) by Penicillium oxalicum was obtained with avicel cellulose (0.5%) after an incubation period of 8 days. Parkhey et al. [32] showed that the production of CMCase by Ochrabactrum Haemophilus was maximal (3.55 IU/mL) in a culture medium supplemented with CMC 4.76% (w/v) at pH 6.3 and a temperature of 44.2 °C. The concentration of the carbon source is one of the main factors that affect the yield and initial rate of enzymatic hydrolysis of cellulose [36,37]. An increase in substrate concentration normally leads to an increase in the rate of enzymatic hydrolysis [29].
However, high substrate concentration can cause enzyme inhibition, which significantly reduces the rate of hydrolysis [38,39]. The optimum temperature for the saccharification of cellulose is between 38 and 50 °C [40,41]. Thermostable cellulases are considered ideal candidates for bioprocess industries because the hydrolysis of lignocellulosic substrates at high temperatures increases the reaction rate [42,43,44], the diffusion coefficient, the rate of bioavailability of organic compounds, and the solubility of the substrate [41,45]. Here, the values of the coefficient of determination, R2 and R2 adjusted, in the presence of the carbon source CMC, were 0.971 and 0.918, respectively, while in the presence of a medium supplemented with FC, R2, and R2 adjusted attained 0.888 and 0.689, respectively. These values make this model suitable for optimizing cellulase production by the yeast T. insectorum. Combining pH with carbon source concentration exhibited a larger interactive effect on CMCase production [42], while the other combinations have smaller effects. The combination of temperature and pH strongly influenced FPase production.
The use of the response surface method significantly enhanced cellulase production, increasing CMCase production nearly fourfold. It rose from 0.17 IU/mL to 0.6 IU/mL with CMC medium and reached 0.7 IU/mL with FC medium. FPase production also improved threefold, from 0.07 IU/mL to 0.2 IU/mL, with both CMC and FC media. This aligns with various studies that highlight the effectiveness of response surface methodology in optimizing cellulase production conditions. For instance, Abdel-Fattah et al. [46] used the BBD plan to achieve a two-fold increase in acylase activity by Geobacillus stearothermophilus, from 0.425 IU/mL to 0.8 IU/mL. Similarly, Deka et al. [47] utilized the central composite design (CCD) to achieve a six-fold increase in cellulases by Bacillus subtilis, from 0.07 IU/mL to 0.43 IU/mL.
After purification, the enzymes produced by the Trichosporon insectorum represented 39% of the total proteins. In previous studies, Korish [48] showed that in a culture medium of a yeast strain of the Trichosporon genus, the enzymes represented 34% of the total proteins. Also, the specific CMCase activity decreased by 50% after purification. Generally, the loss of activities after each purification step is markedly high [48]. We note that glucanase activities (CMCase, xylanase) are present in the collection, while collection 4 has glucosidase activity (β-glucosidase, β-xylosidase).

5. Conclusions

Trichosporon insectorum, isolated from the intestine of the coprophagous beetle Gymnopleurus sturmii, demonstrated the ability to produce cellulases (CMCase and FPase) during fermentation. The central composite design (CCD) of response surface methodology was effective in optimizing various process parameters, leading to enhanced enzyme production. The cellulases produced in this study were thermostable and capable of hydrolyzing both soluble substrates like CMC and insoluble substrates. These properties suggest potential for industrial applications.

Author Contributions

Conceptualization, H.T. and H.B.; methodology, N.B., M.S., A.T. and H.T.; software, M.I.; writing—original draft preparation, H.T., R.A.M. and A.R.A.; validation, H.T., H.B., R.A.M. and A.R.A.; investigation, H.T., M.S. and B.D.; data curation, M.I. and N.B.; writing—review and editing, H.T., N.B., R.A.M. and A.R.A.; supervision, B.D. and H.B.; funding acquisition, R.A.M. and A.R.A. All authors have read and agreed to the published version of the manuscript.

Funding

The research was funded by the Researchers Supporting Project number (RSP2024R119), King Saud University, Riyadh, Saudi Arabia.

Institutional Review Board Statement

Not applicable.

Informed Consent Statement

Not applicable.

Data Availability Statement

The original contributions presented in the study are included in the article, further inquiries can be directed to the corresponding author.

Acknowledgments

The authors extend their appreciation to Researchers Supporting Project number (RSP2024R119), King Saud University, Riyadh, Saudi Arabia for funding this work.

Conflicts of Interest

The authors declare no conflicts of interest.

References

  1. Sahoo, A.; Das, P.K.; Patra, S.; Veeranki, V.D. Engineered Yeasts for the Production of Biofuel and Platform Chemicals; Elsevier: Amsterdam, The Netherlands, 2023; pp. 21–46. [Google Scholar] [CrossRef]
  2. Carvalho, J.K.; Panatta, A.A.S.; Silveira, M.A.D.; Tav, C.; Johann, S.; Rodrigues, M.L.F.; Martins, C.V.B. Yeasts isolated from a lotic continental environment in Brazil show potential to produce amylase, cellulase and protease. Biotechnol. Rep. 2021, 30, e00630. [Google Scholar] [CrossRef]
  3. Maghraby, Y.R.; El-Shabasy, R.M.; Ibrahim, A.H.; Azzazy, H.M.E.S. Enzyme Immobilization Technologies and Industrial Applications. ACS Omega 2023, 8, 5184–5196. [Google Scholar] [CrossRef] [PubMed]
  4. Sukmawati, D.; Sondana, G.A.; Fikriyyah, N.N.; Afifah, Z.N.; Firhandini, A.; Khumaiya, U.; Komsiatun, D.A.; Asmara, Y.T.; Supiyani, A.; Puspitaningrum, R.; et al. Cellulase-producing yeast isolated from fermented cocoa beans as biocontrol for pathogenic mold chocolate fruit collected from Sentul, Jawa Barat, Indonesia. J. Phys. Conf. Ser. 2021, 1869, 012043. [Google Scholar] [CrossRef]
  5. Narisetty, V.; Tarafdar, A.; Bachan, N.; Madhavan, A.; Tiwari, A.; Chaturvedi, P.; Sindhu, R. An Overview of Cellulase Immobilization Strategies for Biofuel Production. Bioenergy Res. 2023, 16, 4–15. [Google Scholar] [CrossRef]
  6. Wanderley Siqueira, J.G.; Rodrigues, C.; de Souza Vandenberghe, S.P.; Woiciechowski, A.L.; Soccol, C.R. Current advances in on-site cellulase production and application on lignocellulosic biomass conversion to biofuels: A review. Biomass Bioenergy 2019, 132, 105419. [Google Scholar] [CrossRef]
  7. Wu, W.; Li, P.; Huang, L.; Wei, Y.; Li, J.; Zhang, L.; Jin, Y. The Role of Lignin Structure on Cellulase Adsorption and Enzymatic Hydrolysis. Biomass 2023, 3, 96–107. [Google Scholar] [CrossRef]
  8. Bautista-Cruz, A.; Aquino-Bolaños, T.; Hernández-Canseco, J.; Quiñones-Aguilar, E.E. Cellulolytic Aerobic Bacteria Isolated from Agricultural and Forest Soils: An Overview. Biology 2024, 13, 102. [Google Scholar] [CrossRef] [PubMed]
  9. Singh, A.; Bajar, S.; Devi, A.; Pant, D. An overview on the recent developments in fungal cellulase production and their industrial applications. Bioresour. Technol. Rep. 2020, 14, 100652. [Google Scholar] [CrossRef]
  10. Zhang, X.-Z.; Zhang, Y.-H.P. Cellulases: Characteristics, Sources, Production, and Applications. In Bioprocessing Technologies in Biorefinery for Sustainable Production of Fuels, Chemicals, and Polymers; John Wiley & Sons, Inc.: Hoboken, NJ, USA, 2013; pp. 131–146. [Google Scholar] [CrossRef]
  11. Auxenfans, T.; Husson, E.; Sarazin, C. Simultaneous pretreatment and enzymatic saccharification of (ligno) celluloses in aqueous-ionic liquid media: A compromise. Biochem. Eng. J. 2017, 117, 77–86. [Google Scholar] [CrossRef]
  12. Srivastava, N.; Srivastava, M.; Alhazmi, A.; Kausar, T.; Haque, S.; Singh, R.; Ramteke, P.; Mishra, P.K.; Tuohy, M.; Leitgeb, M.; et al. Technological advances for improving fungal cellulase production from fruit wastes for bioenergy application: A review. Environ. Pollut. 2021, 287, 117370. [Google Scholar] [CrossRef]
  13. Juhász, T.; Szengyel, Z.; Réczey, K.; Siika-Aho, M.; Viikari, L. Characterization of cellulases and hemicellulases produced by Trichoderma reesei on various carbon sources. Process Biochem. 2005, 40, 3519–3525. [Google Scholar] [CrossRef]
  14. Li, J.; Zhang, M.-M.; Wan, C.; Haan, R.-D.; Bai, F.-W.; Zhao, X.-Q. Improved cellulase production in recombinant Saccharomyces cerevisiae by disrupting the cell wall protein-encoding gene CWP2. J. Biosci. Bioeng. 2019, 129, 165–171. [Google Scholar] [CrossRef] [PubMed]
  15. Adebola, A.B.; Sarafadeen, K.O.; Idowu, A.A.; Monilola, W.S. Optimization of cellulase enzyme from sorghum straw by yeasts isolated from plant feeding—Termite Zonocerus variegatus. Food Appl. Biosci. J. 2019, 7, 81–99. [Google Scholar]
  16. Otero, D.M.; Cadaval, C.L.; Teixeira, L.M.; Rosa, C.A.; Sanzo, A.V.L.; Kalil, S.J. Screening of yeasts capable of producing cellulase-free xylanase. African J. Biotechnol. 2015, 14, 1961–1969. [Google Scholar] [CrossRef]
  17. Stevens, B.J.H.; Payne, J. Cellulase and Xylanase Production by Yeasts of the Genus Trichosporon. J. Gen. Microbiol. 1977, 100, 381–393. [Google Scholar] [CrossRef]
  18. Thongekkaew, J.; Ikeda, H.; Masaki, K.; Iefuji, H. An acidic and thermostable carboxymethyl cellulase from the yeast Cryptococcus sp. S-2: Purification, characterization and improvement of its recombinant enzyme production by high cell-density fermentation of Pichia pastoris. Protein Expr. Purif. 2008, 60, 140–146. [Google Scholar] [CrossRef]
  19. Rong, Y.; Zhang, L.; Chi, Z.; Wang, X. A carboxymethyl cellulase from a marine yeast (Aureobasidium pullulans 98): Its purification, characterization, gene cloning and carboxymethyl cellulose digestion. J. Ocean Univ. China. 2015, 14, 913–921. [Google Scholar] [CrossRef]
  20. Vyas, S. and Chhabra, M. Isolation, identification and characterization of Cystobasidium oligophagum JRC1: A cellulase and lipase producing oleaginous yeast. Bioresour. Technol. 2017, 223, 250–258. [Google Scholar] [CrossRef] [PubMed]
  21. Giesea, E.C.; Dussán, K.J.; Pierozzia, M.; Chandela, A.K.; Pagnoccad, F.C.; da Silvaa, S.S. Cellulase Production by Trichosporon laibachii. Orbital-Electron. J. Chem. 2017, 9, 271–278. [Google Scholar] [CrossRef]
  22. Ilić, N.; Milić, M.; Beluhan, S.; Dimitrijević-Branković, S. Cellulases: From Lignocellulosic Biomass to Improved Production. Energies 2023, 16, 3598. [Google Scholar] [CrossRef]
  23. Yang, J.; Yue, H.R.; Pan, L.Y.; Feng, J.X.; Zhao, S.; Suwannarangsee, S.; Chempreda, V.; Liu, C.G.; Zhao, X.Q. Fungal strain improvement for efficient cellulase production and lignocellulosic biorefinery: Current status and future prospects. Bioresour. Technol. 2023, 385, 129449. [Google Scholar] [CrossRef] [PubMed]
  24. Davison, S.A.; Den Haan, R.; Van Zyl, W.H. Exploiting strain diversity and rational engineering strategies to enhance recombinant cellulase secretion by Saccharomyces cerevisiae. Appl. Microbiol. Biotechnol. 2020, 104, 5163–5184. [Google Scholar] [CrossRef]
  25. Egwim, E.C.; Agboola, A.O.; Saidu, A.N. Immobilization of cellulase and yeast for the hydrolysis and fermentation of pre-treated bagasse for ethanol production. Nig. J. Biotech. 2019, 36, 113–121. [Google Scholar] [CrossRef]
  26. Boro, M.; Kumar, A.; Chettri, D. Environmental Technology & Innovation Strategies inved in biofuel production from agro-based lignocellulose biomass. Environ. Technol. Innov. 2022, 28, 102679. [Google Scholar] [CrossRef]
  27. Bhat, M.K. Cellulases and related enzymes in biotechnology. Biotechnol. Adv. 2000, 18, 355–383. [Google Scholar] [CrossRef] [PubMed]
  28. Irfan, M.; Mushtaq, Q.; Tabssum, F.; Shakir, H.A.; Qazi, J.I. Carboxymethyl cellulase production optimization from newly isolated thermophilic Bacillus subtilis K-18 for saccharification using response surface methodology. AMB Express. 2017, 29, 7. [Google Scholar] [CrossRef] [PubMed]
  29. Touijer, H.; Benchemsi, N.; Ettayebi, M.; Janati Idrissi, A.; Chaouni, B.; Bekkari, H. Thermostable Cellulases from the Yeast Trichosporon sp. Enzyme Res. 2019, 2019, 2790414. [Google Scholar] [CrossRef]
  30. Rosyida, V.T.; Indrianingsih, A.W.; Maryana, R.; Wahono, S.K. Effect of Temperature and Fermentation Time of Crude Cellulase Production by Trichoderma reesei on Straw Substrate. Energy Procedia. 2015, 65, 368–371. [Google Scholar] [CrossRef]
  31. Miller, G.L. Use of DinitrosaIicyIic Acid Reagent for Determination of Reducing Sugar. Lancet 1959, 372, 475–488. [Google Scholar] [CrossRef]
  32. Parkhey, P.; Gupta, P.; Eswari, J.S. Optimization of Cellulase Production From Isolated Cellulolytic Bacterium: Comparison Between Genetic Algorithms, Simulated Annealing and Response Surface Methodology. Chem. Eng. Commun. 2016, 204, 28–38. [Google Scholar] [CrossRef]
  33. Bradford, M.M. A rapid and sensitive method for the quantitation of microgram quantities of protein utilizing the principle of protein-dye binding. Anal. Biochem. 1976, 72, 248–254. [Google Scholar] [CrossRef] [PubMed]
  34. Imran, M.; Anwar, Z.; Irshad, M.; Javid, A.; Hussain, A.; Ali, S. Biocatalysis and Agricultural Biotechnology Optimization of cellulase production from a novel strain of Aspergillus Tubingensis IMMIS2 through response surface methodology. Biocatal. Agric. Biotechnol. 2017, 12, 191–198. [Google Scholar] [CrossRef]
  35. Saini, R.; Saini, J.K.; Adsul, M.; Patel, A.K.; Mathur, A.; Tuli, D.; Singhania, R.R. Enhanced cellulase production by Penicillium oxalicum for bio-ethanol application. Bioresour. Technol. 2015, 188, 240–246. [Google Scholar] [CrossRef]
  36. Datta, R. Enzymatic degradation of cellulose in soil: A review. Heliyon 2024, 10, e24022. [Google Scholar] [CrossRef]
  37. Askari, H.; Soleimanian-zad, S.; Kadivar, M.; Shahbazi, S. Creating a novel genetic diversity of Trichoderma afroharzianum by γ -radiation for xylanase-cellulase production. Heliyon 2024, 10, e28349. [Google Scholar] [CrossRef] [PubMed]
  38. Singh, V.; Raheja, Y.; Basotra, N.; Sharma, G.; Tsang, A.; Chadha, B.S. CRISPR/Cas9 mediated gene editing of transcription factor ACE1 for enhanced cellulase production in thermophilic fungus Rasamsonia emersonii. Fungal Biol. Biotechnol. 2023, 10, 18. [Google Scholar] [CrossRef]
  39. Boondaeng, A.; Keabpimai, J.; Trakunjae, C.; Vaithanomsat, P.; Srichola, P.; Niyomvong, N. Cellulase production under solid-state fermentation by Aspergillus sp. IN5: Parameter optimization and application. Heliyon 2024, 10, e26601. [Google Scholar] [CrossRef]
  40. Zhao, Z.; Gu, S.; Liu, D.; Liu, D.; Chen, B.; Li, J.; Tian, C. The putative methyltransferase LaeA regulates mycelium growth and cellulase production in Myceliophthora thermophila. Biotechnol. Biofuels Bioprod. 2023, 16, 58. [Google Scholar] [CrossRef]
  41. Dashtban, M.; Maki, M.; Leung, K.T.; Mao, C.; Qin, W. Cellulase activities in biomass conversion: Measurement methods and comparison. Crit. Rev. Biotechnol. 2010, 30, 302–309. [Google Scholar] [CrossRef]
  42. Korsa, G.; Konwarh, R.; Masi, C.; Ayele, A.; Haile, S. Microbial cellulase production and its potential application for textile industries. Ann. Microbiol. 2023, 73, 13. [Google Scholar] [CrossRef]
  43. Li, H.; Zhang, M.; Zhang, Y.; Xu, X.; Zhao, Y.; Jiang, X.; Zhang, R.; Gui, Z. Characterization of Cellulose-Degrading Bacteria Isolated from Silkworm Excrement and Optimization of Its Cellulase Production. Polymers 2023, 15, 4142. [Google Scholar] [CrossRef] [PubMed]
  44. Sohail, M.; Barzkar, N.; Michaud, P.; Tamadoni Jahromi, S.; Babich, O.; Sukhikh, S.; Das, R.; Nahavandi, R. Cellulolytic and Xylanolytic Enzymes from Yeasts: Properties and Industrial Applications. Molecules 2022, 27, 3783. [Google Scholar] [CrossRef]
  45. Srivastava, N.; Srivastava, M.; Mishra, P.K.; Gupta, V.K.; Molina, G.; Rodriguez-Couto, S.; Manikanta, A.; Ramteke, P.W. Applications of fungal cellulases in biofuel production: Advances and limitations. Renew. Sustain. Energy Rev. 2017, 82, 2379–2386. [Google Scholar] [CrossRef]
  46. Abdel-Fattah, Y.R.; El-Helow, E.R.; Ghanem, K.M.; Lotfy, W.A. Application of factorial designs for optimization of avicelase production by a thermophilic Geobacillus isolate. Res. J. Microbiol. 2007, 2, 13–23. [Google Scholar]
  47. Deka, D.; Bhargavi, P.; Sharma, A.; Goyal, D.; Jawed, M.; Goyal, A. Enhancement of cellulase activity from a new strain of bacillus subtilis by medium optimization and analysis with various cellulosic substrates. Enzyme Res. 2011, 2011, 151656. [Google Scholar] [CrossRef]
  48. Korish, M. Production, Purification, Properties and Application of the Cellulases from a Wild type Strain of a Yeast isolate. Ph.D Thesis, Faculty of Biology of the Johannes Gutenberg-University Mainz, Mainz, Germany, 2003. [Google Scholar]
Figure 1. Observed and predicted values of dependent variables for CMCase production in media with CMC or FC.
Fermentation 10 00453 g001
Figure 2. Observed and predicted values of dependent variables for FPase production in media with CMC or FC.
Fermentation 10 00453 g002
Figure 3. Contour plots of the different variables for CMCase production in media with CMC or FC.
Fermentation 10 00453 g003aFermentation 10 00453 g003b
Figure 4. Contour plots of the different variables for FPase production in media with CMC or FC.
Fermentation 10 00453 g004aFermentation 10 00453 g004b
Figure 5. Optical density of purified protein fractions.
Fermentation 10 00453 g005
Figure 6. Thin layer chromatography of the purified fractions (demonstration of residual CMC by the α-naphthol test).
Fermentation 10 00453 g006
Figure 7. Thin layer chromatography of the purified fractions (demonstration of proteins by the ninhydrin test).
Fermentation 10 00453 g007
Table 1. Levels and codes of variables used for BBD.
CodeLevels
−101
Substrate concentration [CS] (%)X10.10.51
Temperature (°C)X23336.540
pHX3456
Table 2. Effect of different variables on CMCase production through BBD.
Run No.Variables (Unit)Carbon Source CMCCarbon Source FC
pHT (°C)[CS] (%)CMCase Activity (IU/mL)CMCase Activity (IU/mL)
ObservedPredictedResidual ValueObservedPredictedResidual Value
10110.39000.4462−0.05620.71000.67620.0337
2−1010.41000.37370.03620.48000.42750.0525
31−100.45000.4700−0.02000.47000.38370.0862
4−1−100.42000.4525−0.03250.45000.42120.0287
501−10.45000.44620.00370.51000.42870.0812
61010.20000.17620.02370.29000.2950−0.0050
7−10−10.22000.2437−0.02370.23000.22500.0050
8−1100.60000.58000.02000.42000.5062−0.0862
90000.25000.25000.00000.32000.32000.0000
100−110.42000.4237−0.00370.32000.4012−0.0812
110000.25000.25000.00000.32000.32000.0000
121100.44000.40750.03250.49000.5187−0.0287
130−1−10.46000.40370.05620.45000.4837−0.0337
140000.25000.25000.00000.32000.32000.0000
1510−10.25000.2862−0.03620.28000.3325−0.0525
Table 3. Effect of different variables on FPase production through BBD.
Run No.Variables (unit)Carbon Source CMCCarbon Source FC
pHT (°C)[CS] (%)FPase Activity (IU/mL) FPase Activity (IU/mL)
ObservedPredictedResidual ValueObservedPredictedResidual Value
10110.19000.19−0.00250.15000.1587−0.0087
2−1010.09000.07750.01250.13000.10120.0287
31−100.12000.11000.01000.17000.15000.0200
4−1−100.16000.1700−0.01000.15000.1575−0.0075
501−10.20000.19750.00250.21000.18870.0212
61010.09000.0975−0.00750.09000.08870.0012
7−10−10.09000.08250.00750.08000.0812−0.0012
8−1100.12000.1300−0.01000.14000.1600−0.0200
90000.11000.11000.00000.07000.07000.0000
100−110.16000.1625−0.00250.13000.1512−0.0212
110000.11000.11000.00000.07000.07000.0000
121100.23000.22000.01000.21000.20250.0075
130−1−10.16000.15750.00250.15000.14120.0087
140000.11000.11000.00000.07000.07000.0000
1510−10.08000.0925−0.01250.10000.1287−0.0287
Table 4. Analysis of variance for CMCase production in CMC medium.
SSdfMSF Valuep ValueEffect
Model0.18152990.0201707.9842930.017037Significant
Interception0.08828710.8828734.948650.001973Significant
pH0.00065610.0006560.259660.632041Not significant
pH20.00420610.0042061.664860.253394Not significant
T °C0.11462510.11462545.374430.001094Significant
T °C20.13860610.13860654.867380.000706Significant
[CS]0.00512410.0051242.028390.213687Not significant
[CS]CMC20.00075110.0007510.297420.608940Not significant
pH * T °C0.00902510.0090253.572560.117342Not significant
pH * [CS]0.01464510.0146455.797200.061034Not significant
T °C * [CS]0.00024910.0002490.098630.766162Not significant
Error0.01263150.002526
Table 5. Analysis of variance for CMCase production in FC medium.
SSdfMSF Value p Value Effect
Model0.18184790.0202053.1656950.108702Not significant
Interception 0.07510910.07510911.767840.018627Significant
pH0.00034110.0003410.053460.826305Not significant
pH20.00147710.0014770.231400.65080Not significant
T °C0.09258610.09258614.506130.012517Significant
T °C20.09159210.09159214.350400.012782Significant
[CS]0.01040110.0104011.629550.257840Not significant
[CS]CMC20.00087310.0008730.136720.726713Not significant
pH * T °C0.00062510.0006250.097920.766968Not significant
pH * [CS]0.01587610.0158762.487430.175586Not significant
T °C * [CS]0.03141110.0314114.921390.077282Not significant
Error0.03191350.006383
Table 6. Statistical model for CMCase production.
Dependent VariableRR2R2 Adjusted
CMC 0.9669260.9349460.817847
FC0.9223380.8507070.581980
Table 7. Analysis of variance for FPase production in CMC medium.
SSdfMSF Valuep ValueEffect
Model0.02870690.00319018.383830.002549Significant
Interception0.01833510.018335105.67880.000150Significant
pH0.00054510.0005453.14000.136593Non-significant
pH20.00166710.0016679.6100 Significant
T °C0.02058410.020584118.63940.000113Significant
T °C20.01745210.017452100.58920.000169Significant
[CS]0.00001410.0000140.08020.788331Non-significant
[CS]20.00000610.0000060.03310.862854Non-significant
pH * T °C0.00562510.00562532.42130.002330Significant
pH * [CS]0.00000810.0000080.04420.841779Non-significant
T °C * [CS]0.00002510.0000250.14320.720645Non-significant
Error0.00086750.000173
Table 8. Analysis of variance for FPase production in FC medium.
SSdfMSF Valuep ValueEffect
Model0.02794590.0031054.4423670.057607Non-significant
Interception0.02100110.02100130.046450.002756Significant
pH0.00153610.0015362.197390.198345Non-significant
pH20.00129810.0012981.857160.231119Non-significant
T °C0.02267710.02267732.443500.002327Significant
T °C20.02289810.02289832.760350.002277Significant
[CS]0.00059410.0005940.849560.398968Non-significant
[CS]20.00051210.0005120.732070.431294Non-significant
pH * T °C0.00062510.0006250.894190.387765Non-significant
pH * [CS]0.00108610.0010861.553700.267803Non-significant
T °C * [CS]0.00034410.0003440.492520.514120Non-significant
Error0.00349550.000699
Table 9. Statistical model for FPase production.
Dependent VariableRR2R2 Adjusted
CMC0.9852240.9706670.917867
FC0.9427850.8888430.688760
Table 10. The activity of precipitated enzyme proteins.
EnzymesActivity (UI/mL)Specific Activity (U/mg)
CMCase0.5251.876
Xylanase0.9423.365
ß-glucosidase0.1210.430
ß-Xylosidase0.0040.013
Table 11. Enzymatic activities of collections of purified fractions.
Proteins (mg/mL)Enzymatic Activities
CMCaseXylanaseΒ-GlucosidaseΒ-Xylosidase
UI/mLU/mgUI/mLU/mgUI/mLU/mgUI/mLU/mg
Pre-purified extract0.280.4381.5630.7852.8040.1060.3800.00350.0125
Collection 10.00790nd*nd*nd*nd*0.0002610.0330190.0002610.0330
Collection 20.092170.06710.7290.1241.3480.004170.0450.0004700.00510
Collection 30.215660.01520.1410.1070.4980.008670.0402nd*nd*
Collection 40.198510.001360.01370.1260.6360.03020.15200.009330.04702
nd*, not determined.
Disclaimer/Publisher’s Note: The statements, opinions and data contained in all publications are solely those of the individual author(s) and contributor(s) and not of MDPI and/or the editor(s). MDPI and/or the editor(s) disclaim responsibility for any injury to people or property resulting from any ideas, methods, instructions or products referred to in the content.

