Abstract
To study the mixed fermentation technology of blueberry and corn peptide by Lacticaseibacillus rhamnosus ZYN-0417 and Lactiplantibacillus plantarum ZYN-0221 and its effect on fermentation quality, fermentation conditions were optimized using a single-factor test and a Plackett–Burman design combined with a Box–Behnken response surface methodology, with blueberry juice and corn peptide as raw materials and L. rhamnosus ZYN-0417 and Lp. plantarum ZYN-0221 as the starter. The results showed that the optimum fermentation conditions were as follows: the volume ratio of ZYN-0417 and ZYN-0221 was 1:1, the amount of blueberry juice was 20%, the amount of corn peptide was 22%, the amount of glucose was 2%, the amount of inoculation was 5%, the fermentation time was 40 h, and the fermentation temperature was 37 °C. Under optimum conditions, the viable count of lactic acid bacteria in fermented blueberry and corn peptide was 16.28 log CFU/mL, the pH value was 4.86, the total acid content was 14.00 g/L, the total sugar content was 39.98 g/100 g, the protein content was 48.34 g/100 g, the scavenging ability of the DPPH, ABTS+ and ·OH− radicals increased by 10.14%, 10.98% and 25.02%, respectively, the chelating ability of Fe2+ increased by 14.92%, the content of total phenol increased by 1.43 mg/L, the content of total flavonoids increased by 0.38 mg/L, the activity of superoxide dismutase increased by 122.10 U/mL, and the activation rate of alcohol dehydrogenase increased by 5.74%. The results showed that mixed lactic acid bacteria could be used as a starter of blueberry and corn peptide and effectively improve the nutritional value of the product.
1. Introduction
Blueberry, a perennial seasonal blueberry of the genus Vaccinium in the Ericaceae family, is native to North America and East Asia. In China, it is produced mainly in the forest areas of the Greater and Lesser Khingan Mountains. Blueberry contains various active components, such as multiple active enzymes, vitamins, polyphenols, flavonols, and anthocyanins. It has strong antioxidant activity and can enhance immunity, improve vision [1], and prevent chronic diseases [2]. It is recognized as a healthy fruit worldwide. In addition, its fruits are sweet and sour, with pleasant aroma, and are deeply loved by people. In recent years, many scholars have conducted in-depth research on the processing methods of blueberry fruit as raw material and obtained various processed blueberry products, such as blueberry jam [3], blueberry yogurt [4], blueberry fermented juice [5], etc.
The bioactive peptide is a type of peptide compound that has strong physiological functions. Blueberry juice is a healthy beverage with high nutritional value and is favored by consumers. The application of a bioactive peptide to blueberry juice can not only improve antioxidant activity and inhibit the browning of blueberry juice to some extent [6] but can also regulate the pH value of blueberry juice, improve the bitterness and off-flavor presented of hydrophobic amino acids exposed during the preparation of bioactive peptide, and balance the nutrients of blueberry juice. Moreover, compared to protein, a small molecular weight bioactive peptide is more easily absorbed by the human body and has higher functional activity. Corn peptide is a small molecule bioactive peptide obtained from corn gluten meal through enzymatic hydrolysis or microbial fermentation methods [7]. Previous studies have reported that the corn peptide has antioxidant activity [7], antagonizes alcoholic liver injury [8], lowers blood lipids and blood sugar [9], and other effects.
Studies have shown that the addition of bioactive peptides to beverages can enhance their product functionality. Mirzapour et al. [10] studied the preparation of gelatin bioactive peptides in fish processing by-products and found that short peptide segments have stronger antioxidant activity and are safe. Adding them to beverages can strengthen the active ingredients. Ma et al. [11] studied the effects of collagen peptides fermented with skin collagen peptides from tilapia infused with lactic acid bacteria and jackfruit juice on the cyclophosphamide-induced immunosuppression model. The results showed that the antioxidant capacity and lactic acid content of collagen peptide and pineapple honey juice were enhanced after fermentation, and it had the effect of restoring indicators of immune organs and reducing colon damage. It can be seen that lactic acid bacteria (LAB) fermentation is a very good processing method that can efficiently combine bioactive peptides and plant-based raw materials, which can increase the active ingredients of the fermented products and improve their nutritional value. Li et al. [12] found that LAB-fermented jujube juice can effectively increase the content of volatile components and the complexity of aroma, and the antioxidant capacity was also improved. Kwaw et al. [13] studied LAB-fermented mulberry juice and found that the type and content of phenolic substances in the fermented product increased significantly, and antioxidant activity increased significantly. Duan et al. [14] found that LAB are suitable for wolfberry juice fermentation, and the organic acid content of wolfberry juice increased after fermentation, improving its sensory quality and increasing the antioxidant activity of fermented wolfberry juice. Through the results of existing research, it is easy to find that the fermented raw materials by LAB can enhance the content of bioactive components, antioxidant capacity, and the taste of the raw materials. However, at present, there are many studies on blueberry and corn peptide alone, but there are few studies on the combination of blueberry and corn peptide to make up for their strengths, improve product flavor, and increase nutritional value.
In this study, blueberry and corn peptide were used as raw material, and mixed LAB were used as starter culture. The fermentation process parameters were optimized by single-factor experiments and the Plackett–Burman design combined with a response surface methodology. The physicochemical properties, active ingredients, and antioxidant capacity of the product were analyzed. The objective was to develop a new type of functional food of LAB-fermented blueberry and corn peptide and to provide new ideas for the processing industries of blueberry and corn peptide.
2. Materials and Methods
2.1. Pretreatment of Raw Materials
The blueberry fruit was thawed at room temperature, washed and then crushed and homogenized by homogenizer to obtain blueberry juice. Corn peptide was purchased from Qiqihar Yixiang Food Co., Ltd., Qiqihar, Heilongjiang Province, China.
2.2. Starter Cultures Preparation
The LAB (L. rhamnosus ZYN-0417 and Lp. plantarum ZYN-0221) were isolated from blueberry peel, which were preserved at −80 °C [15]. They were inoculated into a liquid MRS medium (Solarbio, Beijing, China) at an inoculation amount of 2% for activation. The stably passaged strain was washed twice with sterile water and centrifuged at 9000× g for 5 min to obtain the bacterial suspension for future use.
2.3. Design of Single-Factor Experiments
The addition amount of corn peptide was 20%, the addition amount of blueberry juice was 30%, the addition amount of glucose was 6%, the fermentation temperature was 37 °C, the fermentation time was 36 h, the inoculation amount of LAB was 6%, and the volume ratio of L. rhamnosus ZYN-0417 to Lp. plantarum ZYN-0221 was 1:1. The viable count of LAB, sensory score, pH value and total acid content in each group of samples were determined to determine the optimal single-factor condition.
The volume ratio of L. rhamnosus ZYN-0417 and Lp. plantarum ZYN-0221 was set at 1:0, 1:1, 2:1, 1:2, and 0:1. The addition amount of corn peptide was set at 5%, 10%, 20%, 30%, and 40% (w/v). The addition amount of blueberry juice was set at 10%, 20%, 30%, 40%, and 50% (v/v). The addition amount of glucose was set at 2%, 4%, 6%, 8%, and 10% (w/v). The fermentation temperature was set at 31 °C, 34 °C, 37 °C, 40 °C, and 43 °C. The fermentation time was set at 12 h, 24 h, 36 h, 48 h, and 60 h. The inoculation amount of fermentation strains was set at 2%, 4%, 6%, 8% and 10%, v/v.
2.4. Plackett–Burman Experiments
Based on single-factor experiments, with the fixed ratio between strains 1:1 and viable counting of LAB as the indicator, six factors that affect the fermentation of corn peptide addition, blueberry juice addition, glucose addition, fermentation temperature, fermentation time, and inoculation amount of LAB were taken to two levels for the analysis of Plackett–Burman experiments, respectively. Three factors were screened that had a significant effect on the viable count of LAB. The design of the Plackett–Burman experiments is shown in Table 1. Based on the result of the comprehensive Plackett–Burman experiment, significant influencing factors were obtained. Then, according to the positive and negative effects of the significant factors that affect the viable count of lactic acid bacteria, the climbing step size and the change direction were set, while the other fermentation conditions were kept unchanged, to quickly approach the optimal range.

Table 1.
Factors and levels of Plackett–Burman design.
2.5. Box–Behnken Response Surface Experiments
According to the result of the steepest ascent experiment, with the highest value of the viable counting of LAB as the center zero level, the positive level takes the higher level, the negative level takes the lower level, and other fermentation factors remain unchanged. The response surface experiment was designed as shown in Table 2.
Table 2.
Factors and levels of response surface methodology.
2.6. Sensory Evaluation
The sensory evaluation panel consisted of 10 food professionals (half male and half female) without bad habits. Fermentation samples were randomly numbered, evaluated and scored according to the standard in Table 3.
Table 3.
Sensory scoring criteria of blueberry and corn peptide fermented by lactic acid bacteria.
2.7. Viable Counting Method of LAB
The viable count of LAB was conducted according to the method of Hu et al. [16]. Fermentation samples were diluted 10-fold with sterile saline. After that, 1 mL of diluted samples were added to sterile petri dishes containing MRS Medium, respectively. Inverted anaerobic culturing was at 37 °C for 48 ± 2 h, and the results were recorded as log CFU/mL.
2.8. Quality Evaluation of Fermented Blueberry Corn Peptides with Mixed Lactic Acid Bacteria
2.8.1. Determination of Physical and Chemical Indicators
The pH value was measured using an acidity meter. The total acid content was determined according to the method of Hu et al. [17]. Fermentation samples were titrated with 0.1 mol/L NaOH until pH 8.1 and results are expressed as g lactic acid per mL. The crude protein content was determined by the Dumas combustion method [18]. The total sugar content was determined by the 3,5-dinitrosalicylic acid (DNS) method [19]. The color change was determined using a colorimeter.
2.8.2. Determination of Active Ingredients
The total phenol content of the blueberry and corn peptide fermented by mixed LAB was determined by the Folin–Ciocalteu method [20]. The standard curve was plotted within the concentration range of 5~40 mg/L (y = 2.0337x + 0.0603, R2 = 0.9996). The determination result was expressed as the gallic acid equivalent of 1 g of sample. The total flavonoid content was determined using the AlCl3 colorimetric method [21]. The result was expressed as rutin in 1 g of sample and the standard curve of rutin solution was plotted as y = 0.9191x + 0.0104, R2 = 0.9987. A total of 0.1 mg/mL (calculated by the protein content of blueberry and corn peptide) of aqueous solution of blueberry and corn peptide fermented by mixed lactic acid bacteria was prepared. The supernatant was extracted by centrifugation at 4 °C and 9000× g for 20 min, The SOD activity was determined according to the specific steps in the instruction manual of the superoxide dismutase activity detection kit. The activation rate of alcohol dehydrogenase (ADH) was determined according to the method of Wang et al. [9].
2.8.3. Determination of Antioxidant Activity
Aqueous solutions of blueberry and corn peptide (0.1 mg/mL, calculated by protein content of blueberry and corn peptide) were prepared before and after fermentation. The broth was centrifuged at 9000× g for 10 min, and the supernatant was collected to determine antioxidant activity. The scavenging potency against DPPH, ·OH−, and ABTS+ radicals in the supernatant was tested with vitamin C as a positive control. The Fe2+ chelating ability of individual strains was compared with EDTA as a positive control.
The DPPH and ·OH− radical scavenging ability of LAB strains was determined according to the method of Mohamad et al. [22]. The ABTS+ radical scavenging ability of LAB was determined according to the method of Kim et al. [23]. The Fe2+ chelating ability was measured according to the method of Lin et al. [24].
2.9. Data Processing
The above tests were repeated three times, and the test results were expressed as mean ± standard deviation. Origin 2022 (OriginLab, Northampton, MA, USA) was used to analyze the data and draw charts. SPSS Statistics 19 (IBM Corp., Armonk, NY, USA) was used to analyze single-factor results analysis of variance (ANOVA) and to screen for significant factors (p < 0.05 or p < 0.01). Design-Expert 8.0.5 (Stat-Ease., Minneapolis, MN, USA) was used for the Plackett–Burman and Box–Behnken design test to optimize the fermentation process parameters.
3. Results and Discussion
3.1. Single-Factor Tests
3.1.1. Effect of the Fermentation Strain Ratio on the Quality of Fermented Blueberry and Corn Peptide
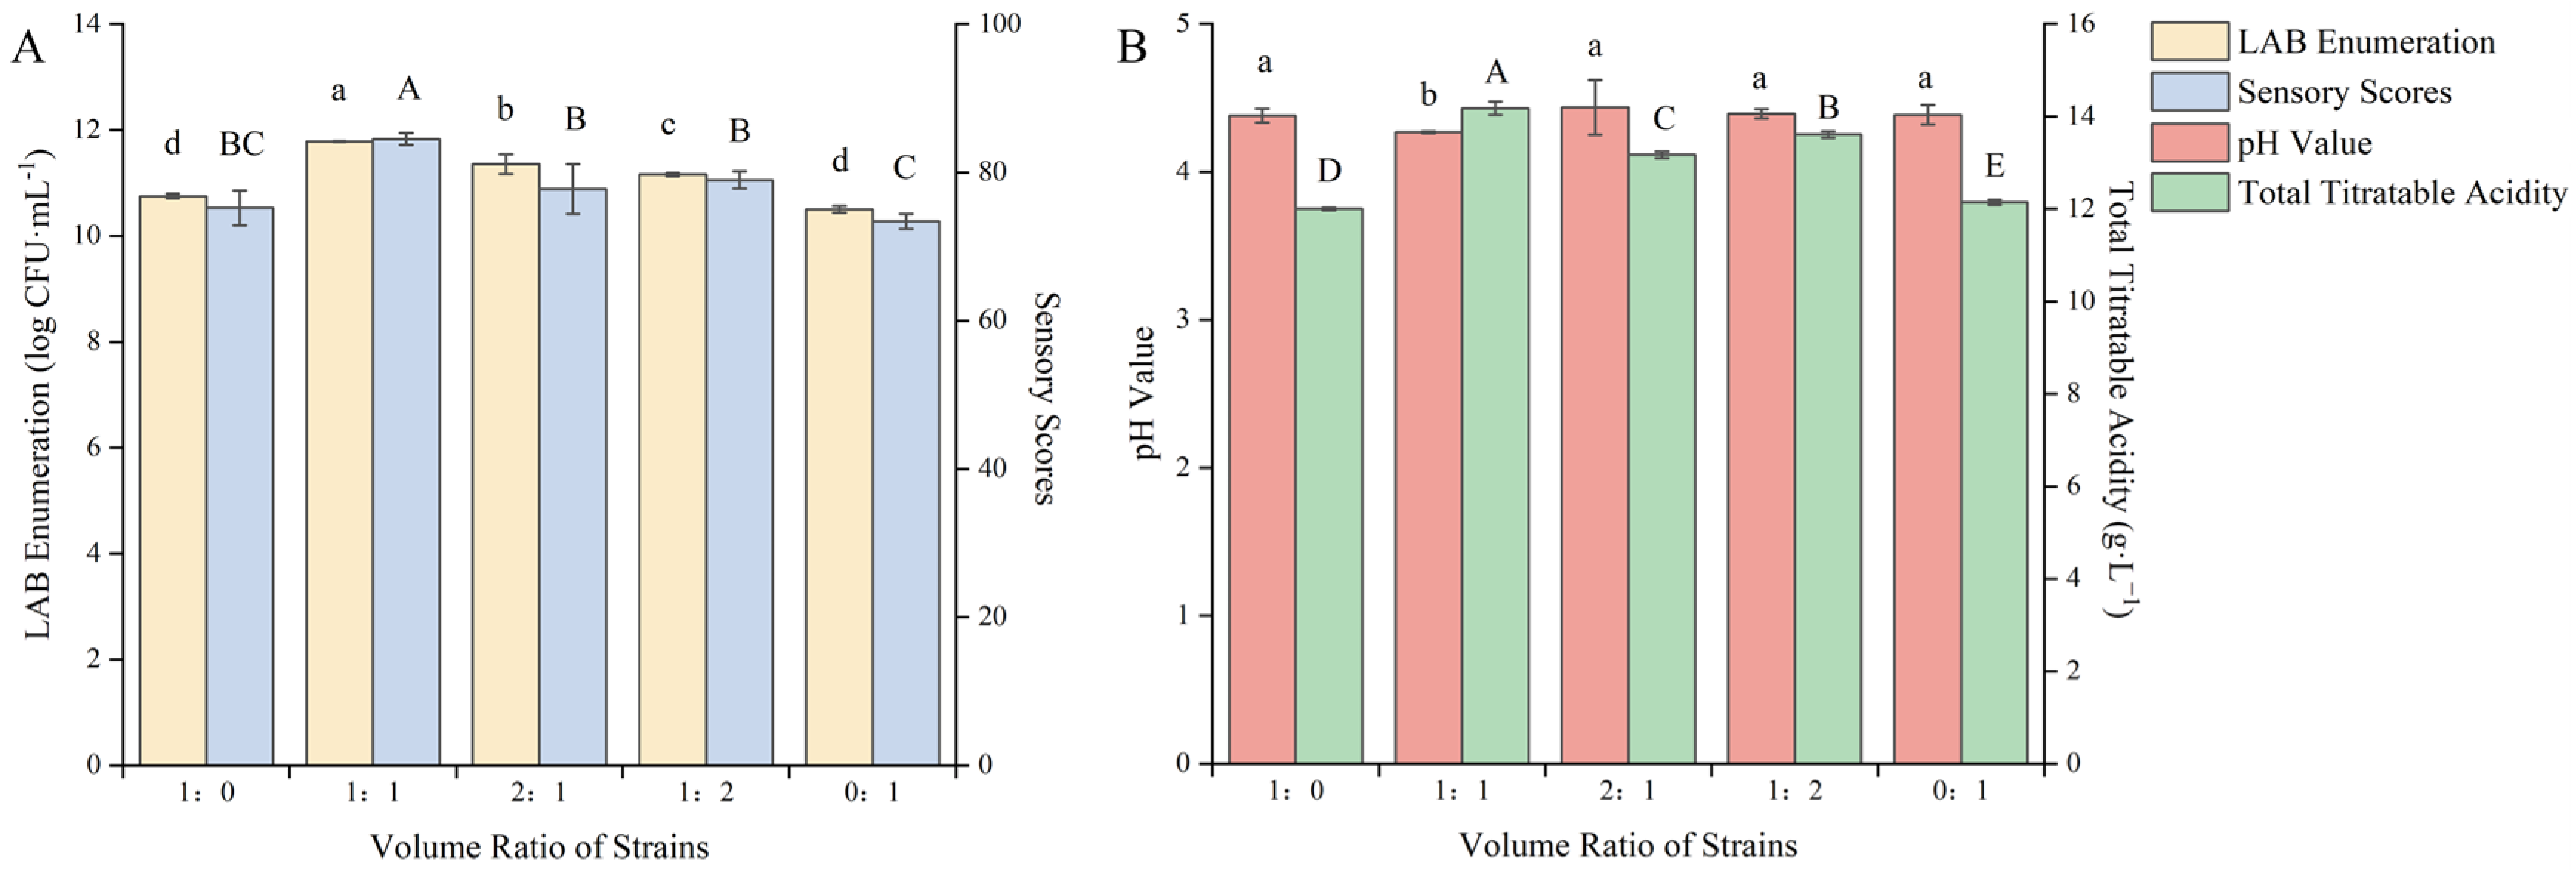
The strains ZYN-0417 and ZYN-0221 were used for the co-fermentation of blueberry and corn peptide in different volume ratios. Through the interaction of the strains, within the same fermentation time, they can promote each other’s growth, rapidly increasing the viable count of LAB, greatly shortening the fermentation cycle, and improving the quality of fermentation [25]. As shown in Figure 1, the changes in the viable count of LAB, the sensory score, and the total acid content after fermentation of the mixed LAB were significantly higher than those of single-strain fermentation (p < 0.05).
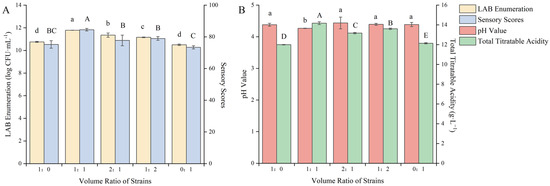
Figure 1.
Effect of the volume ratio of fermentation strains on the quality of blueberry and corn peptide fermented. Note: Different upper- and lower-case letters on the same bar indicate a significant difference within the group (p < 0.05). Effect of the volume ratio of fermentation strains on viable count of LAB and sensory evaluation (A); effect of the volume ratio of fermentation strains on pH value and total titratable acidity (B).
The combination of different microbial strains can affect the growth and metabolism of bacteria, resulting in significant differences in fermentation speed and metabolites [26]. Therefore, there were differences in the viable count of LAB after fermentation of mixed strains. When the volume ratio of the strains was 1:1, the viable count of LAB after fermentation was 11.79 log CFU/mL, the sensory score was 84.50 points and the total acid content was 14.18 g/L, all reaching the maximum values. It was evident that when the volume ratio of strain ZYN-0417 and ZYN-0221 was 1:1, the optimal symbiotic condition was attained, which can facilitate growth. The mutual metabolic action among bacteria can also be employed to modify the substrate. At this point, the color, taste, appearance, and odor of the blueberry and corn peptide after fermentation were all satisfactory, and the viable count of LAB was increased to 1.03 log CFU/mL and 1.28 log CFU/mL, respectively, compared to the single-strain fermentation. The symbiotic relationship between L. rhamnosus and Lp. plantarum was obvious in this fermentation system. Lactobacillin produced during the fermentation process of Lp. plantarum can effectively inhibit the growth of miscellaneous bacteria in the early stage of fermentation. The metabolite of L. rhamnosus is mainly L-lactic acid, which can rapidly reduce the pH value of the fermentation broth and create a more suitable growth environment for LAB. When L. rhamnosus and Lp. plantarum were combined, the promotion effect between the strains was obvious and they grew rapidly in the new fermentation environment and accelerated the fermentation process. However, the symbiotic relationship depends on the proportion of bacteria. Once the structure of the bacteria is unbalanced, the symbiotic relationship will break down, resulting in a decrease in biomass accumulation. Cong Shanzi et al. [27] used L. rhamnosus and Limosilactobacillus fermentum as fermentation strains to ferment corn protein hydrolysate. The results showed that the optimal ratio for the synergistic fermentation of the two strains was 3:1. At that, the viable count of LAB was 3.73 and 9.49 times that of a single-strain fermentation, respectively. When the ratio of the mixed starter culture (ZYN-0417, ZYN-0221) was 1:1, the sensory score, total acid content, and pH value reached the optimum. It was similar to the results of Liao et al. [28] who studied the mixed LAB (the ratio of Li. fermentum and Lp. plantarum was 1:1) as the starter culture for fermenting blueberry juice. Therefore, the volume ratio of the strains was selected as 1:1 to further optimize the fermentation process.
3.1.2. Effect of Corn Peptide Addition on the Quality of Fermented Blueberry Corn Peptide
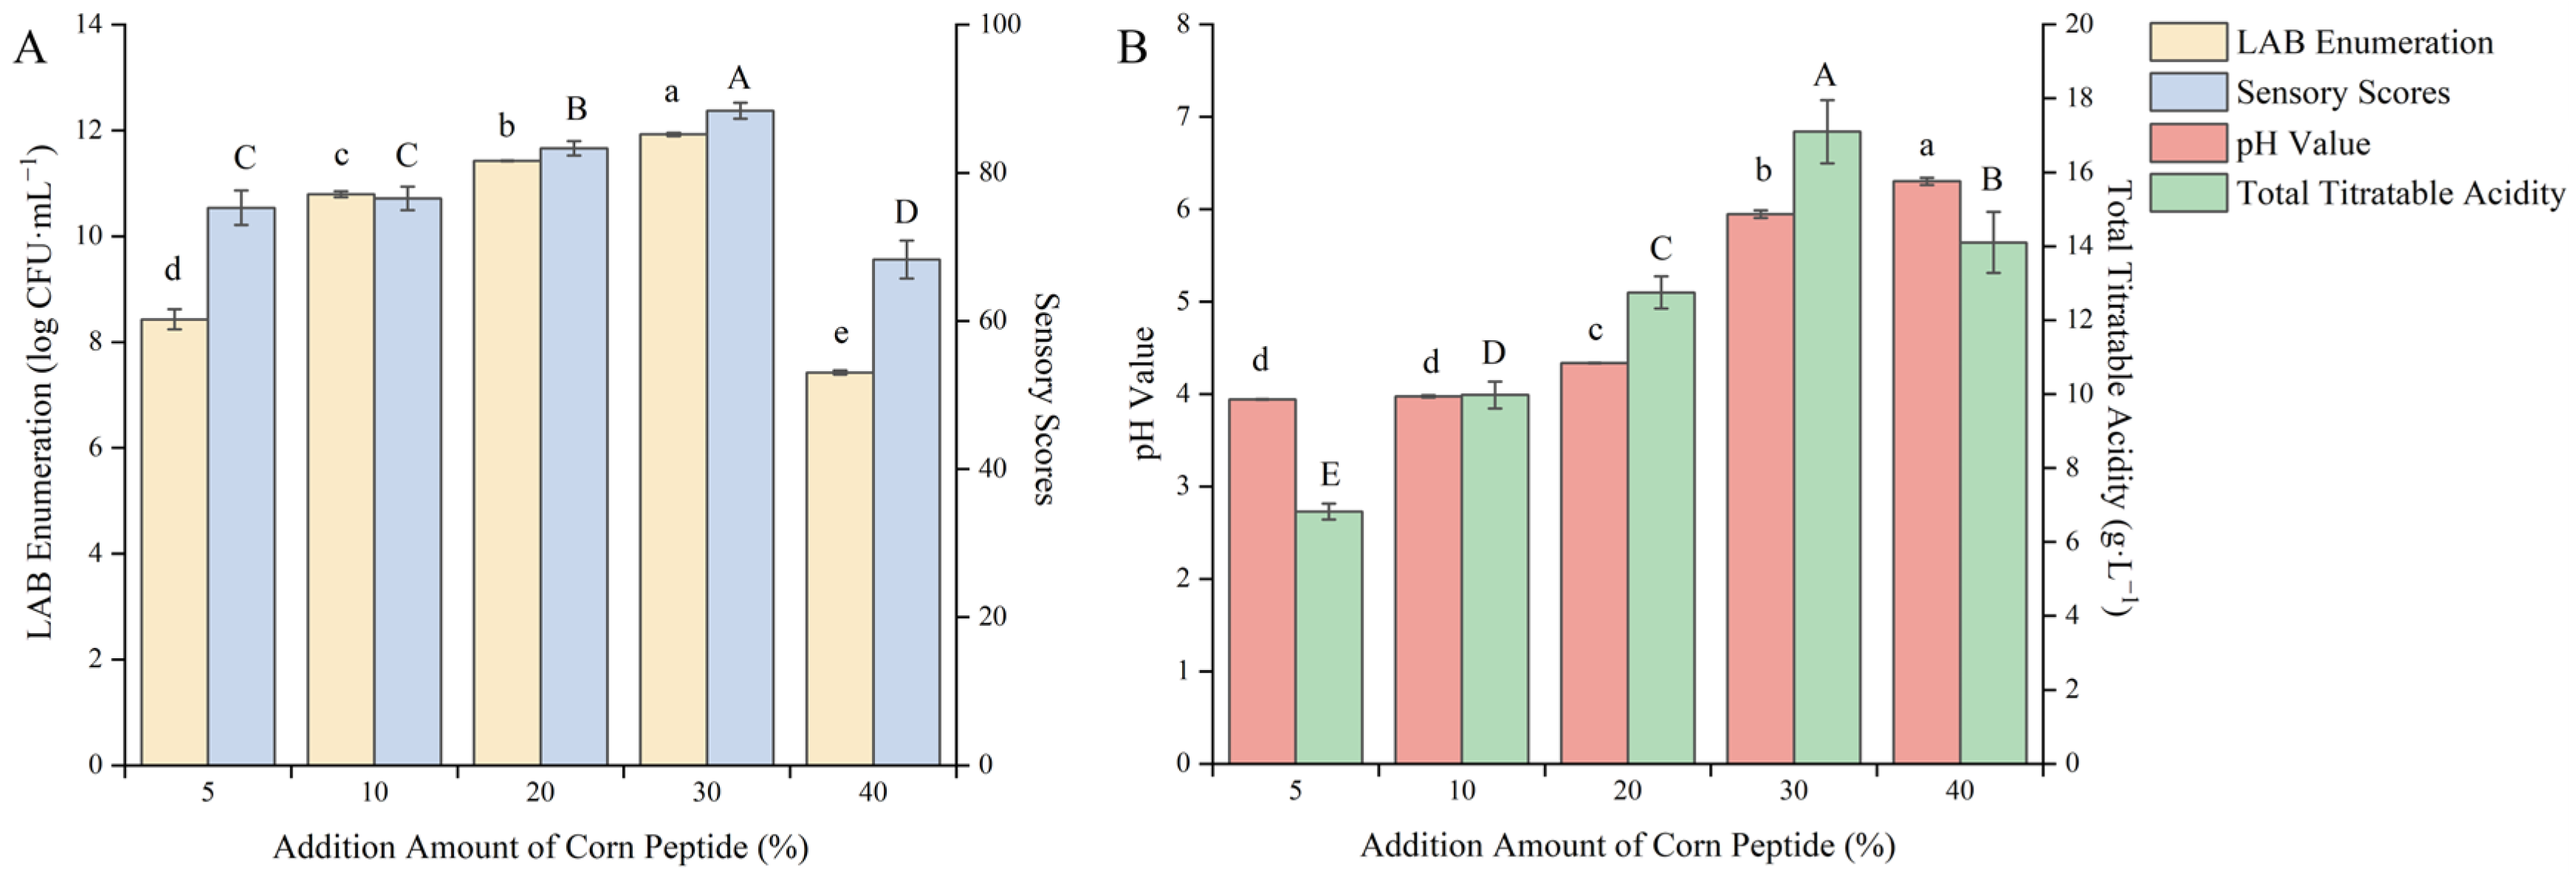
Corn peptide has good solubility. Adding it to the substrate can not only provide a sufficient nitrogen source for the growth of LAB, but also adjust the pH value of the fermentation broth, enhance the functionality of the product, and improve the flavor of the fermentation [29]. As shown in Figure 2, as the addition amount of corn peptide increases continuously, the viable count of LAB, sensory score, pH value, and total acid content rose accordingly.

Figure 2.
Effect of the addition amount of corn peptide on the quality of blueberry and corn peptide fermented. Note: Different upper- and lower-case letters on the same bar indicate a significant difference within the group (p < 0.05). Effect of the addition amount of corn peptide on viable count of LAB and sensory evaluation (A); effect of the addition amount of corn peptide on pH value and total titratable acidity (B).
When the addition amount of corn peptide was 30%, the viable count of LAB, sensory score, and total acid content reached 11.42 log CFU/mL, 88.37 points, and 17.1 g/L, respectively, all reaching the maximum values. When the addition amount of corn peptide continues to increase, the viable count of LAB, sensory score, and total acid content begin to decrease. When the addition amount of corn peptide was 5–20%, the low initial pH value limited the growth rate of the fermentation strain, and the accumulation of lactic acid was insufficient within the fermentation time, which could not well mask the bitterness of the corn peptide, resulting in a poor sensory experience. When the addition amount of corn peptide exceeded 30%, the fluidity of the liquid was poor, which affected the growth of LAB, the taste was bitter, and the color was darker, thus affecting the sensory experience. When the addition amount of corn peptide was 30%, the fermentation environment was more suitable for the growth of mixed LAB, and the viable count of LAB reached the maximum value. At the same time, a certain amount of lactic acid had also accumulated, which better covered the original bitterness of the corn peptide. The color, taste, and appearance of the fermentation broth were good, with a harmonious taste and an acceptable acidity. After careful consideration, the addition amount of corn peptide was selected as 30% to further optimize the fermentation process. The addition of corn peptide can serve as a supplement to the nitrogen element required for the growth of LAB. As the addition amount of corn peptide increased, the viable count of LAB increased. Mo et al. [30] used brewer’s yeast to ferment wort supplemented with peptides of different molecular weights and found that the yeast biomass in wort supplemented with wheat gluten hydrolysate increased by 11.5%. Peptides with a molecular weight of less than 1 kDa decreased rapidly during the fermentation process, and the assimilation rate exceeded 50% at the end of the fermentation, while peptides with a molecular weight of more than 10 kDa remained almost unchanged. Therefore, nitrogen sources with smaller molecular weights are more easily utilized by microorganisms, and an appropriate addition to the fermentation substrate can promote the growth of microorganisms.
3.1.3. Effect of the Addition of Blueberry Juice on the Quality of Fermented Blueberry Corn Peptide
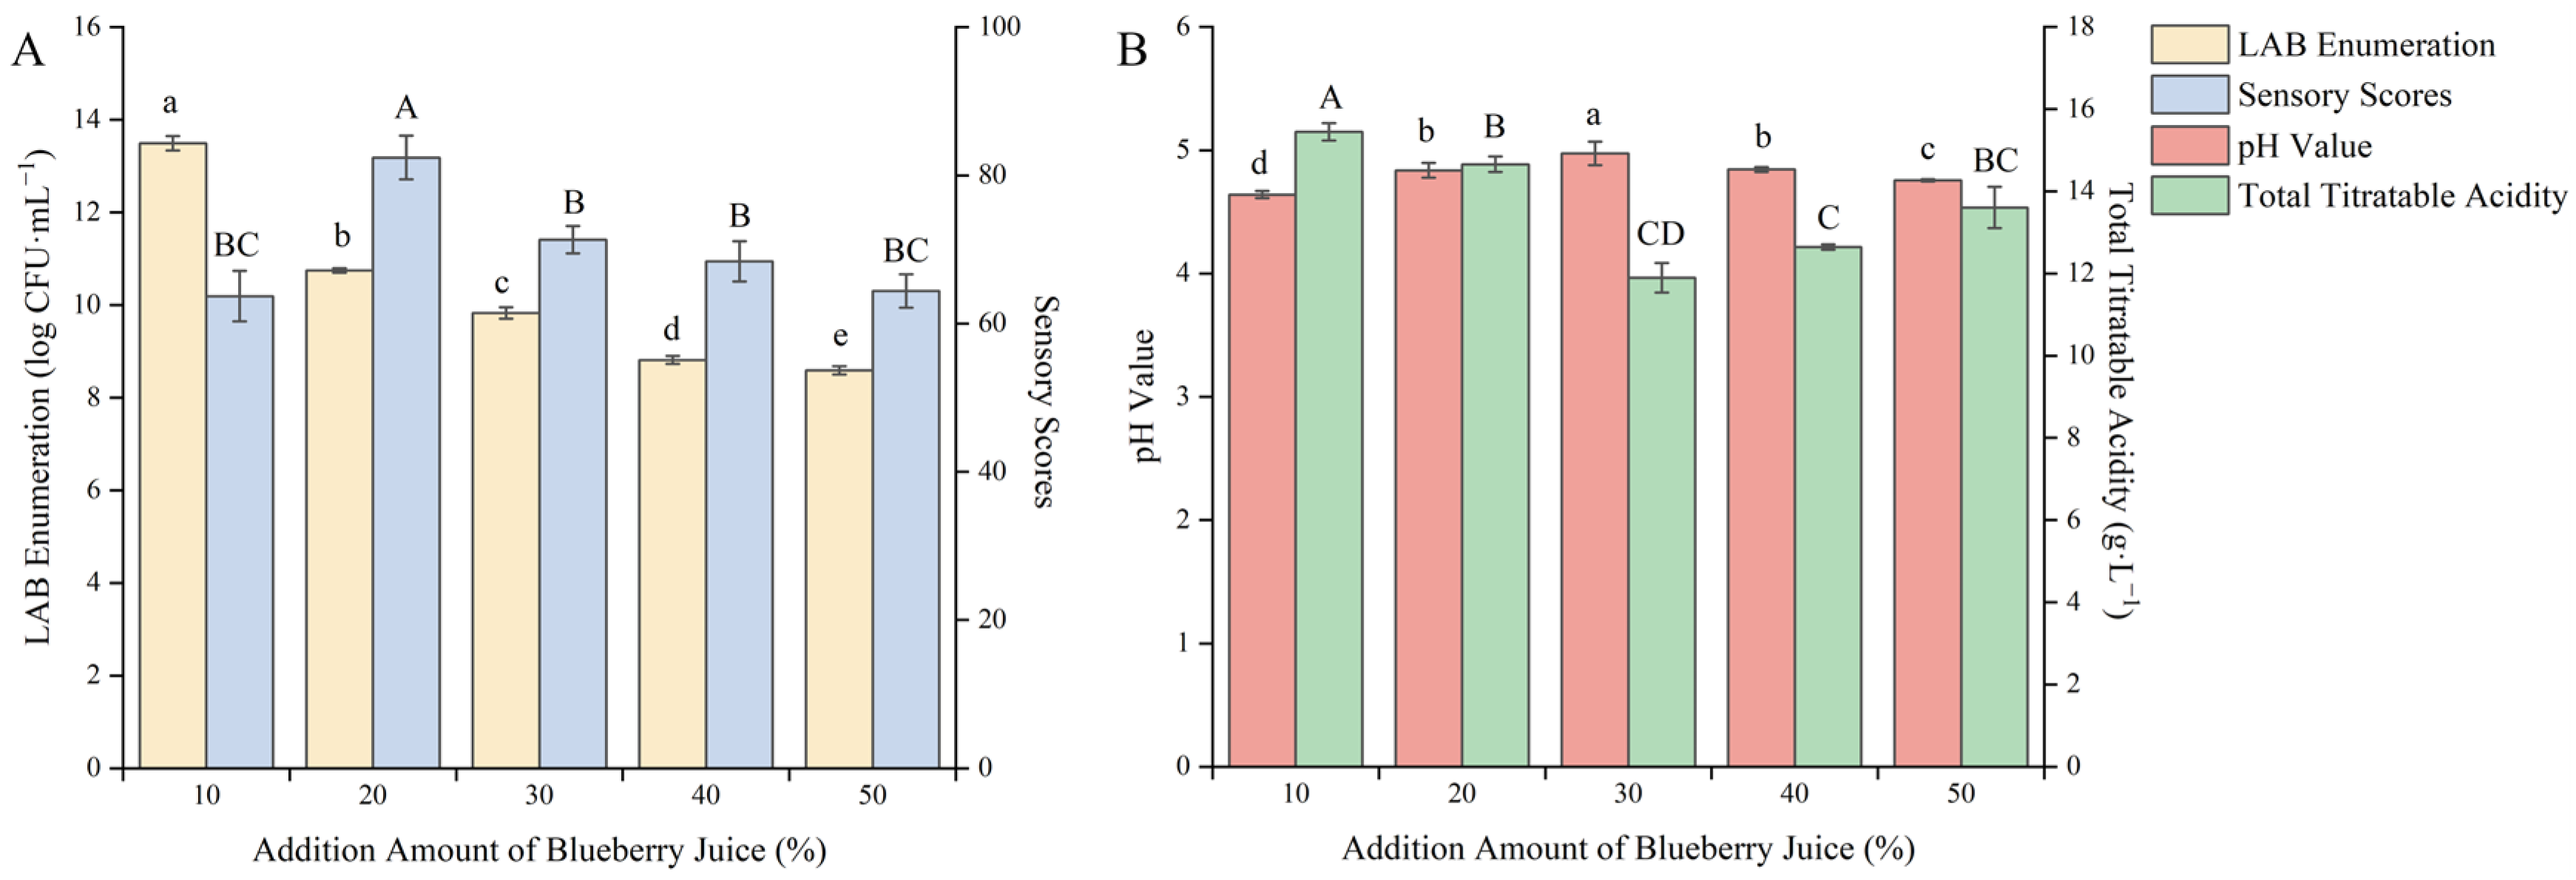
Blueberry fruit contains various anthocyanins, phenolic acids, and flavonoids, which can improve the functionality of the product and increase the flavor of the berry when added to the substrate. However, the acidity of blueberry fruit is relatively high, resulting in a slow growth rate of lactic acid bacteria [31]. Therefore, it is necessary to investigate the addition amount of blueberry juice. As shown in Figure 3, with the increase in the addition amount of blueberry juice, the sensory score and pH value showed a trend of first increasing and then decreasing, the total acid content showed a trend of first decreasing and then increasing, and the viable count of LAB showed a gradually decreasing trend.
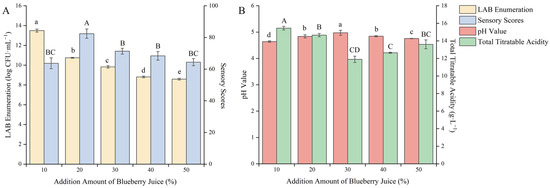
Figure 3.
Effect of the addition amount of blueberry juice on the quality of blueberry and corn peptide fermented. Note: Different upper- and lower-case letters on the same bar indicate a significant difference within the group (p < 0.05). Effect of the addition amount of blueberry juice on viable count of LAB and sensory evaluation (A); effect of the addition amount of blueberry juice on pH value and total titratable acidity (B).
This may be because the acidity of blueberry juice is too high, which slows down the growth rate and metabolic capacity of the strain. When the addition amount of blueberry juice was 10%, the viable count of LAB reached a maximum value of 13.49 log CFU/mL, but there was a pungent sour and rotten smell after fermentation. When the addition amount of blueberry juice was 20%, the sensory score reached a maximum value of 82.40 points and at this time the total acid content was 14.65 g/L. It can be seen that the addition amount of blueberry juice had a great influence on product quality. After careful consideration, the addition amount of blueberry juice was selected as 20% to further optimize the fermentation process.
Research showed that adjusting the initial pH value of blueberry juice could enable LAB to grow rapidly in it. Kuo et al. [32] studied the fermentation of Chenopodium formosanum Koidz using LAB and found that when the pH value was 5.55, the LAB grew well and significantly increased the number of phenolic compounds and the scavenging ability of DPPH and ABTS+ free radicals. Thus, the initial pH value of the fermentation broth had a great influence on the growth of LAB and the functionality of the product. Therefore, in this study, it was necessary to determine the addition amount of blueberry juice and corn peptide and adjust the initial pH value of fermentation to ensure the smooth progress of the fermentation.
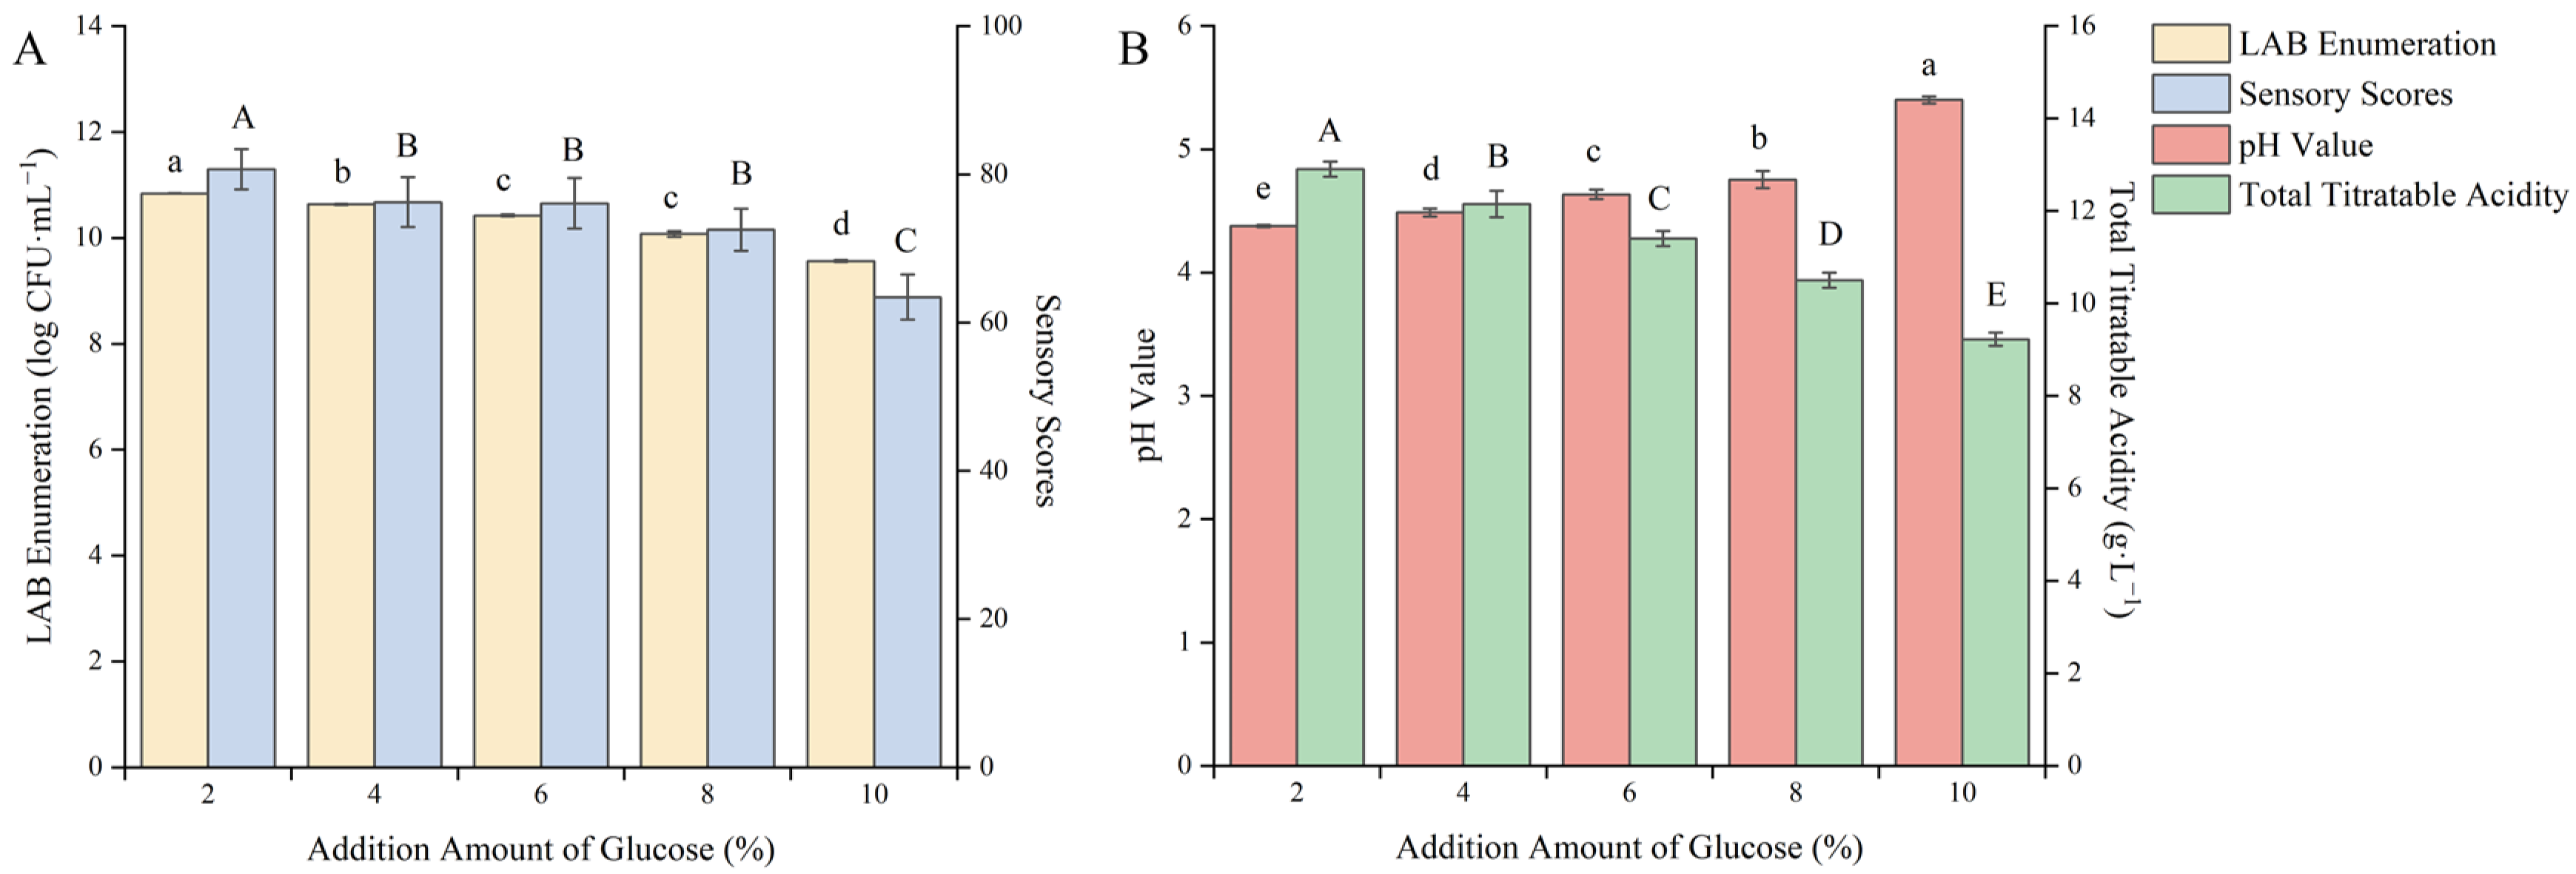
3.1.4. Effect of Glucose Addition on the Quality of Fermented Blueberry Corn Peptides
Moderate supplementation of carbon elements during the fermentation process can accelerate the growth of fermentation strains and shorten the adaptation period for fermentation strains to enter the new fermentation environment. Glucose is a kind of monosaccharide that can be utilized by LAB and has the highest utilization rate. It is a good carbon source for LAB fermentation. Adding it to the fermentation broth can not only promote the rapid growth of LAB but also mask the fermentation odor and enhance the taste [33]. As shown in Figure 4, with the increase in the addition amount of glucose, the pH value gradually increased and the viable count of LAB, the total acid content and the sensory score gradually decreased.
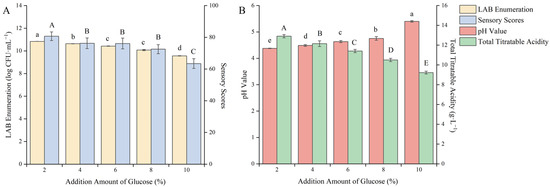
Figure 4.
Effect of the addition amount of glucose on the quality of blueberry and corn peptide fermented. Note: Different upper- and lower-case letters on the same bar indicate a significant difference within the group (p < 0.05). Effect of the addition amount of glucose on viable count of LAB and sensory evaluation (A); effect of the addition amount of glucose on pH value and total titratable acidity (B).
It may be due to the excessive sugar content, which changed the osmotic pressure inside and outside the cells of the strain, causing some cells to rupture and resulting in the death of the strains. When the addition amount of glucose was 2%, the viable count of LAB reached the highest value of 10.84 log CFU/mL, the sensory score was 80.8 points, the total acid content was 12.90 g/L, and the pH value was 4.38. It indicated that under the condition of this amount of glucose addition, the growth of LAB could be effectively promoted, and the taste and smell of the fermented product were also more acceptable. After careful consideration, the 2% glucose addition amount was selected to further optimize the fermentation process.
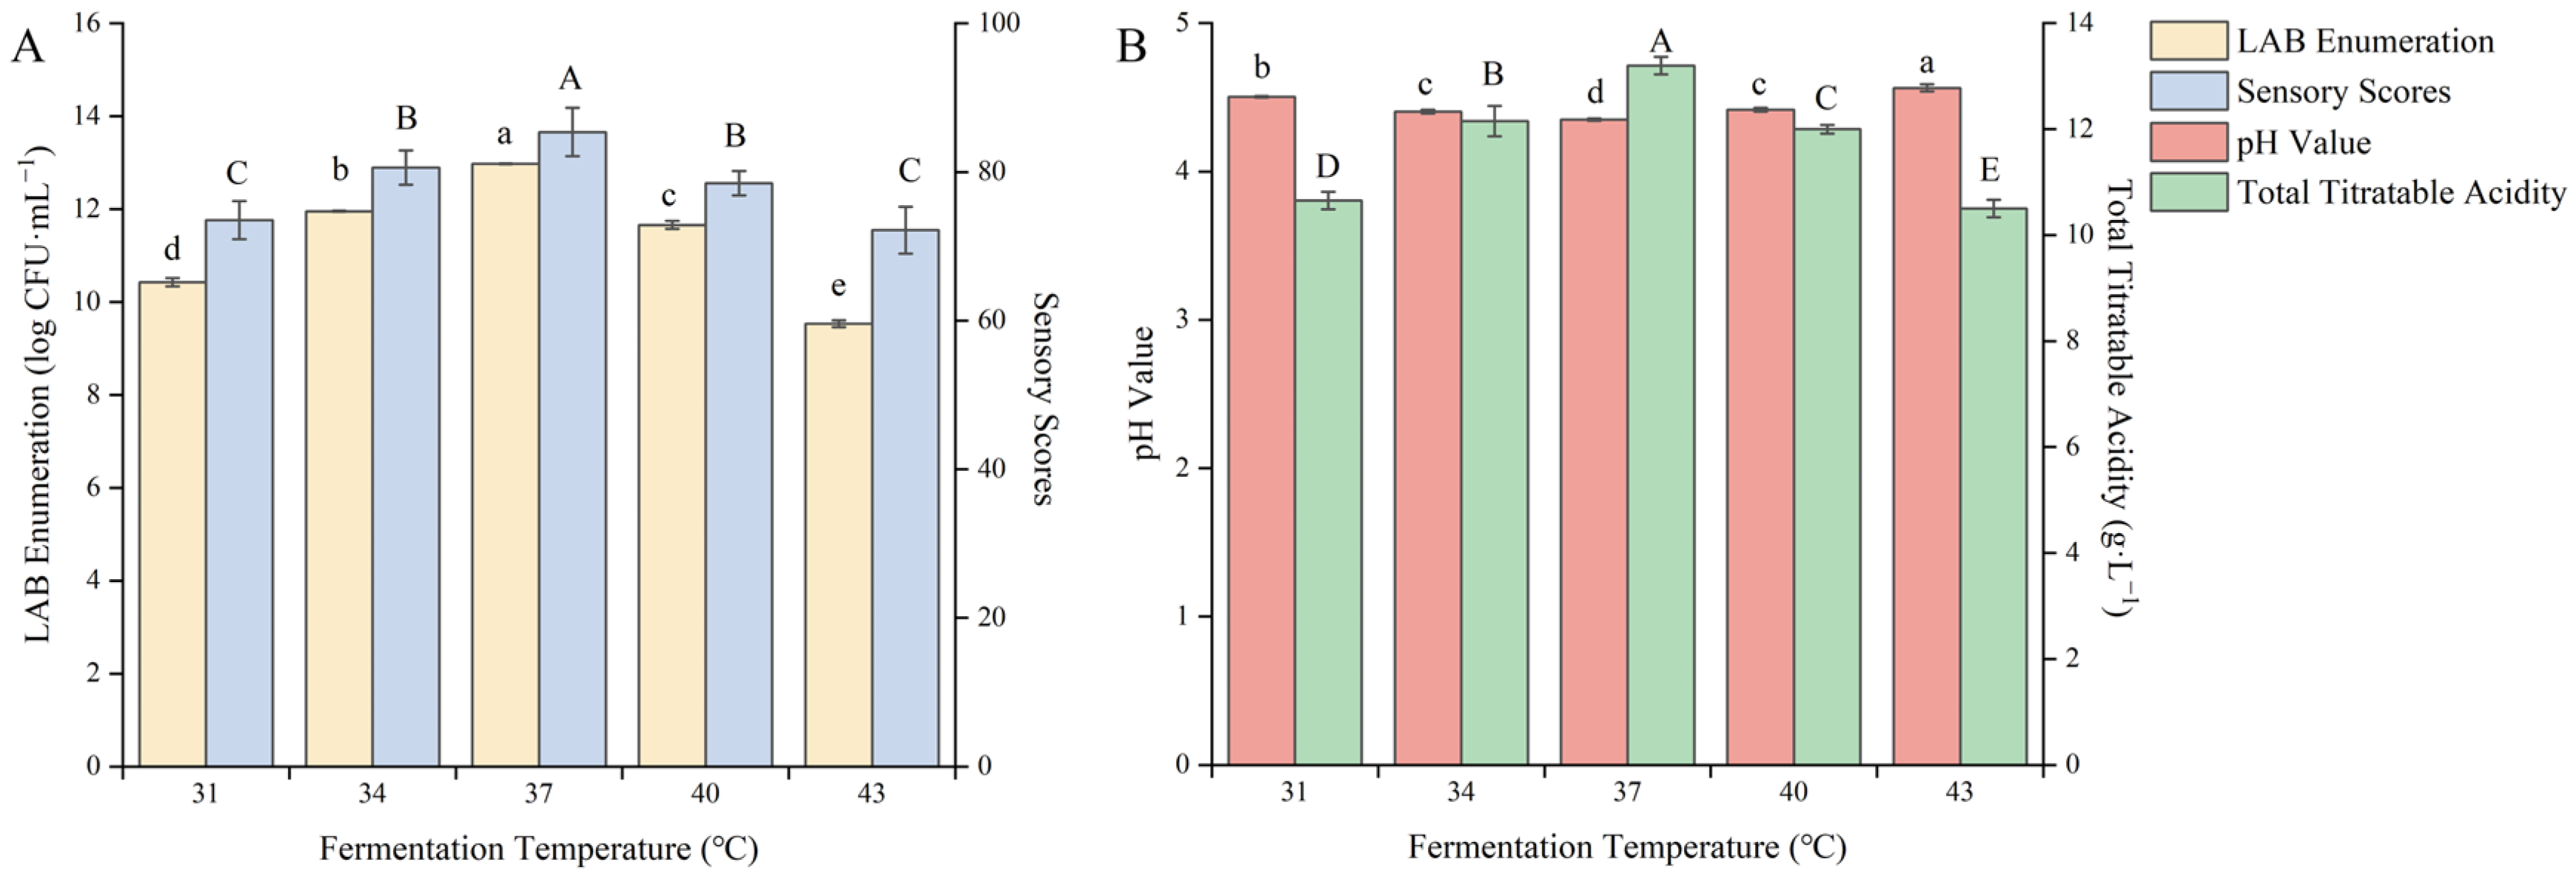
3.1.5. Effect of Fermentation Temperature on the Quality of Fermented Blueberry Corn Peptides
The optimal fermentation temperature varies for different strains, and different fermentation environments can also change the optimal temperature for strain fermentation, affecting their growth rate and metabolite levels [34]. Therefore, the fermentation temperature needs to be optimized. As shown in Figure 5, different fermentation temperatures had a significant impact on the quality of the fermented product (p < 0.05).
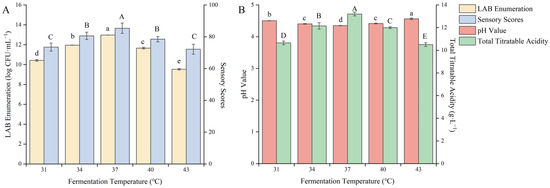
Figure 5.
Effect of the fermentation temperature on the quality of blueberry and corn peptide fermented. Note: Different upper- and lower-case letters on the same bar indicate a significant difference within the group (p < 0.05). Effect of the fermentation temperature on viable count of LAB and sensory evaluation (A); effect of the fermentation temperature on pH value and total titratable acidity (B).
With increasing fermentation temperature, the pH value decreased, and the viable count of LAB and the total acid content gradually increased. When the fermentation temperature was 37 °C, the viable count of LAB, total acid content and sensory score appeared to be the maximum value, which was 12.98 log CFU/mL, 13.20 g/L, and 85.37 points, respectively. With a continuous increase in the fermentation temperature, the viable count of LAB and the total acid content showed a downward trend. It was a sign that LAB in the symbiotic state is more sensitive to fermentation temperature. Too high or too low temperatures will slow down their growth rate, reduce biomass, slow down the metabolic rate, and reduce the accumulation of metabolites. The appropriate fermentation temperature can effectively promote the synergistic growth of LAB in the new fermentation system and improve the metabolic accumulation of the strain [35]. After careful consideration, the fermentation temperature was selected as 37 °C to further optimize the fermentation process.
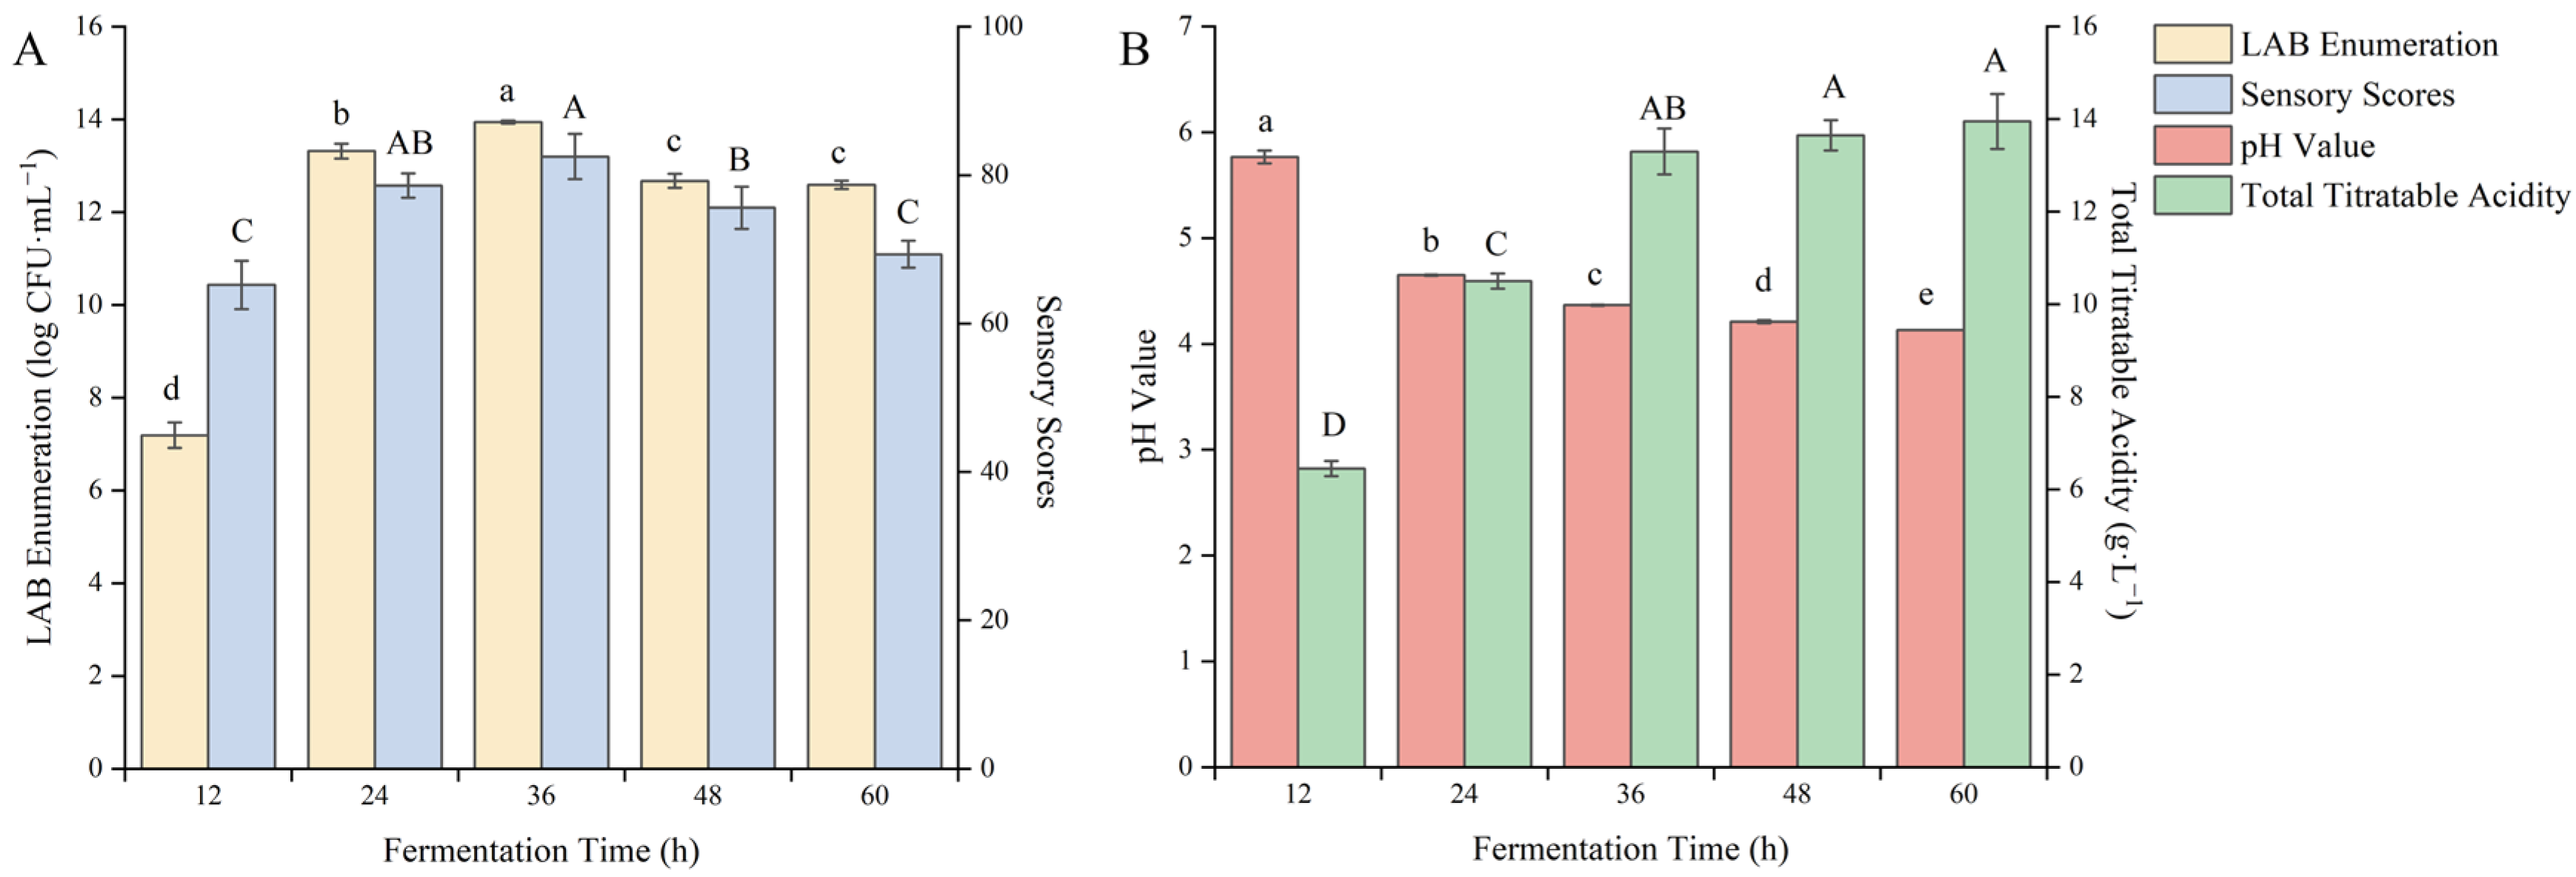
3.1.6. Effect of Fermentation Time on the Quality of Fermented Blueberry Corn Peptides
Fermentation time is one of the main factors affecting the reproduction and metabolism of LAB [36]. As shown in Figure 6, as the fermentation time continued to extend, the pH value gradually decreased, the total acid content continuously increased, and the sensory score and the viable count of LAB showed a trend of increasing first and then decreasing.

Figure 6.
Effect of the fermentation time on the quality of blueberry and corn peptide fermented. Note: Different upper- and lower-case letters on the same bar indicate significant differences within groups (p < 0.05). Effect of the fermentation time on viable count of LAB and sensory evaluation (A); effect of the fermentation time on pH value and total titratable acidity (B).
When the fermentation time was 36 h, the viable count of LAB reached 13.94 log CFU/mL and the sensory score of 82.50 points both reached the maximum. After that, the total acid content was 13.3 g/L. With the extension of the fermentation time, there was no significant change in total acid content, while the viable count of LAB and the sensory score showed a downward trend. It may be the result of the consumption of carbon and nitrogen elements in the substrate over time, resulting in changes in the fermentation environment. With the short fermentation time, fermentation was incomplete, taste and smell were uncoordinated, and the sensory score was low. With the long fermentation time, the growth of the strain reached the stationary phase and metabolites continued to accumulate, resulting in excessive total acid, which would severely affect the sensory score. After careful consideration, the fermentation time was selected as 36 h to further optimize the fermentation process.
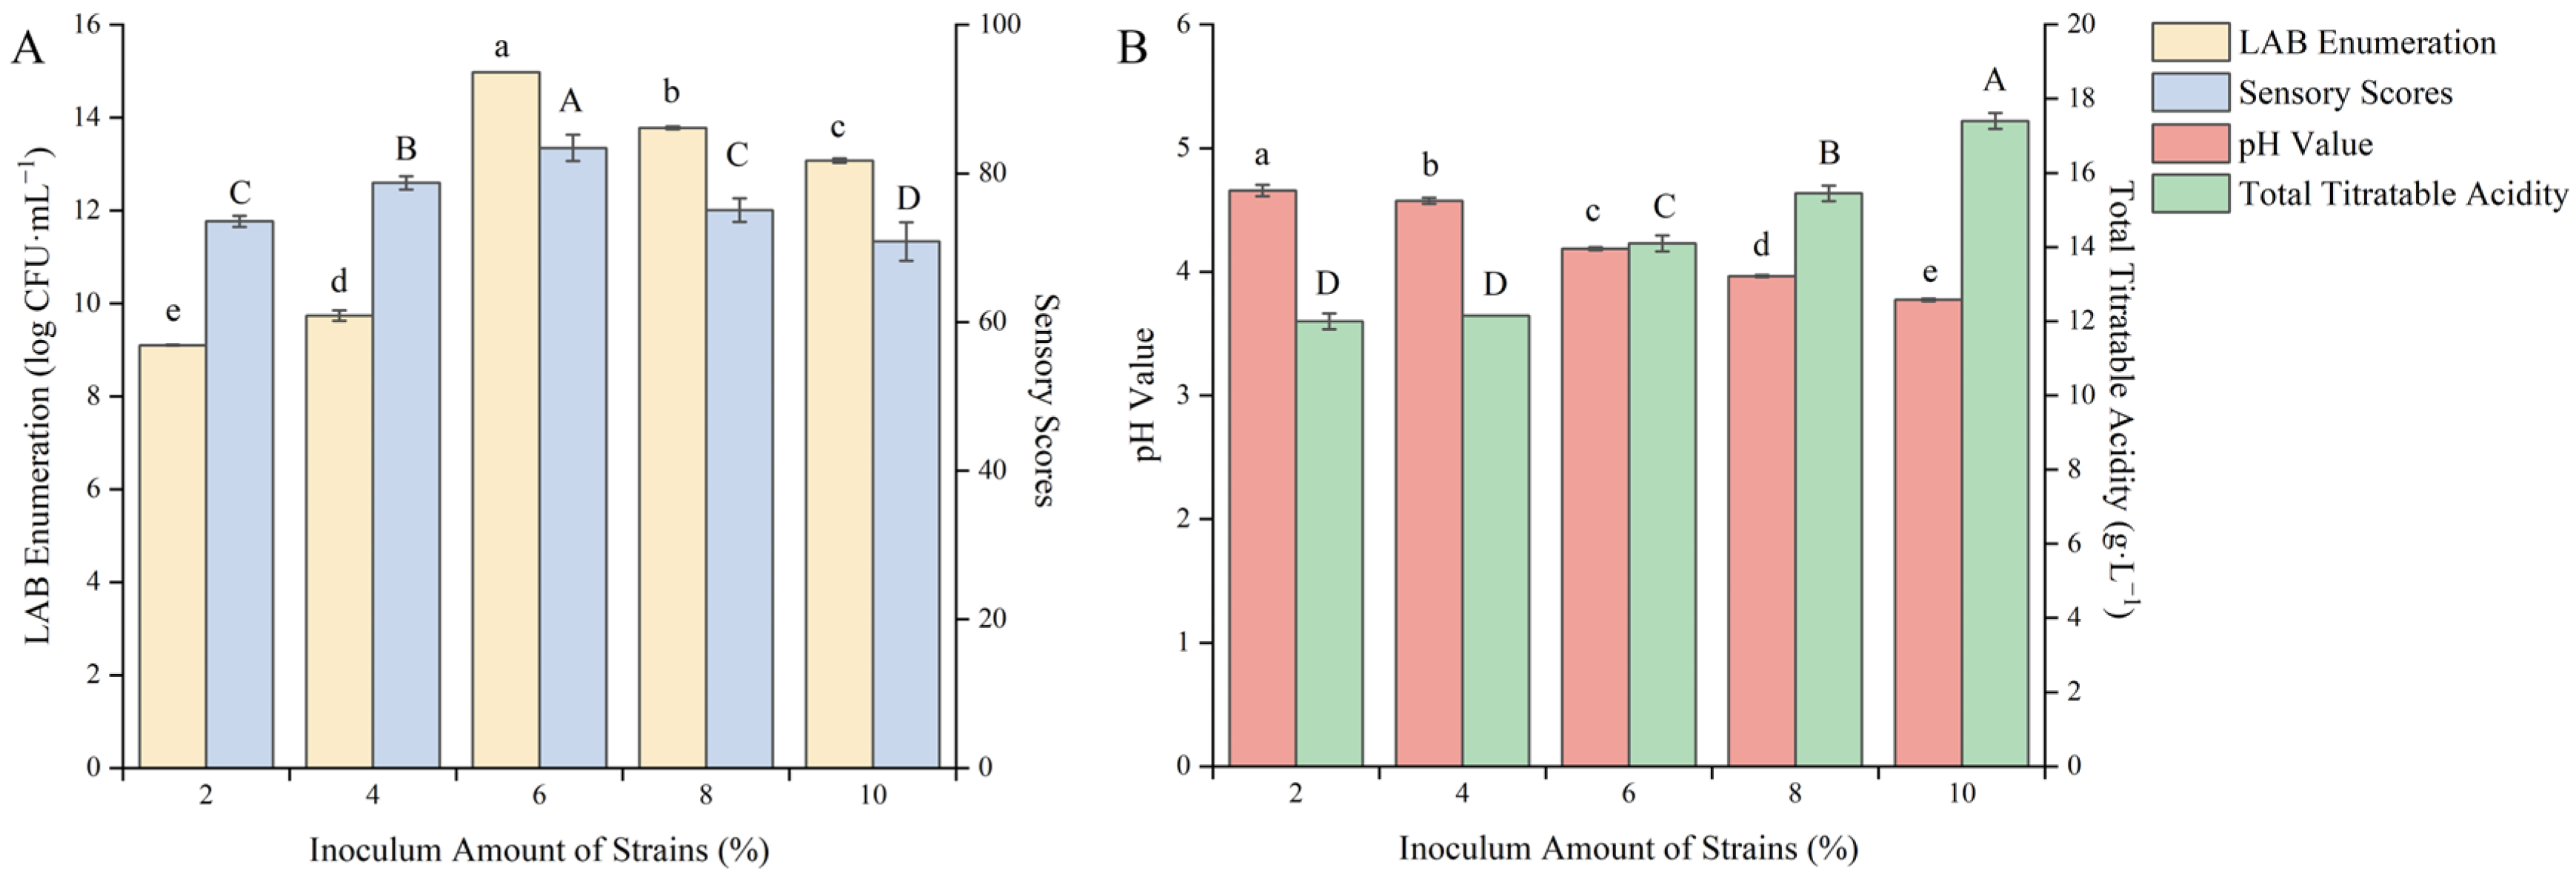
3.1.7. Effect of the Fermentation Strain Inoculum on the Quality of Fermented Blueberry Corn Peptides
The appropriate amount of inoculation can accelerate the growth rate of LAB in the new environment, making the product have higher quality [37]. As shown in Figure 7, with the increase in inoculation amount, the total acid content gradually increased, the pH value gradually decreased, and the viable count of LAB and the sensory score gradually increased.

Figure 7.
Effect of the inoculum amount of fermentation strains on the quality of blueberry and corn peptide fermented. Note: Different upper- and lower-case letters on the same bar indicate significant differences within groups (p < 0.05). Effect of the inoculum amount of fermentation strains on viable count of LAB and sensory evaluation (A); effect of the inoculum amount of fermentation strains on pH value and total titratable acidity (B).
When the inoculation amount was 6%, the viable count of LAB reached 14.98 log CFU/mL, and the sensory score of 83.43 points reached the maximum. At that time, the pH value was 4.19 and the total acid content was 14.10 g/L. With the continuous increase in the inoculation amount, the viable count of LAB and the sensory score decreased. This may be due to the excessive inoculation amount, the early reproduction of the bacteria being too fast, the excessive acidity caused by metabolic accumulation, or the fermentation environment becoming harsh. In addition, the supply of nutrients was insufficient at the later stage, resulting in the decline and death of bacteria and affecting taste and smell [38]. After careful consideration, the fermentation inoculation amount was selected as 6% to further optimize the fermentation process.
3.2. Plackett–Burman Design
Rapid growth and metabolism of microorganisms in the fermentation system can improve flavor and increase the content of bioactive substances of raw materials, thus achieving the objective of improving their nutrition and functionality [31]. Due to the high acidity of blueberry juice, it is difficult for microorganisms to grow and multiply well in it. Currently, in related research on fermented blueberry juice, the method of compounding other raw materials or adjusting the pH value is generally adopted to ensure the normal growth of microorganisms. Therefore, based on the results of the single factor test, with the fixed strain volume ratio of 1:1 and the viable count of LAB (Y) as the index, the Plackett–Burman design was carried out to screen the factors that have a significant impact on fermentation and continue to optimize the conditions of the fermentation process. The experimental design and results are shown in Table 4.
Table 4.
Plackett–Burman experimental design with experimental results.
According to the Plackett–Burman design, the regression equation was obtained as follows:
Y = 12.06 − 0.38A + 2.36B + 0.098C + 0.22D − 0.20E + 0.53F
The model F value was 124.68, the p-value was < 0.0001, which showed a highly significant R2 = 0.9934, the adjusted coefficient was R2Adj = 0.9854, and the coefficient of variation (CV) was 2.59%, which was small, meaning the model was reliable. From the p-value in Table 5, the factors affecting fermentation in descending order were fermentation time (B) > the addition amount of corn peptide (F) > inoculation amount (A) > the addition amount of glucose (D) > the addition amount of blueberry juice (E) > fermentation temperature (C). Among them, fermentation time (B) and the addition amount of corn peptide (F) were extremely significant factors affecting fermentation, and inoculation amount (A) was a significant factor affecting fermentation.
Table 5.
Regression analysis (ANOVA) of Plackett–Burman.
From the regression equation, the partial regression coefficient of factor B was 2.36, indicating that the effect of factor B on the viable count of LAB was a positive effect, that is, as factor B increases, the viable count of LAB showed an upward trend. Factor A had a negative effect and factor F had a positive effect. Comprehensive results of the Plackett–Burman design, taking the viable count of LAB as the index and fixing the fermentation conditions: the addition amount of glucose 2%, the addition amount of blueberry juice 20%, fermentation temperature 37 °C. The steepest climbing experiment was designed for the three factors of inoculation amount, fermentation time and the addition amount of corn peptide, and the results are shown in Table 6.
Table 6.
Experimental results of the steepest climb.
Table 6 showed that the viable count of LAB reached the maximum at the 4th level, and the viable count of LAB at the 3rd and 5th levels was less than the maximum. Therefore, the fermentation parameters at the 4th level were selected as the experimental parameters of the central point of the response surface methodology.
3.3. Response Surface Methodology
Based on the above experimental results, taking the viable count of LAB as the response value, fixing the fermentation conditions with a strain volume ratio of 1:1, the addition amount of blueberry juice at 20%, the fermentation temperature at 37 °C, and the addition amount of glucose at 2%. The response surface methodology design was carried out for the three factors that significantly affected fermentation, namely the inoculation amount, fermentation time, and corn peptide addition amount. The results are shown in Table 7.
Table 7.
Response surface methodology results of the optimal fermentation conditions.
3.3.1. Analysis of Fermentation Condition Response Surface Regression Model
The results of the response surface methodology design are analyzed in Table 7, and the results of the variance analysis of the regression model are shown in Table 8. Taking the viable count (Y) as the response value, and the inoculation amount (A), fermentation time (B), and corn peptide addition amount (C) as variables, the quadratic equation obtained through regression fitting was as follows:
Y = 15.10 + 0.51a − 1.09b − 1.22c + 1.28ab − 0.05ac + 0.06bc − 1.18a2 − 1.40b2 − 1.15c2
Table 8.
Analysis of variance for the regression model.
The model F value was 271.26, and p < 0.0001 indicated that the difference in the regression model was extremely significant. The p-value of the lack-of-fit term was 0.6852 > 0.05, indicating that it was not significant. The coefficient determination of the model R2 = 0.9971, the adjusted coefficient R2adj = 0.9935, and the prediction coefficient R2Pred = 0.9838, indicating that the regression model had a high degree of fitting to the experimental data, could reflect the actual situation and could analyze and predict the experimental results. It can be seen from the p-value (Table 8) that the first-order terms A, B, C, the interaction term AB, and the quadratic terms A2, B2, and C2 had extremely significant effects on the viable count of bacteria in fermentation (p < 0.01). According to the F value, the order of the effects of each factor on the viable count of LAB was the addition amount of corn peptide (C) > fermentation time (B) > inoculation amount (A). The order of the effects of interaction on the viable count of LAB was as follows: AB > BC > AC.
3.3.2. Response Surface Methodology Interaction Analysis
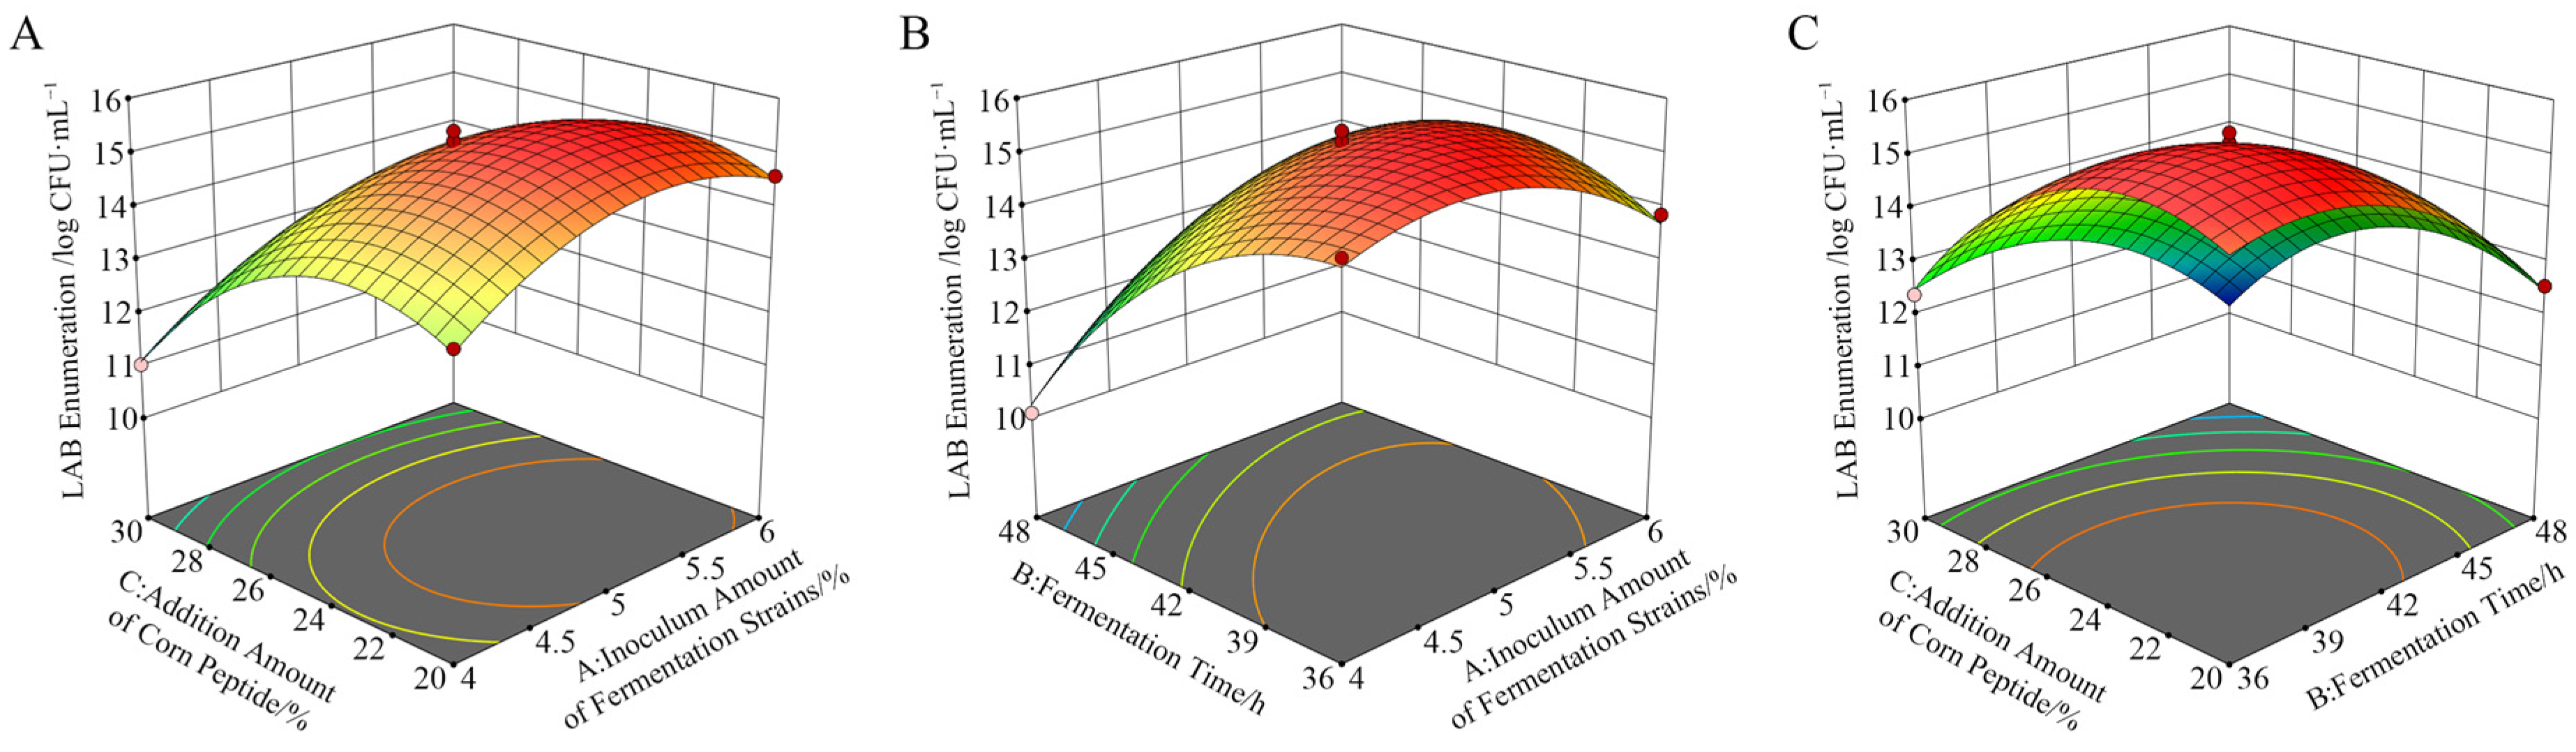
The influence of the interaction of each factor on the viable count of LAB is shown in Figure 8. When the fermentation time was fixed, the viable count of LAB increased first and then decreased with the increase in the inoculation amount. Conversely, when the inoculation amount was fixed, the viable count of LAB increased first and then decreased with the extension of the fermentation time. The contour line was elliptical, indicating that the interaction between the inoculation amount and fermentation time was significant (Figure 8B). There were obvious quadratic relationships between the addition amount of corn peptide and the inoculation amount, the addition amount of corn peptide, and the fermentation time on the viable count of LAB, respectively. However, the contour lines were approximately circular, indicating that the interaction is not significant (Figure 8A,C).

Figure 8.
Response surface diagram of the interaction of each factor on the viable count of LAB. Plot of interaction between inoculum amount and corn peptide addition (A); plot of interaction between inoculum amount and fermentation time (B); plot of interaction between fermentation time and corn peptide addition (C).
The optimal fermentation process parameters obtained from the response surface methodology were as follows: the inoculation amount was 5.19% (v/v), the fermentation time was 39.73 h, the addition amount of corn peptide was 21.52% (w/v) and the logarithmic value of viable LAB count was 15.5815 log CFU/mL. According to the optimization results and the actual situation, the experimental scheme was adjusted. Finally, the fermentation conditions were determined as follows: the inoculation amount was 5% (v/v), the fermentation time was 40 h, the addition amount of corn peptide was 22% (w/v), the addition amount of blueberry juice was 20% (v/v), the addition amount of glucose was 2% (w/v), and the fermentation temperature was 37 °C. Under these conditions, the verification test was carried out and the logarithmic value of viable LAB count was 16.28 ± 0.10 log CFU/mL, which was close to the predicted result. Therefore, the response surface methodology was used to optimize the conditions of the fermentation process with accurate and feasible results.
3.4. Quality Evaluation of Lactobacillus Fermented Blueberry Corn Peptides
3.4.1. Determination of Physical and Chemical Indicators of Blueberry and Corn Peptide Fermented by Mixed Lactic Acid Bacteria
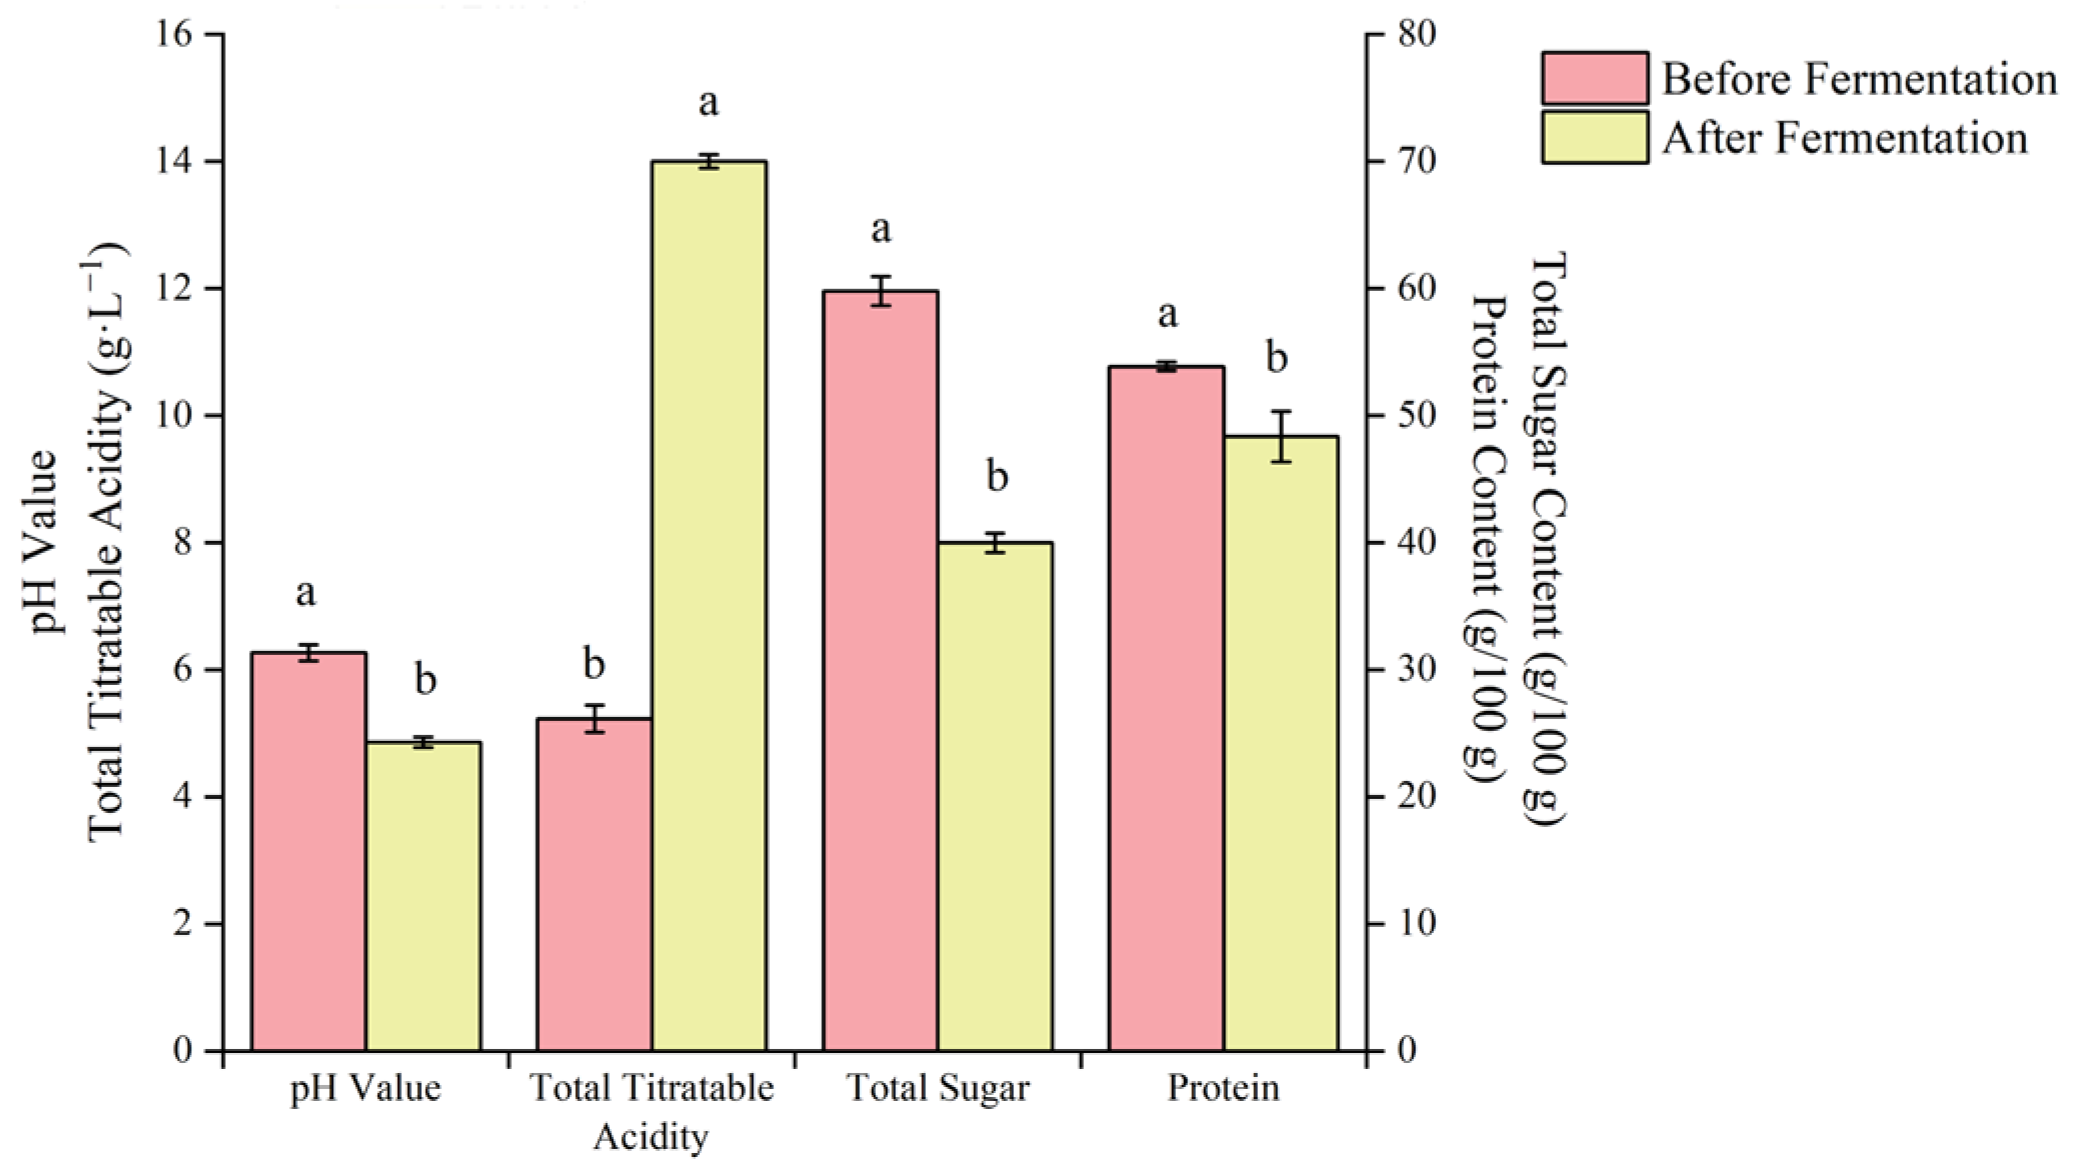
Fermentation experiments were carried out under optimal technological conditions, and the physicochemical indexes of blueberry and corn peptide were determined before and after fermentation (Figure 9). After the fermentation of the blueberry and corn peptide, the pH value decreased by 1.41, the total acid content (calculated as lactic acid) increased by 8.77 g/L, the total sugar content decreased by 19.82 g/100 g, and the protein content decreased by 5.53 g/100 g (Figure 10). It can be seen that a large amount of sugar and protein was consumed and a significant amount of organic acid accumulated during the fermentation of blueberry and corn peptide by synergistic fermentation of LAB, resulting in an increase in total acid content and a decrease in pH value [36].

Figure 9.
The changes of physicochemical indexes before fermentation and after fermentation of blueberry and corn peptide. Note: Different lowercase letters in the graph indicate significant differences within groups (p < 0.05).

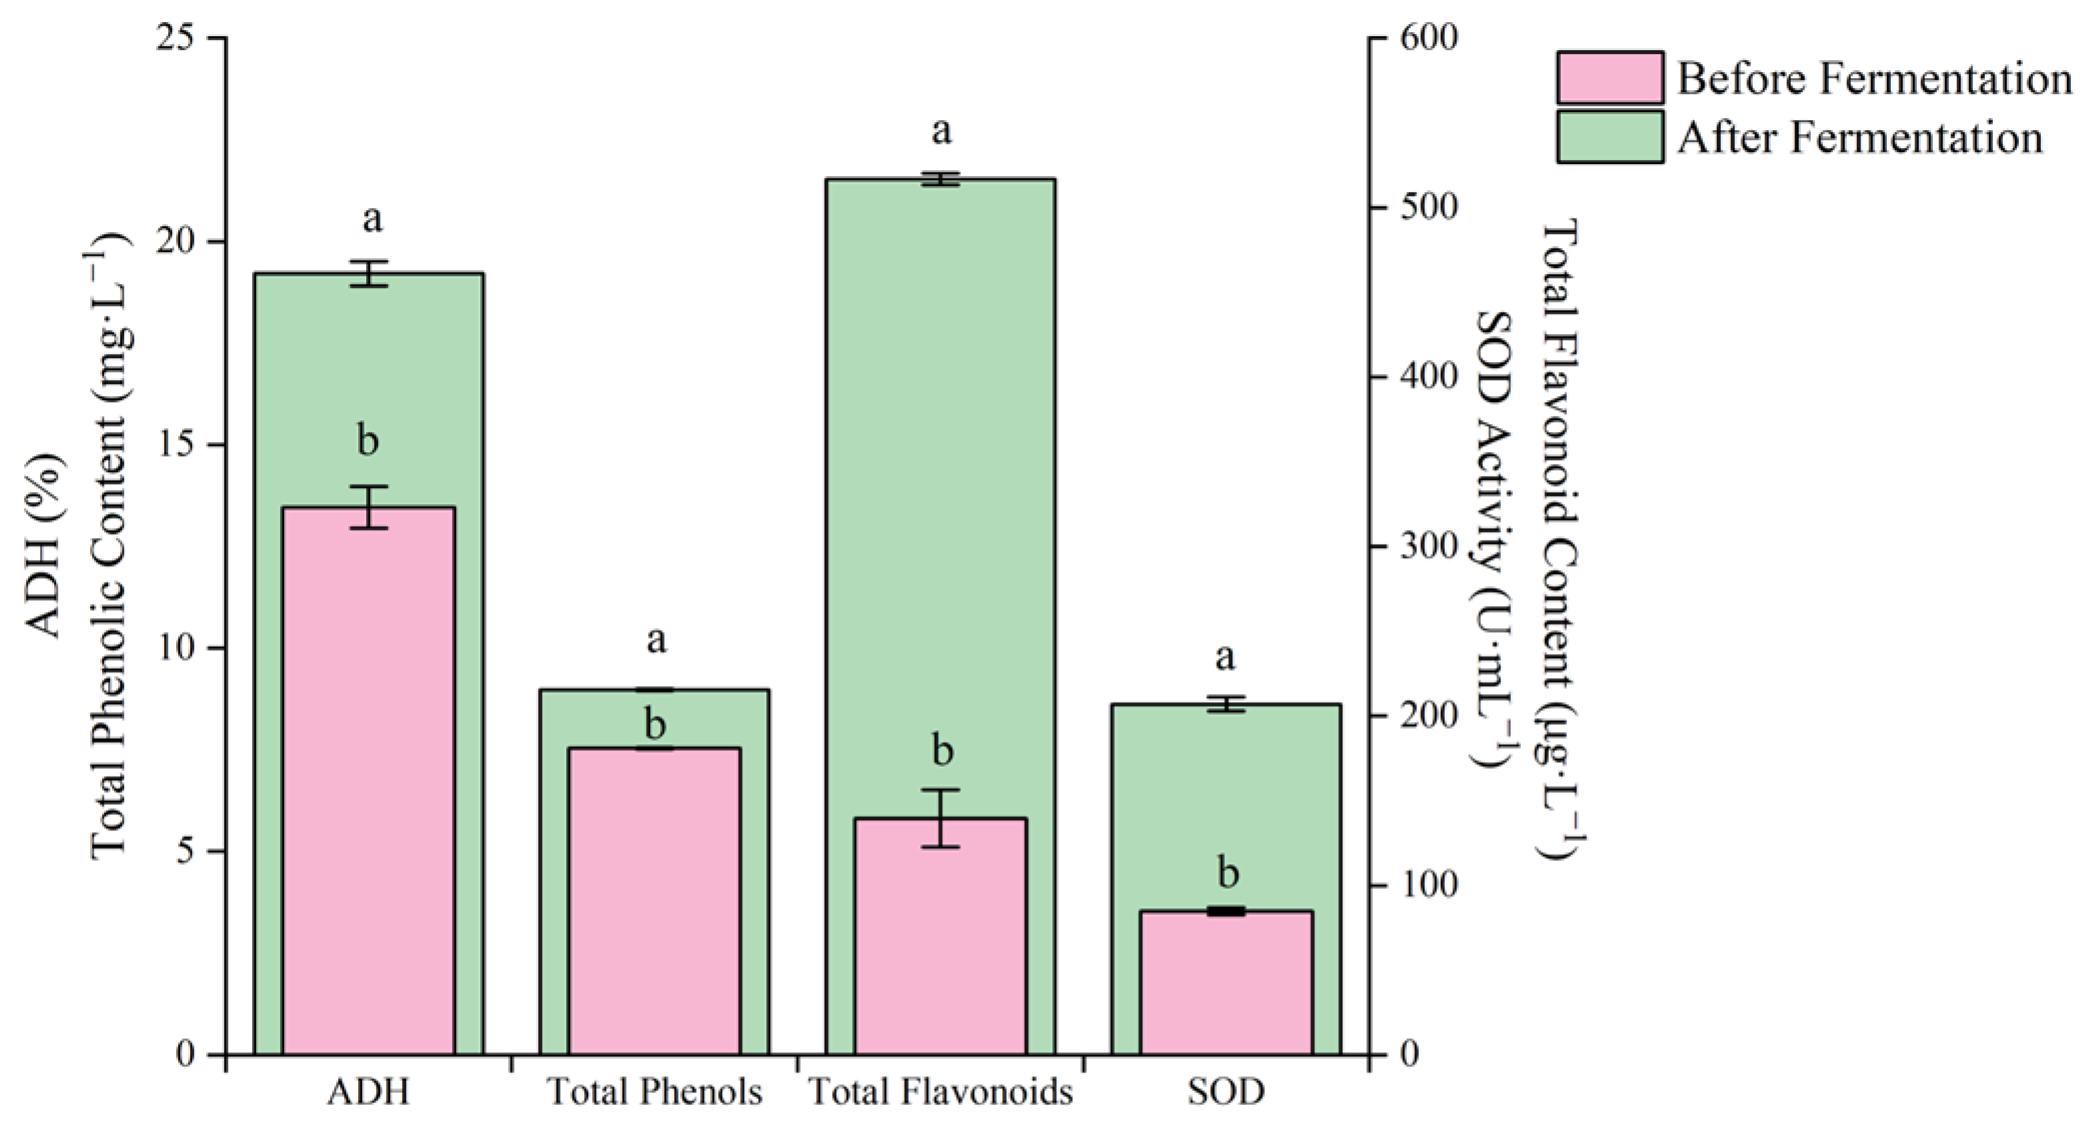
Figure 10.
The changes in active ingredients before fermentation and after fermentation of blueberry and corn peptide. Note: different lowercase letters on the graph indicate significant differences within groups (p < 0.05).
3.4.2. Determination of the Active Ingredients of Blueberry Corn Peptides Fermented with Mixed Lactic Acid Bacteria
The contents of total phenols and total flavonoids of blueberry and corn peptide were significantly increased after fermentation by mixed LAB, and the SOD activity and ADH activation rate also significantly increased (p < 0.01) (Figure 10).
The total flavonoid content increased by 3.70 times, the total phenol content increased by 1.19 times, the SOD activity increased by 2.44 times, and the ADH activation rate increased by 1.42 times, reaching 0.52 mg/L, 8.97 mg/L, 206.89 U/mL and 19.21%, respectively, after fermentation. Among them, the increase in the total phenols and total flavonoids contents may be due to the transformation of some bound polyphenol compounds into free polyphenol compounds after fermentation of LAB, or it may be the result of the combination of hydroxyl groups and alcohols [13]. Wang et al. [39] studied fermented blueberry juice from LAB; the total phenol content increased by a maximum of 799.39 mg/L (gallic acid GAE equivalent) after fermentation, and the total flavonoid content increased by 94.13 mg/mL (rutin Rutin equivalent). Lan et al. [26] studied the fermentation of kiwi juice by single and mixed LAB and found that Lp. plantarum and L. brevis were mixed at a bacteria ratio of 1:2, and the concentrations of esters, ketones, alcohols, and terpenoids in kiwi juice increased significantly after fermentation. Li et al. [5] studied the effect of blueberry juice fermented by different Lp. plantarum on the components of fermentation products and found that the total phenol content in blueberry juice increased by 6.1–81.2%, and the antioxidant capacity in vitro increased by 34.0%. Therefore, the fermentation method of mixed LAB has certain feasibility in increasing the content of active ingredients of blueberry and corn peptide.
3.4.3. Determination of the Antioxidant Activity of Blueberry and Corn Peptide Fermented by Mixed Lactic Acid Bacteria
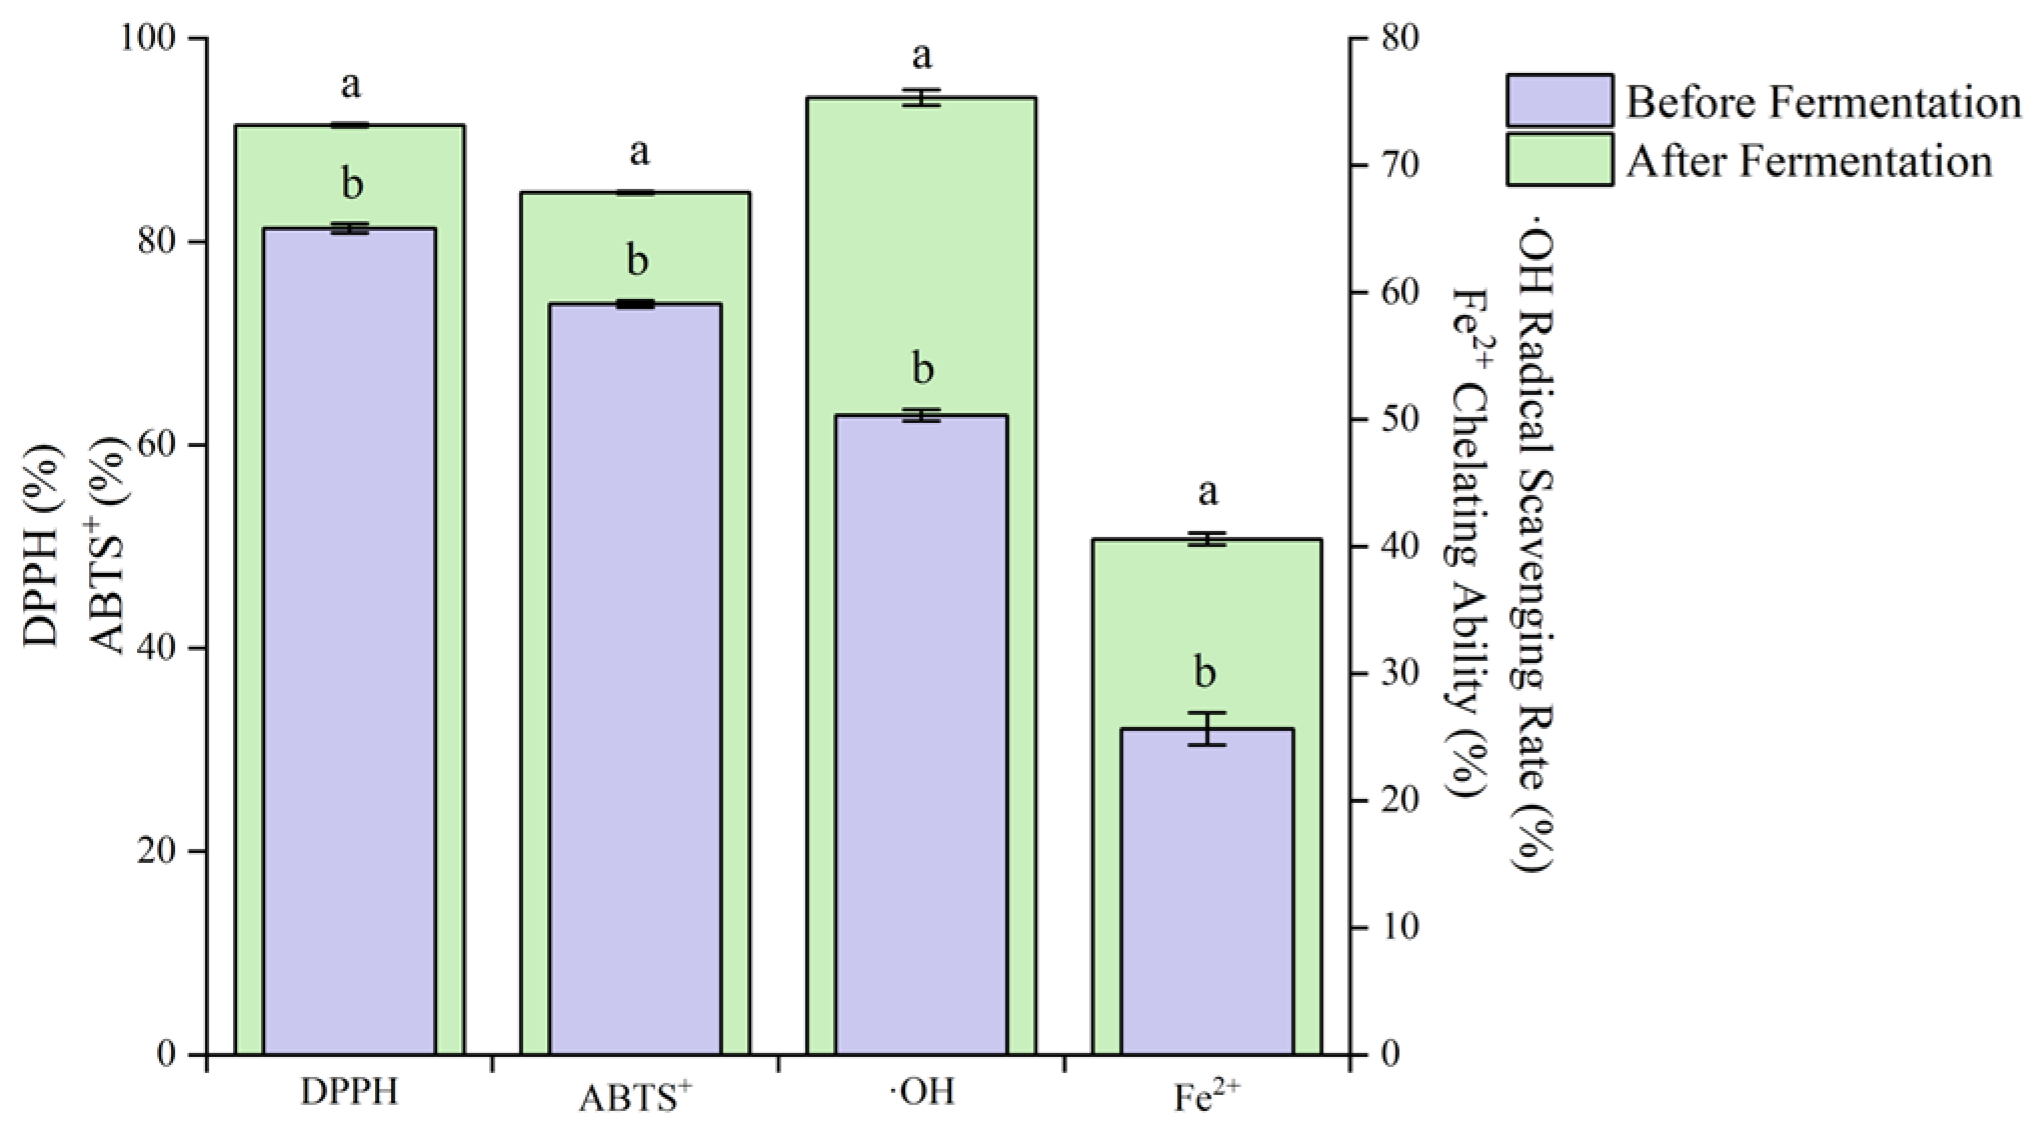
The DPPH, ABTS⁺, OH⁻ free radical scavenging rates and Fe2⁺ chelating ability after fermentation of blueberry and corn peptide increased significantly (p < 0.05) (Figure 11).
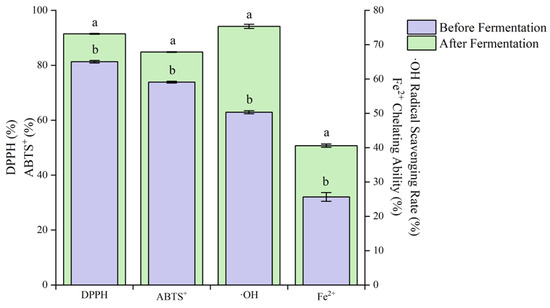
Figure 11.
Antioxidant activity of before fermentation and after fermentation of blueberry and corn peptide. Note: different lowercase letters in the figure indicate significant differences within groups (p < 0.05).
Compared with before fermentation, the DPPH, ABTS⁺ and ·OH⁻ free radical scavenging rates increased by 1.12, 1.15 and 1.50 times, respectively, and the Fe2⁺ chelating ability increased by 1.58 times. Zhao et al. [40] studied Lp. plantarum fermented jujube—wolfberry compound juice. With the increase in fermentation time, the total phenol content increased by 17% at 48 h of fermentation, and the antioxidant capacity increased significantly at the same time. Wu et al. [41] studied the changes of active components in soybean milk fermented by different LABs. The results showed that L. rhamnosus, Lacticaseibacilus paracasei and Lp. plantarum could all enhance the chelating ability of Fe2+ during the fermentation of soybean milk. It can be seen that the antioxidant activity of blueberry and corn peptide can be improved through mixed LAB fermentation, and the increase in antioxidant activity may be related to the changes in the contents of total phenols and total flavonoids [16].
4. Conclusions
In this study, blueberry and corn peptide were used as the raw materials, and L. rhamnosus ZYN-0417 and Lp. plantarum ZYN-0221, which were screened from the epidermis of blueberries and had strong probiotic properties, were used as the starter culture. The fermentation process conditions were optimized through a single-factor experiment and a Plackett–Burman design combined with Box–Behnken response surface methodology. The optimal process conditions were as follows: the ratio of L. rhamnosus ZYN-0417 and Lp. plantarum ZYN-0221 was 1:1 (v/v, volume ratio), the addition amount of blueberry juice was 20% (v/v, volume ratio), the addition amount of corn peptide was 22% (w/v, mass ratio), the addition amount of glucose was 2% (w/v, mass ratio), the inoculation amount was 5% (v/v, volume ratio), the fermentation time was 40 h, the fermentation temperature was 37 °C, the viable count of LAB was 16.28 ± 0.10 log CFU/mL. After the fermentation of blueberry and corn peptide by mixed LAB, the pH value, total sugar content, and protein content decreased significantly, while the total acid, total phenols, total flavonoids, SOD activity, and ADH activation rate increased significantly. The DPPH, ABTS+, ·OH- free radical scavenging ability, and Fe2+ chelating ability of blueberry and corn peptide after fermentation were 1.12, 1.15, 1.50, and 1.58 times higher than those before fermentation, respectively. This study showed that Lp. plantarum and L. rhamnosus can be used as co-fermentation in blueberry and corn peptide and can significantly enhance the content of their active ingredients, the antioxidant capacity of the product, and the nutritional quality.
Author Contributions
Conceptualization, N.H. and S.C.; formal analysis, S.C. and X.Z.; funding acquisition, N.H.; investigation, S.C., X.Z. and H.Z.; methodology, S.C. and X.Z.; supervision, N.H.; validation, H.Z. and M.S.; writing—original draft, S.C.; writing—review and editing, N.H. All authors have read and agreed to the published version of the manuscript.
Funding
This research was funded by the Ministry of Fundamental Research Funds in Heilongjiang Provincial Universities (No. 145109318).
Institutional Review Board Statement
Not applicable.
Informed Consent Statement
Not applicable.
Data Availability Statement
The original contributions presented in the study are included in the article, and further inquiries can be directed to the corresponding author.
Acknowledgments
We would like to thank the reviewers for their comments on an earlier version of this paper. Thanks to my daughter Ruoyu Hu for bringing me good luck and I wish her a happy second birthday.
Conflicts of Interest
The authors declare no conflict of interest.
References
- Wu, X.L.; Wang, T.T.Y.; Prior, R.L.; Pehrsson, P.R. Prevention of Atherosclerosis by Berries: The Case of Blueberries. J. Agric. Food Chem. 2018, 66, 9172–9188. [Google Scholar] [CrossRef]
- Xing, Y.G.; Yang, S.; Xu, Q.L.; Xu, L.; Zhu, D.; Li, X.L.; Shui, Y.R.; Liu, X.C.; Bi, X.F. Effect of Chitosan/Nano-TiO2 Composite Coating on the Postharvest Quality of Blueberry Fruit. Coatings 2021, 11, 512. [Google Scholar] [CrossRef]
- Diaconeasa, Z.; Iuhas, C.I.; Ayvaz, H.; Rugina, D.; Stanila, A.; Dulf, F.; Bunea, A.; Socaci, S.A.; Socaciu, C. Phytochemical Characterization of Commercial Processed Blueberry, Blackberry, Blackcurrant, Cranberry, and Raspberry and Their Antioxidant Activity. Antioxidants 2019, 8, 540. [Google Scholar] [CrossRef] [PubMed]
- Dimitrellou, D.; Solomakou, N.; Kokkinomagoulos, E.; Kandylis, P. Yogurts Supplemented with Juices from Grapes and Berries. Foods 2020, 9, 1158. [Google Scholar] [CrossRef] [PubMed]
- Li, S.J.; Tao, Y.; Li, D.D.; Wen, G.Z.; Zhou, J.Z.; Manickam, S.; Han, Y.B.; Chai, W.S. Fermentation of Blueberry Juices Using Autochthonous Lactic Acid Bacteria Isolated From Fruit Environment: Fermentation Characteristics and Evolution of Phenolic Profiles. Chemosphere 2021, 276, 130090. [Google Scholar] [CrossRef]
- Hamdan, N.; Lee, C.H.; Wong, S.L.; Fauzi, C.E.N.C.A.; Zamri, N.M.A.; Lee, T.H. Prevention of Enzymatic Browning by Natural Extracts and Genome-editing: A Review on Recent Progress. Molecules 2022, 27, 1101. [Google Scholar] [CrossRef]
- Liu, X.L.; Wang, J.T.; Liu, Y.; Cui, N.; Wang, D.Y.; Zheng, X.Q. Conjugation of the Glutelin Hydrolysates-glucosamine by Transglutaminase and Functional Properties and Antioxidant Activity of the Products. Food Chem. 2022, 380, 132210. [Google Scholar] [CrossRef] [PubMed]
- Liu, X.L.; Song, C.L.; Chen, J.P.; Liu, X.; Ren, J.; Zheng, X.Q. Preparation and Evaluation of New Glycopeptides Obtained by Proteolysis from Corn Gluten Meal Followed by Transglutaminase-induced Glycosylation with Glucosamine. Foods 2020, 9, 555. [Google Scholar] [CrossRef]
- Wang, X.J.; Liu, X.L.; Zheng, X.Q.; Qu, Y.; Shi, Y.G. Preparation of Corn Glycopeptides and Evaluation of Their Antagonistic Effects on Alcohol-induced Liver Injury in Rats. J. Funct. Foods 2020, 66, 103776. [Google Scholar] [CrossRef]
- Mirzapour-Kouhdasht, A.; Moosavi-Nasab, M.; Kim, Y.M.; Eun, J.B. Antioxidant Mechanism, Antibacterial Activity, and Functional Characterization of Peptide Fractions Obtained from Barred Mackerel Gelatin with a Focus on Application in Carbonated Beverages. Food Chem. 2021, 342, 128339. [Google Scholar] [CrossRef]
- Ma, T.T.; Li, C.; Zhao, F.Q.; Cao, J.; Zhang, X.Y.; Shen, X.R. Effects of Co-fermented Collagen Peptide-jackfruit Juice on the Immune Response and Gut Microbiota in Immunosuppressed Mice. Food Chem. 2021, 365, 130487. [Google Scholar] [CrossRef] [PubMed]
- Li, T.L.; Jiang, T.; Liu, N.; Wu, C.Y.; Xu, H.D.; Lei, H.J. Biotransformation of Phenolic Profiles and Improvement of Antioxidant Capacities in Jujube Juice by Select Lactic Acid Bacteria. Food Chem. 2021, 339, 127859. [Google Scholar] [CrossRef]
- Kwaw, E.; Ma, Y.K.; Tchabo, W.; Apaliya, M.T.; Wu, M.; Sackey, A.S.; Xiao, L.L.; Tahir, H.E. Effect of Lactobacillus Strains on Phenolic Profile, Color Attributes and Antioxidant Activities of Lactic-acid-fermented Mulberry Juice. Food Chem. 2018, 250, 148–154. [Google Scholar] [CrossRef]
- Duan, W.H.; Guan, Q.J.; Zhang, H.L.; Wang, F.Z.; Lu, R.; Li, D.M.; Geng, Y.; Xu, Z.H. Improving Flavor, Bioactivity, and Changing Metabolic Profiles of Goji Juice by Selected Lactic Acid Bacteria Fermentation. Food Chem. 2023, 408, 135155. [Google Scholar] [CrossRef] [PubMed]
- Cong, S.Z.; Zhang, X.X.; Ji, J.; Liu, X.L.; Hu, N. Isolation and Identifcation of Blueberry-derived Lactic Acid Bacteria and Their Probiotic, Antioxidant, and Fermentation Properties. Food Biosci. 2024, 104497. [Google Scholar] [CrossRef]
- Hu, N.; Lei, M.; Zhao, X.L.; Zhang, Z.; Gu, Y.; Zhang, Y.; Wang, S. Analysis of the Microbial Diversity and Characteristics of Fermented Blueberry Beverages from Different Regions. Foods 2020, 9, 1656. [Google Scholar] [CrossRef]
- Hu, N.; Lei, M.; Zhao, X.L.; Wang, Y.Y.F.; Zhang, Y.; Wang, S. Analysis of Microbiota in Hainan Yucha During Fermentation by 16S rRNA Gene High-Throughput Sequencing. J. Food Process. Pres. 2020, 7, e14523. [Google Scholar] [CrossRef]
- Li, Y.F.; Jeong, E.C.; Wang, L.L.; Kim, H.J.; Ahmadi, F.; Kim, J.G. Effects of Sodium Diacetate and Microbial Inoculants on Fermentation of Forage Rye. J. Anim. Sci. Technol. 2023, 65, 96–112. [Google Scholar] [CrossRef]
- Phwan, C.K.; Chew, K.W.; Sebayang, A.H.; Ong, H.C.; Ling, T.C.; Malek, M.A.; Ho, Y.C.; Show, P.L. Effects of Acids Pre-treatment on the Microbial Fermentation Process for Bioethanol Production from Microalgae. Biotechnol. Biofuels 2019, 12, 191. [Google Scholar] [CrossRef]
- Wang, Z.; Zhao, C.B.; Guo, Z.Q.; Li, S.Y.; Zhu, Z.Z.; Grimi, N.; Xiao, J. Fermentation of Betaphycus gelatinum Using Lactobacillus brevis: Growth of Probiotics, Total Polyphenol Content, Polyphenol Profile, and Antioxidant Capacity. Foods 2023, 12, 3334. [Google Scholar] [CrossRef]
- Li, Y.Q.; Zhang, Y.Z.; Dong, L.Z.; Li, Y.; Liu, Y.H.; Liu, Y.; Liu, L.Y.; Liu, L.L. Fermentation of Lactobacillus fermentum NB02 with Feruloyl Esterase Production Increases the Phenolic Compounds Content and Antioxidant Properties of Oat Bran. Food chem. 2024, 437, 137834. [Google Scholar] [CrossRef] [PubMed]
- Mohamad, N.; Manan, H.; Sallehhuddin, M.; Musa, N.; Ikhwanuddin, M. Screening of Lactic Acid Bacteria Isolated from Giant Freshwater Prawn (Macrobrachium rosenbergii) as Potential Probiotics. Aquacult. Rep. 2020, 18, 100523. [Google Scholar] [CrossRef]
- Kim, K.T.; Kim, J.W.; Kim, S.I.; Kim, S.; Nguyen, T.H.; Kang, C.H. Antioxidant and Anti-Inflammatory Effect and Probiotic Properties of Lactic Acid Bacteria Isolated from Canine and Feline Feces. Microorganisms 2021, 9, 1971. [Google Scholar] [CrossRef] [PubMed]
- Lin, C.H.; Wei, Y.T.; Chou, C.C. Enhanced Antioxidative Activity of Soybean Koji Prepared with Various Filamentous Fungi. Food Microbiol. 2006, 23, 628–633. [Google Scholar] [CrossRef] [PubMed]
- Lee, J.J.; Choi, Y.J.; Lee, M.J.; Park, S.J.; Oh, S.J.; Yun, Y.R.; Min, S.G.; Seo, H.Y.; Park, S.H.; Lee, M.A. Effects of Combining Two Lactic Acid Bacteria as a Starter Culture on Model Kimchi Fermentation. Food Res. Int. 2020, 136, 109591. [Google Scholar] [CrossRef]
- Lan, T.; Lv, X.R.; Zhao, Q.Y.; Lei, Y.S.; Gao, C.X.; Yuan, Q.Y.; Sun, X.Y.; Liu, X.B.; Ma, T.T. Optimization of Strains for Fermentation of Kiwifruit Juice and Effects of Mono- and Mixed Culture Fermentation on Its Sensory and Aroma Profiles. Food chem. X 2023, 17, 100595. [Google Scholar] [CrossRef]
- Cong, S.Z.; Cao, Y.J.; Zhang, X.X.; Li, G.L.; Liu, X.L.; Hu, N. Optimization of Technological Conditions and Antioxidant Activity of Corn Protein Hydrolysates Fermented by Lactic Acid Bacteria. Food Res. Dev. 2024, 45, 152–162. [Google Scholar]
- Liao, W.H.; Shen, J.; Manickam, S.; Li, S.J.; Tao, Y.; Li, D.D.; Liu, D.F.; Han, Y.B. Investigation of Blueberry Juice Fermentation by Mixed Probiotic Strains: Regression Modeling, Machine Learning Optimization and Comparison with Fermentation by Single Strain in the Phenolic and Volatile Profiles. Food chem. 2023, 405, 134982. [Google Scholar] [CrossRef]
- Zhou, C.S.; Hu, J.L.; Ma, H.L.; Yagoub, A.E.A.; Yu, X.J.; Owusu, J.; Ma, H.Y.; Qin, X.P. Antioxidant Peptides from Corn Gluten Meal: Orthogonal Design Evaluation. Food Chem. 2015, 187, 270–278. [Google Scholar] [CrossRef]
- Mo, F.; Zhao, H.F.; Lei, H.J.; Zhao, M.M. Effects of Nitrogen Composition on Fermentation Performance of Brewer’s Yeast and the Absorption of Peptides with Different Molecular Weights. Appl. Biochem. Biotech. 2013, 171, 1339–1350. [Google Scholar] [CrossRef]
- Hu, N.; Yang, Q.Q.; Lei, M.; Cong, S.Z.; Wang, S. Process Optimization of Uncooked Blueberry Fermentation by Lactic Acid Bacteria Using Response Surface Methodology. Food Sci. Technol. 2021, 46, 20–28. [Google Scholar]
- Kuo, H.C.; Kwong, H.K.; Chen, H.Y.; Hsu, H.Y.; Yu, S.H.; Hsieh, C.W.; Lin, H.W.; Chu, Y.L.; Cheng, K.C. Enhanced Antioxidant Activity of Chenopodium formosanum Koidz. by Lactic Acid Bacteria: Optimization of Fermentation Conditions. PLoS ONE 2021, 16, e0249250. [Google Scholar] [CrossRef] [PubMed]
- Li, H.; Ramia, N.E.; Borges, F.; Revol-Junelles, A.M.; Vogensen, F.K.; Leisner, J.J. Identification of Potential Citrate Metabolism Pathways in Carnobacterium maltaromaticum. Microorganisms 2021, 9, 2169. [Google Scholar] [CrossRef] [PubMed]
- He, Z.; Chen, H.Y.; Wang, X.Y.; Lin, X.P.; Ji, C.F.; Li, S.J.; Liang, H.P. Effects of Different Temperatures on Bacterial Diversity and Volatile Flavor Compounds During the Fermentation of Suancai, a Traditional Fermented Vegetable Food from Northeastern China. LWT 2020, 118, 108773. [Google Scholar] [CrossRef]
- Wang, Y.; He, L.W.; Xing, Y.Q.; Zhou, W.; Pian, R.Q.; Yang, F.Y.; Chen, X.Y.; Zhang, Q. Bacterial Diversity and Fermentation Quality of Moringa Oleifera Leaves Silage Prepared with Lactic Acid Bacteria Inoculants and Stored at Different Temperatures. Bioresource Technol. 2019, 284, 349–358. [Google Scholar] [CrossRef]
- Madjirebaye, P.; Peng, F.; Huang, T.; Liu, Z.G.; Mueed, A.; Pahane, M.M.; Guan, Q.Q.; Xiao, M.Y.; Du, T.H.; Wei, B.; et al. Effects of Fermentation Conditions on Bioactive Substances in Lactic Acid Bacteria-Fermented Soymilk and Its Storage Stability Assessmen. Food Biosci. 2022, 50, 102207. [Google Scholar] [CrossRef]
- An, Y.Q.; Cai, X.W.; Cong, L.; Hu, Y.; Liu, R.; Xiong, S.B.; Hu, X.B. Quality Improvement of Zhayu, a Fermented Fish Product in China: Effects of Inoculated Fermentation with Three Kinds of Lactic Acid Bacteria. Foods 2022, 11, 2756. [Google Scholar] [CrossRef]
- Zhang, J.; Nie, J.Y.; Li, J.; Zhang, H.; Li, Y.; Farooc, S.; Bacha, S.A.S.; Wang, J. Evaluation of Sugar and Organic Acid Composition and Their Levels in Highbush Blueberries from Two Regions of China. J. Integr. Agr. 2020, 19, 2352–2361. [Google Scholar] [CrossRef]
- Wang, J.; Wei, B.C.; Wei, B.; Yu, H.Y.; Thakur, K.; Wang, C.Y.; Wei, Z.J. Evaluation of phenolics biotransformation and health promoting properties of blueberry juice following lactic acid bacteria fermentation. Food Sci. Technol. 2023, 43, e104522. [Google Scholar] [CrossRef]
- Zhao, X.X.; Tang, F.X.; Cai, W.C.; Peng, B.; Zhang, P.L.; Shan, C.H. Effect of Fermentation by Lactic Acid Bacteria on the Phenolic Composition, Antioxidant Activity, and Flavor Substances of Jujube–Wolfberry Composite Juice. LWT 2023, 184, 114884. [Google Scholar] [CrossRef]
- Wu, H.C.; Shum, T.F.; Chiou, J. Characterization of the Probiotic Potential of Lactic Acid Bacteria Isolated from Kimchi, Yogurt, and Baby Feces in Hong Kong and Their Performance in Soymilk Fermentation. Microorganisms 2021, 9, 2544. [Google Scholar] [CrossRef] [PubMed]
Disclaimer/Publisher’s Note: The statements, opinions and data contained in all publications are solely those of the individual author(s) and contributor(s) and not of MDPI and/or the editor(s). MDPI and/or the editor(s) disclaim responsibility for any injury to people or property resulting from any ideas, methods, instructions or products referred to in the content. |
© 2024 by the authors. Licensee MDPI, Basel, Switzerland. This article is an open access article distributed under the terms and conditions of the Creative Commons Attribution (CC BY) license (https://creativecommons.org/licenses/by/4.0/).