Article

Unveiling Acetobacter syzygii from Tibetan Kefir Grain: Fermentation-Enhanced Anti-Tyrosinase, and Anti-Melanin

by
Lin Zhong
1,†,
Qi He
2,†,
Meng Xu
3,
Fang-Fang Chen
1,3,
Fei Li
1,3 and
Yu-Pei Chen
1,2,3,*
1
Department of Public Health and Medical Technology, Xiamen Medical College, Xiamen 361023, China
2
The School of Public Health, Fujian Medical University, Fuzhou 350122, China
3
Engineering Research Center of Natural Cosmeceuticals College of Fujian Province, Xiamen Medical College, Xiamen 361023, China
*
Author to whom correspondence should be addressed.
These authors contributed equally to this work.
Fermentation 2024, 10(9), 459; https://doi.org/10.3390/fermentation10090459
Submission received: 22 July 2024 / Revised: 26 August 2024 / Accepted: 31 August 2024 / Published: 4 September 2024
(This article belongs to the Section Microbial Metabolism, Physiology & Genetics)

Abstract

:
Acetobacter syzygii CCTCC M 2022983 was isolated and characterized from Tibetan kefir grains, which is utilized as a functional food with diverse bioactive properties. After 6 days of fermentation by A. syzygii, Acetobacter fermented extract (AFE) showed significantly higher antioxidant, anti-tyrosinase, and anti-melanin effects compared to the unfermented yeast extract (UFY). Western blotting confirmed that AFE reduced melanogenesis-related proteins (MITF, TYR, TRP-1, TRP-2). LC-MS/MS analysis identified 4-hydroxybenzoic acid as abundant in AFE, contributing to its antioxidant capacity. Succinic acid and citric acid emerged as the major compound and a type of mixed inhibitor against mushroom tyrosinase, with IC50 values of 2.943 mM and 1.615 mM, respectively. Fluorescence spectra analysis revealed that these acids caused conformational changes in tyrosinase. Moreover, succinic acid and citric acid prevented L-DOPA from auto-oxidation with IC50 values of 0.355 mM and 0.261 mM, respectively. Molecular docking analysis suggested that these acids interacted with the association of the H and L subunits of tyrosinase, thereby reducing its stability. In B16-F10 cells, succinic and citric acids significantly reduced melanin production in a dose-dependent manner. Thus, succinic acid and citric acid revealed promising potential for applications in the food and medicine industries as melanogenesis inhibitors due to their safety.

1. Introduction

Melanin is composed of eumelanin and pheomelanin. Eumelanin is generated from L-tyrosine through a series of catalytic reactions involving enzymes such as tyrosinase, tyrosinase related protein-1 (TRP-1), and tyrosinase related protein-2 (TRP-2) [1]. Additionally, tyrosinase catalyzes the conversion of L-tyrosine to L-dopaquinone. In the presence of cysteine or glutathione, L-dopaquinone is further converted into pheomelanin. Thus, tyrosinase is considered the rate-limiting enzyme in melanin biosynthesis. Meanwhile, the RAS/RAF/MAPK cascade and cAMP-PKA-CREB signaling pathway are involved in the gene regulation of MITF (microphthalmia-associated transcription factor) [2]. MITF, in turn, regulates the expression of tyrosinase, TRP-1, and TRP-2. As a result of a comprehensive understanding of melanin formation, various melanogenesis inhibitors have been found. Some inhibitors do not directly inhibit tyrosinase activity but suppress melanin production by inhibiting the RAS/RAF/MAPK cascade or the cAMP-PKA-CREB signaling pathway [3,4,5]. Furthermore, dopaquinone scavengers or reducing agents can prevent dopachrome and melanin production [6]. Acidic or alkaline substances can non-specifically interfere with melanin synthesis-related enzymes. Recently, a new mechanism was found involving nicotinamide nucleotide transhydrogenase (NNT) mediating redox-dependent pigmentation [7]. Knocking down NNT leads to an increase in melanin content, whereas overexpression of NNT induces a decrease in pigmentation and NADP/NADPH ratios.
The spectrophotometric method can be employed in vitro to assess the inhibition of tyrosinase to evaluate potential melanogenesis inhibitors. Mushroom tyrosinases (EC 1.14.18.1) from Agaricus bisporus, which are copper-containing oxidases and belong to the polyphenol oxidase family, are commonly used for screening tyrosinase inhibitors because of their affordability and high similarity to human tyrosinase [8]. According to enzyme kinetics, tyrosinase inhibition can be classified as competitive, uncompetitive, mixed (competitive/uncompetitive), and noncompetitive inhibition. Well-known tyrosinase inhibitors used in skin-whitening agents for treating hyperpigmentation disorders such as melasma, age spots, and post-inflammatory hyperpigmentation, such as arbutin and kojic acid, exhibit competitive and mixed inhibition, respectively [9,10]. However, these substances have high IC50 (half maximal inhibitory concentration) values (>500 μM) against human tyrosinase [11]. In addition, various tyrosinase inhibitors from natural (bacteria, fungi, and plants), semisynthetic, and synthetic sources have been explored. n-Octyl orsellinate, a derivative of resorcinol used as a disinfectant and an antiseptic, is an uncompetitive inhibitor of tyrosinase, and it was reported to exhibit 54% tyrosinase inhibition at 0.5 mM [12]. Rifampicin, an antibiotic, functions as a noncompetitive inhibitor of tyrosinase with a low IC50 value of 90 μM [13]. Furthermore, a pentapeptide derived from Vigna was found to be non-toxic to cells and had an IC50 value of 0.46 mM [14].
In our previous study, we found that Tibetan kefir grain-fermented milk whey, after 3 and 6 days of fermentation, exhibited antioxidant ability and a significant inhibition of tyrosinase activity and melanin content in B16-F10 cells [15]. The microbial communities of Tibetan kefir grain indicated that Acetobacter, Bacillus, and Lactobacillus were dominant genera. Notably, after 6 days of fermentation, Acetobacter comprised 75% of the bacterial communities. Thus, in this study, our objective was to explore the potential antioxidant capabilities of Acetobacter, as well as its capacity to inhibit tyrosinase activity and suppress melanin synthesis. We isolated Acetobacter from Tibetan kefir grains and identified it using 16S rRNA sequencing and whole-genome analysis. The enzymatic activity of Acetobacter was analyzed using API 20E and API ZYM. The fermentation product of Acetobacter was extracted and assessed for its antioxidant, anti-tyrosinase, and anti-melanin capacities. Moreover, the chemical compounds presented in the fermentation extract were identified by LC-MS/MS. Among the compounds identified, succinic acid and citric acid were found to be the most abundant in the extract, exhibiting significant inhibition of tyrosinase activity and L-DOPA auto-oxidation. Their enzyme kinetics and the effects on tyrosinase and B16-F10 cells were investigated.

2. Materials and Methods

2.1. Acetobacter sp. Isolation and Identification

Acetobacter strains were isolated from Tibetan kefir grain using glucose yeast extract plate media (GY medium) containing 5% glucose, 0.5% yeast extract, and 2% agar [15]. Genomic DNA was extracted from the isolates for 16S rDNA PCR using the long and accurate PCR kit (BBI Co., Ltd., Shanghai, China). The primer set for 16S rDNA included 16S-F27 (AGAGTTTGATCMTGGCTCAG) and 16S-R1492 (TACGGYTACCTTGTTACGACTT). PCR was performed with the following parameters: initial heating at 94 °C for 5 min, denaturing at 94 °C for 30 s, annealing at 55 °C for 30 s, and extension at 72 °C for 90 s, for a total of 30 cycles. DNA sequencing of the PCR product was conducted by Azenta Life Sciences (Suzhou, China). A phylogenetic tree based on the 16S rDNA sequences was constructed using the neighbor-joining method with 500 bootstrap replicates (maximum composite likelihood model), utilizing MEGA-X software [16]. The isolated XM-1 strain was deposited in the China Center for Type Culture Collection (CCTCC) located in Hubei, China, and designated as Acetobacter syzygii CCTCC M 2022983 for this study.

2.2. Enzymatic Activity of A. syzygii CCTCC M 2022983 by API

A. syzygii CCTCC M 2022983 was incubated on a plate at 37 °C for 2 days. Subsequently, the different enzymatic activities of A. syzygii CCTCC M 2022983 were analyzed using API 20E and API ZYM kits (bioMérieux, Marcy l’Etoile, France). The colony was selected and subjected to analysis following the instructions provided in the respective reagent kits. A bacterial suspension was prepared and used to fill the microwells on the API 20E strip, with mineral oil added to specific tubes for anaerobic conditions. After incubating at 36 °C for 18–24 h, color changes in the tubes are observed and recorded, and additional reagents may be added to enhance the reactions. Simultaneously, a 65 µL bacterial suspension was inoculated into the 20 microwells of an API ZYM strip, followed by incubation at 37 °C for 4 to 4.5 h. Subsequently, ZYM A and B were added to develop color reactions and record results based on color intensity.

2.3. Genome Sequencing of A. syzygii CCTCC M 2022983

To analyze the genomic sequencing of A. syzygii CCTCC M 2022983, next-generation sequencing (NGS) was performed. The strain was sent to Azenta Life Sciences (Suzhou, China) for chromosome DNA extraction, library construction, genomic sequencing, and genome de novo analysis. The pair-end sequences from the qualified library were obtained using the NovaSeq (Illumina, San Diego, CA, USA). The sequencing reads were assembled using velvet and gapfilled with SSPACE and GapFiller [17,18,19,20,21]. Coding genes were identified using the Prodigal (version 3.02) (for prokaryotic) gene-finding software [22] and annotated using databases such as National Center for Biotechnology Information (NCBI) NR database, Gene Ontology (GO), Clusters of Orthologous Groups (COG), and Kyoto Encyclopedia of Genes and Genomes (KEGG) [23,24].

2.4. Cultivation and Fermentation Preparation of A. syzygii CCTCC M 2022983

A. syzygii CCTCC M 2022983 was inoculated in GY broth media for 6 days of fermentation. The culture media from the 3rd and 6th days of fermentation were collected, and then extracted using ethyl acetate in a 1:1 volume ratio. These extracts were subsequently concentrated through rotary evaporation and lyophilization to obtain Acetobacter fermentation extract, namely, AFE. The AFE was dissolved in ddH2O and used for various analyses, including antioxidant capacity, anti-tyrosinase activity, anti-melanin ability, and chemical compound identification. Additionally, the GY medium was subjected to extraction using ethyl acetate, followed by rotary evaporation and lyophilization. The extract from the GY medium served as the unfermented yeast (UFY).

2.5. Antioxidant Capacity of AFE and UFY

The 2,2-diphenyl-1-picrylhydrazyl (DPPH) and 2, 2′-azino-bis(3-ethylbenzothiazoline-6-sulfonic acid) (ABTS) radical scavenging assays were used to evaluate the antioxidant ability of UFY (0.3125, 0.625, 1.25, 2.5, and 5 mg/mL) and AFE (at the same concentrations as UFY). For the DPPH assay, the sample (20 μL) was mixed with 180 μL of a DPPH solution (0.25 mM) at room temperature for 10 min in darkness, and the scavenging was measured at 517 nm using a microplate reader (Molecular Devices, Sunnyvale, CA, USA). For the ABTS assay, the T-AOC Assay Kit (ABTS) (Beyotime Biotechnology, Shanghai, China) was used. The sample was mixed with the ABTS working solution at room temperature for 5 min in darkness, and the scavenging was measured at 734 nm using a microplate reader. Distilled water served as the control for calculating the DPPH and ABTS radical scavenging rate of AFE and UFY.

2.6. Anti-Tyrosinase Activity of AFE and UFY

Mushroom tyrosinase (Sigma-Aldrich, St. Louis, MO, USA) was used to evaluate the anti-tyrosinase activity of UFY (0.3125, 0.625, 1.25, 2.5, and 5 mg/mL) and AFE (at the same concentrations as UFY). Then, 50 μL of tyrosinase (400 U/mL), 150 μL of L-DOPA (10 mM), and 100 μL of samples were mixed at room temperature for 5 min. The inhibition rate of tyrosinase activity was determined at 475 nm using a microplate reader. Distilled water served as the control for calculating the anti-tyrosinase activity rate of AFE and UFY.

2.7. Effect of AFE, UFY, Succinic Acid and Citric Acid on Cell Viability

The 3-(4,5-cimethylthiazol-2-yl)-2,5-diphenyl tetrazolium bromide (MTT) assay was employed to assess the impact of AFE, UFY, succinic acid, and citric acid on B16-F10 cell viability. B16-F10 cells are a widely used mouse melanoma cell line for melanin inhibition studies due to their ability to produce melanin, making them an ideal model for investigating melanogenesis mechanisms and screening potential inhibitors. B16-F10 cells were cultured in a 96-well plate and incubated at 37 °C with 5% CO2 for 24 h. Various concentrations of UFY (0.3125 to 5 mg/mL), AFE (at the same concentrations as UFY), succinic acid (0, 0.25, 0.5, 1, 2, 4 mM), and citric acid (at the same concentrations as succinic acid) were added to the cells for 24 h. After incubation, the supernatant was removed, and a medium containing 6 µL of MTT (5 mg/mL) was introduced to the cells. This mixture was then incubated at 37 °C with 5% CO2 for 4 h. Following the incubation, dimethyl sulfoxide (DMSO) was used to dissolve the formazan crystals produced by the cells. The formazan was detected at 570 nm using a microplate reader.

2.8. Melanin Content of B16-F10 Cell

Different concentrations of UFY (0.3125, 0.625, and 1.25 mg/mL), AFE (at the same concentrations as UFY), succinic acid (0, 0.25, 0.5, 1, 2, 4 mM), and citric acid (at the same concentrations as succinic acid) were introduced into the cells and incubated for 1 h. Subsequently, to stimulate the melanin production, α-melanocyte-stimulating hormone (α-MSH) (1 μM) was added to the cells for 48 h incubation. Following the incubation, the cells were harvested, and 200 µL of 1 M NaOH was added. The mixture was then incubated at 60 °C until the melanin particles were completely dissolved. The amount of melanin was quantified at 405 nm by a microplate reader.

2.9. Western Blotting Analysis

After the AFE and UFY treatment, B16-F10 cells were collected and sonicated with a lysis buffer (0.5% glycerol, 1% Triton X-100, 20 mM NaF, 150 mM NaCl, 2 mM Na3VO4, 50 mM Tris-HCl pH 7.4, 0.1 mM bovine serum albumin, and 2 mM PMSF) to obtain total proteins. The total proteins were separated using SDS-PAGE and transferred to a nitrocellulose membrane for Western blotting analysis. Primary antibodies for MITF, TYR, TRP-1, and TRP-2 were diluted at 1:2000, and for β-actin at 1:10,000 (ABclonal, Wuhan, China). A rabbit IgG peroxidase-conjugated secondary antibody diluted at 1:5000 (Jackson ImmunoResearch Inc., West Grove, PA, USA) was conducted. Target proteins were identified using the ECL chemiluminescence reagent (NcmECL Ultra, New Cell & Molecular Biotech Co., Ltd., Suzhou, China). Band intensity of protein expression was assessed using ImageJ 1.53e software.

2.10. Chemical Compound Identification of AFE and UFY

Chemical compound analysis of AFE and UFY was performed using a Vanquish UHPLC System (Thermo Fisher Scientific, Waltham, MA, USA) equipped with an Orbitrap Exploris 120 (Thermo Fisher Scientific) and an ESI ion source. A column, ACQUITY UPLC ® HSS T3 (150 × 2.1 mm, 1.8 μm) (Waters, Milford, MA, USA), maintained at 40 °C was utilized with a flow rate set at 0.25 mL/min. For LC-ESI (+)-MS analysis, the mobile phase consisted of (A) 0.1% formic acid in acetonitrile (v/v) and (B) 0.1% formic acid in water (v/v). The gradient parameters were as follows: 2% A, 0~1 min; 2%~50% A, 1~9 min; 50%~98% A, 9~12 min; 98% A, 12~13.5 min; 98%~2% A, 13.5~14 min; and 2% A, 14~20 min. For LC-ESI (−)-MS analysis, the mobile phase consisted of (C) acetonitrile and (D) ammonium formate (5 mM). The gradient parameters were as follows: 2% C, 0~1 min; 2%~50% C, 1~9 min; 50%~98% C, 9~12 min; 98% C, 12~13.5 min; 98%~2% C, 13.5~14 min; and 2% C, 14~17 min. Simultaneous MS1 and MS/MS (Full MS-ddMS2 mode, data-dependent MS/MS) acquisition were performed. Mass spectrometric parameters included a capillary temperature of 325 °C, MS1 range of m/z 100–1000, MS1 resolving power of 60,000 FWHM, and MS/MS resolving power of 15,000 FWHM. Data were converted to mzXML format using MSConvert of ProteoWizard software package (v3.0.8789) [25]. Feature detection and retention time correction were performed using XCMS [26]. Metabolite identification was based on databases such as HMDB [27], KEGG [24], LMSD [28], MassBank [29], mzclound, and a database built by Azenta Life Sciences (Suzhou, China).

2.11. Enzyme Kinetic Analysis

In the anti-tyrosinase activity assay, different concentrations of succinic acid and citric acid (0 to 4 mM) and L-DOPA (0, 0.125, 0.25, 0.5, 1, and 2 mM) were used. Mushroom tyrosinase (Sigma-Aldrich) with a final unit of 60 U/mL was utilized for enzyme kinetic analysis. Tyrosinase activity was determined at room temperature for 5 min using a microplate reader at 475 nm. The enzymatic velocity was calculated as follows:
[v] = [OD475 (sample) − OD475 (blank)]/3700L × mol−1 × cm−1 × 0.6 cm × time (min).
The Michaelis–Menten analysis, involving the determination of Vmax and Km, was conducted using GraphPad Prism 10 (GraphPad Software, MA, USA). For assessing the Ki value, a mixed model inhibition approach was applied.

2.12. Fluorescence Spectra Analysis

Mushroom tyrosinase (Sigma-Aldrich) with a final unit of 60 U/mL was employed for a fluorescence assay using a microplate reader (Infinite 200Pro, Tecan, Männedorf, Switzerland). Different concentrations of succinic acid and citric acid (0 to 4 mM) were introduced into the mushroom tyrosinase. Fluorescence measurements were conducted within a wavelength range of 310–500 nm, with excitation set at 280 nm. Band widths for both emission and excitation were adjusted to 20 nm and 5 nm, respectively.

2.13. Inhibition of L-DOPA Auto-Oxidation

Different concentrations of succinic acid and citric acid (0 to 4 mM) were mixed with 2.5 mM L-DOPA at 37 °C for 12 h. The auto-oxidation of L-DOPA was detected at 475 nm using a microplate reader. Deionized water was utilized as a control to evaluate the efficacy of succinic acid and citric acid in inhibiting the auto-oxidation of L-DOPA.

2.14. Nucleotide Sequence Accession Number

The genome of A. syzygii CCTCC M 2022983 was deposited in GenBank under accession numbers BioProject PRJNA1014964 and BioSample SAMN37344614.

2.15. Statistical Analysis

Data are presented as mean ± standard deviation. Duncan’s multiple range test was used to compare means at a 95% confidence level. Statistical analyses were performed using IBM SPSS Statistics v20 software (SPSS Inc., Chicago, IL, USA).

3. Results

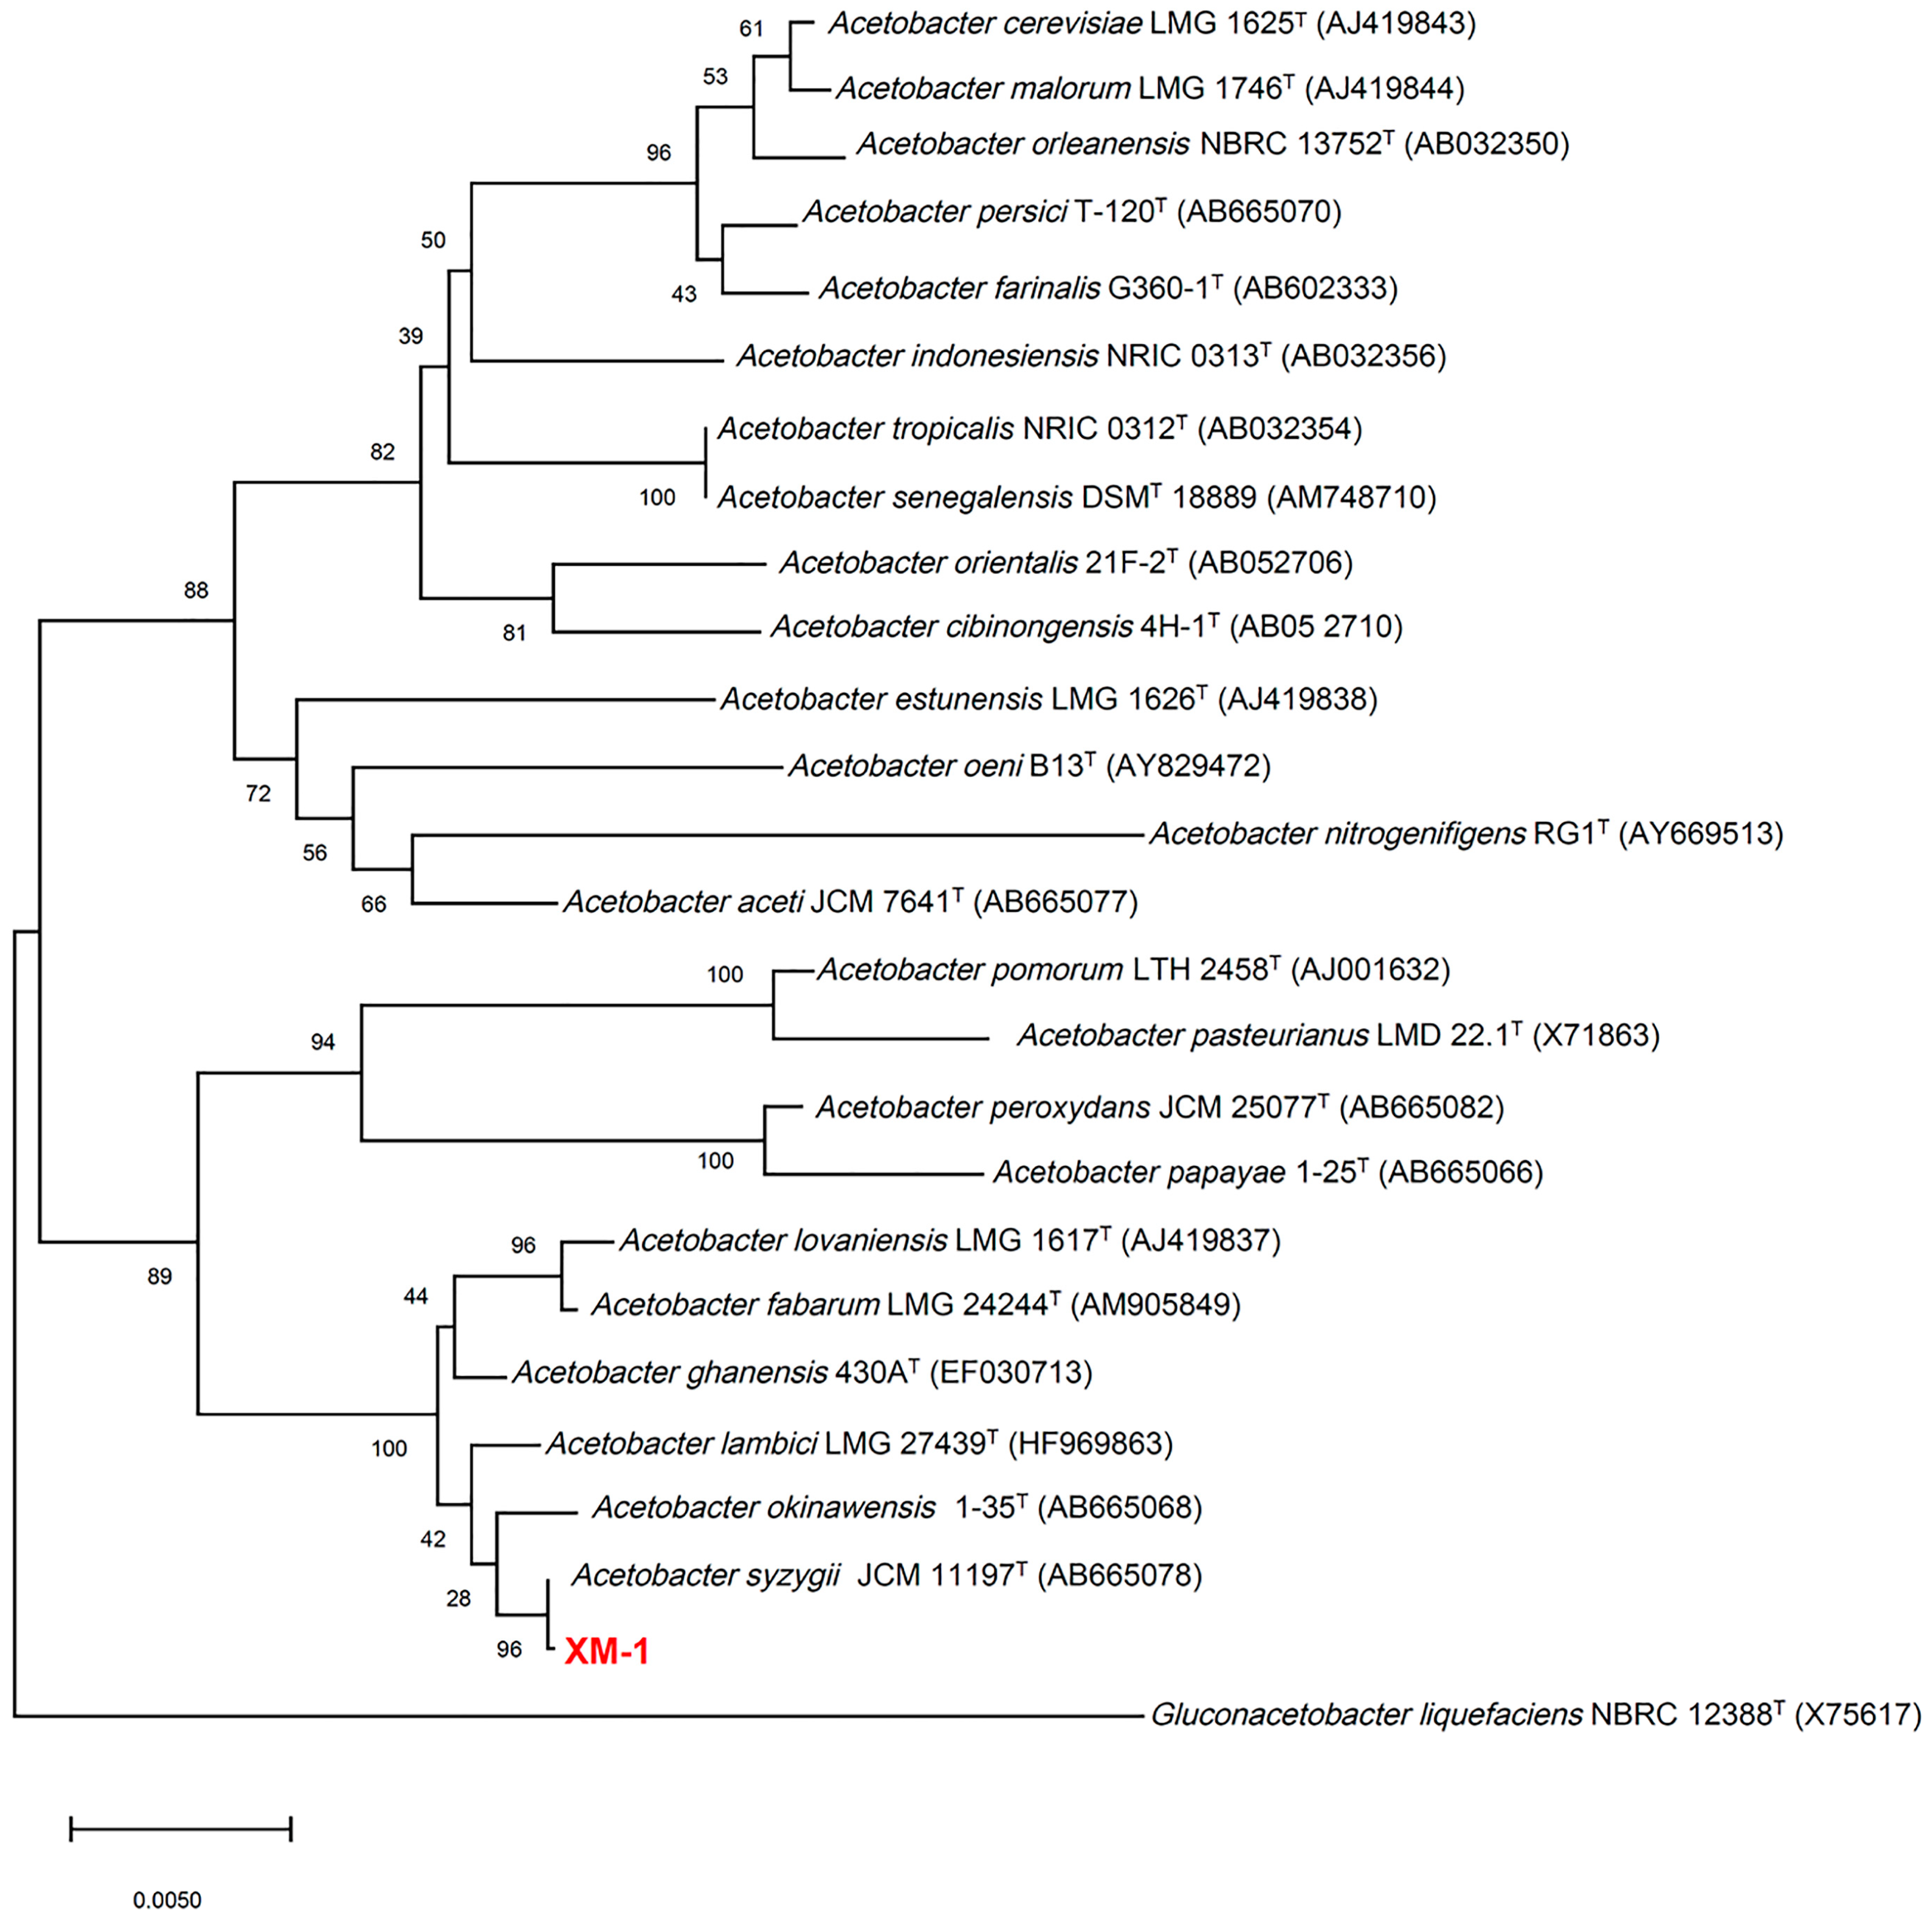
3.1. Identification and Characterization of A. syzygii CCTCC M 2022983

In our previous study, Tibetan kefir grains were found to contain Acetobacter, Lactobacillus, and Bacillus [15]. To isolate the Acetobacter strain, we employed a glucose yeast extract medium. We then analyzed the 16S rDNA sequence of the isolated strain to determine its taxonomic classification. The 16S rDNA sequences were subjected to a BLAST search on the NCBI database, and phylogenetic analysis was conducted to elucidate the bacterial relationship (Figure 1). The results indicated that the isolated strain, XM-1, exhibited 99.93% identity with Acetobacter syzygii NBRC 16604 in the BLAST analysis. The phylogeny of the isolated strain was consistent with its taxonomy, showing a close relationship with A. syzygii JCM 11197 among the 24 type strains of Acetobacter species.
To characterize the metabolism and enzymatic activity of the isolated strain XM-1, we utilized the API 20E and API ZYM tests to assess its carbohydrate hydrolysis and various enzymatic activities (Table S1). The results revealed that the XM-1 strain could decompose sulfur-containing compounds, leading to the production of H2S, and could metabolize acetoin, glucose, melibiose, and arabinose. Several enzymatic activities were detected, including tryptophan deaminase, esterase (C-4 and C-8), leucine aminopeptidase, valine aminopeptidase, acid phosphatase, phosphohydrolase, and N-acetyl-β-glucosaminidase.
The genomic sequencing of the XM-1 strain was conducted using next-generation sequencing technology on the NovaSeq platform, generating 20,904,076 clean reads and 3,123,329,747 clean bases (Table S2). De novo assembly of the sequencing data produced 46 contigs with G+C content of 55.35%. The total genome size was approximately 3.05 Mb, containing 2846 protein-coding genes. Functional annotation of genomic sequences used databases such as NCBI_NR, GO, COG, and KEGG, assigning 2770, 1700, 2134, and 1936 genes, respectively (Figure S1). Notably, 76.14% of genes identified by NCBI_NR exhibited homology with A. syzygii. Regarding pathway analysis, KEGG pathways indicated a significant presence of genes associated with carbohydrate metabolism, amino acid metabolism, and global and overview maps. In the COG classification, the most prevalent categories were general function prediction only, amino acid transport and metabolism, and function unknown. In terms of GO and gene distribution, the majority were related to metabolic process, catalytic activity, and cell part in the biological process, molecular function, and cellular component of GO terms. The isolated strain was deposited in the China Center for Type Culture Collection (located in Wuhan, Hubei, China) and designated as A. syzygii CCTCC M 2022983.

3.2. Antioxidant and Anti-Tyrosinase Capacity of AFE and UFY

As a result of the high antioxidant, anti-tyrosinase, and anti-melanogenic activity observed in the milk whey product (TKG-MW) from the fermentation of Tibetan kefir grain [15], we assessed the Acetobacter fermentation extract (AFE) on the third and sixth days of fermentation for these capacities. Although the unfermented yeast (UFY, GY medium extract) exhibited significant DPPH and ABTS free radical scavenging rates, its antioxidant properties remained intact even after fermentation by A. syzygii CCTCC M 2022983 (Figure 2). When AFE was below 2.5 mg/mL, 3-day AFE (3d-AFE) displayed greater DPPH free radical elimination than UFY and 6-day AFE (6d-AFE). At 0.3125 mg/mL, 3d-AFE achieved an ABTS free radical removal rate exceeding 94%.
To investigate the effect of AFE on tyrosinase activity, we compared different concentrations of UFY, 3d-AFE, and 6d-AFE. Following fermentation by A. syzygii CCTCC M 2022983, 3d- and 6d-AFEs exhibited significant tyrosinase inhibition rates compared with the UFY (Figure 3). Remarkably, tyrosinase inhibition rates exceeded 90% when the concentration of 3d- and 6d-AFEs exceeded 2.5 mg/mL. The IC50 values, calculated using GraphPad Prism, were 0.5415 mg/mL for 3d-AFE and 0.7589 mg/mL for 6d-AFE.

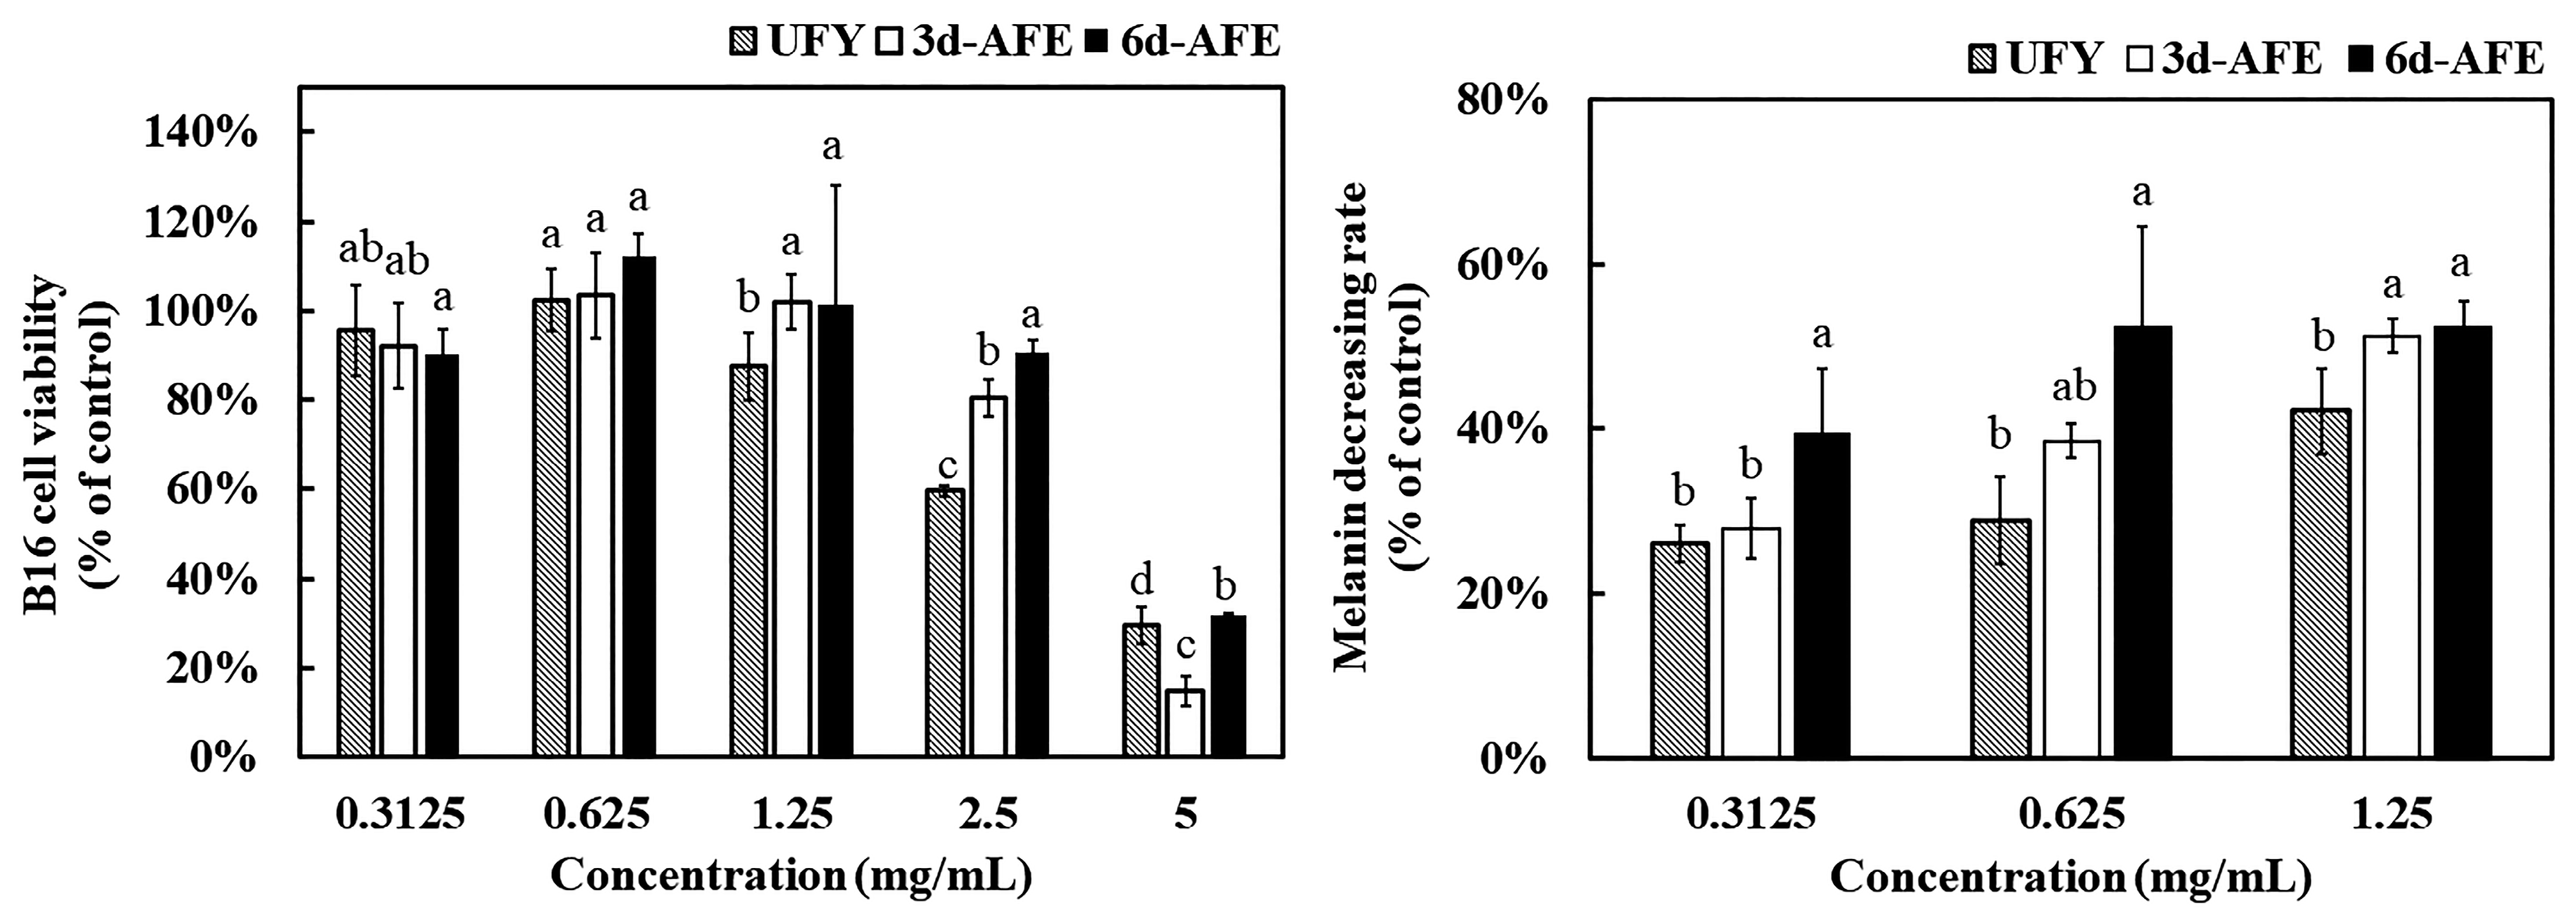
3.3. Melanin Inhibition of AFE and UFY

Before analyzing the impact of AFE on cellular melanin, cell viability was determined. The results indicated that at a concentration of 5 mg/mL, UFY, 3d-AFE, and 6d-AFE significantly reduced B16-F10 cell survival rates (Figure 4). As concentrations decreased, there was a trend of increased cell viability. Specifically, at 2.5 mg/mL, 6d-AFE’s B16-F10 cell survival rate exceeded 90%, higher than that of 3d-AFE and UFY.
Based on the results of the inhibition of tyrosinase activity and the MTT assay, the ability to inhibit melanin production was determined for UFY, 3d-AFE, and 6d-AFE at concentrations of 1.25, 0.625, and 0.3125 mg/mL. It was found that UFY possessed the capability to inhibit melanin, and this inhibitory effect was significantly enhanced after fermentation by A. syzygii CCTCC M 2022983 (Figure 4). At 0.625 mg/mL, melanin inhibition rates by 6d-AFE, 3d-AFE, and UFY were 52.4%, 38.5%, and 28.9%, respectively. As concentration decreased, melanin inhibition capability also decreased.

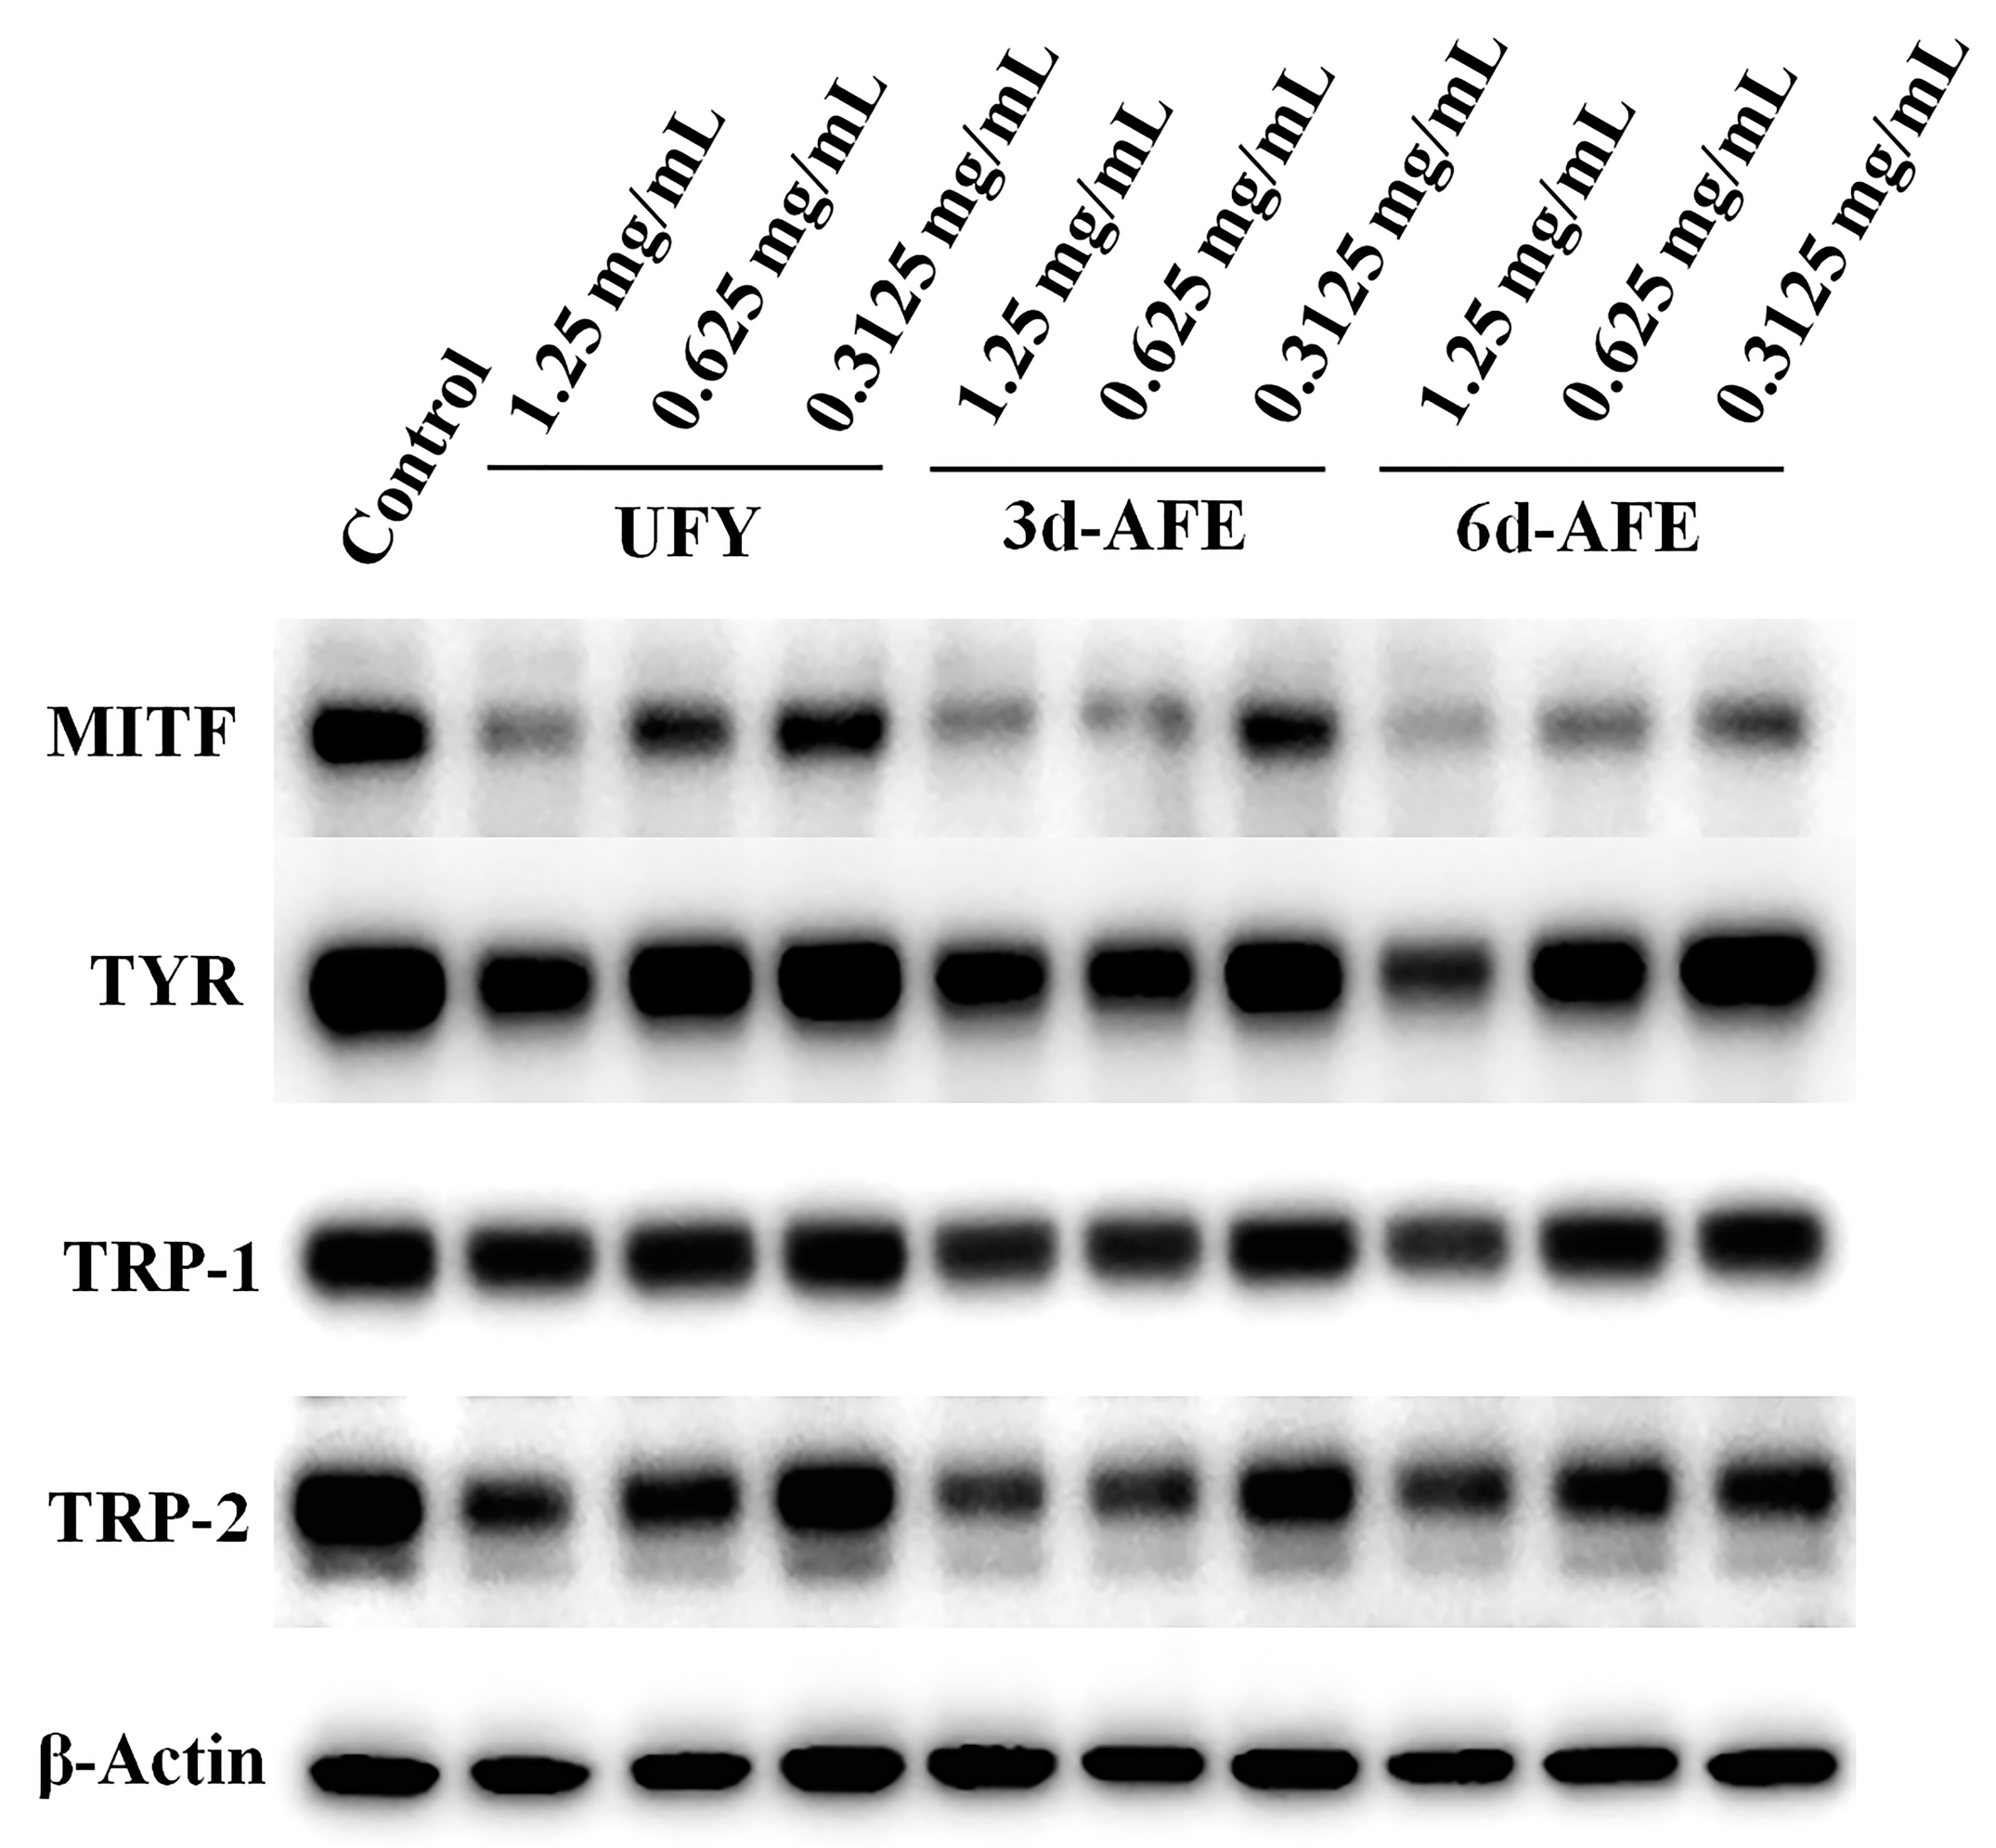
3.4. Western Blotting Analysis of B16-F10 Cells Treated with AFE and UFY

To verify the impact of AFE and UFY on the melanogenesis-related proteins of B16-F10 cells, such as MITF, TYR, TRP-1, and TRP-2, Western blotting analysis was employed. With β-actin serving as an internal reference, the relative intensities of the protein bands were quantified using ImageJ software. The results demonstrated that UFY, 3d-AFE, and 6d-AFE downregulated MITF and TRP-2 protein expression (Figure 5). Additionally, 3d-AFE and 6d-AFE influenced TYR and TRP-1 expression in a dose-dependent manner.

3.5. Chemical Compound Assay of AFE and UFY by LC-MS/MS

To explore which components in AFE were responsible for the reduction in tyrosinase activity to achieve the effect of inhibiting melanin production, UFY, 3d-AFE, and 6d-AFE constituents were analyzed using LC-MS/MS (Figure S2). Table 1 lists the top 16 compounds, and their fragmentation patterns with mass-to-charge ratio (m/z) were compared and validated using the metabolic databases (Figure S3). These compounds were classified into carboxylic acids, organooxygen compounds, and fatty acids, which represented the major components. Notably, succinic acid had the highest content, followed by pipecolic acid and 4-acetylbutyrate. In comparison to the UFY, the production of succinic acid, pipecolic acid, 4-acetylbutyrate, iminoarginine, citric acid, N-acetylleucine, 3-dehydrosphinganine, gluconic acid, L-threo-2-pentulose, N-acetyl-L-phenylalanine, 3-hydroxymethylglutaric acid, and 4-hydroxybenzoic acid increased significantly with a relative ratio greater than 2 after fermentation by A. syzygii CCTCC M 2022983.

3.6. Anti-Tyrosinase Activity of Abundant Compounds in AFE

Given the demonstrated anti-tyrosinase properties of carboxylic acids, several such acids, specifically succinic acid, citric acid, pipecolic acid, and gluconic acid, all abundantly found in AFE, were evaluated for their ability to inhibit tyrosinase activity. The results showed that pipecolic acid, sodium gluconate, and potassium gluconate had weak inhibitory effects on tyrosinase. At concentrations below 4 mM, they did not have an obvious impact on tyrosinase activity. However, the inhibitory effects of succinic acid and citric acid on tyrosinase were significantly more pronounced. The results indicated a tendency for tyrosinase activity to decrease with increasing concentrations of succinic acid and citric acid (Figure 6). Remarkably, a 76.4% and 67.6% inhibition rate of tyrosinase activity was achieved with 4 mM succinic acid and 2 mM citric acid, respectively. The IC50 value for succinic acid and citric acid, calculated using GraphPad Prism, was 2.943 mM and 1.615 mM, respectively.
For a deep understanding of the inhibition type of succinic acid and citric acid, enzymatic kinetic assays were performed using varying concentrations of succinic acid, citric acid, and L-DOPA. The Lineweaver–Burk graph for succinic acid and citric acid is presented in Figure 6. The y-axis intercept (1/V(Δ475/min)) and the x-axis intercept (−1/Km) exhibited variability. According to calculations made using GraphPad Prism, the Vmax and Km values for succinic acid (at concentrations of 1, 2, 3, 3.5, and 4 mM) were as follows, Vmax: 0.478 ± 0.008, 0.449 ± 0.011, 0.332 ± 0.006, 0.263 ± 0.011, and 0.189 ± 0.028; Km: 0.341 ± 0.012, 0.539 ± 0.025, 1.265 ± 0.006, 2.194 ± 0.169, and 2.535 ± 0.615. The Vmax and Km values for citric acid (at concentrations of 1, 1.5, 2, 2.5, and 3 mM) were as follows, Vmax: 0.449 ± 0.008, 0.382 ± 0.004, 0.436 ± 0.012, 0.1573 ± 0.026, and 0.079 ± 0.019; Km: 0.617 ± 0.014, 0.702 ± 0.028, 2.334 ± 0.130, 1.470 ± 0.425, and 1.748 ± 0.801. The inhibition constant (Ki) for succinic acid and citric acid was 1.035 and 0.650 mM, respectively. These results suggested that succinic acid and citric acid acted as a type of mixed inhibitor against mushroom tyrosinase.

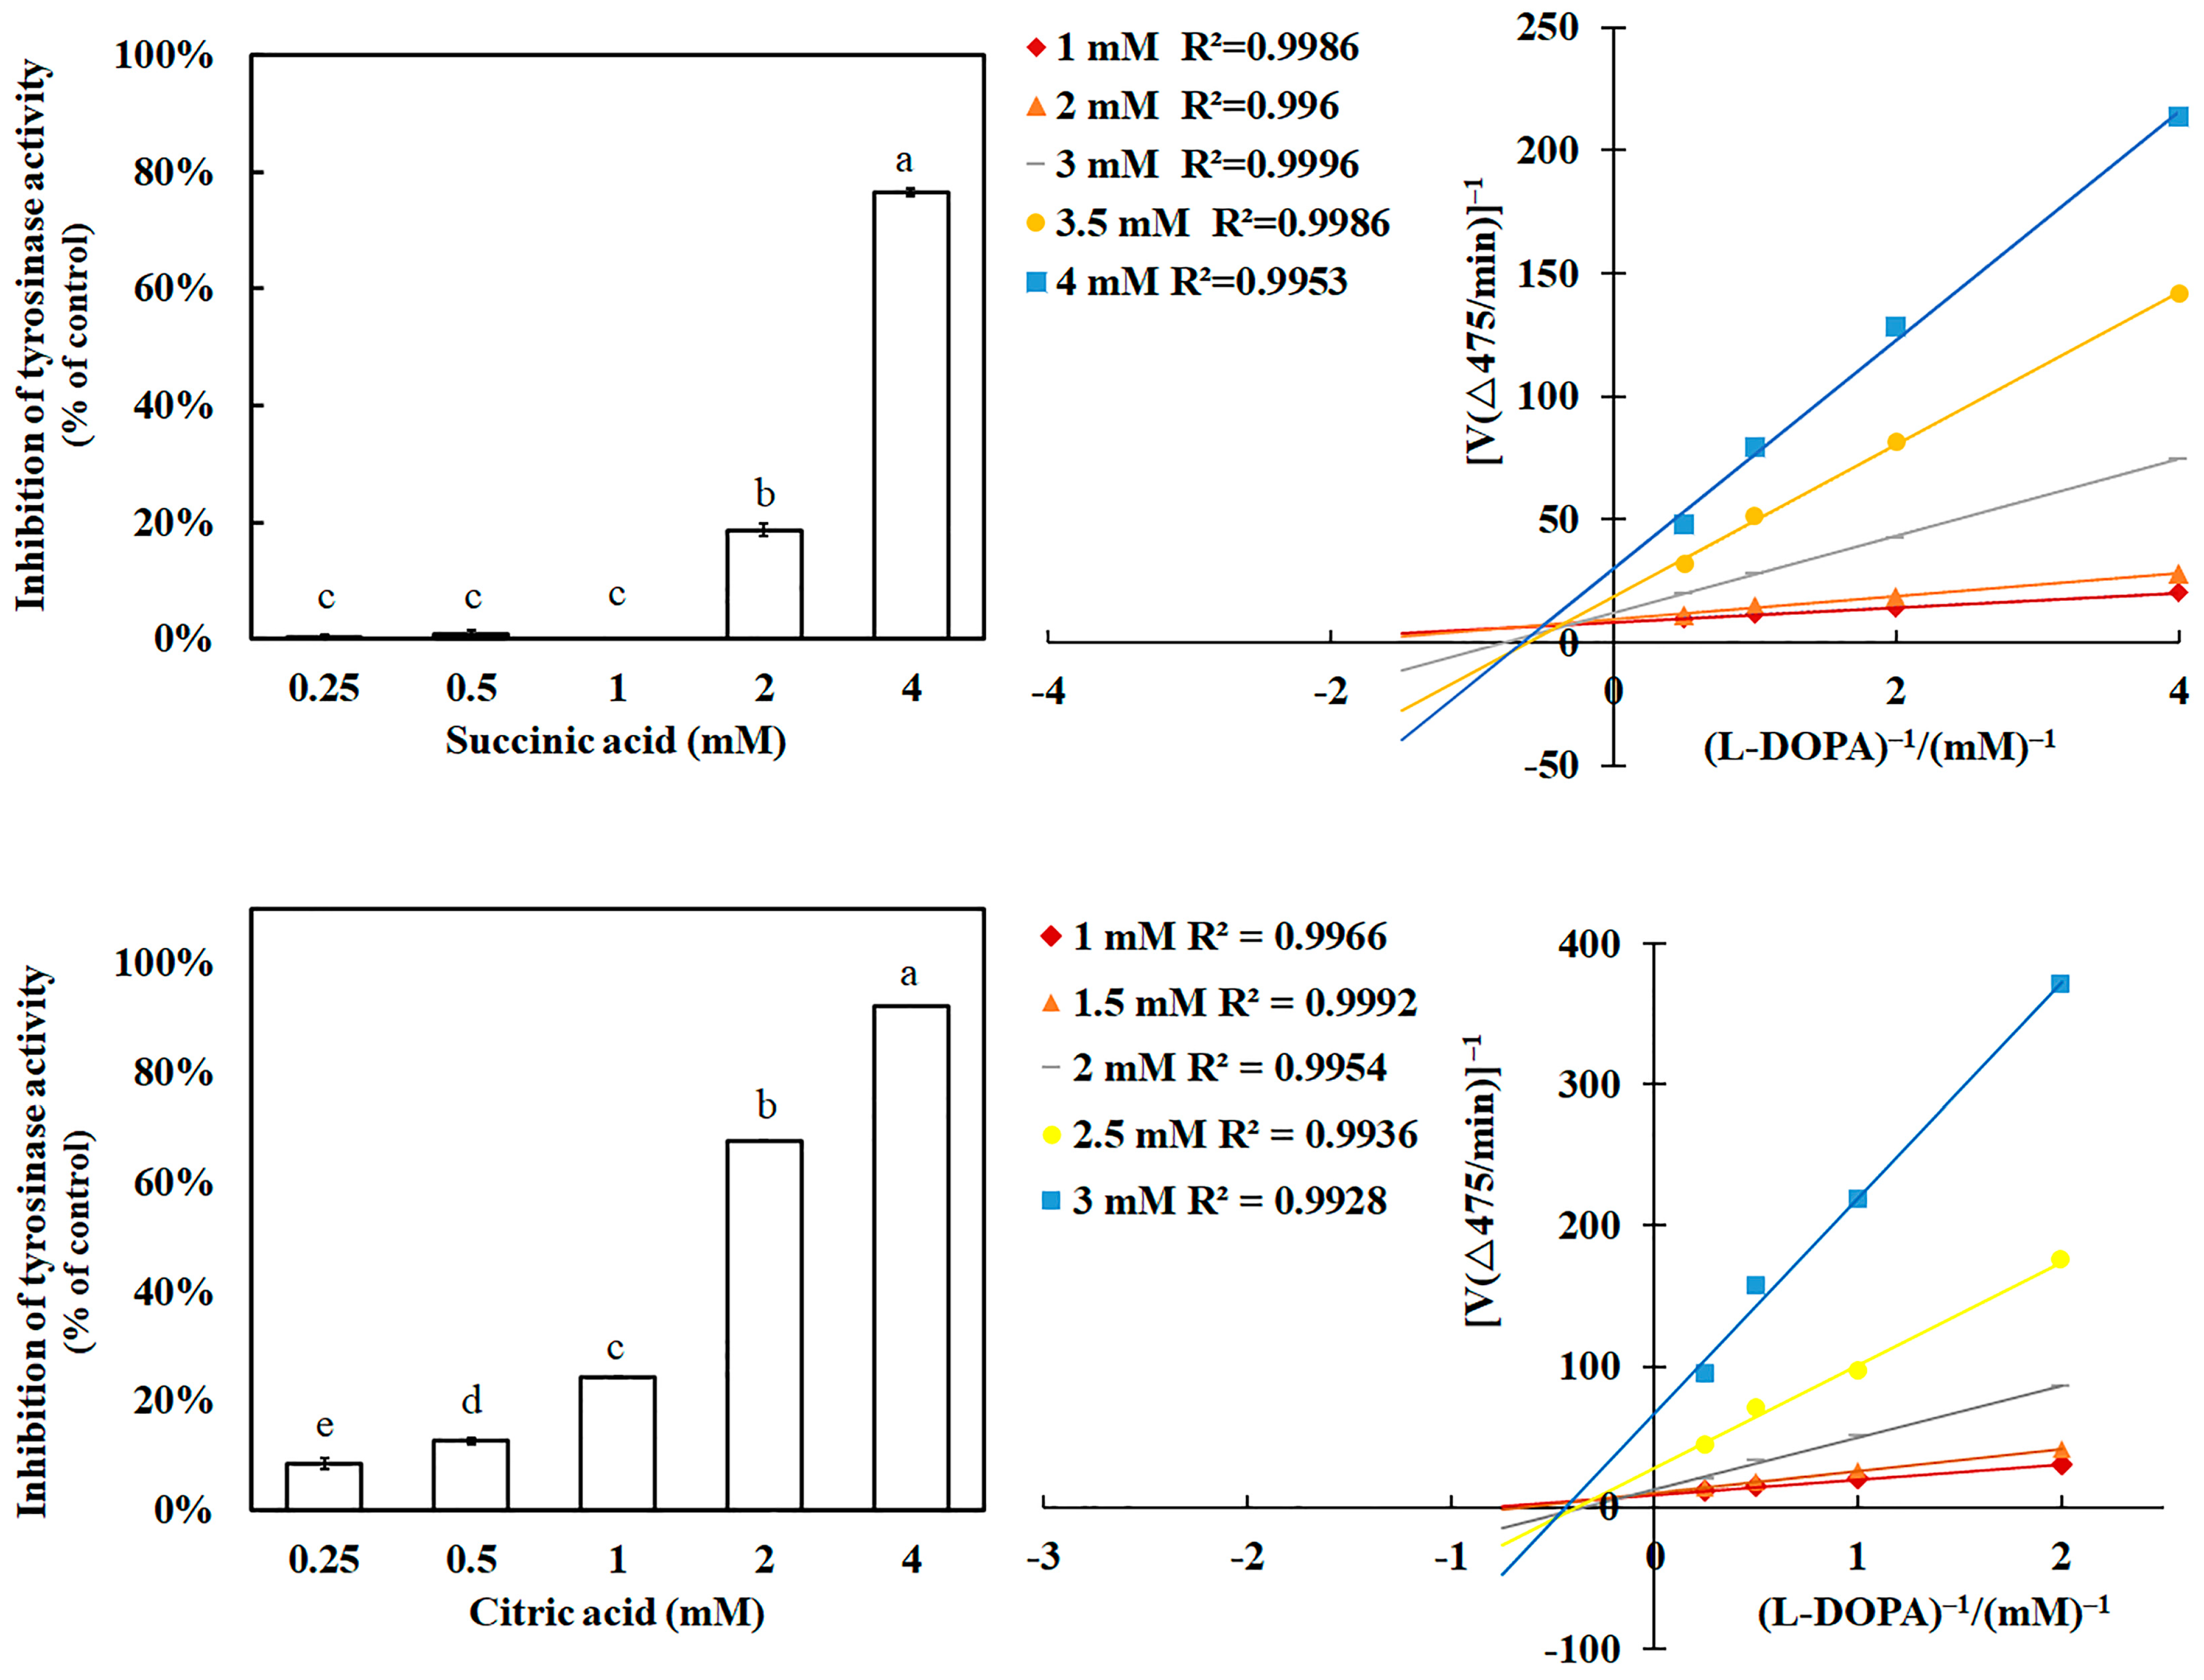
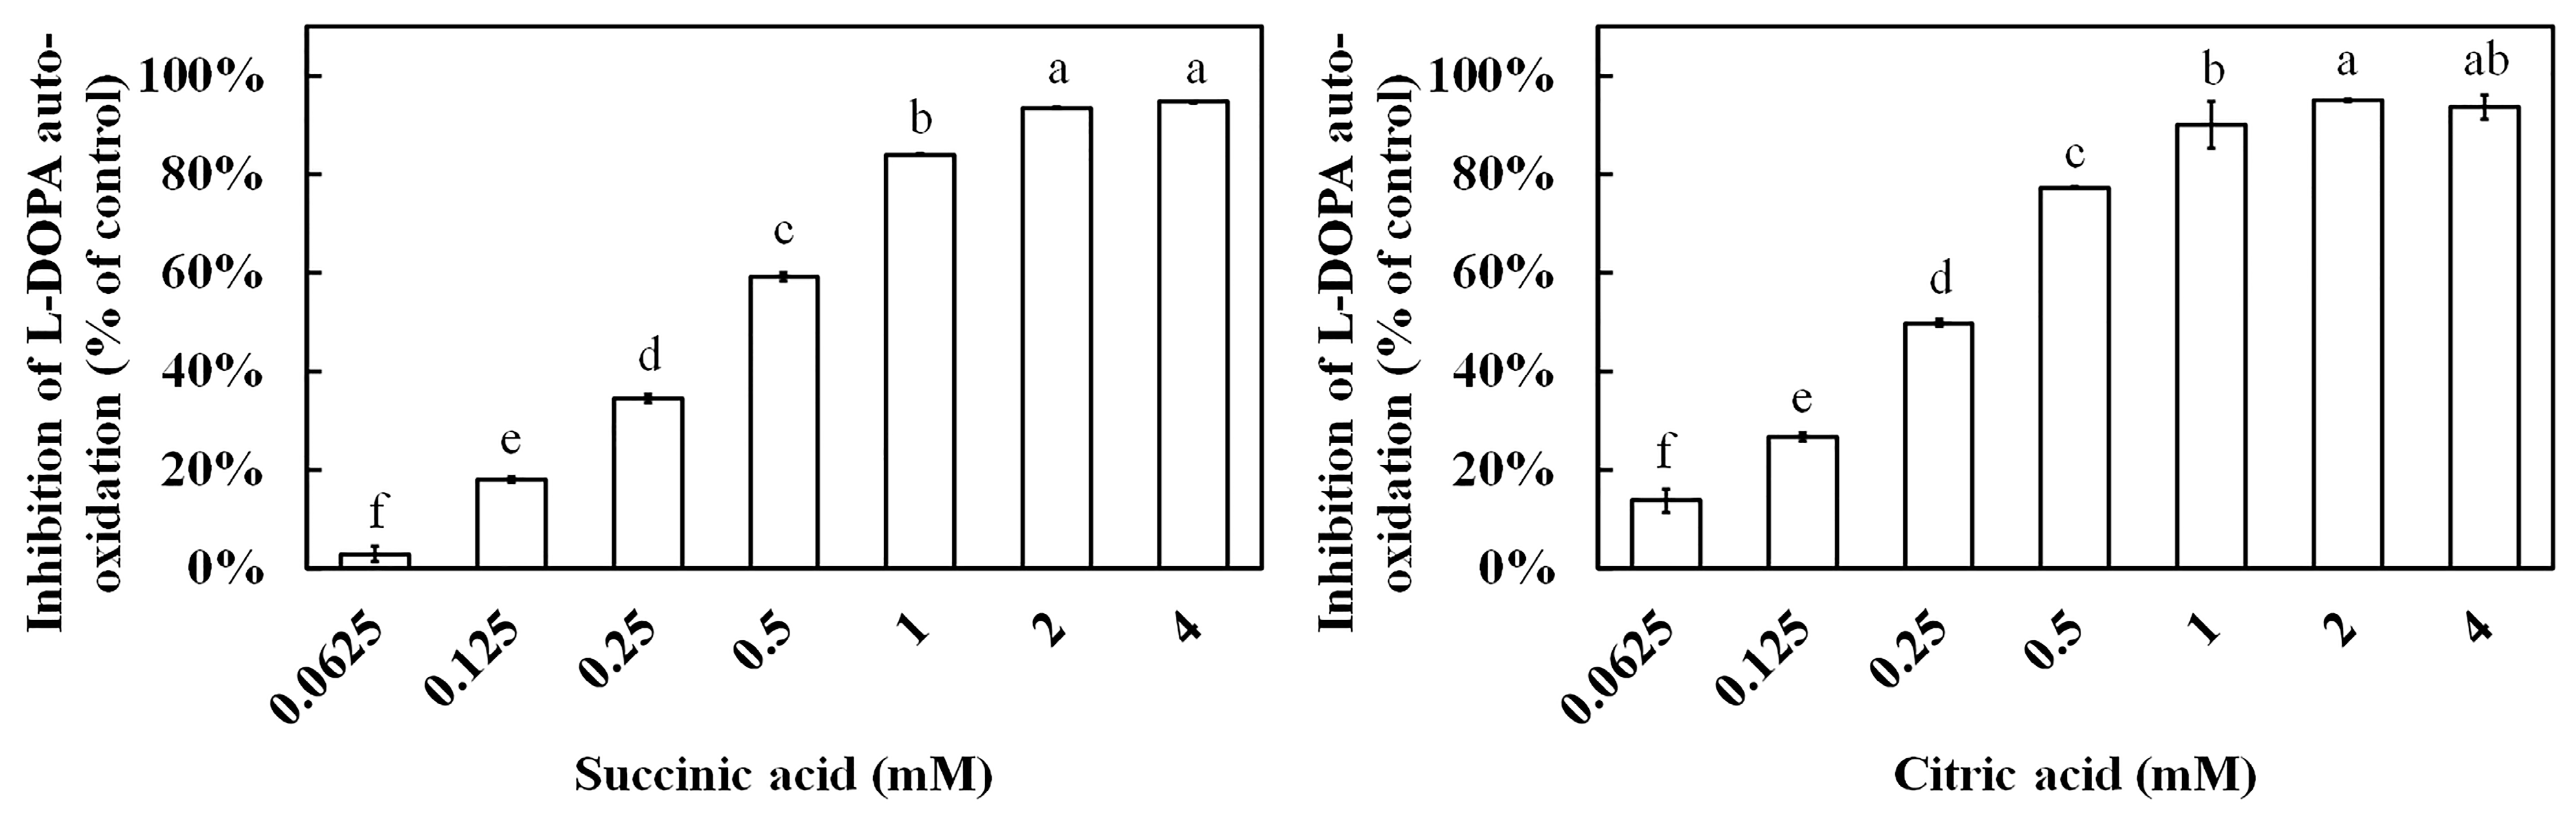
3.7. Effect of Succinic Acid and Citric Acid on Tyrosinase and L-DOPA

Tryptophan, tyrosine, and phenylalanine served as effective fluorescent indicators [30]. The fluctuations in the intrinsic fluorophores were utilized to monitor the conformational change of tyrosinase. To assess the effect of succinic acid and citric acid on tyrosinase, fluorescence spectroscopy was employed. Tyrosinase exhibited strong emission at 338 nm under an excitation of 280 nm (Figure 7). The fluorescence emission intensity of tyrosinase declined with increasing succinic acid and citric acid concentration. Upon the addition of 4 mM succinic acid and citric acid, the fluorescence emission intensity of tyrosinase decreased by 23.8% and 50.6%, respectively, as measured at 338 nm.
To verify the effect of succinic acid and citric acid on L-DOPA, we conducted spectrometry to observe any changes induced by these acids. The results showed that both succinic acid and citric acid effectively prevented L-DOPA auto-oxidation (Figure 8). At concentrations of 2 mM for succinic acid and 1 mM for citric acid, they significantly inhibited the auto-oxidation rate of L-DOPA by more than 90%. As the concentrations of succinic acid and citric acid decreased, the inhibitory effect on L-DOPA auto-oxidation also declined. The IC50 values for succinic acid and citric acid, calculated using GraphPad Prism, were 0.355 mM and 0.261 mM, respectively.

3.8. Anti-Melanin Assay of Succinic Acid and Citric Acid

B16-F10 cells were employed to assess the influence of succinic acid and citric acid on melanin production by initially determining their cell viability. The results showed that the survival rate of B16-F10 cells remained unaffected across different concentrations of succinic acid (0.25–4 mM) and citric acid (0.25–2 mM) (Figure 9). However, at a concentration of 4 mM citric acid, there was a slight decrease in cell survival rate to 87.3%. Subsequent melanin content analysis indicated a decrease in melanin production with increasing concentrations of succinic acid and citric acid. Specifically, the presence of 4 mM succinic acid and citric acid led to significant reductions in melanin production by 33.2% and 28.7%, respectively.

4. Discussion

Numerous studies have been published on the application and fermentation of Acetobacter species, including Acetobacter xylinum, Acetobacter pasteurianus, A. syzygii, and Acetobacter aceti, for the production of levan, vinegar, acetic acid, and gluconic acid [31,32,33,34]. In this study, A. syzygii CCTCC M 2022983 was isolated from Tibetan kefir grain, which contained Acetobacter, Lactobacillus, and Bacillus. These bacteria, through their fermentation process, exhibited significant antioxidant capacity, anti-tyrosinase activity, and anti-melanogenesis effects [15]. A comparison of the genomic sequences of A. syzygii revealed that they had similar G+C contents, and that A. syzygii CCTCC M 2022983 possessed the highest number of protein-coding genes among the published genomes of A. syzygii (Table S2). API 20E and API ZYM tests revealed that A. syzygii CCTCC M 2022983 could metabolize the monosaccharides and disaccharides, such as glucose, arabinose, and melibiose, and it displayed various enzymatic activities. Previous studies have documented the effectiveness of yeast extract in antioxidant capacity and inhibiting melanin production, attributed to its abundant bioactive components [35,36]. Our analysis of UFY (unfermented yeast extract) corroborated these findings, underscoring the presence of these beneficial substances. Although UFY did not lead to a reduction in tyrosinase activity or its protein expression, it can reduce cellular melanin production by decreasing the expression of MITF and TRP-2 proteins (Figure 5). However, the AFE component generated from glucose yeast extract medium after fermentation by A. syzygii CCTCC M 2022983 had a significant improvement in anti-tyrosinase activity and melanin inhibition compared to UFY (Figure 3 and Figure 4).
To confirm which compound in AFE can enhance its efficacy, LC-MS/MS analysis was performed to further identify the chemical compounds in UFY, 3d-AFE, and 6d-AFE. Compared with the UFY, 319 and 313 differentially expressed metabolites were identified in 3d-AFE and 6d-AFE, respectively, with a fold change greater than 1 (Table S3). Notably, the production of 4-hydroxybenzoic acid in 3d-AFE and 6d-AFE was 35.57 and 46.3 times that of the UFY, respectively. 4-Hydroxybenzoic acid, also known as p-hydroxybenzoate, belongs to the class of benzene and substituted derivatives, and can be used in the production of liquid crystal polymers [37]. Moreover, it possesses antioxidant abilities and effectively removes free radicals [38]. Therefore, the antioxidant capacity of 3d- and 6d-AFEs may be attributed to 4-hydroxybenzoic acid.
The AFE was found to contain carboxylic acids and derivatives including succinic acid, pipecolic acid, iminoarginine, citric acid, gluconic acid, 3-hydroxymethylglutaric acid, and 4-hydroxybenzoic acid. The inhibitory effect of carboxylic acids on tyrosinase activity has been demonstrated in previous studies with compounds such as 2-oxo-butanoic acid, 2-oxo-octanoic acid, acrylic acid, propanoic acid, and pyruvic acid [39,40]. Moreover, protein thermodynamics and conformation analysis verified the anti-tyrosinase capacity of citric acid [41]. It is believed that the carboxylate groups of aliphatic carboxylic acids bind to the copper ions at the binuclear site of tyrosinase [39]. Similarly, aromatic carboxylic acids such as benzoic, cinnamic, coumaric, and salicylic acids can suppress tyrosinase activity [42,43,44]. In this study, succinic acid, an aliphatic carboxylic acid, was found to be the most abundant compound in the 3d-AFE and 6d AFE, followed by pipecolic acid, iminoarginine, citric acid, and gluconic acid (Table 1). This result indicated that tyrosinase activity decreased as succinic acid and citric acid concentration increased (Figure 3). However, pipecolic acid, sodium gluconate, and potassium gluconate had no obvious effect on the tyrosinase activity. The study also showed that almost 100% of mushroom tyrosinase activity could be maintained between pH 6 and 7 (Figure S4). As the pH declined, the activity of tyrosinase decreased. This decrease in activity could be attributed to the acidification of succinic acid and citric acid, which is one of the mechanisms for tyrosinase inhibition. Acidification causes the unfolding of tyrosinase and reduces its catalytic activity. It can neutralize the negative charges on tyrosinase, leading to the generation of electrostatic repulsive forces that disrupt the protein structure [45]. In addition to its acidification effect on tyrosinase, the binding effect of succinic acid on tyrosinase gradually increased with succinic acid concentration. Moreover, 2 mM succinic acid and citric acid, with a pH ranging between 6 and 7, still exhibited anti-tyrosinase activity of 18.7% and 67.6%, respectively. When the pH exceeded 5, tyrosinase activity should reach over 50% (Figure S4). However, the 4 mM succinic acid, with a pH of 5.4, retained only 23.5% of its tyrosinase activity. The binding effect of citric acid on tyrosinase was particularly evident at 2 mM concentration. Thus, fluorescence spectroscopy analysis was conducted to further investigate the effect of succinic acid and citric acid on tyrosinase. The intrinsic fluorescence results indicated that succinic acid and citric acid quenched tyrosinase activity, with no obvious shift in the maximal wavelength, and the quenching effect increased with concentration (Figure 7). This finding was consistent with the inhibitory mechanism of salicylic acid, in which acidification and binding effects were dominant in its anti-polyphenol activity [44]. Enzyme kinetic analysis identified succinic acid and citric acid as mixed-type inhibitors of tyrosinase, sharing similarities to terephthalic acid, phthalic acid, and kojic acid [10,46,47].
L-DOPA can also auto-oxidize into dopachrome without the catalysis of tyrosinase. Therefore, to confirm the effect of succinic acid and citric acid on the auto-oxidation of L-DOPA, spectrometry was used for analysis. The results revealed that the IC50 values for succinic acid and citric acid in inhibiting L-DOPA auto-oxidation were found to be lower than those required to inhibit tyrosinase activity (Figure 8). In addition, they also had a much better inhibitory effect on DOPA auto-oxidation than many plant extracts, such as Brucea javanica, Cornus officinalis, Desmodium caudatum, and Pinus densiflora [48]. These findings suggested that both succinic acid and citric acid suppressed melanin production via multiple mechanisms. In addition to exerting an acidification and binding effect on tyrosinase, they also impeded L-DOPA auto-oxidation, thereby contributing to a diminished formation of melanin.
The protein structure of mushroom tyrosinase from A. bisporus (PDB no. 2y9x) was identified in a previous study [49]. Molecular docking analysis was conducted to predict the binding affinity of succinic acid and citric acid to mushroom tyrosinase. The affinity of succinic acid and citric acid to mushroom tyrosinase was −4.6 and −5.3 kcal/mol, respectively, whereas that of β-arbutin was −6.6 kcal/mol according to AutoDock Vina (https://autodock.scripps.edu) (accessed on 2 April 2023) [50]. One hydrogen bond was detected between succinic acid and Tyr78 of tyrosinase, and three hydrogen bonds were recognized between citric acid and Gln74, Tyr78, and Tyr98 of tyrosinase (Figure S5). Moreover, Tyr98 and Phe105 of tyrosinase had close contact with succinic acid. Interestingly, these residues, including Tyr78, Tyr98, and Phe105, provided hydrophobic interactions with other amino acids, stabilizing the association of the H and L subunits. Thus, succinic acid and citric acid could bind to mushroom tyrosinase, disrupting its stabilization and reducing its activity.
To confirm the anti-melanin properties of succinic acid and citric acid, we utilized B16-F10 cells for cell viability and melanin content analyses. Succinic acid and citric acid showed no cell cytotoxicity at concentrations below 4 mM (Figure 9). Nevertheless, when the concentration of citric acid was 4 mM, it had a slight impact on cell survival rate. In addition, the decrease in the melanin content in B16-F10 cells displayed a dose-dependent trend. Monosodium succinic acid demonstrated no toxicity and carcinogenicity in F344 rats with an oral LD50 doe exceeding 8 g/kg body weight [51]. Succinic acid’s safety is unquestionable, making it a potential anti-melanin agent for preventing enzymatic melanogenesis. Although the LD50 of citric acid was relatively low, at 545 mg/kg in mice [52], it has been recognized as an effective melanin inhibitor.

5. Conclusions

A. syzygii CCTCC M 2022983, deposited in the China Center for Type Culture Collection, was successfully isolated and identified from the Tibetan kefir grain. Its fermented milk whey exhibited significant antioxidant capacity, anti-tyrosinase activity, and anti-melanin biosynthesis. The fermentation of A. syzygii CCTCC M 2022983 also displayed free radical scavenging activity (DPPH and ABTS), anti-tyrosinase activity, and anti-melanogenic capacity. Succinic acid and citric acid identified in the AFE were the most abundant compounds and exhibited mixed-type inhibition against mushroom tyrosinase through acidification and binding effects. Computational simulations (molecular docking) suggested that succinic acid and citric acid were located within the association of the H and L subunits of tyrosinase. Furthermore, these acids were capable of inhibiting the auto-oxidation of L-DOPA, thereby preventing the formation of dopachrome and reducing melanin synthesis. Collectively, succinic acid and citric acid, as melanogenesis inhibitors, hold potential applications in the fields of food and medicine. For instance, fresh fruits and vegetables are susceptible to the unappealing effects of enzymatic browning. Melanin inhibitors play a crucial role in maintaining their natural and enticing colors, thus prolonging their marketability and enhancing the consumer’s visual experience. In the field of medicine, the use of melanin inhibitors offers a promising therapeutic approach to ameliorate pigmentation disorders. These agents can effectively modulate melanin production, thereby addressing a variety of conditions characterized by abnormal melanin synthesis or distribution.

Supplementary Materials

The following supporting information can be downloaded at: https://www.mdpi.com/article/10.3390/fermentation10090459/s1, Figure S1: Annotation of genomic sequence of Acetobacter syzygii CCTCC M 2022983 using the databases of (a) NCBI_NR, (b) KEGG, (c) COG, and (d) GO; Figure S2: LC-MS base peak chromatograms of 3d-AFE, 6d-AFE, and UFY in positive ionization and negative ionization modes; Figure S3: The most abundant metabolites of AFE in MS/MS spectra; Figure S4: The pH profile of mushroom tyrosinase activity (Sigma-Aldrich); Figure S5: Molecular docking of (a) succinic acid and (b) citric acid with mushroom tyrosinase (PDB no. 2y9x); Table S1: Phenotypic characteristics of the isolated XM-1 strain using API 20E and API ZYM kits; Table S2: Genome sequence summary of A. syzygii CCTCC M 2022983 and published A. syzygii; Table S3: The differentially expressed metabolites of 3d-AFE and 6d-AFE with fold change > 1 as the criteria.

Author Contributions

Conceptualization, Y.-P.C.; methodology, L.Z., Q.H. and M.X.; software, L.Z. and Y.-P.C.; validation, L.Z., Q.H. and F.-F.C.; formal analysis, L.Z., Q.H., M.X. and F.L.; investigation, L.Z., Q.H. and M.X.; data curation, F.-F.C., F.L. and Y.-P.C.; writing—original draft preparation, Y.-P.C.; writing—review and editing, Y.-P.C.; visualization, L.Z. and Q.H.; supervision, Y.-P.C.; funding acquisition, Y.-P.C. All authors have read and agreed to the published version of the manuscript.

Funding

This research was funded by the General Project of Xiamen Medical College, Xiamen, Fujian, China, grant number K2021-07 and the General Project of Natural Science Foundation of Xiamen, Xiamen, Fujian, China, grant number 3502Z20227224.

Institutional Review Board Statement

Not applicable.

Informed Consent Statement

Not applicable.

Data Availability Statement

Data will be made available on request.

Acknowledgments

We would like to thank to Ding-Li Chou from Bio-Race Biotech Hangzhou Co., Ltd., Hangzhou 311200, Zhejiang, China, for his contribution to this work.

Conflicts of Interest

The authors declare no conflicts of interest.

References

  1. Gunia-Krzyżak, A.; Popiol, J.; Marona, H. Melanogenesis inhibitors: Strategies for searching for and evaluation of active compounds. Curr. Med. Chem. 2016, 23, 3548–3574. [Google Scholar] [CrossRef] [PubMed]
  2. Lin, J.Y.; Fisher, D.E. Melanocyte biology and skin pigmentation. Nature 2007, 445, 843–850. [Google Scholar] [CrossRef]
  3. Naikoo, S.H.; Rashid, H.; Kumar, S.; Archoo, S.; Sheikh, U.A.; Lone, N.A.; Singh, P.P.; Tasduq, S.A. Inhibition of melanogenesis by 3-(1′-methyltetrahydropyridinyl)-2,4-6-trihydroxy acetophenone via suppressing the activity of cAMP response element-binding protein (CREB) and nuclear exclusion of CREB-regulated transcription coactivator 1 (CRTC1). Eur. J. Pharmacol. 2023, 952, 175734. [Google Scholar] [CrossRef] [PubMed]
  4. Kim, D.H.; Shin, D.W.; Lim, B.O. Fermented Aronia melanocarpa inhibits melanogenesis through dual mechanisms of the PI3K/AKT/GSK-3β and PKA/CREB pathways. Molecules 2023, 28, 2981. [Google Scholar] [CrossRef]
  5. Wu, K.C.; Hseu, Y.C.; Shih, Y.C.; Sivakumar, G.; Syu, J.T.; Chen, G.L.; Lu, M.T.; Chu, P.C. Calycosin, a common dietary isoflavonoid, suppresses melanogenesis through the downregulation of PKA/CREB and p38 MAPK signaling pathways. Int. J. Mol. Sci. 2022, 23, 1358. [Google Scholar] [CrossRef] [PubMed]
  6. Chang, T.S. An updated review of tyrosinase inhibitors. Int. J. Mol. Sci. 2009, 10, 2440–2475. [Google Scholar] [CrossRef]
  7. Allouche, J.; Rachmin, I.; Adhikari, K.; Pardo, L.M.; Lee, J.H.; McConnell, A.M.; Kato, S.; Fan, S.; Kawakami, A.; Suita, Y.; et al. NNT mediates redox-dependent pigmentation via a UVB- and MITF-independent mechanism. Cell 2021, 184, 4268–4283.e4220. [Google Scholar] [CrossRef]
  8. Zaidi, K.U.; Ali, A.S.; Ali, S.A. Purification and characterization of melanogenic enzyme tyrosinase from button mushroom. Enzym. Res. 2014, 2014, 120739. [Google Scholar] [CrossRef]
  9. Jin, Y.H.; Lee, S.J.; Chung, M.H.; Park, J.H.; Park, Y.I.; Cho, T.H.; Lee, S.K. Aloesin and arbutin inhibit tyrosinase activity in a synergistic manner via a different action mechanism. Arch. Pharm. Res. 1999, 22, 232–236. [Google Scholar] [CrossRef]
  10. Wang, W.; Yang, L.; Wang, W.; Zhang, J.; Engelhardt, U.H.; Jiang, H. Inhibitory activities of samples on tyrosinases were affected by enzyme species and sample addition methods. Int. J. Mol. Sci. 2023, 24, 6013. [Google Scholar] [CrossRef]
  11. Mann, T.; Gerwat, W.; Batzer, J.; Eggers, K.; Scherner, C.; Wenck, H.; Stäb, F.; Hearing, V.J.; Röhm, K.H.; Kolbe, L. Inhibition of human tyrosinase requires molecular motifs distinctively different from mushroom tyrosinase. J. Investig. Dermatol. 2018, 138, 1601–1608. [Google Scholar] [CrossRef] [PubMed]
  12. Lopes, T.I.B.; Coelho, R.G.; Honda, N.K. Inhibition of mushroom tyrosinase activity by orsellinates. Chem. Pharm. Bull. 2018, 66, 61–64. [Google Scholar] [CrossRef]
  13. Chai, W.M.; Lin, M.Z.; Song, F.J.; Wang, Y.X.; Xu, K.L.; Huang, J.X.; Fu, J.P.; Peng, Y.Y. Rifampicin as a novel tyrosinase inhibitor: Inhibitory activity and mechanism. Int. J. Biol. Macromol. 2017, 102, 425–430. [Google Scholar] [CrossRef]
  14. Shen, Z.; Wang, Y.; Guo, Z.; Tan, T.; Zhang, Y. Novel tyrosinase inhibitory peptide with free radical scavenging ability. J. Enzyme Inhib. Med. Chem. 2019, 34, 1633–1640. [Google Scholar] [CrossRef]
  15. Chen, M.Y.; Wu, H.T.; Chen, F.F.; Wang, Y.T.; Chou, D.L.; Wang, G.H.; Chen, Y.P. Characterization of Tibetan kefir grain-fermented milk whey and its suppression of melanin synthesis. J. Biosci. Bioeng. 2022, 133, 547–554. [Google Scholar] [CrossRef] [PubMed]
  16. Tamura, K.; Stecher, G.; Kumar, S. MEGA11: Molecular Evolutionary Genetics Analysis version 11. Mol. Biol. Evol. 2021, 38, 3022–3027. [Google Scholar] [CrossRef]
  17. Boetzer, M.; Henkel, C.V.; Jansen, H.J.; Butler, D.; Pirovano, W. Scaffolding pre-assembled contigs using SSPACE. Bioinformatics 2011, 27, 578–579. [Google Scholar] [CrossRef] [PubMed]
  18. Boetzer, M.; Pirovano, W. Toward almost closed genomes with GapFiller. Genome Biol. 2012, 13, R56. [Google Scholar] [CrossRef]
  19. Hunt, M.; Newbold, C.; Berriman, M.; Otto, T.D. A comprehensive evaluation of assembly scaffolding tools. Genome Biol. 2014, 15, R42. [Google Scholar] [CrossRef]
  20. Zerbino, D.R.; Birney, E. Velvet: Algorithms for de novo short read assembly using de Bruijn graphs. Genome Res. 2008, 18, 821–829. [Google Scholar] [CrossRef]
  21. Zerbino, D.R.; McEwen, G.K.; Margulies, E.H.; Birney, E. Pebble and rock band: Heuristic resolution of repeats and scaffolding in the velvet short-read de novo assembler. PLoS ONE 2009, 4, e8407. [Google Scholar] [CrossRef] [PubMed]
  22. Delcher, A.L.; Bratke, K.A.; Powers, E.C.; Salzberg, S.L. Identifying bacterial genes and endosymbiont DNA with Glimmer. Bioinformatics 2007, 23, 673–679. [Google Scholar] [CrossRef] [PubMed]
  23. Blake, J.A.; Christie, K.R.; Dolan, M.E.; Drabkin, H.J.; Hill, D.P.; Ni, L.; Sitnikov, D.; Burgess, S.; Buza, T.; Gresham, C.; et al. Gene Ontology Consortium: Going forward. Nucleic Acids Res. 2015, 43, D1049–D1056. [Google Scholar]
  24. Kanehisa, M.; Furumichi, M.; Sato, Y.; Kawashima, M.; Ishiguro-Watanabe, M. KEGG for taxonomy-based analysis of pathways and genomes. Nucleic Acids Res. 2023, 51, D587–D592. [Google Scholar] [CrossRef]
  25. Smith, C.A.; Want, E.J.; O’Maille, G.; Abagyan, R.; Siuzdak, G. XCMS: Processing mass spectrometry data for metabolite profiling using nonlinear peak alignment, matching, and identification. Anal. Chem. 2006, 78, 779–787. [Google Scholar] [CrossRef] [PubMed]
  26. Navarro-Reig, M.; Jaumot, J.; García-Reiriz, A.; Tauler, R. Evaluation of changes induced in rice metabolome by Cd and Cu exposure using LC-MS with XCMS and MCR-ALS data analysis strategies. Anal. Bioanal. Chem. 2015, 407, 8835–8847. [Google Scholar] [CrossRef]
  27. Wishart, D.S.; Guo, A.; Oler, E.; Wang, F.; Anjum, A.; Peters, H.; Dizon, R.; Sayeeda, Z.; Tian, S.; Lee, B.L.; et al. HMDB 5.0: The Human Metabolome Database for 2022. Nucleic Acids Res. 2022, 50, D622–D631. [Google Scholar] [CrossRef]
  28. Sud, M.; Fahy, E.; Cotter, D.; Brown, A.; Dennis, E.A.; Glass, C.K.; Merrill, A.H., Jr.; Murphy, R.C.; Raetz, C.R.; Russell, D.W.; et al. LMSD: LIPID MAPS structure database. Nucleic Acids Res. 2007, 35, D527–D532. [Google Scholar] [CrossRef]
  29. Horai, H.; Arita, M.; Kanaya, S.; Nihei, Y.; Ikeda, T.; Suwa, K.; Ojima, Y.; Tanaka, K.; Tanaka, S.; Aoshima, K.; et al. MassBank: A public repository for sharing mass spectral data for life sciences. J. Mass Spectrom. 2010, 45, 703–714. [Google Scholar] [CrossRef]
  30. Shang, C.; Zhang, Y.; You, X.; Guo, N.; Wang, Y.; Fan, Y.; Liu, W. The effect of 7,8,4′-trihydroxyflavone on tyrosinase activity and conformation: Spectroscopy and docking studies. Lumin. J. Biol. Chem. Lumin. 2018, 33, 681–691. [Google Scholar] [CrossRef]
  31. Sriphochanart, W.; Krusong, W.; Mekkerdchoo, O.; Suwapanich, R.; Sriprom, P.; Tantratian, S. Impact of temperature on gluconic acid production during acetification by Acetobacter aceti. Biotechnol. Appl. Biochem. 2023, 70, 992–1000. [Google Scholar] [CrossRef] [PubMed]
  32. Srikanth, R.; Siddartha, G.; Sundhar Reddy, C.H.; Harish, B.S.; Janaki Ramaiah, M.; Uppuluri, K.B. Antioxidant and anti-inflammatory levan produced from Acetobacter xylinum NCIM2526 and its statistical optimization. Carbohydr. Polym. 2015, 123, 8–16. [Google Scholar] [CrossRef] [PubMed]
  33. Viana, R.O.; Magalhães-Guedes, K.T.; Braga, R.A., Jr.; Dias, D.R.; Schwan, R.F. Fermentation process for production of apple-based kefir vinegar: Microbiological, chemical and sensory analysis. Braz. J. Microbiol. 2017, 48, 592–601. [Google Scholar] [CrossRef] [PubMed]
  34. Wu, X.; Yao, H.; Liu, Q.; Zheng, Z.; Cao, L.; Mu, D.; Wang, H.; Jiang, S.; Li, X. Producing acetic acid of Acetobacter pasteurianus by fermentation characteristics and metabolic flux analysis. Appl. Biochem. Biotechnol. 2018, 186, 217–232. [Google Scholar] [CrossRef] [PubMed]
  35. Lee, W.J.; Rhee, D.Y.; Bang, S.H.; Kim, S.Y.; Won, C.H.; Lee, M.W.; Choi, J.H.; Chang, S.E. The natural yeast extract isolated by ethanol precipitation inhibits melanin synthesis by modulating tyrosinase activity and downregulating melanosome transfer. Biosci. Biotechnol. Biochem. 2015, 79, 1504–1511. [Google Scholar] [CrossRef]
  36. Sardar, T.; Maqbool, M.; Ishtiaq, M.; Mazhar, M.W.; El-Sheikh, M.A.; Casini, R.; Mahmoud, E.A.; Elansary, H.O. Synergistic influence of yeast extract and calcium oxide nanoparticles on the synthesis of bioactive antioxidants and metabolites in Swertia chirata in vitro callus cultures. Molecules 2023, 28, 4607. [Google Scholar] [CrossRef]
  37. Verhoef, S.; Ruijssenaars, H.J.; de Bont, J.A.; Wery, J. Bioproduction of p-hydroxybenzoate from renewable feedstock by solvent-tolerant Pseudomonas putida S12. J. Biotechnol. 2007, 132, 49–56. [Google Scholar] [CrossRef]
  38. Dong, L.M.; Jia, X.C.; Luo, Q.W.; Zhang, Q.; Luo, B.; Liu, W.B.; Zhang, X.; Xu, Q.L.; Tan, J.W. Phenolics from Mikania micrantha and their antioxidant activity. Molecules 2017, 22, 1140. [Google Scholar] [CrossRef]
  39. Gheibi, N.; Saboury, A.A.; Haghbeen, K.; Rajaei, F.; Pahlevan, A.A. Dual effects of aliphatic carboxylic acids on cresolase and catecholase reactions of mushroom tyrosinase. J. Enzym. Inhib. Med. Chem. 2009, 24, 1076–1081. [Google Scholar] [CrossRef]
  40. Yu, L. Inhibitory effects of (S)- and (R)-6-hydroxy-2,5,7,8-tetramethylchroman-2-carboxylic acids on tyrosinase activity. J. Agric. Food Chem. 2003, 51, 2344–2347. [Google Scholar] [CrossRef]
  41. Liu, W.; Zou, L.Q.; Liu, J.P.; Zhang, Z.Q.; Liu, C.M.; Liang, R.H. The effect of citric acid on the activity, thermodynamics and conformation of mushroom polyphenoloxidase. Food Chem. 2013, 140, 289–295. [Google Scholar] [CrossRef] [PubMed]
  42. Sun, Y.; Zhou, L.; Liao, T.; Liu, J.; Yu, K.; Zou, L.; Zhou, W.; Liu, W. Comparing the effect of benzoic acid and cinnamic acid hydroxyl derivatives on polyphenol oxidase: Activity, action mechanism, and molecular docking. J. Sci. Food Agric. 2022, 102, 3771–3780. [Google Scholar] [CrossRef]
  43. Varela, M.T.; Ferrarini, M.; Mercaldi, V.G.; Sufi, B.D.S.; Padovani, G.; Nazato, L.I.S.; Fernandes, J.P.S. Coumaric acid derivatives as tyrosinase inhibitors: Efficacy studies through in silico, in vitro and ex vivo approaches. Bioorg. Chem. 2020, 103, 104108. [Google Scholar] [CrossRef] [PubMed]
  44. Liao, T.; Zhou, L.; Liu, J.; Zou, L.; Dai, T.; Liu, W. Inhibitory mechanism of salicylic acid on polyphenol oxidase: A cooperation between acidification and binding effects. Food Chem. 2021, 348, 129100. [Google Scholar] [CrossRef]
  45. Mccord, J.D.; Kilara, A. Control of enzymatic browning in processed mushrooms (Agaricus bisporus). J. Food Sci. 1983, 48, 1479–1484. [Google Scholar] [CrossRef]
  46. Yin, S.J.; Si, Y.X.; Qian, G.Y. Inhibitory effect of phthalic acid on tyrosinase: The mixed-type inhibition and docking simulations. Enzym. Res. 2011, 2011, 294724. [Google Scholar] [CrossRef] [PubMed]
  47. Yin, S.J.; Si, Y.X.; Chen, Y.F.; Qian, G.Y.; Lü, Z.R.; Oh, S.; Lee, J.; Lee, S.; Yang, J.M.; Lee, D.Y.; et al. Mixed-type inhibition of tyrosinase from Agaricus bisporus by terephthalic acid: Computational simulations and kinetics. Protein J. 2011, 30, 273–280. [Google Scholar] [CrossRef]
  48. Hwang, J.H.; Lee, B.M. Inhibitory effects of plant extracts on tyrosinase, L-DOPA oxidation, and melanin synthesis. J. Toxicol. Environ. Health Part A 2007, 70, 393–407. [Google Scholar] [CrossRef]
  49. Ismaya, W.T.; Rozeboom, H.J.; Weijn, A.; Mes, J.J.; Fusetti, F.; Wichers, H.J.; Dijkstra, B.W. Crystal structure of Agaricus bisporus mushroom tyrosinase: Identity of the tetramer subunits and interaction with tropolone. Biochemistry 2011, 50, 5477–5486. [Google Scholar] [CrossRef]
  50. Trott, O.; Olson, A.J. AutoDock Vina: Improving the speed and accuracy of docking with a new scoring function, efficient optimization, and multithreading. J. Comput. Chem. 2010, 31, 455–461. [Google Scholar] [CrossRef]
  51. Maekawa, A.; Todate, A.; Onodera, H.; Matsushima, Y.; Nagaoka, T.; Shibutani, M.; Ogasawara, H.; Kodama, Y.; Hayashi, Y. Lack of toxicity/carcinogenicity of monosodium succinate in F344 rats. Food Chem. Toxicol. 1990, 28, 235–241. [Google Scholar] [CrossRef] [PubMed]
  52. Saleem, R.; Ahmad, M.; Naz, A.; Siddiqui, H.; Ahmad, S.I.; Faizi, S. Hypotensive and toxicological study of citric acid and other constituents from Tagetes patula roots. Arch. Pharmacal Res. 2004, 27, 1037–1042. [Google Scholar] [CrossRef] [PubMed]
Figure 1. A phylogenetic tree of 16S rDNA sequences from Acetobacter species including the isolated XM-1 strain and various type strains of Acetobacter species. The tree was built using the neighbor-joining method with MEGA-X software, and bootstrap values from 500 replicates are displayed at the nodes.
Fermentation 10 00459 g001
Figure 2. Antioxidant capacity of AFE, and UFY (unfermented yeast extract). Distilled water served as a replacement for these samples to calculate the free radical scavenging rates of DPPH and ABTS. Significance is labeled by the different letters at columns according to Duncan’s test (p < 0.05). Results are presented as mean ± S.D. (n = 3).
Fermentation 10 00459 g002
Figure 3. Anti-tyrosinase activity assay of AFE and UFY (unfermented yeast extract). Distilled water served as a replacement for these samples to calculate the tyrosinase inhibition rate. Significance is labeled by the different letters at columns according to Duncan’s test (p < 0.05). Results are presented as mean ± S.D. (n = 3).
Fermentation 10 00459 g003
Figure 4. Effect of AFE and UFY (unfermented yeast extract) on the viability and melanin content of B16-F10 cells. Distilled water served as a control to compare the treatment of AFE and UFY. Significance is labeled by the different letters at columns according to Duncan’s test (p < 0.05). Results are presented as mean ± S.D. (n = 3).
Fermentation 10 00459 g004
Figure 5. Western blotting assay of B16-F10 cells treated with different concentrations of AFE and UFY (unfermented yeast extract). Distilled water served as a control to compare the treatment of AFE and UFY.
Fermentation 10 00459 g005
Figure 6. Anti-tyrosinase activity of succinic acid and citric acid, and Lineweaver–Burk graph on tyrosinase of succinic acid and citric acid. Different concentrations of succinic acid and citric acid were used for enzymatic kinetic analysis. Kinetic parameters including Vmax, Km, and Ki were calculated using GraphPad Prism. Significance is labeled by the different letters at columns according to Duncan’s test (p < 0.05).
Fermentation 10 00459 g006
Figure 7. Fluorescence spectrum of tyrosinase treated by different concentrations of (a) succinic acid (0, 2, and 4 mM) and (b) citric acid (0, 1, 2, and 4 mM) by a microplate reader.
Fermentation 10 00459 g007
Figure 8. Inhibition of L-DOPA auto-oxidation by using different concentrations of succinic acid and citric acid. Distilled water served as a control to compare the treatment of succinic acid and citric acid. Significance is labeled by the different letters at columns according to Duncan’s test (p < 0.05). Results are presented as mean ± S.D. (n = 3).
Fermentation 10 00459 g008
Figure 9. Effect of succinic acid and citric acid on the viability and melanin content of B16-F10 cells. Distilled water served as a control to compare the treatment of succinic acid and citric acid. Significance is labeled by the different letters at columns according to Duncan’s test (p < 0.05). Results are presented as mean ± S.D. (n = 3).
Fermentation 10 00459 g009
Table 1. The most abundant compounds of AFE identified by LC-MS/MS.
CompoundsmzRetention Time (s)Relative AbundanceRelative Ratio
UFY3d *6d *3d/UFY6d/UFY
Succinic acid118.03142.29.46 × 108 ± 2.74 × 1084.72 × 1010 ± 3.44 × 1094.26 × 1010 ± 7.48 × 10949.8845.05
Pipecolic acid129.08151.35.83 × 109 ± 3.11 × 1083.68 × 1010 ± 5.09 × 1093.36 × 1010 ± 3.82 × 1096.315.77
4-Acetylbutyrate130.063174.10 × 108 ± 6.07 × 1073.13 × 1010 ± 8.88 × 1082.51 × 1010 ± 1.09 × 10976.3961.22
Iminoarginine172.10344.89.47 × 109 ± 1.15 × 1092.78 × 1010 ± 1.09 × 1092.42 × 1010 ± 1.08 × 1092.942.55
Citric acid192.0368.45.92 × 109 ± 1.11 × 1082.46 × 1010 ± 9.11 × 1082.42 × 1010 ± 5.92 × 1084.164.08
N-Acetylleucine173.11494.61.64 × 109 ± 3.17 × 1071.31 × 1010 ± 2.46 × 1081.25 × 1010 ± 5.93 × 1087.997.62
Isopentenyl adenosine335.16512.31.33 × 1010 ± 1.37 × 1091.04 × 1010 ± 6.76 × 1081.03 × 1010 ± 3.01 × 1080.780.77
3-Dehydrosphinganine299.28779.91.23 × 106 ± 3.90 × 1052.23 × 1010 ± 4.67 × 1099.18 × 109 ± 3.49 × 10918,100.097437.96
Gluconic acid196.06115.74.40 × 106 ± 7.49 × 1059.09 × 109 ± 1.82 × 1091.20 × 1010 ± 3.85 × 1092064.512732.81
Geranyl diphosphate314.07197.32.75 × 1010 ± 7.82 × 1091.00 × 1010 ± 6.24 × 1089.20 × 109 ± 7.79 × 1080.360.33
L-Threo-2-pentulose150.05115.44.85 × 107 ± 9.01 × 1058.04 × 109 ± 3.61 × 1098.65 × 109 ± 3.34 × 109165.73178.36
N-Acetyl-L-phenylalanine207.09522.89.67 × 108 ± 2.98 × 1078.21 × 109 ± 4.91 × 1077.72 × 109 ± 2.72 × 1088.507.99
6-Hydroxyhexanoic acid132.08278.84.63 × 109 ± 1.94 × 1088.14 × 109 ± 3.07 × 1099.17 × 109 ± 2.93 × 1091.761.98
3-Hydroxymethylglutaric acid162.05142.98.63 × 108 ± 3.58 × 1077.60 × 109 ± 4.46 × 1087.47 × 109 ± 5.07 × 1088.818.65
D-Mannose180.0688.24.28 × 1010 ± 1.06 × 10106.42 × 109 ± 1.12 × 1097.38 × 109 ± 1.26 × 1090.150.17
4-Hydroxybenzoic acid138.03279.61.54 × 108 ± 1.28 × 1085.47 × 109 ± 4.32 × 1097.12 × 109 ± 3.71 × 10935.5746.30
* UFY indicates the unfermented yeast extract medium. 3d and 6d indicate AFE after 3- and 6-days fermentation, respectively.
Disclaimer/Publisher’s Note: The statements, opinions and data contained in all publications are solely those of the individual author(s) and contributor(s) and not of MDPI and/or the editor(s). MDPI and/or the editor(s) disclaim responsibility for any injury to people or property resulting from any ideas, methods, instructions or products referred to in the content.

